tata chemicals limited regd. office: bombay house, … · in crore) particulars as at 31st march,...
TRANSCRIPT
(` in crore)
Particulars Quarter
ended 31st
March, 2016
Quarter ended
31st December,
2015
Quarter
ended 31st
March, 2015
Year ended
31st March,
2016
Year ended
31st March,
2015
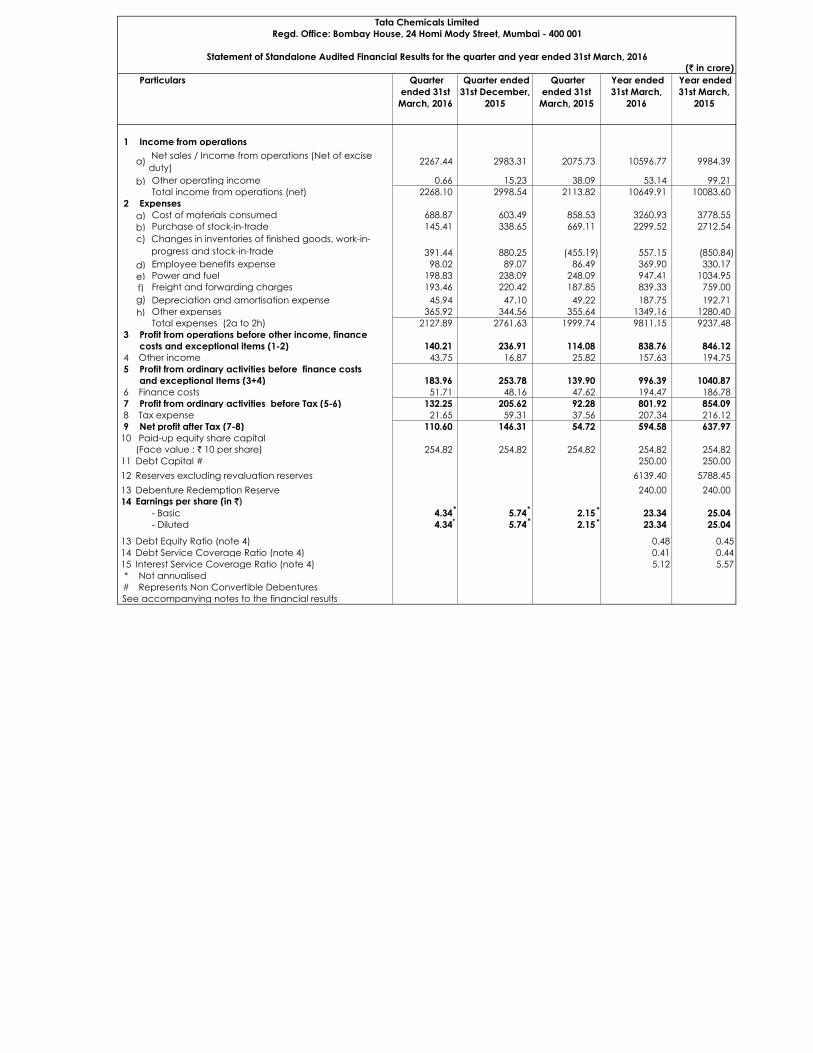
1 Income from operations
a) Net sales / Income from operations (Net of excise
duty) 2267.44 2983.31 2075.73 10596.77 9984.39
b) Other operating income 0.66 15.23 38.09 53.14 99.21
Total income from operations (net) 2268.10 2998.54 2113.82 10649.91 10083.60
2 Expenses
a) Cost of materials consumed 688.87 603.49 858.53 3260.93 3778.55
b) Purchase of stock-in-trade 145.41 338.65 669.11 2299.52 2712.54
c) Changes in inventories of finished goods, work-in-
progress and stock-in-trade 391.44 880.25 (455.19) 557.15 (850.84)
d) Employee benefits expense 98.02 89.07 86.49 369.90 330.17
e) Power and fuel 198.83 238.09 248.09 947.41 1034.95
f) Freight and forwarding charges 193.46 220.42 187.85 839.33 759.00
g) Depreciation and amortisation expense 45.94 47.10 49.22 187.75 192.71
h) Other expenses 365.92 344.56 355.64 1349.16 1280.40
Total expenses (2a to 2h) 2127.89 2761.63 1999.74 9811.15 9237.48
3 Profit from operations before other income, finance
costs and exceptional items (1-2) 140.21 236.91 114.08 838.76 846.12
4 Other income 43.75 16.87 25.82 157.63 194.75
5 Profit from ordinary activities before finance costs
and exceptional Items (3+4) 183.96 253.78 139.90 996.39 1040.87
6 Finance costs 51.71 48.16 47.62 194.47 186.78
7 Profit from ordinary activities before Tax (5-6) 132.25 205.62 92.28 801.92 854.09
8 Tax expense 21.65 59.31 37.56 207.34 216.12
9 Net profit after Tax (7-8) 110.60 146.31 54.72 594.58 637.97
10 Paid-up equity share capital
(Face value : ` 10 per share) 254.82 254.82 254.82 254.82 254.82
11 Debt Capital # 250.00 250.00
12 Reserves excluding revaluation reserves 6139.40 5788.45
13 Debenture Redemption Reserve 240.00 240.00
14 Earnings per share (in `)
- Basic 4.34 5.74 2.15 23.34 25.04
- Diluted 4.34 5.74 2.15 23.34 25.04
13 Debt Equity Ratio (note 4) 0.48 0.45
14 Debt Service Coverage Ratio (note 4) 0.41 0.44
15 Interest Service Coverage Ratio (note 4) 5.12 5.57
* Not annualised
# Represents Non Convertible Debentures
See accompanying notes to the financial results
Statement of Standalone Audited Financial Results for the quarter and year ended 31st March, 2016
Tata Chemicals Limited
Regd. Office: Bombay House, 24 Homi Mody Street, Mumbai - 400 001
*
*
* *
* *
(` in crore)
Particulars Quarter ended
31st March, 2016
Quarter ended
31st December,
2015
Quarter
ended 31st
March, 2015
Year ended
31st March,
2016
Year ended
31st March,
2015
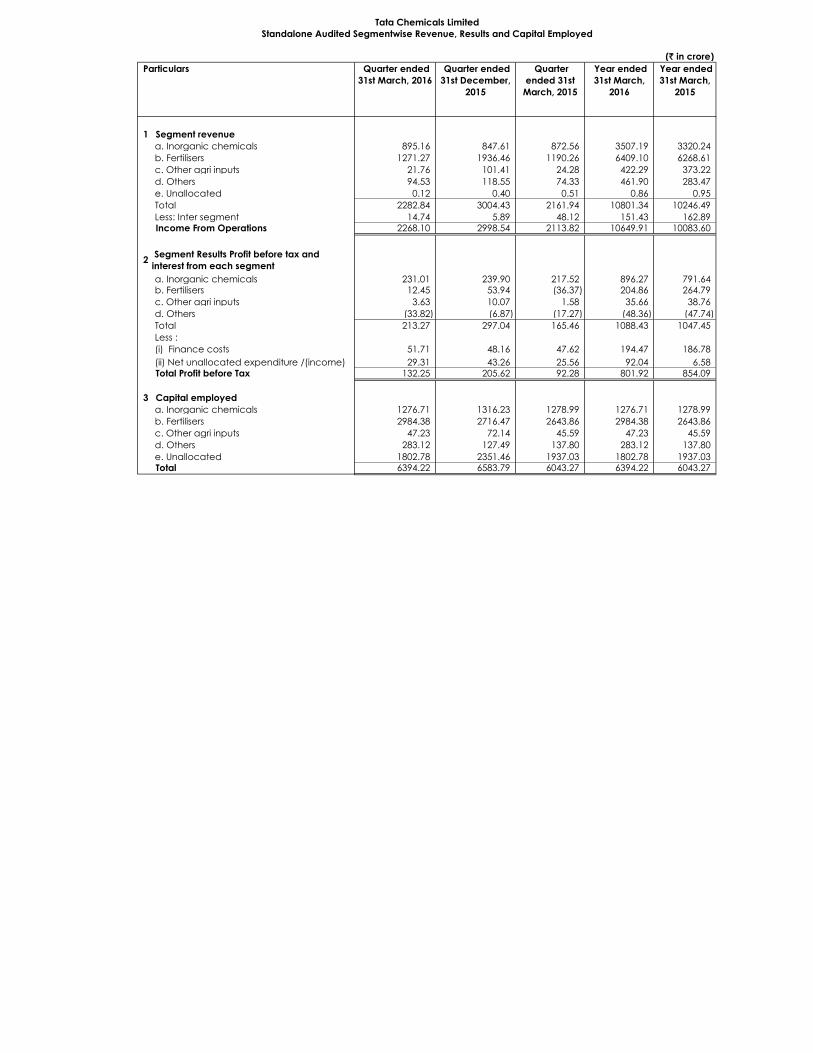
1 Segment revenue
a. Inorganic chemicals 895.16 847.61 872.56 3507.19 3320.24
b. Fertilisers 1271.27 1936.46 1190.26 6409.10 6268.61
c. Other agri inputs 21.76 101.41 24.28 422.29 373.22
d. Others 94.53 118.55 74.33 461.90 283.47
e. Unallocated 0.12 0.40 0.51 0.86 0.95
Total 2282.84 3004.43 2161.94 10801.34 10246.49
Less: Inter segment 14.74 5.89 48.12 151.43 162.89Income From Operations 2268.10 2998.54 2113.82 10649.91 10083.60
2 Segment Results Profit before tax and
interest from each segment
a. Inorganic chemicals 231.01 239.90 217.52 896.27 791.64b. Fertilisers 12.45 53.94 (36.37) 204.86 264.79
c. Other agri inputs 3.63 10.07 1.58 35.66 38.76
d. Others (33.82) (6.87) (17.27) (48.36) (47.74)
Total 213.27 297.04 165.46 1088.43 1047.45
Less :
(i) Finance costs 51.71 48.16 47.62 194.47 186.78
(ii) Net unallocated expenditure /(income) 29.31 43.26 25.56 92.04 6.58Total Profit before Tax 132.25 205.62 92.28 801.92 854.09
3 Capital employed
a. Inorganic chemicals 1276.71 1316.23 1278.99 1276.71 1278.99
b. Fertilisers 2984.38 2716.47 2643.86 2984.38 2643.86
c. Other agri inputs 47.23 72.14 45.59 47.23 45.59
d. Others 283.12 127.49 137.80 283.12 137.80
e. Unallocated 1802.78 2351.46 1937.03 1802.78 1937.03Total 6394.22 6583.79 6043.27 6394.22 6043.27
Tata Chemicals Limited
Standalone Audited Segmentwise Revenue, Results and Capital Employed

(` in crore)
Particulars As at 31st
March,
2016
As at 31st
March, 2015
A EQUITY AND LIABILITIES
1 Shareholder's funds
(a) Share capital 254.82 254.82
(b) Reserves and surplus 6139.40 5788.45
Shareholder's funds 6394.22 6043.27
2 Non-current liabilities
(a) Long-term borrowings 1419.83 1739.40
(b) Deferred tax liabilities (net) 165.73 191.23
(c) Other long term liabilities 0.41 1.67(d) Long-term provisions 93.87 78.65
Non-current liabilities 1679.84 2010.95
3 Current liabilities
(a) Short-term borrowings 1297.73 976.46
(b) Trade payables 888.49 1858.36
(c) Other current liabilities 763.93 373.23
(d) Short-term provisions 536.68 616.71
Current liabilities 3486.83 3824.76
Total 11560.89 11878.98
B ASSETS
1 Non-current assets
(a) Fixed assets (including capital work-in-progress
and intangible assets under development) 2020.85 1964.22
(b) Non-current investments 4434.87 4363.85
(c) Long-term loans and advance 423.56 426.18
(d) Other non-current assets 6.66 13.09
Non-current assets 6885.94 6767.34
2 Current assets
(a) Inventories 1095.43 1809.03
(b) Trade receivables 2552.88 2486.32
(c) Cash and Bank Balance 600.48 574.30
(d) Short-term loans and advances 354.76 168.87
(e) Other current assets 71.40 73.12
Current assets 4674.95 5111.64
Total 11560.89 11878.98
Tata Chemicals Limited
Standalone Audited Statement of Assets and Liabilities

NOTES TO STANDALONE RESULTS:
1. The above results were reviewed by the Audit Committee and approved by the Board of
Directors at its meeting held on 26th May, 2016 and the same have been audited by the
Statutory Auditors.
2. The Board of Directors has recommended a dividend of 100% (previous year 125 % including
special dividend of 25%) for the financial year 2015-16 amounting to ` 10 per share (previous
year ` 12.50 per share), which would result in a payout of ` 301.67 crore (previous year `
382.02 crore) including dividend tax (net).
3. The figures for three months ended 31st March, 2016 and 31st March, 2015 are the
balancing figures between audited figures in respect of the full financial year and the
published year to date figures upto the nine months of the relevant financial year.
4. Formula used for calculation of Ratios:
a) Debt Equity Ratio = Debt / Equity
(Debt: Long-term borrowings + Current maturities of long term borrowings + Short-
term borrowings)
(Equity: Shareholders’ Funds)
b) Debt Service Coverage Ratio = Profit before Interest and Tax / (Interest + Principal
repayments)
c) Interest Service Coverage Ratio = Profit before Interest and Tax / Interest
5. The previous period figures have been regrouped / rearranged wherever necessary.
In terms of our report attached
For DELOITTE HASKINS & SELLS LLP TATA CHEMICALS LIMITED
Chartered Accountants
CYRUS P. MISTRY
Sanjiv V. Pilgaonkar CHAIRMAN
Partner
Place: Mumbai
Date: 26th May, 2016