task switching - university of colorado...
TRANSCRIPT

Task SwitchingHigher-Level Cognition
Oct 7, 2008

Monsell, 2003
• “Task Switching”
• Basic phenomena
‣ Reaction time (RT) cost for switching tasks
• Higher error rate
‣ Diminished if prepared for switch
‣ Slower RT in alternating- than repetitive-task blocks
part of TSR cannot be done until exogenously triggeredby stimulus attributes that are associated with thetask; Rubinstein et al. [14] characterize this part asretrieval of stimulus–response rules into workingmemory. An alternative account, from De Jong [15],makes no distinction between endogenous and exogen-ously-triggered TSR. It proposes that, although sub-jects attempt TSR before stimulus onset (given theopportunity), they succeed on only a proportion ofswitch trials. If they succeed they are as ready for the
changed task as on a task-repetition trial. If they ‘failto engage’, the whole TSR process must be performedafter stimulus onset. This idea of TSR as a probabil-istic all-or-none state change is supported by the fit ofa discrete-state mixture model to the distribution ofreaction times (RTs) on prepared switch trials [15,16].But why should TSR be all-or-none? One rationale isthat TSR includes an attempt to retrieve either thegoal or the task rules from memory; retrieval attemptseither succeed or fail [17,18].
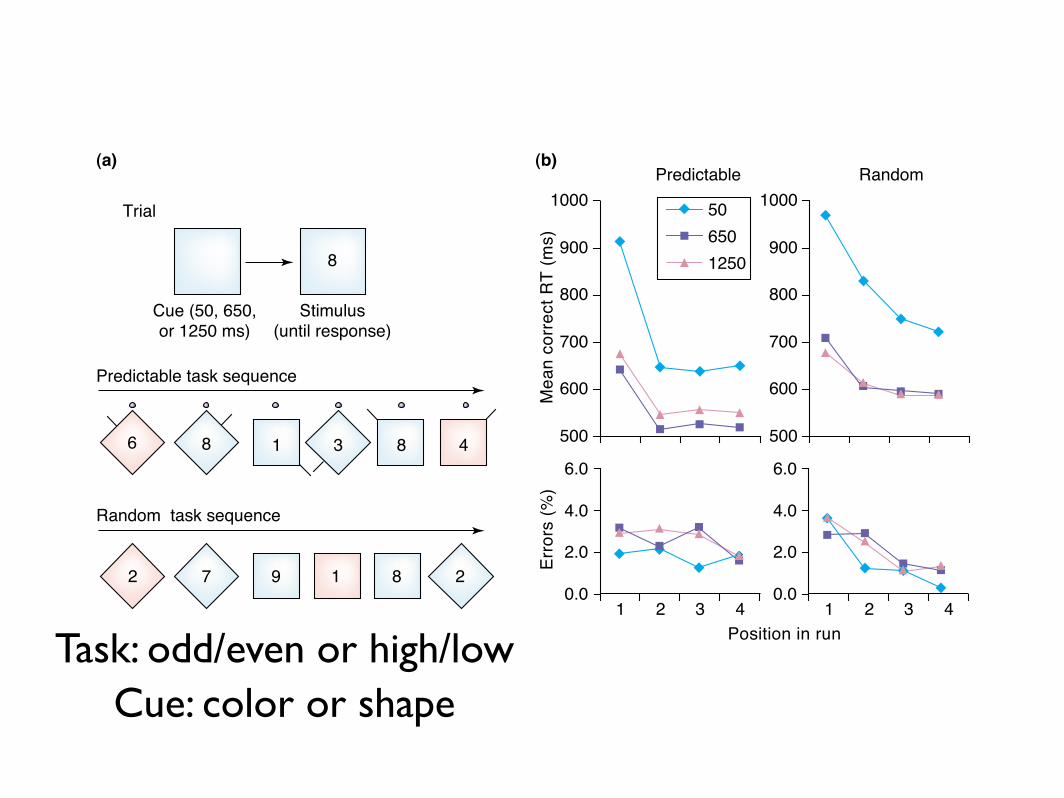
Fig. 1. Predictable and unpredictable task switching. In this experiment (Ref. [42], Exp. 2), the tasks were to classify the digit as either odd/even or high/low, with a left orright key-press. (a) For some subjects, the task was cued by the background colour (as illustrated) and for others by the background shape; the colour or shape changed atthe beginning of every trial. The response–stimulus interval in different blocks was 50 ms, 650 ms and 1250 ms, during which subjects could prepare for the next stimulus.In some blocks, the task changed predictably every four trials (with a ‘clock hand’ rotating to help keep track of the sequence): the ‘switch cost’ was limited to the first trialof the changed task (b). In other blocks, the task varied randomly from trial to trial and recovery from a task switch was more gradual. In both cases, the switch cost wasreduced by ,50% by extending the time available for preparation to 650 ms (the ‘preparation effect’); a further increase had little effect (the ‘residual cost’). These datademonstrate that, at least in normal, young adults, even with complete foreknowledge about the task sequence, switch costs are large, and that recovery from a task switchis characteristically complete after one trial. When the task is unpredictable, recovery might be more gradual, but a few repetitions of a task results in asymptotic readinessfor it. (Data redrawn with permission from Ref. [42].)
TRENDS in Cognitive Sciences
(a)
Predictable task sequence
Random task sequence
Trial
Cue (50, 650,or 1250 ms)
Stimulus(until response)
8
6 8 1 3 8 4
2 7 9 1 8 2
(b)
500
600
700
800
900
100050
650
1250
Predictable Random
0.0
2.0
4.0
6.0
1 2 3 4
Position in run
0.0
2.0
4.0
6.0
1 2 3 4
500
600
700
800
900
1000
Err
ors
(%
)M
ea
n c
orr
ect
RT
(m
s)
Fig. 2. Preparation effect and residual cost. (a) In this experiment (Ref. [13], Exp. 3), the stimulus is a character pair that contains a digit and/or a letter. The tasks were to clas-sify the digit as odd/even, or the letter as consonant/vowel. The task changed predictably every two trials and was also cued consistently by location on the screen (rotatedbetween subjects). (b) The time available for preparation (response–stimulus interval) varied between blocks. Increasing it to ,600 ms reduced switch cost (the ‘prep-aration effect’), but compared with non-switch trials there was little benefit of any further increase, which illustrates the ‘residual cost’ of switching. (Data redrawn with per-mission from Ref. [13].)
TRENDS in Cognitive Sciences
600
650
700
750
800
850
900
0 500 1000 1500
Response–stimulus interval (ms)
Switch trial
Non-switch trial
Me
an
co
rre
ct
RT
(m
s)
(a) (b)
G7 #E
4A L9
Letter task(switch)
Letter task(non-switch)
Digit task(switch)
Digit task(non-switch)
Review TRENDS in Cognitive Sciences Vol.7 No.3 March 2003136
http://tics.trends.com
Task: odd/even or high/lowCue: color or shape
Changing tasks
• Switch cost: time used by task-set reconfiguration (TSR)
• TSR might involve:
‣ inhibition of prior task’s rules
‣ activation of new task’s rules
• Cue: Partial vs. all-or-none TSR (debated)

part of TSR cannot be done until exogenously triggeredby stimulus attributes that are associated with thetask; Rubinstein et al. [14] characterize this part asretrieval of stimulus–response rules into workingmemory. An alternative account, from De Jong [15],makes no distinction between endogenous and exogen-ously-triggered TSR. It proposes that, although sub-jects attempt TSR before stimulus onset (given theopportunity), they succeed on only a proportion ofswitch trials. If they succeed they are as ready for the
changed task as on a task-repetition trial. If they ‘failto engage’, the whole TSR process must be performedafter stimulus onset. This idea of TSR as a probabil-istic all-or-none state change is supported by the fit ofa discrete-state mixture model to the distribution ofreaction times (RTs) on prepared switch trials [15,16].But why should TSR be all-or-none? One rationale isthat TSR includes an attempt to retrieve either thegoal or the task rules from memory; retrieval attemptseither succeed or fail [17,18].
Fig. 1. Predictable and unpredictable task switching. In this experiment (Ref. [42], Exp. 2), the tasks were to classify the digit as either odd/even or high/low, with a left orright key-press. (a) For some subjects, the task was cued by the background colour (as illustrated) and for others by the background shape; the colour or shape changed atthe beginning of every trial. The response–stimulus interval in different blocks was 50 ms, 650 ms and 1250 ms, during which subjects could prepare for the next stimulus.In some blocks, the task changed predictably every four trials (with a ‘clock hand’ rotating to help keep track of the sequence): the ‘switch cost’ was limited to the first trialof the changed task (b). In other blocks, the task varied randomly from trial to trial and recovery from a task switch was more gradual. In both cases, the switch cost wasreduced by ,50% by extending the time available for preparation to 650 ms (the ‘preparation effect’); a further increase had little effect (the ‘residual cost’). These datademonstrate that, at least in normal, young adults, even with complete foreknowledge about the task sequence, switch costs are large, and that recovery from a task switchis characteristically complete after one trial. When the task is unpredictable, recovery might be more gradual, but a few repetitions of a task results in asymptotic readinessfor it. (Data redrawn with permission from Ref. [42].)
TRENDS in Cognitive Sciences
(a)
Predictable task sequence
Random task sequence
Trial
Cue (50, 650,or 1250 ms)
Stimulus(until response)
8
6 8 1 3 8 4
2 7 9 1 8 2
(b)
500
600
700
800
900
100050
650
1250
Predictable Random
0.0
2.0
4.0
6.0
1 2 3 4
Position in run
0.0
2.0
4.0
6.0
1 2 3 4
500
600
700
800
900
1000
Err
ors
(%
)M
ea
n c
orr
ect
RT
(m
s)
Fig. 2. Preparation effect and residual cost. (a) In this experiment (Ref. [13], Exp. 3), the stimulus is a character pair that contains a digit and/or a letter. The tasks were to clas-sify the digit as odd/even, or the letter as consonant/vowel. The task changed predictably every two trials and was also cued consistently by location on the screen (rotatedbetween subjects). (b) The time available for preparation (response–stimulus interval) varied between blocks. Increasing it to ,600 ms reduced switch cost (the ‘prep-aration effect’), but compared with non-switch trials there was little benefit of any further increase, which illustrates the ‘residual cost’ of switching. (Data redrawn with per-mission from Ref. [13].)
TRENDS in Cognitive Sciences
600
650
700
750
800
850
900
0 500 1000 1500
Response–stimulus interval (ms)
Switch trial
Non-switch trial
Mean c
orr
ect R
T (
ms)
(a) (b)
G7 #E
4A L9
Letter task(switch)
Letter task(non-switch)
Digit task(switch)
Digit task(non-switch)
Review TRENDS in Cognitive Sciences Vol.7 No.3 March 2003136
http://tics.trends.com
Task: cued, classify odd/even or consonant/vowel
Preparation time
Interference
• Task-set inertia
‣ Specific cases: larger switch cost when switching to “stronger” (easier) task
‣ Counterintuitive; Not explained by TSR
• Associative retrieval of task set
‣ Slower on task 2 with stimuli from task 1
Neuroimaging
• PFC (medial, lateral) and sometimes other regions: more active on switch than non-switch trials
‣ Task updating, active maintenance
• Hard to locate executive area, as activity would be seen in executive module and the areas it modulates

Neuroimaging
• BOLD during preparation for switching:
‣ Left inferior frontal junction; pre-SMA
‣ Activity in response to cue or TSR?

Neuroimaging
• TMS to pre-SMA increases RT on task-switching trials
• Executive control module or the target of control?

Further research
• Many unanswered questions
‣ Preparation effect
‣ Language interference
‣ Task-set intertia

Reynolds et al., 2006
• “Computational and neural mechanisms of task switching”
• Switch costs present even with preparation
‣ Suggests interaction between priming and task updating/active maintenance in PFC

Why do switch costs exist?
• Though active maintenance in PFC is optimal, only engaged on a subset of trials
‣ All-or-none task-switch reconfiguration (TSR)
• Slow trials: interference from associative learning from previous stimuli
• Investigate with: Model, fMRI
‣ Random-cueing task-switching paradigm

Model
• Connectionist architecture (LEABRA)
‣ Associative learning (Hebbian)
• DA gating signal
‣ Presence: Active maintenance
‣ Absence: Mechanistic source of task-switch costs
to associative learning processes simulated via post-synaptically gated Hebbian learning !Dwij " 0:1yj!xi #wij$ on the connections projecting from the hidden layerto the PFC and the response layer. This learning rule wasapplied after equilibrium was reached on each event. Aftereach trial, the weights decayed exponentially towards theiroriginal value of 0:5!wt%1 " 0:5% 0:3!wt # 0:5$, where t isthe current trial).
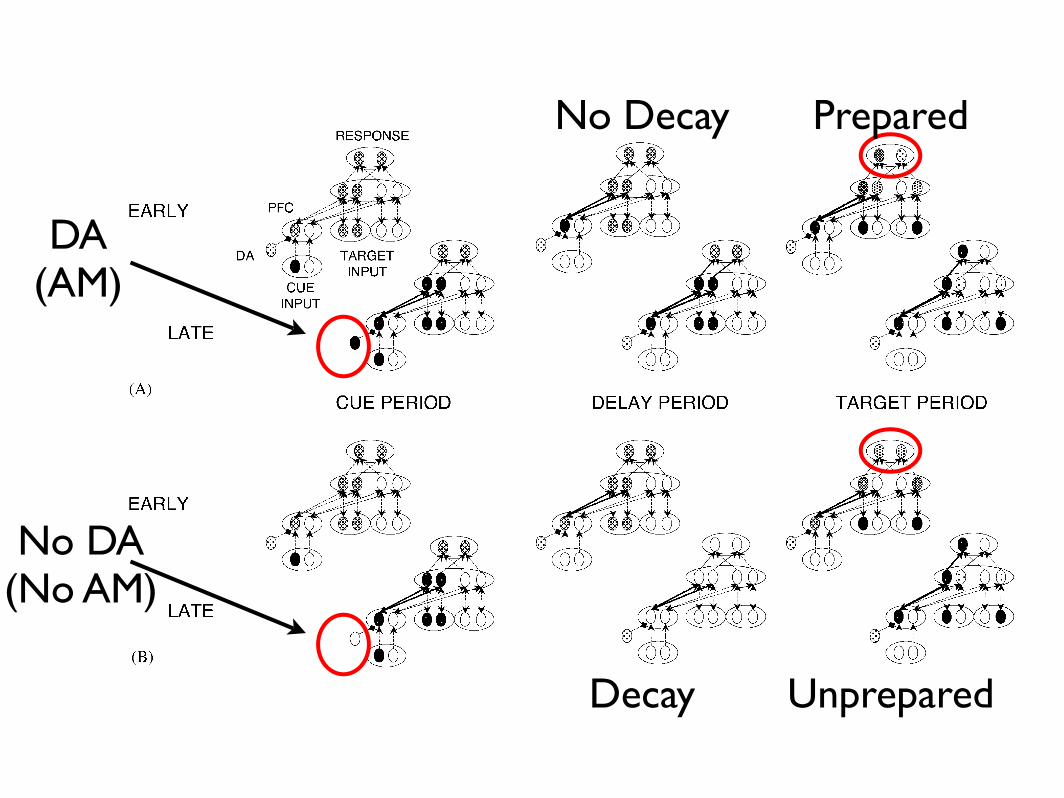
In order to simulate a random distribution of preparedand unprepared trials, a gating signal occurred on arandom 50% of task cue events. This gating signal washypothesized to reflect a phasic dopamine (DA) response[2]. Whereas previous research has considered the phasicDA response to occur on all trials after training [2], thecurrent research capitalizes upon the well documentedstochastic properties of DA activity [6]: The noise in theDA response is reflected in the probabilistic behavior of thegating signal, and it is thought to be the mechanistic sourceunderlying the probabilistic nature of task-switch costs.The gating signal modulated intracellular currents toenable active maintenance: if a gating signal occurred, ahysteresis current was turned on such that activity could bemaintained throughout the trial [4]. This actively main-tained task cue was able to bias subsequent processing toproduce an appropriate response [8]. If the gating signal
did not occur, there was no internal mechanism for activelymaintaining PFC activity states in the absence of externalinput. Under this circumstance, the empty delay period in-directly flushed the activity out of the PFC units, leavingthe network unprepared to process the upcoming targetstimulus (see Fig. 1). Sixteen sequences of 1024 trials wereperformed, each initialized with a different random seed.
3. Results and discussion
In order to evaluate the model’s performance, dataproduced by the network (performance measures as well asPFC activity dynamics) were compared to data producedby 13 participants whose brain activity was measured withfunctional magnetic resonance imaging (fMRI) whileperforming a random-cueing task-switching paradigm [3].The network captured several general phenomena in the
task-switching literature. Task switch trials were slowerand less accurate than task repeats (13.0 cycles; effectsize " 0.38sd; 3.6% errors; effect size " 0.22sd), witheffect sizes comparable to those seen in the empirical data(74msec; effect size " 0.29sd; 3.2% errors; effectsize " 0.13). Further analyses indicated that the modelwas also capturing other common but subtle effects. Forexample, the global switch cost was mediated by a task
ARTICLE IN PRESS
Fig. 1. Model architecture, task, and activity dynamics. Each schematic represents the activity state and pattern of connectivity of the model at thebeginning and end of the three different events composing each trial. Darker circles represent higher levels of activity. During the cue period, a cuestimulus is presented and propagates activity through the PFC to the hidden layer and the other layers of the network, activating both attributes ofthe relevant dimension. If a phasic DA signal occurs during the cue period (panel A), then the task information is actively maintained in the PFC overthe delay period, but in the absence of such a signal (panel B), this information decays rapidly over the empty delay. During the target period, a targetstimulus with one attribute from each dimension is presented, and activity propagates through the network (potentially re-activating the PFC, see panel B)until the network’s activity state settles into a stable state (maximum D activity o0:0003) and a response is achieved (maximum activity in the responselayer 40:65). At the end of each event, learning strengthens the connections between those units that were co-active (indicated by heavier solid lines).
J.R. Reynolds et al. / Neurocomputing 69 (2006) 1332–1336 1333
DA(AM)
No DA(No AM)
Decay
No Decay Prepared
Unprepared

Results
switch ! response repetition interaction, such that switchcosts were greater on trials in which the correct responserepeated relative to trials in which the correct responsechanged [7](see Fig. 2).
Separating trials by whether they involved activemaintenance in PFC illuminated several other findings.First, the performance of the model was above chance evenwhen the model did not actively maintain the current taskin PFC (5.3% errors). In particular, the model performedwell above chance on trials in which the two dimensions ofthe target stimulus led to different responses, even thoughthe network did not have an actively maintained signal toselect the task-relevant dimension (10.6% errors). Theability to make an appropriate response in the absence ofan actively maintained task was subserved by theassociative learning mechanism. The weights from thehidden layer to the PFC and response layers were
strengthened on the most recent task-cue event. Theseweight changes biased the network to perform theappropriate task, even when an actively maintained taskwas not present. In particular, the change in weight spaceenabled the re-activation of the appropriate task represen-tation in PFC during target presentation (see Fig. 1, panelB and Fig. 3), such that activity from the presented targetstimulus would retrace the pathways that had just beenstrengthened during the cue and delay periods. Thesestrengthened pathways ultimately led to increased activa-tion values in the appropriate task representation, whichcould then serve to bias on-going processing.Further analysis of trials without active maintenance
revealed that there were clear differences in the model’sperformance between these trials and those that involvedactive maintenance. Trials with active maintenance hadsmaller switch costs than those without active maintenance(switch cost with active maintenance " 6.1 cycles, effectsize " 0.18sd; switch cost without active maintenance "20.4 cycles, effect size " 0.60sd), demonstrating that
ARTICLE IN PRESS
550
Task Repeat Task Switch
To Current Task UnitTo Inappropriate Task Unit
0.5
0.52
0.54
0.56
0.58
0.6
Wei
ght t
o P
FC
from
hid
den
laye
r
850
750
650Rea
ctio
n T
ime
(mse
c)
task repeattask switch
Response AlternationResponse Repeat
1150
1050
950
(A)
(B)
Fig. 2. Behavioral measures and associative learning mechanism under-lying switch costs. Panel A presents the empirical (bars) and model (opencircles) data demonstrating greater switch costs on response-repeat trialsrelative to response-alternation trials. Error bars represent 99% con-fidence interval (CI) of the behavioral data. Model data were transformedto be on the same scale as the empirical data by the regression equation:BehavioralRT " 6:8ModelRT # 184. Panel B presents one mechanismunderlying switch costs: the changes in connection strength between thehidden layer and PFC as a function of previous experience. When thetarget stimulus appears on a task-repeat trial, there is a large differencebetween the weights from the hidden layer to the appropriate andinappropriate task units in PFC, due to the accumulation of consistentweight changes on both the current and previous trial. However, on task-switch trials, this difference is reduced, and this reduction results in morecompetition between the two PFC representations (leading to increasedresponse times).
Task RepeatTask Switch
1600
1400
1200
1000
800
600
Res
pons
e T
ime
(mse
c)
Slowest TrialsFastest Trials
% S
igna
l Cha
nge
0.2
0
–0.2Delay Period Target Period
Fastest TrialsSlowest Trials
0.6
0.4
(A)
(B)
Fig. 3. Behavior and PFC responses as a function of response speed.Panel A demonstrates increased switch costs for slower trials relative tofaster trials in both human data (bars) and the model (overlaid opencircles). Error bars represent 99% CI. Model data were transformed to beon the same scale as the empirical data by the regression equation:BehavioralRT " 6:8ModelRT # 127. Panel B demonstrates a doubledissociation in a region of lateral PFC (Brodmann area 44/9; center ofmass: #46; 15; 21; volume " 324mm3). The fastest trials have greaterdelay related responses than the slowest trials, but the slowest trials havegreater target-related activity than the fastest trials. Error bars representthe 99% CI of the imaging data. Model data were transformed to be onthe same scale as the empirical data by the regression equation:ImagingSignal " 0:05ModelSignal # 0:1.
J.R. Reynolds et al. / Neurocomputing 69 (2006) 1332–13361334
bars = behO = model • Greater switch cost on
R-R than R-A trials
‣ Interference from task switch with same response
• T-S trials: Smaller difference between unit activation
‣ more competition for response, increased RT
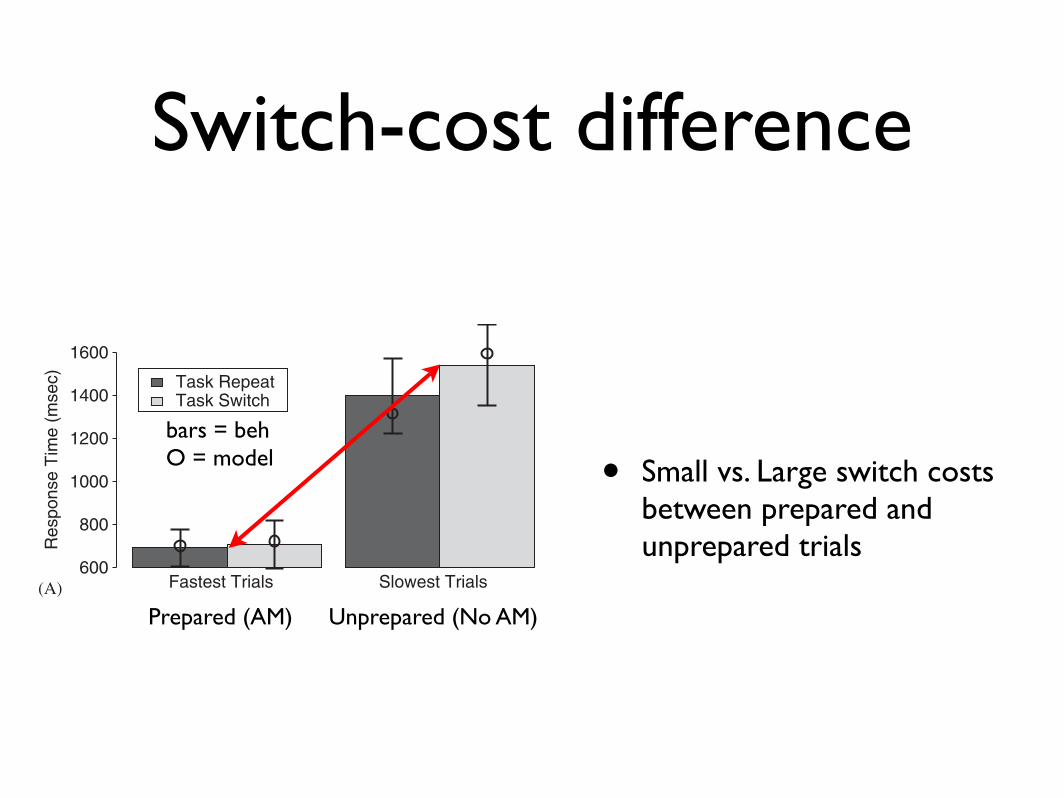
Switch-cost difference
• Small vs. Large switch costs between prepared and unprepared trials
switch ! response repetition interaction, such that switchcosts were greater on trials in which the correct responserepeated relative to trials in which the correct responsechanged [7](see Fig. 2).
Separating trials by whether they involved activemaintenance in PFC illuminated several other findings.First, the performance of the model was above chance evenwhen the model did not actively maintain the current taskin PFC (5.3% errors). In particular, the model performedwell above chance on trials in which the two dimensions ofthe target stimulus led to different responses, even thoughthe network did not have an actively maintained signal toselect the task-relevant dimension (10.6% errors). Theability to make an appropriate response in the absence ofan actively maintained task was subserved by theassociative learning mechanism. The weights from thehidden layer to the PFC and response layers were
strengthened on the most recent task-cue event. Theseweight changes biased the network to perform theappropriate task, even when an actively maintained taskwas not present. In particular, the change in weight spaceenabled the re-activation of the appropriate task represen-tation in PFC during target presentation (see Fig. 1, panelB and Fig. 3), such that activity from the presented targetstimulus would retrace the pathways that had just beenstrengthened during the cue and delay periods. Thesestrengthened pathways ultimately led to increased activa-tion values in the appropriate task representation, whichcould then serve to bias on-going processing.Further analysis of trials without active maintenance
revealed that there were clear differences in the model’sperformance between these trials and those that involvedactive maintenance. Trials with active maintenance hadsmaller switch costs than those without active maintenance(switch cost with active maintenance " 6.1 cycles, effectsize " 0.18sd; switch cost without active maintenance "20.4 cycles, effect size " 0.60sd), demonstrating that
ARTICLE IN PRESS
550
Task Repeat Task Switch
To Current Task UnitTo Inappropriate Task Unit
0.5
0.52
0.54
0.56
0.58
0.6
Wei
ght t
o P
FC
from
hid
den
laye
r
850
750
650Rea
ctio
n T
ime
(mse
c)
task repeattask switch
Response AlternationResponse Repeat
1150
1050
950
(A)
(B)
Fig. 2. Behavioral measures and associative learning mechanism under-lying switch costs. Panel A presents the empirical (bars) and model (opencircles) data demonstrating greater switch costs on response-repeat trialsrelative to response-alternation trials. Error bars represent 99% con-fidence interval (CI) of the behavioral data. Model data were transformedto be on the same scale as the empirical data by the regression equation:BehavioralRT " 6:8ModelRT # 184. Panel B presents one mechanismunderlying switch costs: the changes in connection strength between thehidden layer and PFC as a function of previous experience. When thetarget stimulus appears on a task-repeat trial, there is a large differencebetween the weights from the hidden layer to the appropriate andinappropriate task units in PFC, due to the accumulation of consistentweight changes on both the current and previous trial. However, on task-switch trials, this difference is reduced, and this reduction results in morecompetition between the two PFC representations (leading to increasedresponse times).
Task RepeatTask Switch
1600
1400
1200
1000
800
600
Res
pons
e T
ime
(mse
c)
Slowest TrialsFastest Trials
% S
igna
l Cha
nge
0.2
0
–0.2Delay Period Target Period
Fastest TrialsSlowest Trials
0.6
0.4
(A)
(B)
Fig. 3. Behavior and PFC responses as a function of response speed.Panel A demonstrates increased switch costs for slower trials relative tofaster trials in both human data (bars) and the model (overlaid opencircles). Error bars represent 99% CI. Model data were transformed to beon the same scale as the empirical data by the regression equation:BehavioralRT " 6:8ModelRT # 127. Panel B demonstrates a doubledissociation in a region of lateral PFC (Brodmann area 44/9; center ofmass: #46; 15; 21; volume " 324mm3). The fastest trials have greaterdelay related responses than the slowest trials, but the slowest trials havegreater target-related activity than the fastest trials. Error bars representthe 99% CI of the imaging data. Model data were transformed to be onthe same scale as the empirical data by the regression equation:ImagingSignal " 0:05ModelSignal # 0:1.
J.R. Reynolds et al. / Neurocomputing 69 (2006) 1332–13361334
Prepared (AM) Unprepared (No AM)
bars = behO = model

Lateral PFC activity (BOLD)
• Double dissociation
‣ Delay: Fast use AM
‣ Target: Unprepared = more processing (TSR)
switch ! response repetition interaction, such that switchcosts were greater on trials in which the correct responserepeated relative to trials in which the correct responsechanged [7](see Fig. 2).
Separating trials by whether they involved activemaintenance in PFC illuminated several other findings.First, the performance of the model was above chance evenwhen the model did not actively maintain the current taskin PFC (5.3% errors). In particular, the model performedwell above chance on trials in which the two dimensions ofthe target stimulus led to different responses, even thoughthe network did not have an actively maintained signal toselect the task-relevant dimension (10.6% errors). Theability to make an appropriate response in the absence ofan actively maintained task was subserved by theassociative learning mechanism. The weights from thehidden layer to the PFC and response layers were
strengthened on the most recent task-cue event. Theseweight changes biased the network to perform theappropriate task, even when an actively maintained taskwas not present. In particular, the change in weight spaceenabled the re-activation of the appropriate task represen-tation in PFC during target presentation (see Fig. 1, panelB and Fig. 3), such that activity from the presented targetstimulus would retrace the pathways that had just beenstrengthened during the cue and delay periods. Thesestrengthened pathways ultimately led to increased activa-tion values in the appropriate task representation, whichcould then serve to bias on-going processing.Further analysis of trials without active maintenance
revealed that there were clear differences in the model’sperformance between these trials and those that involvedactive maintenance. Trials with active maintenance hadsmaller switch costs than those without active maintenance(switch cost with active maintenance " 6.1 cycles, effectsize " 0.18sd; switch cost without active maintenance "20.4 cycles, effect size " 0.60sd), demonstrating that
ARTICLE IN PRESS
550
Task Repeat Task Switch
To Current Task UnitTo Inappropriate Task Unit
0.5
0.52
0.54
0.56
0.58
0.6
Wei
ght t
o P
FC
from
hid
den
laye
r
850
750
650Rea
ctio
n T
ime
(mse
c)task repeattask switch
Response AlternationResponse Repeat
1150
1050
950
(A)
(B)
Fig. 2. Behavioral measures and associative learning mechanism under-lying switch costs. Panel A presents the empirical (bars) and model (opencircles) data demonstrating greater switch costs on response-repeat trialsrelative to response-alternation trials. Error bars represent 99% con-fidence interval (CI) of the behavioral data. Model data were transformedto be on the same scale as the empirical data by the regression equation:BehavioralRT " 6:8ModelRT # 184. Panel B presents one mechanismunderlying switch costs: the changes in connection strength between thehidden layer and PFC as a function of previous experience. When thetarget stimulus appears on a task-repeat trial, there is a large differencebetween the weights from the hidden layer to the appropriate andinappropriate task units in PFC, due to the accumulation of consistentweight changes on both the current and previous trial. However, on task-switch trials, this difference is reduced, and this reduction results in morecompetition between the two PFC representations (leading to increasedresponse times).
Task RepeatTask Switch
1600
1400
1200
1000
800
600
Res
pons
e T
ime
(mse
c)
Slowest TrialsFastest Trials
% S
igna
l Cha
nge
0.2
0
–0.2Delay Period Target Period
Fastest TrialsSlowest Trials
0.6
0.4
(A)
(B)
Fig. 3. Behavior and PFC responses as a function of response speed.Panel A demonstrates increased switch costs for slower trials relative tofaster trials in both human data (bars) and the model (overlaid opencircles). Error bars represent 99% CI. Model data were transformed to beon the same scale as the empirical data by the regression equation:BehavioralRT " 6:8ModelRT # 127. Panel B demonstrates a doubledissociation in a region of lateral PFC (Brodmann area 44/9; center ofmass: #46; 15; 21; volume " 324mm3). The fastest trials have greaterdelay related responses than the slowest trials, but the slowest trials havegreater target-related activity than the fastest trials. Error bars representthe 99% CI of the imaging data. Model data were transformed to be onthe same scale as the empirical data by the regression equation:ImagingSignal " 0:05ModelSignal # 0:1.
J.R. Reynolds et al. / Neurocomputing 69 (2006) 1332–13361334
(Prepared)(Unprepared)
bars = behO = model
Rubinstein et al., 2001• “Executive Control of Cognitive Processes
in Task Switching”
• Exist 2 contrasting theoretical proposals in task switching:
‣ Interference from prior task
‣ Delay for reconfiguration of rules for new task (TSR) by executive control processes
• Results of this paper suggest the latter
Existing models
• Theories of how task switching might be mediated by separable executive control processes for

Existing models: ATA• Attention-to-Action model (Norman &
Shallice, 1986)
‣ Action Schemas (AS): skill routines
‣ Contention Scheduling (CS): handles conflicts in AS; quickly assesses priorities w/o exec control
‣ Supervisory attentional system (SAS): top-down; supersedes CS to better accommodate goals (slower)

Existing models: FLE
• Frontal-Lobe Executive model (Duncan, 1986)
‣ Goal list: current ranked intentions
‣ Mean-ends analysis: like SAS
‣ Action structures: procedural knowledge
Existing models: SRD
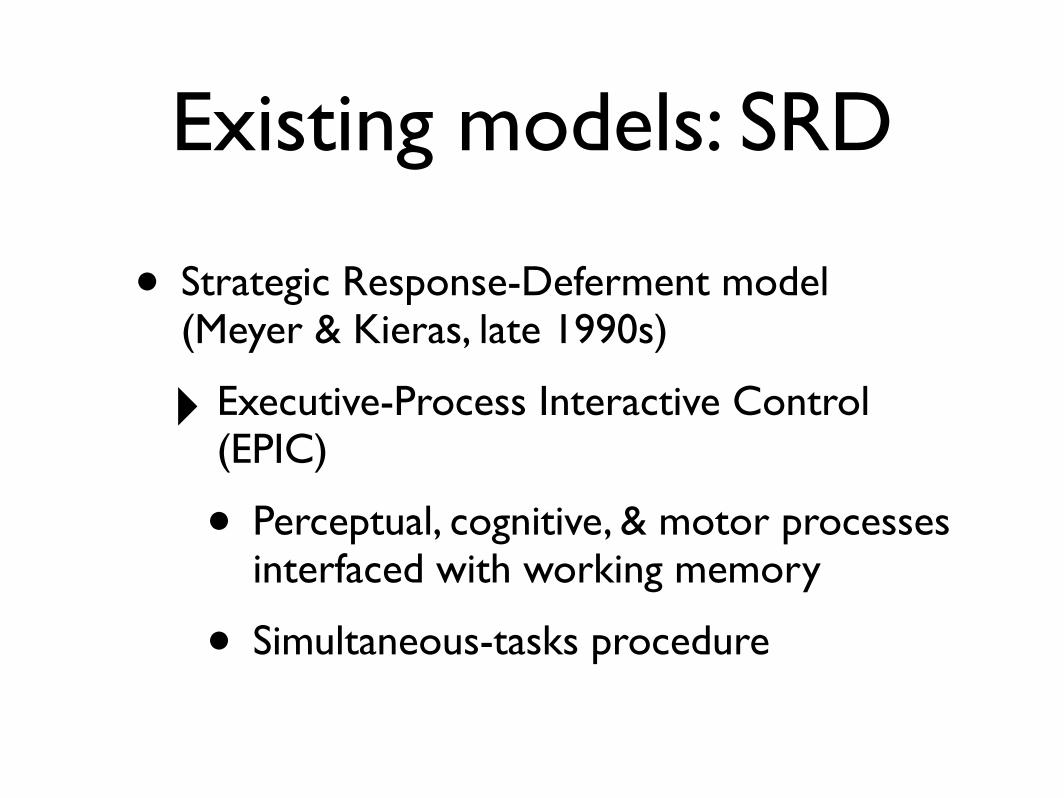
• Strategic Response-Deferment model (Meyer & Kieras, late 1990s)
‣ Executive-Process Interactive Control (EPIC)
• Perceptual, cognitive, & motor processes interfaced with working memory
• Simultaneous-tasks procedure

Review: TS Experiments
• Jersild (1927)
‣ Longer RT for more complex rules in both task alternation and repetition
• Spector & Biederman (1976)
‣ Visual cues lessen switching-time costs
• Allport et al. (1994)
‣ More proactive interference for tasks with greater similarity (sometimes) (TSI)
Review: TS Experiments
• Rogers & Monsell (1995)
‣ Some answers to unexplained Allport et al. (1994) findings
• Current paper: testing a model of executive control for task switching is warranted
Model770 RUBINSTEIN, MEYER, AND EVANS
Executive Control Processes -»•
goalshifting
Ttask
cuing
Stimulus •
ruleactivation
stimulus rule taskdiscriminability complexity cuing
stimulusidentification
responseselection
movementproduction Response
Task Processes
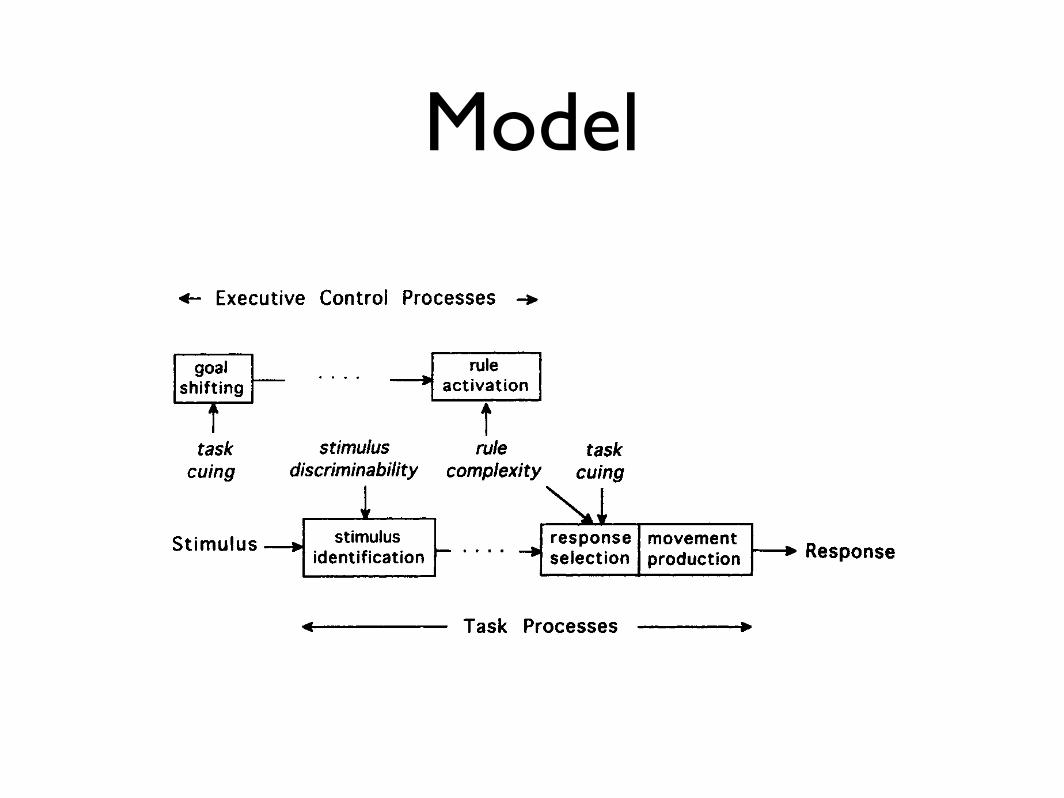
Figure 1. A stage model of task switching that has distinct executive control and task processes. Various
factors (viz., task cuing, rule complexity, and stimulus discriminability) may influence the durations of these
processes, thereby affecting mean reaction times and switching-time costs additively or interactively.
dure entails two complementary sets of stages: executive control
processes and task processes (for more discussion about each type
of process, see Lauber, 1995, and Kieras et al., 2000).
Task Processes
We assume that task processes are used for performing individ-
ual perceptual-motor and cognitive tasks under both single-task
and multiple-task conditions. In our model, these processes include
three principal stages, stimulus identification, response selection,
and movement production, which operate on the basis of informa-
tion in declarative and procedural working memory (cf. Donders,
1868/1969; Meyer & Kieras, 1997a, 1997b; Sanders, 1980; Stern-
berg, 1969). The stimulus-identification stage encodes perceptual
features of stimuli and places them in declarative working memory
for access during the response-selection stage. Through algorithms
in procedural working memory, the response-selection stage con-
verts the stimulus codes to abstract response codes. The
movement-production stage converts the response codes to motor
commands that generate overt physical action. Component opera-
tions in each stage are assumed to be tailored to the tasks' partic-
ular sensory modalities, response modalities, and S-R mappings.
Regarding the response-selection stage, we further assume that
it uses production rules in procedural working memory, which
specify actions to be executed whenever prerequisite conditions
match the current contents of declarative working memory. For
example, suppose that a task requires pressing finger keys in
response to stimulus colors. Then a production rule for response
selection might have the following form:
IF ((GOAL IS TO DO COLOR-DISCRIMINATION TASK) AND
(STIMULUS COLOR IS RED))
THEN (PRESS RIGHT INDEX-FINGER KEY).
The numerosity and complexity of such rules depend on the task's
S-R mapping, thereby affecting the duration of the response-
selection stage (Meyer & Kieras, 1997a, 1997b).
When the same task is performed repetitively, response selec-
tion in the model starts immediately after stimulus identification
on each trial. However, we assume that if a switch occurs from one
task to another, there is a pause between the end of stimulus
identification and the beginning of response selection for the
current task (see Figure 1). This pause is used by an executive
control process whose operations enable the subsequent response-
selection stage to proceed correctly.
Executive Control Processes
To enable task switching, the model's executive control pro-
cesses include two distinct stages, goal shifting and rule activation,
which are accomplished through executive production rules. To-
gether, goal shifting and rule activation respectively ensure that the
contents of declarative and procedural working memory are ap-
propriately configured for the task at hand, consistent with pro-
posals of some previous theorists (e.g., Duncan, 1986; Kimberg &
Farah, 1993; Logan, 1985; Meyer & Kieras, 1997a, 1997b; Rogers
& Monsell, 1995).4
Goal shifting. The goal-shifting stage keeps track of current
and future tasks, inserting and deleting their goals in declarative
working memory as needed. Specific goal items in working mem-
ory let other components of the system "know" what the current
task is. For example, in switching from a shape-discrimination to
a color-discrimination task, goal shifting might involve updating
4 Of course, there are probably other important executive control pro-
cesses. For example, one may involve attention refocusing, which tunes
particular perceptual mechanisms to be especially sensitive in discriminat-
ing relevant stimulus features for the current task (Keele & Rafal, 2000;
Meyer et al., 1997, 1998). Also, executive control may involve response
monitoring and error detection to help ensure that overt movements are
produced correctly despite underlying system noise (Gehring, Goss, Coles,
Meyer, & Donchin, 1993; Kornblum, Hasbroucq, & Osman, 1990; Norman
& Shallice, 1986). This supervision could be especially important during
the successive-tasks procedure, which entails conflicting S-R mappings.
For now, however, we focus on the goal-shifting and rule-activation stages
of task switching.
Experimental Design
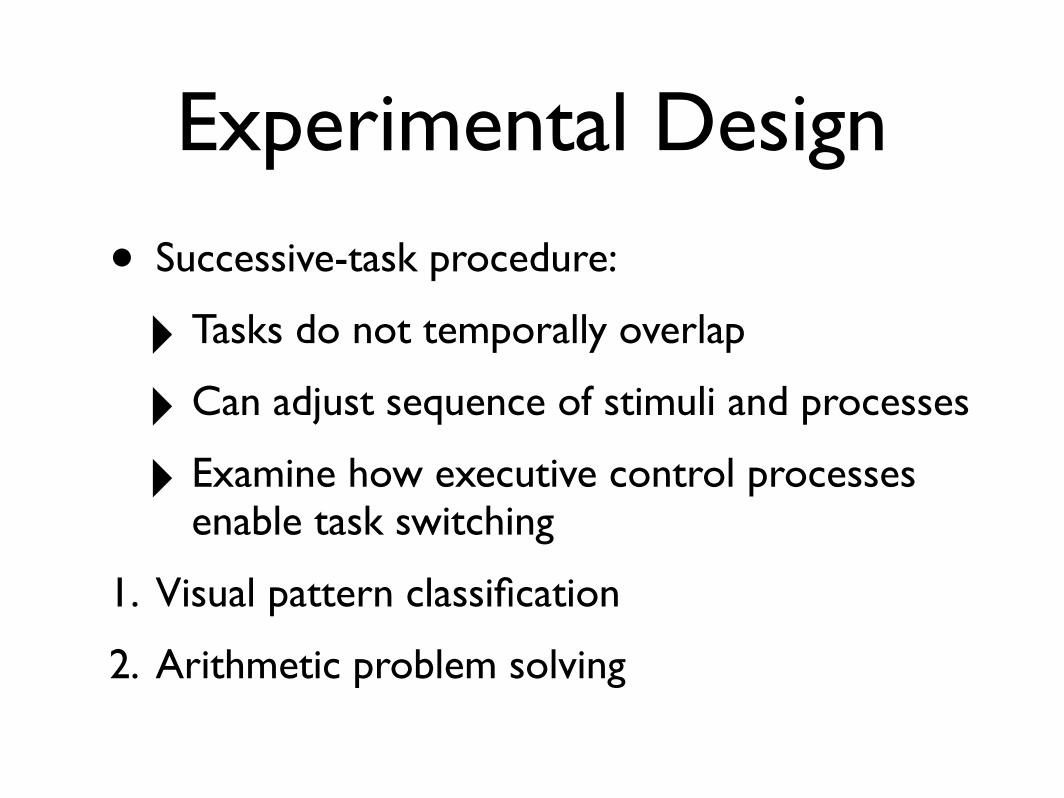
• Successive-task procedure:
‣ Tasks do not temporally overlap
‣ Can adjust sequence of stimuli and processes
‣ Examine how executive control processes enable task switching
1. Visual pattern classification
2. Arithmetic problem solving

Task manipulations
• Tasks: Familiar/unfamiliar
• Rule complexity: Low/high
• Visual cues (task modality): Present/absent

Experiment 1
• Executive control and task processes: empirically dissociated; affected separately by different factors
• Visual pattern classification (~WCST)
‣ Sort by: shape, size, shading, or numerosityEXECUTIVE CONTROL PROCESSES 775
o o
o o
B
Figure 2. Examples of stimuli in the low-rule-complexity condition of Experiment 1. A: Four target cards used
when participants sorted stimulus cards with respect to single perceptual dimensions. The far left target consists
of one extra-large dark triangle, the middle left target consists of two large medium-shade stars, the middle right
target consists of three medium-size light crosses, and the far right target consists of four small white circles. B:
Stimulus card that consists of one large light circle.
tasks performed for the other deck involved dimensions whose values had
low discriminability (size and shading).
High-rule-complexity condition. For the high-rule-complexity condi-
tion, there were two different tasks that required sorting with respect to
either the shape and number or the size and shading of objects on the
stimulus cards. Again, four target cards were used in each of these tasks.
They were constructed such that a stimulus card matched one target in
terms of two relevant perceptual dimensions, two other targets in terms of
one relevant dimension, and a fourth target in terms of no relevant dimen-
sions (e.g., see Figure 3).
Because there were four different values on each perceptual dimension,
two sets (A and B) of target cards were constructed for the high-complexity
tasks. The four targets in Set A respectively displayed one extra-large dark
triangle, one medium-size dark cross, three extra-large light triangles, and
three medium-size light crosses (see Figure 3, Panel A). The four targets in
Set B respectively displayed two large medium-shade stars, two small
medium-shade circles, four large white stars, and four small white circles.
Two decks of stimulus cards were constructed for sorting with respect to
shape and numerosity on repetitive-task blocks; one deck was used with the
target cards of Set A. and the other was used with the target cards of'Set
B. Similarly, two more decks were constructed for sorting with respect to
size and shading on repetitive-task blocks. There were 24 cards per deck,
with each target card being matched by 6 of them.
Two additional decks of stimulus cards, again with 24 cards per deck,
were constructed for performing the high-complexity tasks during
alternating-task blocks. The 12 cards in odd serial positions of a deck were
sorted with respect to conjunctions of shape and numerosity; the 12 cards
in even serial positions were sorted with respect to conjunctions of size and
o o
o o
B
Figure 3. Examples of stimuli in the high-rule-complexity condition of Experiment 1. A: Four target cards used
when participants sorted stimulus cards with respect to conjunctions of two perceptual dimensions (shape and
numerosity, or size and shading). B: Representative stimulus card.

Results
• Discriminability affects RT, not switching-time costs
• RTs: alternating blocks > repetitive blocks
• Increased rule complexity = increased RT in alternating-task blocks

Experiment 2
• Executive control mediated by goal shifting and rule activation
• Arithmetic problems
‣ Low complexity: +, -
‣ High complexity: x, ÷
‣ Cue: present between 2 numbers, or not
EXECUTIVE CONTROL PROCESSES 779
Table 3
Results of Experiment 2
Trial-block
type
Repetitive
Alternating
Rule
complexity
Low
LowLow
Low
High
HighHigh
HighLow
LowHigh
High
Task
cuing
Present
PresentAbsentAbsent
Present
PresentAbsent
AbsentPresent
AbsentPresent
Absent
Arithmetic problem type
Addition
SubtractionAddition
Subtraction
Multiplication
DivisionMultiplication
DivisionAddition or subtraction
Addition or subtractionMultiplication or division
Multiplication or division
Mean
RT (ms)
2.672
3,5283.1253.694
6,745
5,2597,866
7,5373,158
3,8756,713
8,861
Error
rate (%)
2.3
5.65.1
4.211.1
10.710.2
10.76.9
9.810.7
13.0
Switching-
time cost (ms)
63
508776
1.265
Note. Mean reaction times (RTs) and error rates were calculated by dividing the number of stimulus cards per deck into the total completion times and
errors per trial block. Mean switching-time costs were calculated with Equation 1.
were low on average (8.8% across conditions) and correlated
positively with mean RTs (r = .86, p < .001). The reliability of
factor effects on mean RTs and switching-time costs was evaluated
as in Experiment 1.
Effects of trial-block type. Trial-block type affected mean RTs
reliably, f(18) = 4.68, p < .0005. On average, participants took
longer to respond during alternating-task blocks than during
repetitive-task blocks of arithmetic problems, manifesting substan-
tial switching-time costs (M = 653 ms, SE = 140 ms). As our
stage model of task switching predicts, these costs are consistent
with component durations being contributed by the executive
control processes of goal shifting and rule activation.
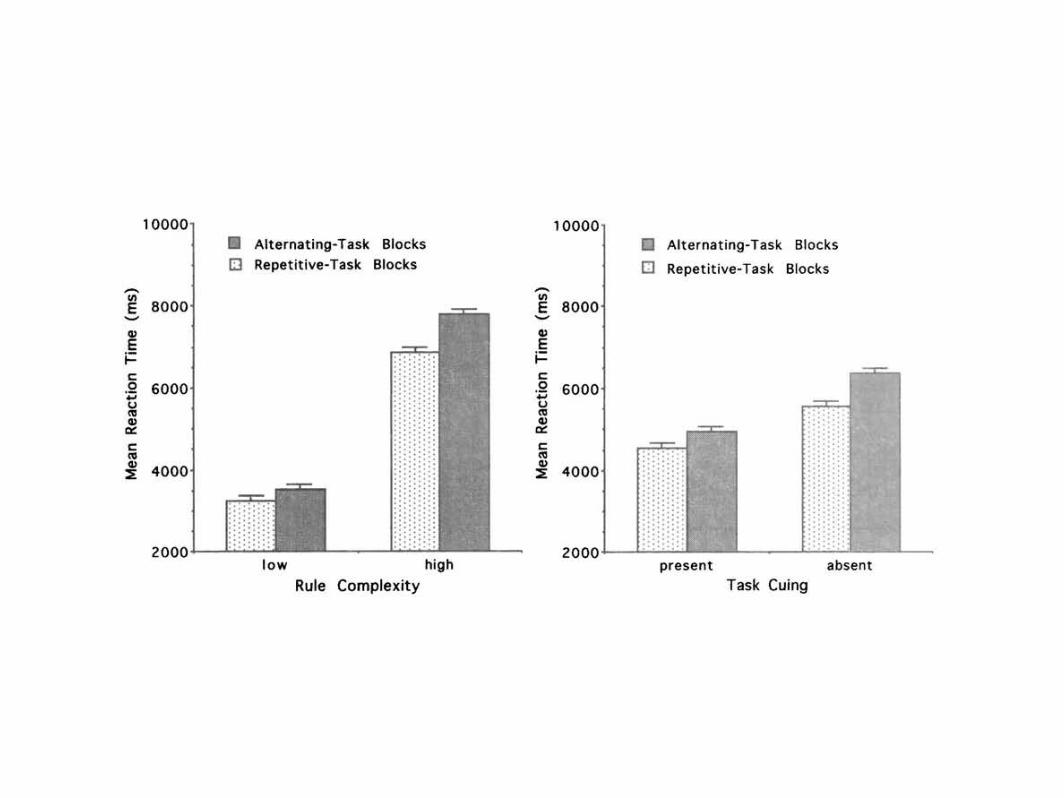
Effects of rule complexity. Rule complexity affected mean RTs
during both repetitive-task and alternating-task blocks (see Figure
5, left panel). On average, responses were slower for multiplication
and division problems than for addition and subtraction problems
(mean difference = 3,934 ms, SE = 425 ms). /(18) = 9.26, p <
.0001. The magnitude of this effect on mean RTs during repetitive-
task blocks (viz., 3,597 ms) presumably manifests how much
longer arithmetic calculation and response selection took with
high-complexity rules than with low-complexity rules. For now,
we assume that an equivalent lengthening of these task processes
occurred during alternating-task blocks, which is supported sub-
sequently by further evidence that task and executive control
processes may be functionally dissociable from each other.
Nevertheless, during alternating-task blocks, rule complexity
had a larger total effect. As a result, switching-time costs were
reliably greater for multiplication and division problems than for
10000]
2000
10000iH Alternating-Task Blocks
• Repetitive-Task Blocks
low highRule Complexity
in
Tim
etion
Reac
Mean
8000
6000
4000
2000
13 Alternating-Task Blocks
• Repetitive-Task Blocks
present absentTask Cuing
Figure 5. Results of Experiment 2. Left: Mean reaction times (RTs) as a function of rule complexity and
trial-block type. Standard errors (lines extending above vertical bars) are based on the interaction among block
type, rule complexity, and participants. Right: Mean RTs as a function of task cuing and trial-block type.
Standard errors are based on the interaction among block type, task cuing, and participants.

Experiments 3 & 4
• Due to rule activation, switching-time costs may be asymmetric in relation to familiarity of tasks
‣ A to B ≠ B to A
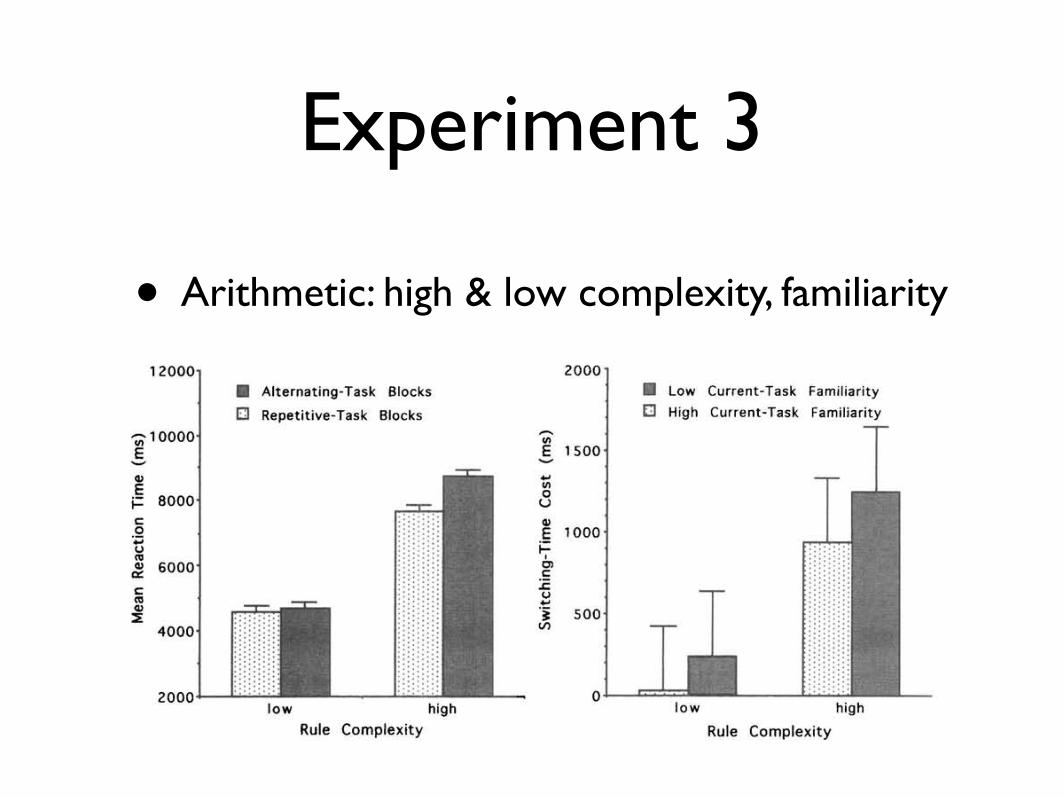
Experiment 3
• Arithmetic: high & low complexity, familiarity784 RUBINSTEIN, MEYER, AND EVANS
12000i
•10000'
2000
• Alternating-Task Blocks
• Repetitive-Task Blocks
low highRule Complexity
2000
<n
E 1500
<u
E 1000
c
u
500
H Low Current-Task Familiarity
• High Current-Task Familiarity
low high
Rule Complexity
Figure 8. Results of Experiment 3. Left: Mean reaction times (RTs) as a function of rule complexity and
trial-block type. Standard errors (lines extending above vertical RT bars) are based on the interaction among
block type, rule complexity, and participants. Right: Mean switching-time costs as a function of rule complexity
and current-task familiarity. Standard errors are based on the interaction among trial-block type, current-task
familiarity, and participants.
causes of these individual differences are considered in the fol-
lowing discussion.
Discussion
Using arithmetic problem-solving tasks once more, Experiment
3 replicated and extended Experiment 2, yielding some results that
further confirm predictions based on our stage model of executive
control in task switching. Although the present procedure involved
discrete RT trials rather than continuous card sorting, mean
switching-time costs were again positive and increased reliably
with rule complexity, as if they stemmed from a rule-activation
stage of executive control. We also found that these costs tended
to depend on the direction of task switching, being larger on
average when participants switched from putatively more familiar
(i.e., addition or multiplication) to less familiar (i.e., subtraction or
division) tasks rather than vice versa. This overall pattern held both
for switching between tasks that involved low rule complexity and
for switching between tasks that involved high rule complexity.
Thus, consistent with our task-familiarity hypothesis, it appears in
some respects that perhaps the rule-activation stage takes longer to
enable the rules of unfamiliar tasks or to disable the rules of
familiar tasks.
Concomitantly, we obtained more evidence against the TSI
hypothesis. As proposed by Allport et al. (1994), the TSI hypoth-
esis implies that, on average, switching from more familiar (e.g.,
color-word reading) to less familiar (e.g., ink-color naming) tasks
should take less time than switching in the opposite direction.
Nevertheless, during Experiment 3, familiar-to-unfamiliar task
switching tended to take more time than unfamiliar-to-familiar
switching. It may therefore be concluded that TSI is not a general
salient phenomenon in task switching or that the dynamics of TSI
do not consistently conform to Allport et al.'s (1994) claims.
Instead, under at least some conditions, contributions by separable
executive control processes to switching-time costs appear to
predominate.
Yet, in some other respects, Experiment 3 yielded inconclusive
data. Although consistent with the task-familiarity hypotheses, the
overall asymmetry of task switching found here did not reach a
compelling level of reliability. There was considerable between-
subjects variance in the prior-task and current-task familiarity
effects on mean switching-time costs. One possible source of this
variability could be systematic individual differences in partici-
pants' past mathematics and science training. Because of such
differences, our initial assumptions that addition problems are
significantly more familiar than subtraction problems and that
multiplication problems are significantly more familiar than divi-
sion problems may not hold across all participants. If so, then
perhaps the task-familiarity hypothesis is still tenable, but further
research is needed to test it under more relevant conditions.
Another problematic result of Experiment 3, similar to what
occurred in Experiment 2, concerns the time cost of switching
from subtraction to addition problems accompanied by plus signs.
We found that, on average, this switching-time cost was only 29
ms, even though there was a very short RSI between problems.
The small magnitude of this mean time cost suggests that switch-
ing to an explicitly cued and extremely familiar task such as
arithmetic addition may not always require rule activation per se.
Instead, perhaps the rules for solving signed addition problems—
like the rules for reading familiar printed words—are permanently
enabled in procedural long-term memory, thereby requiring the
rule-activation stage of executive control to take little or no extra
time for fully enabling them. In light of these considerations, we

Experiment 4
• Pattern classification: low/high complexity, stimulus discrimination
EXECUTIVE CONTROL PROCESSES 787
Table 5
Results of Experiment 4
Trial-blocktype
Repetitive
Alternating
Rulecomplexity
Low
Low
Low
LowHigh
High
Low
LowLow
Low
High
High
Relevant perceptual
Prior task
Size
Shading
Shape
NumerositySize and shading
Shape and numerosity
Shading
SizeNumerosity
Shape
Shape and numerosity
Size and shading
dimensions
Current task
Size
Shading
Shape
NumerositySize and shading
Shape and numerosity
Size
ShadingShape
Numerosity
Size and shading
Shape and numerosity
MeanRT (ms)
1,030
705
865
6931,038
1,108
1,532
1,3801,357
1,462
2,468
2,841
Errorrate (%)
3.8
3.0
2.8
2.33.3
4.0
6.6
3.14.5
3.1
9.9
13.7
Svvitching-timc cost (ms)
502
675492
769
1,430
1.733
Note. Mean switching-time costs were calculated by subtracting mean reaction times (RTs) on repetitive-task blocks from mean RTs on alternating-task
blocks. Prior task refers to the task performed on the immediately preceding trial, and current task refers to the task for which data arc reported.
Experiment 1, in which the overall mean switching-time cost was
975 ms for visual pattern-classification tasks. Again, it appears that
as our stage model of executive control assumes, task switching
was probably mediated by goal-shifting and rule-activation stages.
Effects of rule complexity. Rule complexity affected mean RTs
during both repetitive-task and alternating-task blocks (see Figure
10, left panel). As before (Experiment 1), high-complexity rules
yielded slower pattern-classification responses than low-
complexity rules (mean difference = 736 ms, SE = 47 ms),
t(l2) = 15.8,p < .0001. The magnitude of this effect on mean RTs
during repetitive-task blocks (viz., 250 ms) presumably manifests
how much longer judgment and response selection took with
high-complexity (i.e.. bidimensional) than with low-complexity
(i.e., unidimensional) classification rules. For reasons already
mentioned, we again assume that an equivalent lengthening of
these task processes occurred during alternating-task blocks.
Nevertheless, during alternating-task blocks, rule complexity
had a larger total effect. As a result, switching-time costs were
reliably greater for the pattern-classification tasks with high-
complexity rules than for those with low-complexity rules (mean
difference = 972 ms, SE = 51 ms), f(18) = 19.1. p < .0001.
Again, this helps demonstrate the existence of a rule-activation
stage in executive control that enables task processes such as
response selection.
4000-
E 3000
4000iH Alternating-Task Blocks
• Repetitive-Task Blocks
B Alternating-Task Blocks
• Repetitive-Task Blocks
low highRule Complexity
low highStimulus Discriminability
Figure 10. Results of Experiment 4. Left: Mean reaction times (RTs) as a function of rule complexity and
trial-block type. Standard errors (lines extending above vertical RT bars) are based on the interaction among
block type, rule complexity, and participants. Right: Mean RTs as a function of stimulus discriminability and
trial-block type for the size and shape classification tasks. Standard errors are based on the interaction among
block type, stimulus discriminability, and participants.
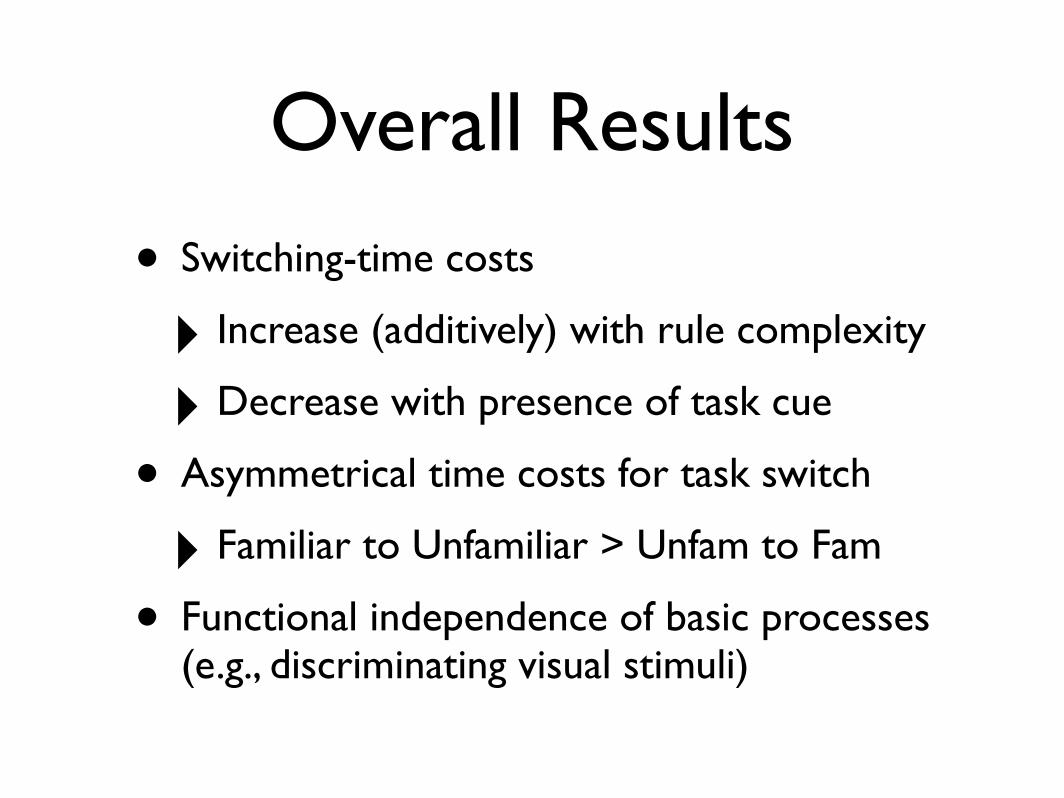
Overall Results
• Switching-time costs
‣ Increase (additively) with rule complexity
‣ Decrease with presence of task cue
• Asymmetrical time costs for task switch
‣ Familiar to Unfamiliar > Unfam to Fam
• Functional independence of basic processes (e.g., discriminating visual stimuli)

Their Model
• Accounts for:
‣ Behavioral results
‣ Counterintuitive Stroop effects from Allport et al. (1994)

Fun Fact