task 5 final report - soffit - florida building · 1 of 35 task 5 final report (structural and...
TRANSCRIPT
1 of 35
Task 5 Final Report (Structural and Wind-Driven Rain Resistance of Soffits) Fiscal Year 2011/2012 Scope of Work
Forrest J. Masters, Audra A. Kiesling
Department of Civil and Coastal Engineering, University of Florida, Gainesville, Florida 1. DISCLAIMER Results should be considered preliminary. They are provided for the express purpose of documenting the progress made on the project during FY 2011-12. The authors anticipate releasing final results and recommendations to the Hurricane Research Advisory Committee or Soffit Workgroup. 2. SCOPE OF WORK Substantial progress has been made in strengthening homes in hurricane-prone regions, such as the state of Florida. However, failure of soffits has still been seen even after these improvements were implemented. The failure of these components allows for not only change in internal pressure, but also the intrusion of occasionally substantial amounts of water. These problems looked at separately and as a combination may cause considerable damage to a residential structure. In response to the above-mentioned issues, the University of Florida was tasked to conduct both a wind resistance study as well as a wind-driven rain study of soffit systems. The task given was to: Conduct studies of structural and wind-driven rain resistance of residential soffits. Expand testing conducted in prior fiscal years on vinyl and aluminum soffits to fiber cement board, stucco/lath and other types of soffit systems, with emphasis on overhang lengths and corner details. Findings shall be combined with fiscal year 2010-2011 results to evaluate the adequacy of Florida Building Code, TAS 100(a)-95 and to make recommendations for revisions as appropriate. The contractor shall also study the air permeability / water penetration resistance of attic vent systems to develop recommendations for product performance and for evaluation and approval of vent products. The Contractor is authorized to spend up to $100,000 on Task 5. The Contractor shall provide and interim progress report and an ending report on this task and all sub-tasks. 3. EXECUTIVE SUMMARY This study addressed the wind load resistance, air permeability and wind-driven rain resistance of aluminum, vinyl, fiber cement board, OSB and stucco vented soffits. The primary focus was the structural resistance of the panel systems because panel blow out/in is the largest source of concern for unmanaged water ingress into the attic space. A pressure loading actuator system to apply quasi-static (ramp) and dynamic wind loading derived from wind tunnel measurements to conventional soffit systems in order to determine failure pressures. Straight and corner sections consisting of two overhang lengths (12 in and 24 in) were evaluated. The findings indicate that OSB and stucco soffits are expected to perform well over a wide range of service conditions. Fiber cement board soffit was the second best performer. The most flexible systems (i.e. aluminum and vinyl soffits) generally performed the worst. As expected, the 24 in overhang soffits fail at lower pressures than the 12 in counterparts. Corner sections appear to be more susceptible to wind loading than straight sections.
2 of 35
Expanded and improved guidance for installation and product approval is warranted. Our recommendations are detailed in the next section. Individual project details follow. 4. RECOMMENDATIONS Based on the findings, our recommendations are as follows:
1. Establish a separate testing application standard or a section in an existing testing application standard that specifically addresses structural wind load and wind-driven rain resistance for soffit panel systems. The rationale is twofold:
a. We acknowledge that the motivation for using a universal approach (i.e. TAS 202, 203) was to achieve a ‘level playing field’ for evaluating all building envelope products, however the lack of specific guidance for families of products is problematic—particularly for soffit panels, which differ from wall systems in that they are vented and oriented parallel to the ground.
b. Moreover, a review of the product approvals found that soffit materials are qualified under multiple tests, including ASTM D5206, ASTM E330, TAS 202-95 and/or TAS 203-95. TAS 100-95(a) is also used to evaluate soffit performance, however its applicability appears to extend only to establish water ingress requirements. Although the ASTMs and TASs establish similar requirements, allowing products to be qualified under different test procedures introduces experimental uncertainties associated variations between the test methods. This issue further reinforces the need to develop specific guidelines for testing soffit panel systems.
2. Comprehensive recommendations for creating/revising the wind load resistance evaluation procedure are provided below. Current requirements are also included, where relevant.
a. Include steady and time-varying load sequences. i. Quasi-static (ramp) or staircase (step-and-hold) pressure sequences are
both acceptable to recreate the steady load conditions. ii. The fatigue sequences may be taken from Tables 1625.4 and 1626 to
achieve consistency between wall and soffit dynamic loads, which are highly correlated. We note that the fatigue sequence in Table 1626 was determined from a peer-reviewed study performed by Texas Tech University.
b. Allow for the option of using high-fidelity, full-scale replication of pressure sequences obtained from wind tunnel modeling in addition to the rainflow analysis-derived fatigue sequences set forth in Tables 1625.4 and 1626. This approach is similar to the experimental procedure described in Sections 6 and 7.
c. Require testing of both straight and corner sections. Corner sections are not currently being evaluated. The results strongly indicate that the corner sections are the weak link, therefore we conclude that this issue represents a critical deficiency in the testing application standards Mandating testing of corner sections will also ensure that installation guidelines for corner details are publicly available for installers. Manufacturer-supplied instructions for corner installations were found to be essentially non-existent.
3 of 35
d. Require separate tests for common overhang lengths (1 ft and 2 ft). The support conditions change when intermediate nailing members are added. In most cases, the tributary area for a single center fastener will be twice that of the edge fastener. It is not clear if the manufacturers and engineers recognize this issue. At least one manufacturer specifies the same design pressure for multiple overhang lengths, which is at odds with the mechanics.
e. Stipulate failure criteria, which should include fastener pull-out, material pull-over and tearing, panel unlocking, plastic deformation and possibly, excessive deformation.
f. Test specimens should be constructed using mockups of the roof overhang and a wall surface. Fasteners should be installed using pneumatic guns, which is standard field practice. The wall ensures realistic gun alignment, which is an important consideration for panels susceptible to pull-over and tearing.
g. All components in the assembly should be specified. While this is generally the case, we note that the make and model of the channels used in vinyl and aluminum soffit were not found in the product approval documentation
Based on these recommendations, we conclude that updating current test requirements in the Code is warranted. 5. PROJECT DETAILS Given the time- and resource-consuming nature of full-scale testing of building systems, the Contractor set out to accomplish the following tasks during FY 2011-12:
1. Write and submit a paper to a peer-reviewed journal based on the outcomes of prior research directed at the performance of vinyl and aluminum soffit (accomplished; paper was also reviewed by industry; see Section 6)
2. Perform additional testing of fiber cement board, stucco and OSB soffits, which rounds out the major options for soffit systems in Florida (accomplished; see Section 7)
3. Perform testing to characterize the air-permeability of conventional soffit systems in order to relate water ingress to the static pressure drop across the panel. Goals 1 and 2 address the major source of water ingress through panels, i.e. panel blowout. This component addresses water ingress through an intact panel (initiated; see Section 8)
4. Investigate water ingress through roof vents (de-prioritized to complete tasks 1-3)
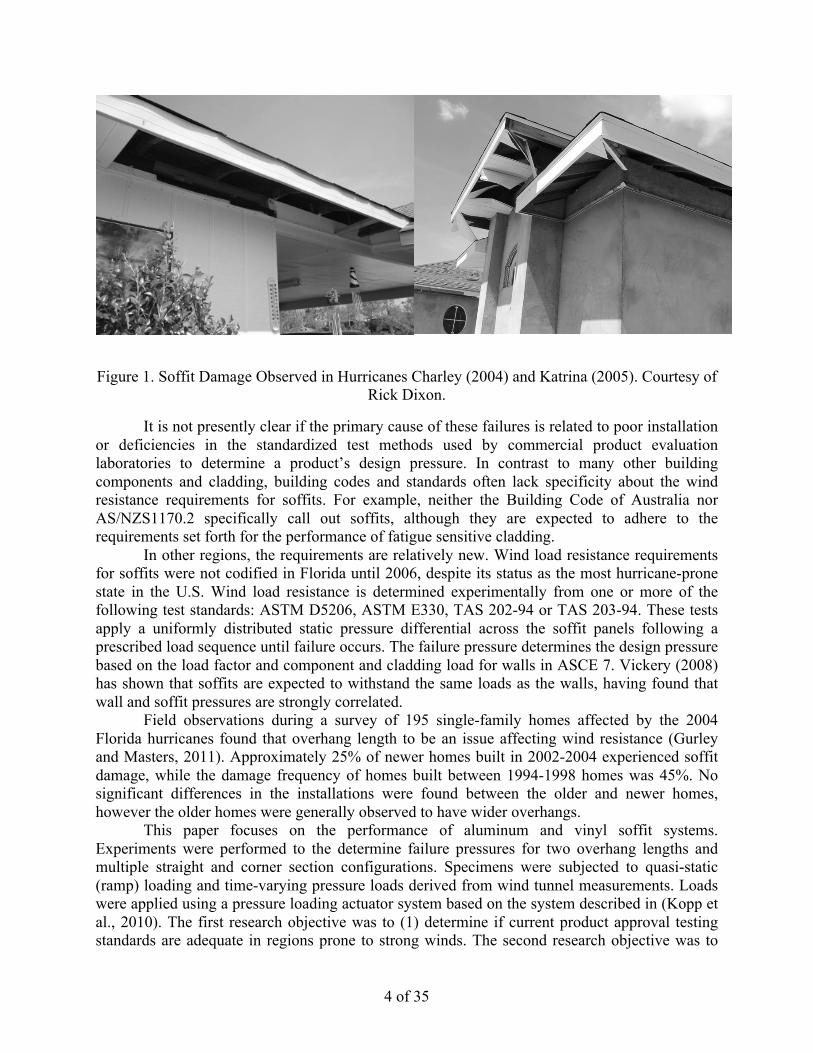
6. STRUCTURAL WIND RESISTANCE OF VINYL AND ALUMINUM SOFFIT The following section was written and submitted to Engineering Structures during FY2011-12 an original research paper. The following section details a companion study performed this year that addresses the performance of stucco, OSB and fiber cement board soffit. 6.1. Introduction Multiple post-storm damage assessments (Gurley and Masters, 2011; CTS, 2011; FEMA, 2005 and 2006) have documented failure of mechanical fastening and disengagement of panels, such as the representative failures shown in Figure 1. Although loss of soffit generally poses little threat to the overall structural performance of the building, missing and/or damaged panels can lead to significant water damage caused by wind-driven rain entering the attic space.
4 of 35
Figure 1. Soffit Damage Observed in Hurricanes Charley (2004) and Katrina (2005). Courtesy of Rick Dixon.
It is not presently clear if the primary cause of these failures is related to poor installation or deficiencies in the standardized test methods used by commercial product evaluation laboratories to determine a product’s design pressure. In contrast to many other building components and cladding, building codes and standards often lack specificity about the wind resistance requirements for soffits. For example, neither the Building Code of Australia nor AS/NZS1170.2 specifically call out soffits, although they are expected to adhere to the requirements set forth for the performance of fatigue sensitive cladding. In other regions, the requirements are relatively new. Wind load resistance requirements for soffits were not codified in Florida until 2006, despite its status as the most hurricane-prone state in the U.S. Wind load resistance is determined experimentally from one or more of the following test standards: ASTM D5206, ASTM E330, TAS 202-94 or TAS 203-94. These tests apply a uniformly distributed static pressure differential across the soffit panels following a prescribed load sequence until failure occurs. The failure pressure determines the design pressure based on the load factor and component and cladding load for walls in ASCE 7. Vickery (2008) has shown that soffits are expected to withstand the same loads as the walls, having found that wall and soffit pressures are strongly correlated. Field observations during a survey of 195 single-family homes affected by the 2004 Florida hurricanes found that overhang length to be an issue affecting wind resistance (Gurley and Masters, 2011). Approximately 25% of newer homes built in 2002-2004 experienced soffit damage, while the damage frequency of homes built between 1994-1998 homes was 45%. No significant differences in the installations were found between the older and newer homes, however the older homes were generally observed to have wider overhangs. This paper focuses on the performance of aluminum and vinyl soffit systems. Experiments were performed to the determine failure pressures for two overhang lengths and multiple straight and corner section configurations. Specimens were subjected to quasi-static (ramp) loading and time-varying pressure loads derived from wind tunnel measurements. Loads were applied using a pressure loading actuator system based on the system described in (Kopp et al., 2010). The first research objective was to (1) determine if current product approval testing standards are adequate in regions prone to strong winds. The second research objective was to
5 of 35
provide a baseline for damage thresholds for vulnerability models used in catastrophe models (cf. Vickery et al. 2009), which are used a wide range of applications including developing wind damage mitigation criteria for insurance rate setting and premium reductions. 6.2. Soffit Panels Six models of soffit panels were evaluated in this study. Table 1 contains information about the panels, including the material type (aluminum or vinyl), panel profile and the rated design pressure from product approval documentation found on the Miami-Dade Building Code Compliance Office (based on testing of others). IDs were assigned to each of the aluminum (A1, A2 and A3) and vinyl (V1, V2, V3) soffits.
Table 1. Test Specimen Matrix.
ID Material Profile Design Pressure (kPa)
305 mm Width 610 mm Width A1 Aluminum Triple 4 2.4 2.4 A2 Quad 4 2.4 1.1 A3 Triple 4 2.4 2.4 V1 Vinyl Triple 4 1.9 1.9 V2 Triple 4 2.3 1.1 V3 Double 5 1.9 1.9
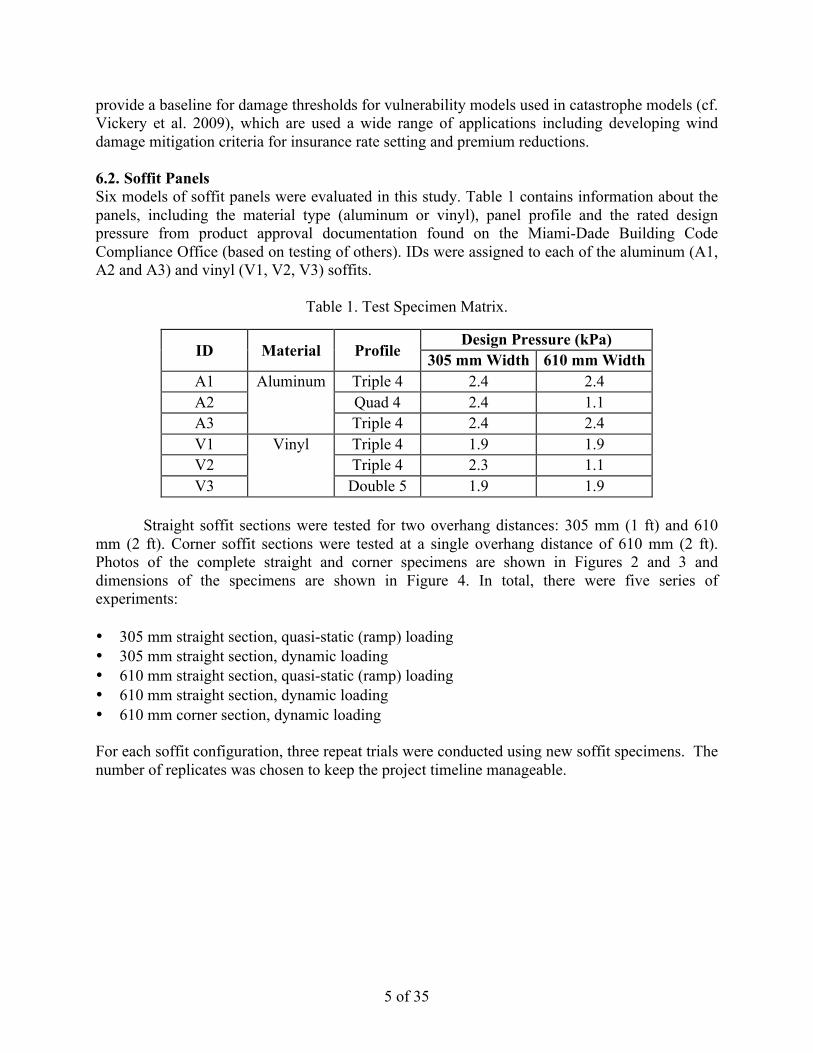
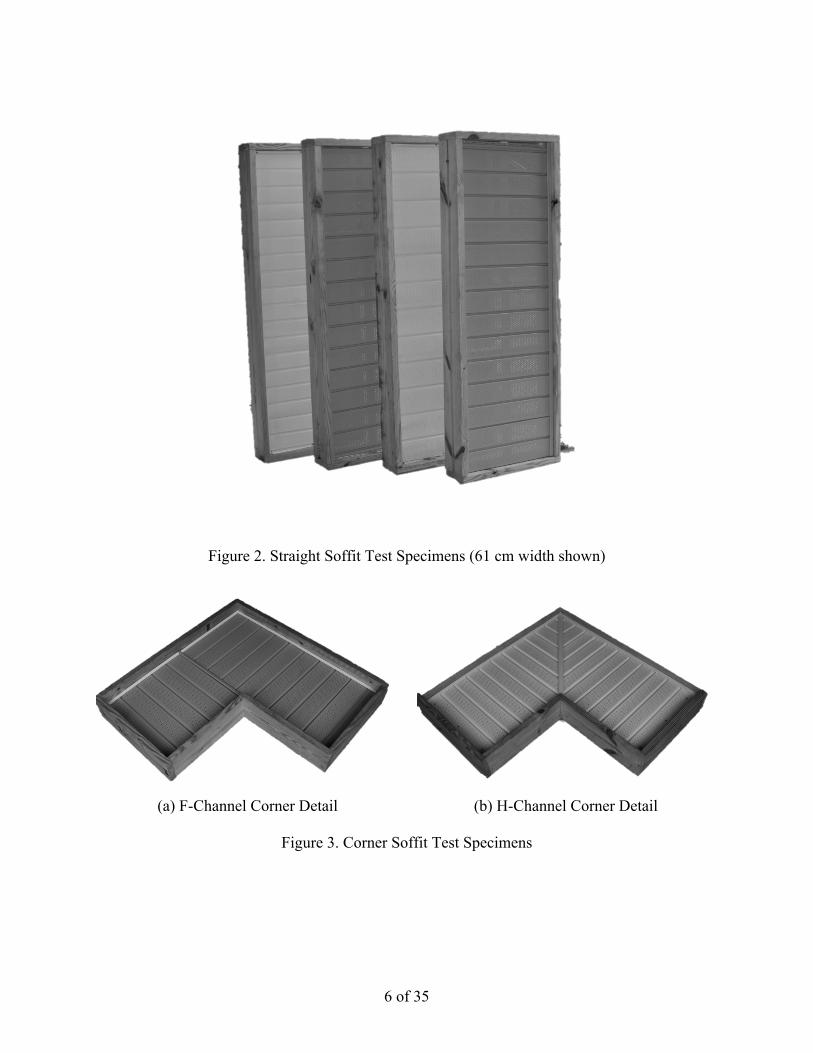
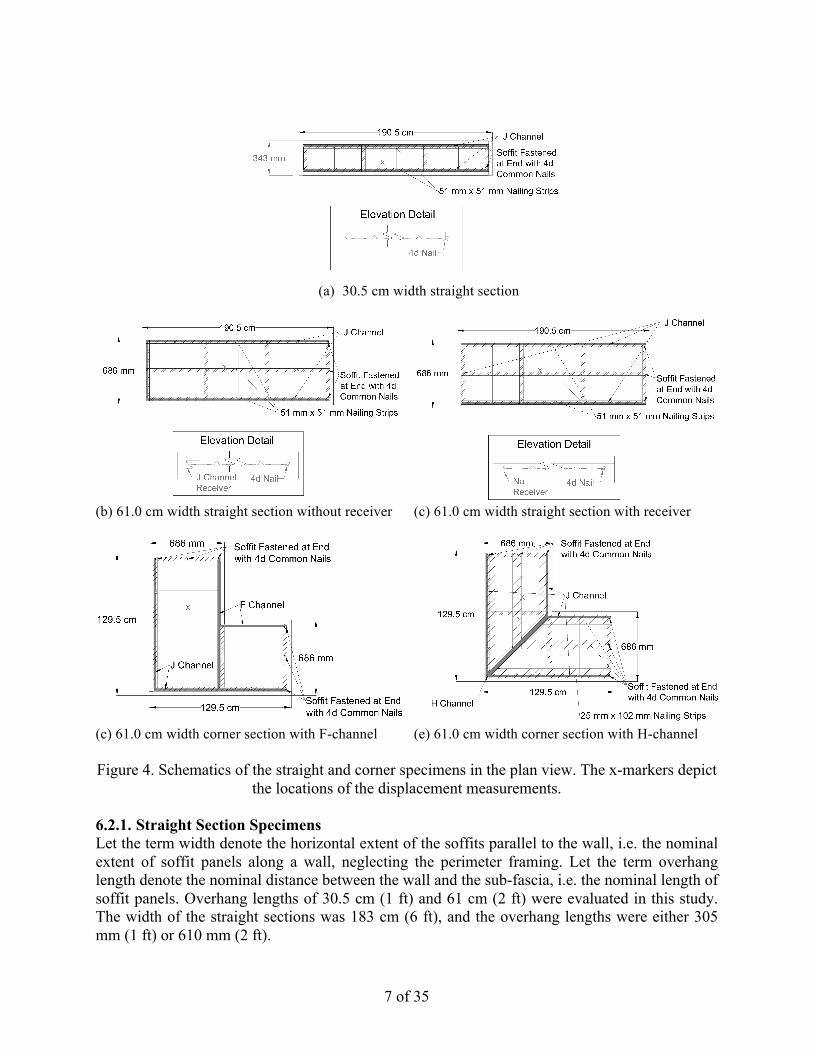
Straight soffit sections were tested for two overhang distances: 305 mm (1 ft) and 610 mm (2 ft). Corner soffit sections were tested at a single overhang distance of 610 mm (2 ft). Photos of the complete straight and corner specimens are shown in Figures 2 and 3 and dimensions of the specimens are shown in Figure 4. In total, there were five series of experiments: • 305 mm straight section, quasi-static (ramp) loading • 305 mm straight section, dynamic loading • 610 mm straight section, quasi-static (ramp) loading • 610 mm straight section, dynamic loading • 610 mm corner section, dynamic loading For each soffit configuration, three repeat trials were conducted using new soffit specimens. The number of replicates was chosen to keep the project timeline manageable.
6 of 35
Figure 2. Straight Soffit Test Specimens (61 cm width shown)
(a) F-Channel Corner Detail (b) H-Channel Corner Detail
Figure 3. Corner Soffit Test Specimens
7 of 35
(a) 30.5 cm width straight section
(b) 61.0 cm width straight section without receiver (c) 61.0 cm width straight section with receiver
(c) 61.0 cm width corner section with F-channel (e) 61.0 cm width corner section with H-channel Figure 4. Schematics of the straight and corner specimens in the plan view. The x-markers depict
the locations of the displacement measurements. 6.2.1. Straight Section Specimens Let the term width denote the horizontal extent of the soffits parallel to the wall, i.e. the nominal extent of soffit panels along a wall, neglecting the perimeter framing. Let the term overhang length denote the nominal distance between the wall and the sub-fascia, i.e. the nominal length of soffit panels. Overhang lengths of 30.5 cm (1 ft) and 61 cm (2 ft) were evaluated in this study. The width of the straight sections was 183 cm (6 ft), and the overhang lengths were either 305 mm (1 ft) or 610 mm (2 ft).
8 of 35
Each specimen consisted of two assemblies: (1) a reusable, lightweight mockup of a roof structure and (2) a single-use soffit system consisting of panels, channels and nailing strips that was discarded after testing. The roof structure was assembled from a 2x8 (38 mm x 184 mm) perimeter framing members with 2x4 (38 mm x 89 mm) members spaced at 61 cm on center along the width. 2x2 (38 mm x 38 mm) nailing strips were screwed to the bottom of the truss chords at end members, and in the case of the 61 cm overhangs, an intermediate nailing strip was added at midspan. J-channels (1.1.4 mm nominal thickness) were fastened to the outermost nailing strips with hand-driven smooth shank 4D common nails (3.175 mm shaft diameter and 9.525 mm head diameter). Six soffit panels were cut to length using a miter saw from a factory length section (3.7 m). Panels were cut 6.35 mm (1/4 in) short following manufacturers’ standard recommendations to allow for expansion (VSI, 2007). Six panels were required to build one assembly. One end was fastened to the nailing strip using 4D common nails (described above). The other end of the 305 mm overhang soffit was left unsupported to allow for pure bending (Figure 4a). The other end of the 61 cm overhang soffit was configured the same as the 305 mm overhang soffit (Figure 4b) or secured with a J-channel end receiver (Figure 4c; vinyl soffit only). In the latter configuration, the J-channel on the wall side was cut to 183 cm (6 ft) plus the width of the soffit, mitered at the corner and rotated to make a 90 degree bend, and then fastened to the 2x8 on the end. The decision to test the vinyl configuration with the end receiver was made after the free end condition was tested and found to be dominant failure location. This characteristic was not observed with the aluminum soffit. 6.2.2. Corner Section Specimens The corner soffit configurations are shown in Figures 4c-d. The first configuration, shown in Figures 3a and 4d, was asymmetric. A vertical oriented 1X4 was installed collinearly with one of the 2x8 wall framing members such that one leg of the soffit panel extending to the fascia board and the other leg terminated at the 1X4. F-channels mounted to both sides of the vertical 2x4 received the end of the panel on the short leg and supported the edge of the other panel. We envisioned this ‘F-channel’ configuration to be representative to be weaker than other alternatives. In the second (stronger) configuration, shown in Figures 3b and 4e, the soffit panels were joined with an H-channel fastened to 2x4 nailing strip that spanned the corner of the wall to intersection of the fascia boards. 6.2.3. Installation of Poly Sheeting The soffit panels were lined with a thin plastic (poly sheeting) to reduce the amount of airflow through the soffit panel to increase the maximum pressure produced by the pressure loading system. Installation of plastic sheeting was not necessary to achieve failure for the larger overhang soffits; panels failed before the maximum system pressure was reached. All panels were lined, however, to keep the testing procedure consistent. 6.3. Experimental Configuration 6.3.1. Testing Apparatus The principal experimental tool of this research was a physical simulation of a dynamic wind load waveform derived from a boundary layer wind tunnel study of soffit loading. Cook et al. (1988) led the first effort to replicate time-varying wind loads on building components with the development of the Building Research Establishment Real-time Wind Uniform Load Follower
9 of 35
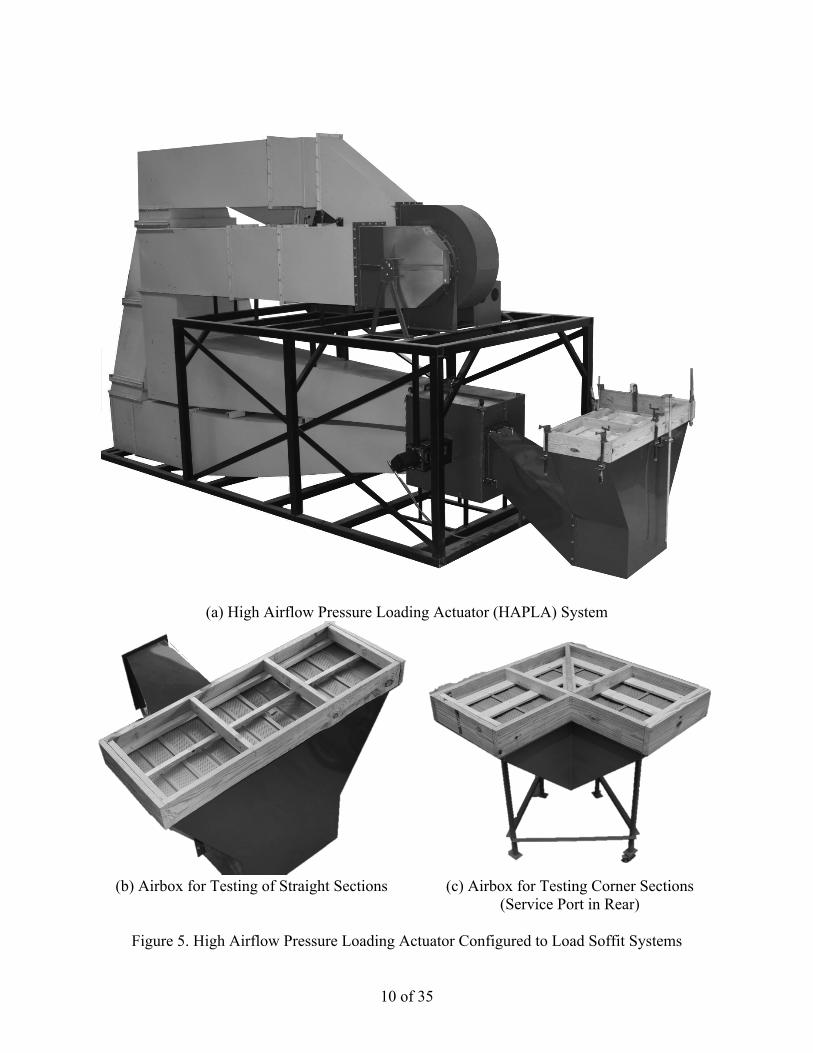
(BRERWULF). BRERWULF was a closed-loop control system that modulated the air exchange between a fan, the free atmosphere and a pressure chamber with an integrated, interchangeable test article. Kopp et al. (2010) developed the next generation of this system, the pressure loading actuator (PLA). A single PLA unit was loaned to the authors at the start of the project. Early attempts to apply loads on vented soffits were unsuccessful because the large porosity compromised the ability of the fan to produce large pressures. This outcome led the authors to develop the ‘High Airflow’ Pressure Loading Actuator (HAPLA) shown in Figure 5.
The HAPLA consists of two 75 HP Centrifugal Backward Inclined Class IV SWSI blowers that may be configured to operate in series or parallel; the latter is ideal for maximum airflow and was used here. The ducting connects to an air valve with five ports: supply (from fan), return (to fan), exhaust (open atmosphere), intake (open atmosphere) and service (connects to the test chamber). During suction loading, the valve modulates the amount of air traveling from the test chamber to the exhaust port. The valve disk is connected to a rotary actuation system comprised of a Metronix ARS2340 servo positioning controller, a Sumimoto Drive Technologies CHF 6135 Y-11 11:1 drive reduction and a Motor Technology Ltd. SBL-T6-2900 brushless servo motor. A two-pole resolver in the motor provides positioning feedback. Custom Labview 8.5 software operating on a National Instruments PXI system controls the pressure in the chamber through a 50 Hz PID controller that receives feedback from an Ashcroft XLdp pressure transducer attached to the test chamber that accommodates the test specimen. The HAPLA can simulate up to a 3 Hz waveform at pressures up to 6 kPa.
10 of 35
(a) High Airflow Pressure Loading Actuator (HAPLA) System
(b) Airbox for Testing of Straight Sections (c) Airbox for Testing Corner Sections
(Service Port in Rear)
Figure 5. High Airflow Pressure Loading Actuator Configured to Load Soffit Systems
11 of 35
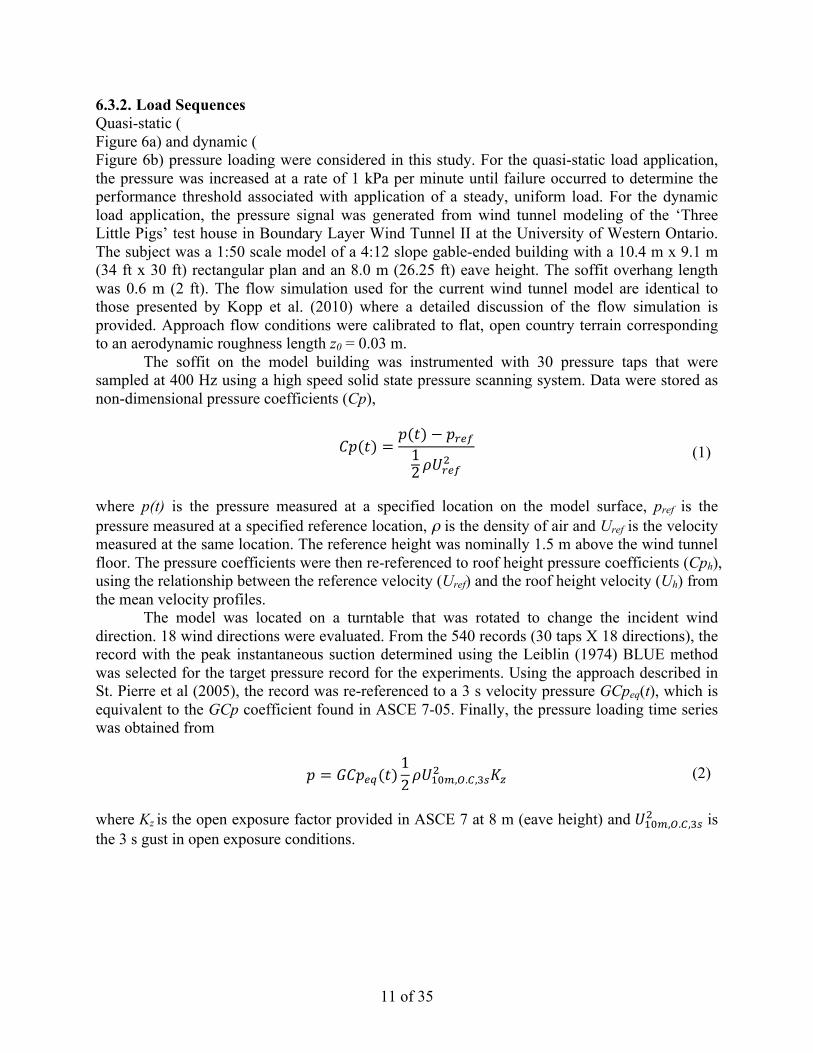
6.3.2. Load Sequences Quasi-static ( Figure 6a) and dynamic ( Figure 6b) pressure loading were considered in this study. For the quasi-static load application, the pressure was increased at a rate of 1 kPa per minute until failure occurred to determine the performance threshold associated with application of a steady, uniform load. For the dynamic load application, the pressure signal was generated from wind tunnel modeling of the ‘Three Little Pigs’ test house in Boundary Layer Wind Tunnel II at the University of Western Ontario. The subject was a 1:50 scale model of a 4:12 slope gable-ended building with a 10.4 m x 9.1 m (34 ft x 30 ft) rectangular plan and an 8.0 m (26.25 ft) eave height. The soffit overhang length was 0.6 m (2 ft). The flow simulation used for the current wind tunnel model are identical to those presented by Kopp et al. (2010) where a detailed discussion of the flow simulation is provided. Approach flow conditions were calibrated to flat, open country terrain corresponding to an aerodynamic roughness length z0 = 0.03 m. The soffit on the model building was instrumented with 30 pressure taps that were sampled at 400 Hz using a high speed solid state pressure scanning system. Data were stored as non-dimensional pressure coefficients (Cp),
𝐶𝑝(𝑡) =𝑝(𝑡)− 𝑝!"#12𝜌𝑈!"#
! (1)
where p(t) is the pressure measured at a specified location on the model surface, pref is the pressure measured at a specified reference location, ρ is the density of air and Uref is the velocity measured at the same location. The reference height was nominally 1.5 m above the wind tunnel floor. The pressure coefficients were then re-referenced to roof height pressure coefficients (Cph), using the relationship between the reference velocity (Uref) and the roof height velocity (Uh) from the mean velocity profiles. The model was located on a turntable that was rotated to change the incident wind direction. 18 wind directions were evaluated. From the 540 records (30 taps X 18 directions), the record with the peak instantaneous suction determined using the Leiblin (1974) BLUE method was selected for the target pressure record for the experiments. Using the approach described in St. Pierre et al (2005), the record was re-referenced to a 3 s velocity pressure GCpeq(t), which is equivalent to the GCp coefficient found in ASCE 7-05. Finally, the pressure loading time series was obtained from 𝑝 = 𝐺𝐶𝑝!"(𝑡)
12𝜌𝑈!"!,!.!,!!
! 𝐾! (2)
where Kz is the open exposure factor provided in ASCE 7 at 8 m (eave height) and 𝑈!"!,!.!,!!! is the 3 s gust in open exposure conditions.
12 of 35
(a) Quasi-Static (Ramp) Pressure Sequence
(b) Dynamic Pressure Sequence
Figure 6. Load Sequences
Test specimens were sequentially loaded with increasingly larger p-sequences until failure occurred. A p-sequence was created for each of the isotachs in the ASCE 7-05 [11] basic wind speed map, i.e. 40.2, 44.7, …, 89.4 m/s (90, 100, …, 200 mph). Finally, the model-scale
13 of 35
time increment (dt) was converted to its full-scale counterpart for each basic wind speed value from the reduced frequency relationship: 𝑓𝐿
𝑈 !"##!!"#$%=
𝑓𝐿𝑈 !"#$%
(3)
where f is the frequency, L is a reference dimension (𝐿!"#$% 𝐿!"##!!"#$% = 0.02) and U is equal to the eave height velocity Uh. After the p-sequences for each basic wind speed were scaled, they were resampled to 100
Hz and low-pass filtered with a 2 Hz corner frequency 3rd order butterworth filter to improve controllability. This operation also has the effect of attenuating the amplitude (peak) of the signal. Signals were then truncated to 4 min with the peak occurring at t = 180 s. It is noted that because of the reduced frequency relationship in Eq. 3 as the basic wind speed 𝑈!"!,!.!,!!! increases the
number of peaks in the p-sequence while the duration of these peaks is reduced. Table 2 provides a summary of the statistics from all 12 scaling wind speeds using in Eq. (2). In the final step, the
12 p-sequences were concatenated in order of increasing intensity to construct the ‘target’ pressure sequence shown in
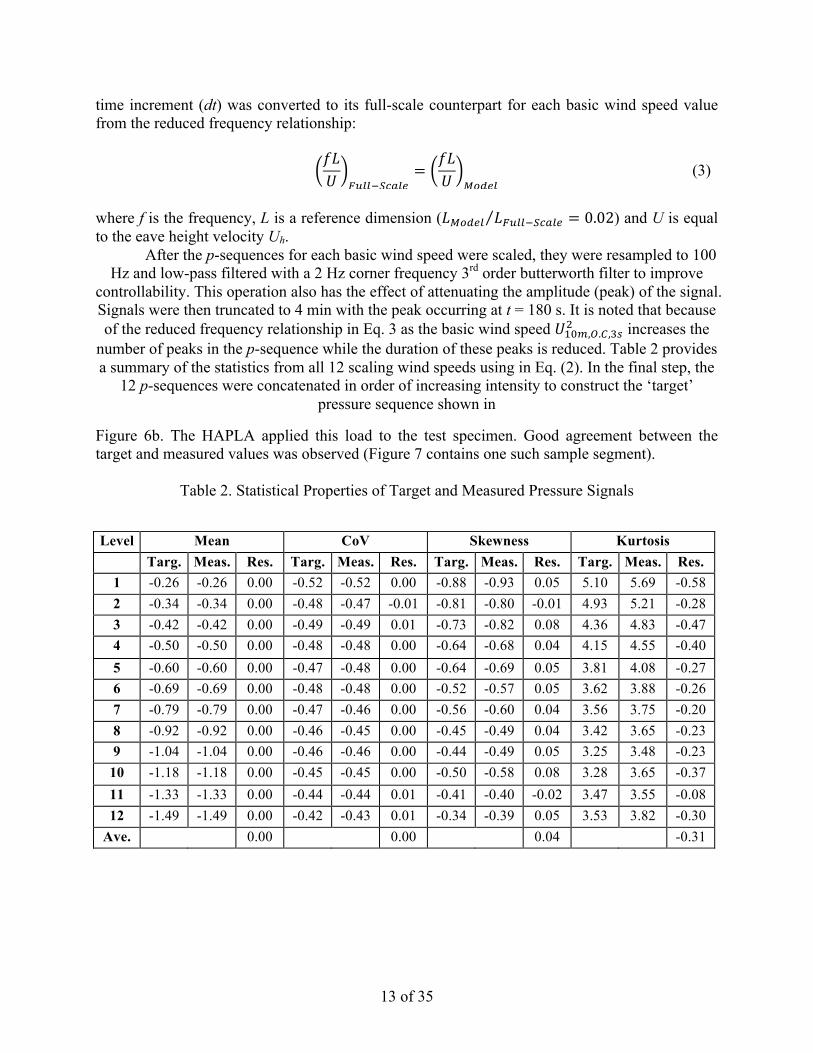
Figure 6b. The HAPLA applied this load to the test specimen. Good agreement between the target and measured values was observed (Figure 7 contains one such sample segment).
Table 2. Statistical Properties of Target and Measured Pressure Signals
Level Mean CoV Skewness Kurtosis
Targ. Meas. Res. Targ. Meas. Res. Targ. Meas. Res. Targ. Meas. Res. 1 -0.26 -0.26 0.00 -0.52 -0.52 0.00 -0.88 -0.93 0.05 5.10 5.69 -0.58 2 -0.34 -0.34 0.00 -0.48 -0.47 -0.01 -0.81 -0.80 -0.01 4.93 5.21 -0.28 3 -0.42 -0.42 0.00 -0.49 -0.49 0.01 -0.73 -0.82 0.08 4.36 4.83 -0.47 4 -0.50 -0.50 0.00 -0.48 -0.48 0.00 -0.64 -0.68 0.04 4.15 4.55 -0.40 5 -0.60 -0.60 0.00 -0.47 -0.48 0.00 -0.64 -0.69 0.05 3.81 4.08 -0.27 6 -0.69 -0.69 0.00 -0.48 -0.48 0.00 -0.52 -0.57 0.05 3.62 3.88 -0.26 7 -0.79 -0.79 0.00 -0.47 -0.46 0.00 -0.56 -0.60 0.04 3.56 3.75 -0.20 8 -0.92 -0.92 0.00 -0.46 -0.45 0.00 -0.45 -0.49 0.04 3.42 3.65 -0.23 9 -1.04 -1.04 0.00 -0.46 -0.46 0.00 -0.44 -0.49 0.05 3.25 3.48 -0.23
10 -1.18 -1.18 0.00 -0.45 -0.45 0.00 -0.50 -0.58 0.08 3.28 3.65 -0.37 11 -1.33 -1.33 0.00 -0.44 -0.44 0.01 -0.41 -0.40 -0.02 3.47 3.55 -0.08 12 -1.49 -1.49 0.00 -0.42 -0.43 0.01 -0.34 -0.39 0.05 3.53 3.82 -0.30
Ave. 0.00 0.00 0.04 -0.31
14 of 35
Figure 7. Representative Time Series. Measured data were low-pass filtered using a 5th order
low-pass Butterworth filter with a cutoff frequency of 7 Hz
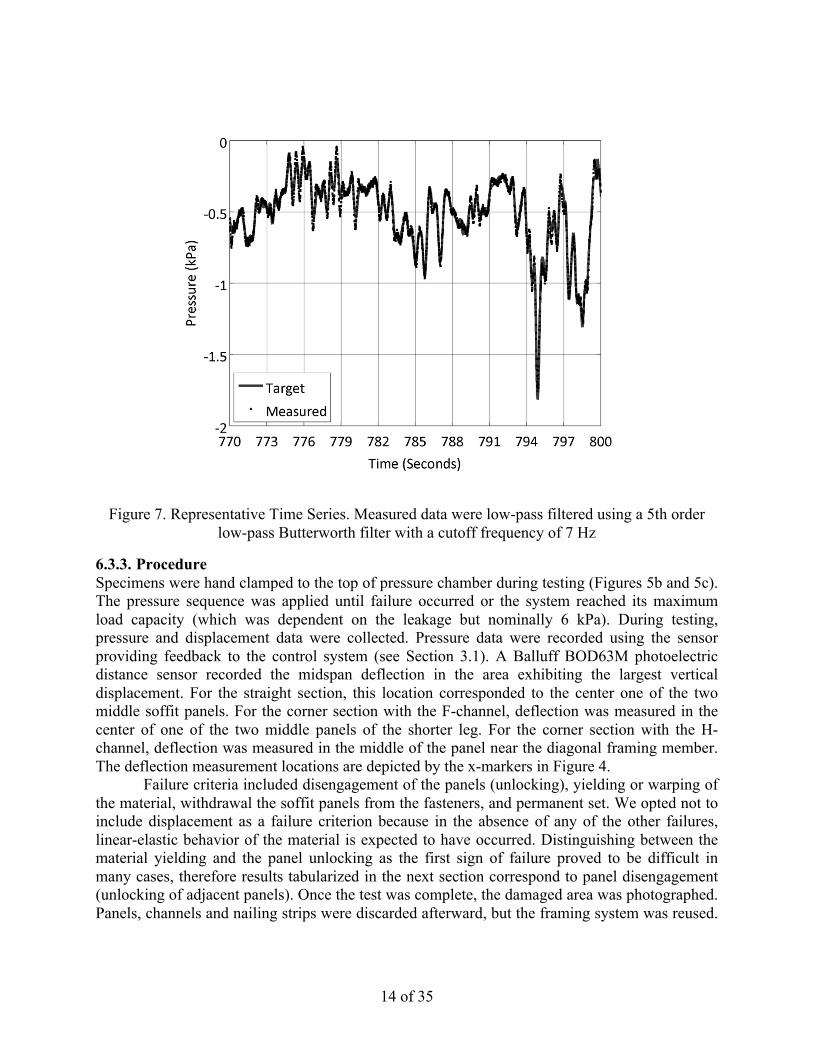
6.3.3. Procedure Specimens were hand clamped to the top of pressure chamber during testing (Figures 5b and 5c). The pressure sequence was applied until failure occurred or the system reached its maximum load capacity (which was dependent on the leakage but nominally 6 kPa). During testing, pressure and displacement data were collected. Pressure data were recorded using the sensor providing feedback to the control system (see Section 3.1). A Balluff BOD63M photoelectric distance sensor recorded the midspan deflection in the area exhibiting the largest vertical displacement. For the straight section, this location corresponded to the center one of the two middle soffit panels. For the corner section with the F-channel, deflection was measured in the center of one of the two middle panels of the shorter leg. For the corner section with the H- channel, deflection was measured in the middle of the panel near the diagonal framing member. The deflection measurement locations are depicted by the x-markers in Figure 4. Failure criteria included disengagement of the panels (unlocking), yielding or warping of the material, withdrawal the soffit panels from the fasteners, and permanent set. We opted not to include displacement as a failure criterion because in the absence of any of the other failures, linear-elastic behavior of the material is expected to have occurred. Distinguishing between the material yielding and the panel unlocking as the first sign of failure proved to be difficult in many cases, therefore results tabularized in the next section correspond to panel disengagement (unlocking of adjacent panels). Once the test was complete, the damaged area was photographed. Panels, channels and nailing strips were discarded afterward, but the framing system was reused.
15 of 35
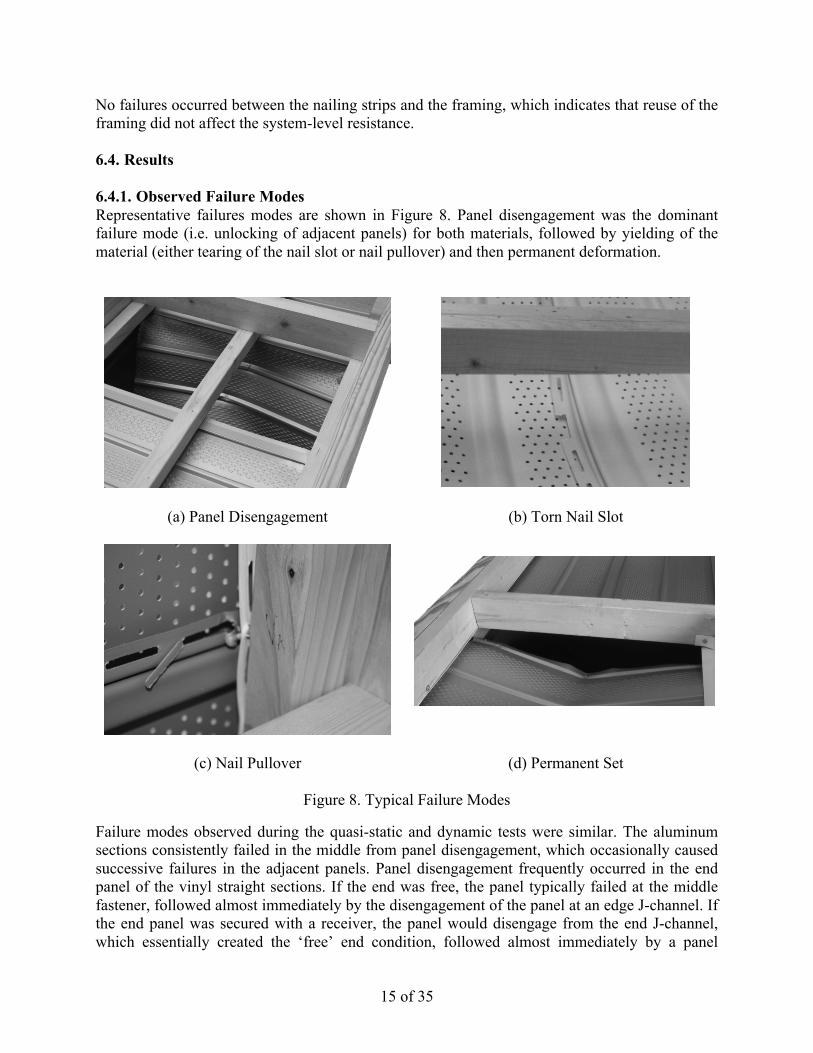
No failures occurred between the nailing strips and the framing, which indicates that reuse of the framing did not affect the system-level resistance. 6.4. Results 6.4.1. Observed Failure Modes Representative failures modes are shown in Figure 8. Panel disengagement was the dominant failure mode (i.e. unlocking of adjacent panels) for both materials, followed by yielding of the material (either tearing of the nail slot or nail pullover) and then permanent deformation.
(a) Panel Disengagement
(b) Torn Nail Slot
(c) Nail Pullover
(d) Permanent Set
Figure 8. Typical Failure Modes
Failure modes observed during the quasi-static and dynamic tests were similar. The aluminum sections consistently failed in the middle from panel disengagement, which occasionally caused successive failures in the adjacent panels. Panel disengagement frequently occurred in the end panel of the vinyl straight sections. If the end was free, the panel typically failed at the middle fastener, followed almost immediately by the disengagement of the panel at an edge J-channel. If the end panel was secured with a receiver, the panel would disengage from the end J-channel, which essentially created the ‘free’ end condition, followed almost immediately by a panel
16 of 35
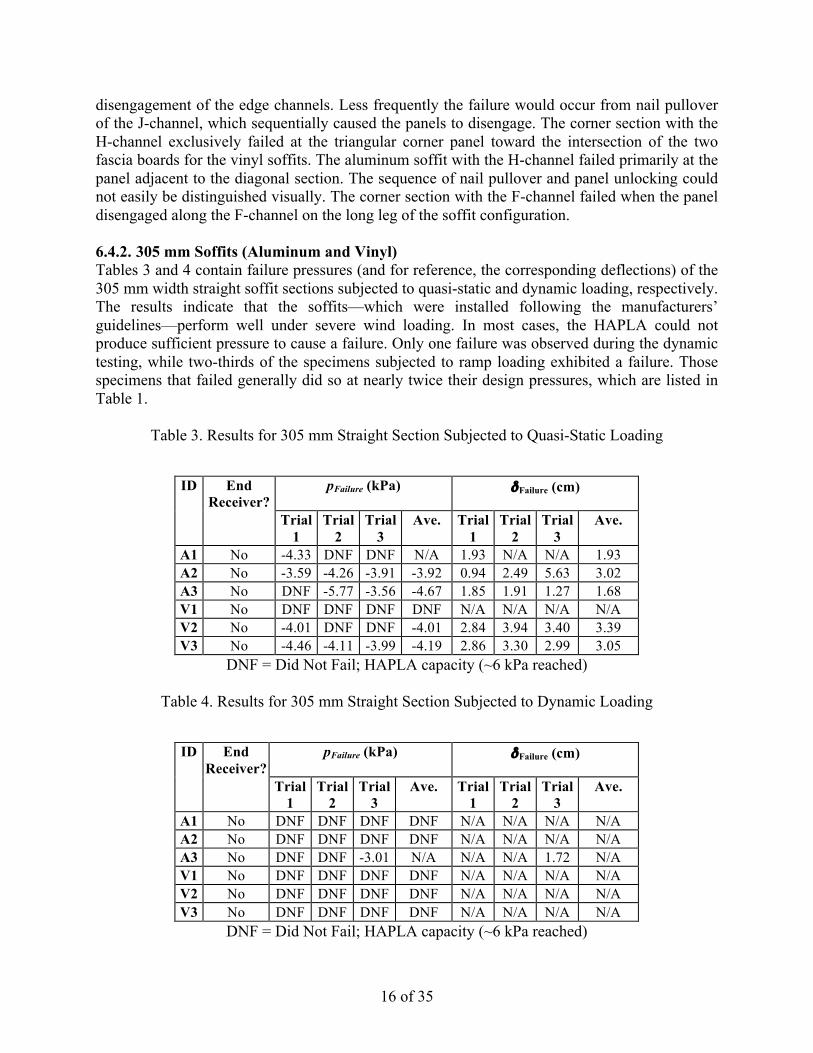
disengagement of the edge channels. Less frequently the failure would occur from nail pullover of the J-channel, which sequentially caused the panels to disengage. The corner section with the H-channel exclusively failed at the triangular corner panel toward the intersection of the two fascia boards for the vinyl soffits. The aluminum soffit with the H-channel failed primarily at the panel adjacent to the diagonal section. The sequence of nail pullover and panel unlocking could not easily be distinguished visually. The corner section with the F-channel failed when the panel disengaged along the F-channel on the long leg of the soffit configuration. 6.4.2. 305 mm Soffits (Aluminum and Vinyl) Tables 3 and 4 contain failure pressures (and for reference, the corresponding deflections) of the 305 mm width straight soffit sections subjected to quasi-static and dynamic loading, respectively. The results indicate that the soffits—which were installed following the manufacturers’ guidelines—perform well under severe wind loading. In most cases, the HAPLA could not produce sufficient pressure to cause a failure. Only one failure was observed during the dynamic testing, while two-thirds of the specimens subjected to ramp loading exhibited a failure. Those specimens that failed generally did so at nearly twice their design pressures, which are listed in Table 1.
Table 3. Results for 305 mm Straight Section Subjected to Quasi-Static Loading
ID End
Receiver? pFailure (kPa) δFailure (cm)
Trial 1
Trial 2
Trial 3
Ave. Trial 1
Trial 2
Trial 3
Ave.
A1 No -4.33 DNF DNF N/A 1.93 N/A N/A 1.93 A2 No -3.59 -4.26 -3.91 -3.92 0.94 2.49 5.63 3.02 A3 No DNF -5.77 -3.56 -4.67 1.85 1.91 1.27 1.68 V1 No DNF DNF DNF DNF N/A N/A N/A N/A V2 No -4.01 DNF DNF -4.01 2.84 3.94 3.40 3.39 V3 No -4.46 -4.11 -3.99 -4.19 2.86 3.30 2.99 3.05
DNF = Did Not Fail; HAPLA capacity (~6 kPa reached)
Table 4. Results for 305 mm Straight Section Subjected to Dynamic Loading
ID End
Receiver? pFailure (kPa) δFailure (cm)
Trial 1
Trial 2
Trial 3
Ave. Trial 1
Trial 2
Trial 3
Ave.
A1 No DNF DNF DNF DNF N/A N/A N/A N/A A2 No DNF DNF DNF DNF N/A N/A N/A N/A A3 No DNF DNF -3.01 N/A N/A N/A 1.72 N/A V1 No DNF DNF DNF DNF N/A N/A N/A N/A V2 No DNF DNF DNF DNF N/A N/A N/A N/A V3 No DNF DNF DNF DNF N/A N/A N/A N/A
DNF = Did Not Fail; HAPLA capacity (~6 kPa reached)
17 of 35
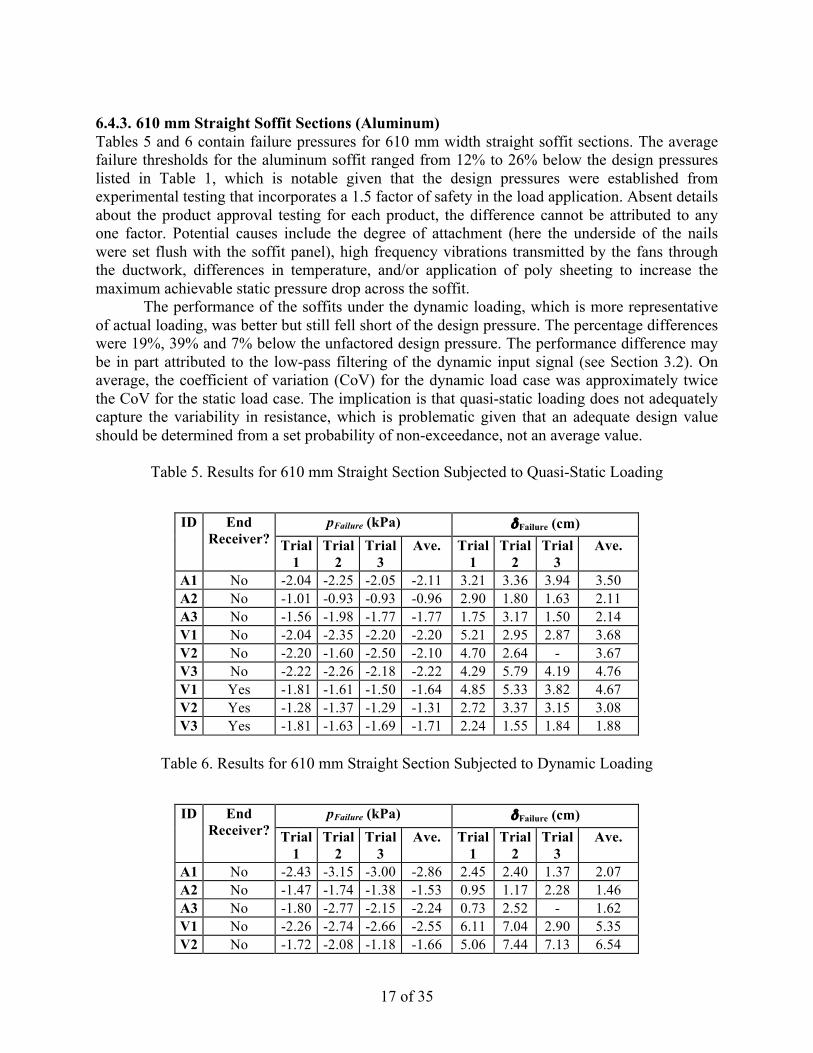
6.4.3. 610 mm Straight Soffit Sections (Aluminum) Tables 5 and 6 contain failure pressures for 610 mm width straight soffit sections. The average failure thresholds for the aluminum soffit ranged from 12% to 26% below the design pressures listed in Table 1, which is notable given that the design pressures were established from experimental testing that incorporates a 1.5 factor of safety in the load application. Absent details about the product approval testing for each product, the difference cannot be attributed to any one factor. Potential causes include the degree of attachment (here the underside of the nails were set flush with the soffit panel), high frequency vibrations transmitted by the fans through the ductwork, differences in temperature, and/or application of poly sheeting to increase the maximum achievable static pressure drop across the soffit. The performance of the soffits under the dynamic loading, which is more representative of actual loading, was better but still fell short of the design pressure. The percentage differences were 19%, 39% and 7% below the unfactored design pressure. The performance difference may be in part attributed to the low-pass filtering of the dynamic input signal (see Section 3.2). On average, the coefficient of variation (CoV) for the dynamic load case was approximately twice the CoV for the static load case. The implication is that quasi-static loading does not adequately capture the variability in resistance, which is problematic given that an adequate design value should be determined from a set probability of non-exceedance, not an average value.
Table 5. Results for 610 mm Straight Section Subjected to Quasi-Static Loading
ID End
Receiver? pFailure (kPa) δFailure (cm)
Trial 1
Trial 2
Trial 3
Ave. Trial 1
Trial 2
Trial 3
Ave.
A1 No -2.04 -2.25 -2.05 -2.11 3.21 3.36 3.94 3.50 A2 No -1.01 -0.93 -0.93 -0.96 2.90 1.80 1.63 2.11 A3 No -1.56 -1.98 -1.77 -1.77 1.75 3.17 1.50 2.14 V1 No -2.04 -2.35 -2.20 -2.20 5.21 2.95 2.87 3.68 V2 No -2.20 -1.60 -2.50 -2.10 4.70 2.64 - 3.67 V3 No -2.22 -2.26 -2.18 -2.22 4.29 5.79 4.19 4.76 V1 Yes -1.81 -1.61 -1.50 -1.64 4.85 5.33 3.82 4.67 V2 Yes -1.28 -1.37 -1.29 -1.31 2.72 3.37 3.15 3.08 V3 Yes -1.81 -1.63 -1.69 -1.71 2.24 1.55 1.84 1.88
Table 6. Results for 610 mm Straight Section Subjected to Dynamic Loading
ID End
Receiver? pFailure (kPa) δFailure (cm)
Trial 1
Trial 2
Trial 3
Ave. Trial 1
Trial 2
Trial 3
Ave.
A1 No -2.43 -3.15 -3.00 -2.86 2.45 2.40 1.37 2.07 A2 No -1.47 -1.74 -1.38 -1.53 0.95 1.17 2.28 1.46 A3 No -1.80 -2.77 -2.15 -2.24 0.73 2.52 - 1.62 V1 No -2.26 -2.74 -2.66 -2.55 6.11 7.04 2.90 5.35 V2 No -1.72 -2.08 -1.18 -1.66 5.06 7.44 7.13 6.54
18 of 35
V3 No -2.91 -1.79 -2.15 -2.28 4.92 8.10 7.39 6.80 V1 Yes -1.59 -1.50 -1.33 -1.47 2.85 3.55 3.08 3.16 V2 Yes -1.10 -1.15 -0.98 -1.08 1.82 2.04 1.94 1.93 V3 Yes -1.80 -1.26 -1.56 -1.54 3.73 2.59 2.70 3.01
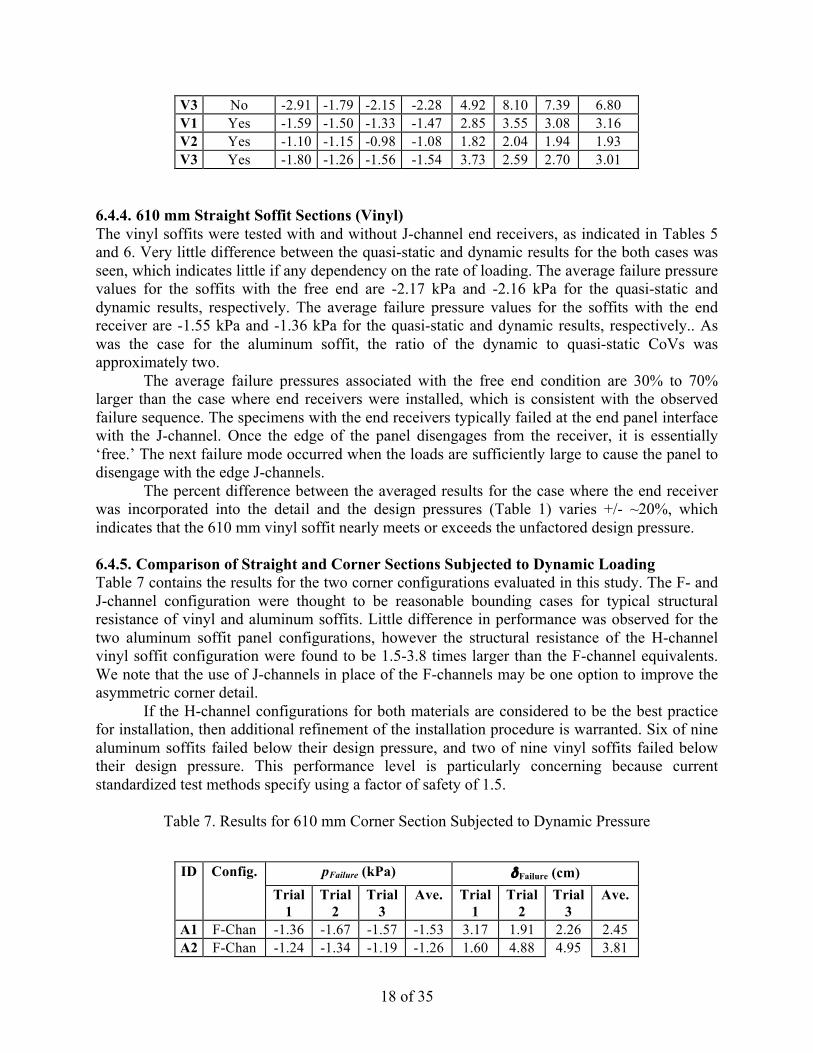
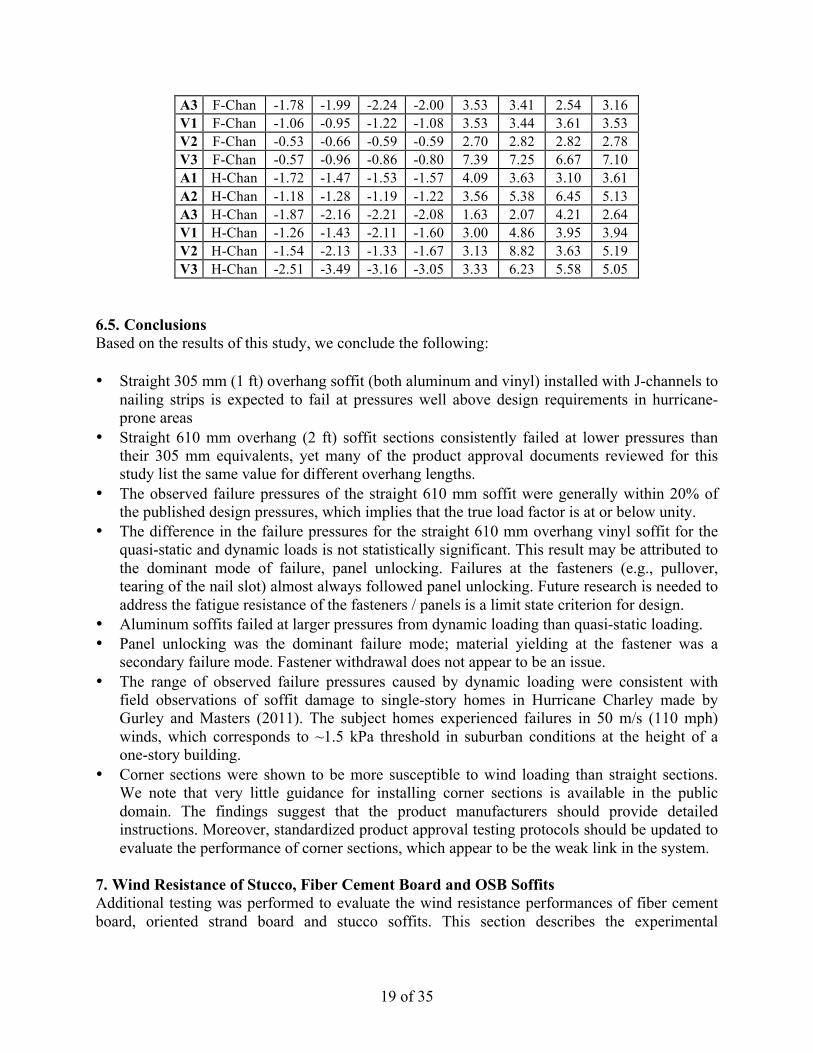
6.4.4. 610 mm Straight Soffit Sections (Vinyl) The vinyl soffits were tested with and without J-channel end receivers, as indicated in Tables 5 and 6. Very little difference between the quasi-static and dynamic results for the both cases was seen, which indicates little if any dependency on the rate of loading. The average failure pressure values for the soffits with the free end are -2.17 kPa and -2.16 kPa for the quasi-static and dynamic results, respectively. The average failure pressure values for the soffits with the end receiver are -1.55 kPa and -1.36 kPa for the quasi-static and dynamic results, respectively.. As was the case for the aluminum soffit, the ratio of the dynamic to quasi-static CoVs was approximately two. The average failure pressures associated with the free end condition are 30% to 70% larger than the case where end receivers were installed, which is consistent with the observed failure sequence. The specimens with the end receivers typically failed at the end panel interface with the J-channel. Once the edge of the panel disengages from the receiver, it is essentially ‘free.’ The next failure mode occurred when the loads are sufficiently large to cause the panel to disengage with the edge J-channels. The percent difference between the averaged results for the case where the end receiver was incorporated into the detail and the design pressures (Table 1) varies +/- ~20%, which indicates that the 610 mm vinyl soffit nearly meets or exceeds the unfactored design pressure. 6.4.5. Comparison of Straight and Corner Sections Subjected to Dynamic Loading Table 7 contains the results for the two corner configurations evaluated in this study. The F- and J-channel configuration were thought to be reasonable bounding cases for typical structural resistance of vinyl and aluminum soffits. Little difference in performance was observed for the two aluminum soffit panel configurations, however the structural resistance of the H-channel vinyl soffit configuration were found to be 1.5-3.8 times larger than the F-channel equivalents. We note that the use of J-channels in place of the F-channels may be one option to improve the asymmetric corner detail. If the H-channel configurations for both materials are considered to be the best practice for installation, then additional refinement of the installation procedure is warranted. Six of nine aluminum soffits failed below their design pressure, and two of nine vinyl soffits failed below their design pressure. This performance level is particularly concerning because current standardized test methods specify using a factor of safety of 1.5.
Table 7. Results for 610 mm Corner Section Subjected to Dynamic Pressure
ID Config. pFailure (kPa) δFailure (cm)
Trial 1
Trial 2
Trial 3
Ave. Trial 1
Trial 2
Trial 3
Ave.
A1 F-Chan -1.36 -1.67 -1.57 -1.53 3.17 1.91 2.26 2.45 A2 F-Chan -1.24 -1.34 -1.19 -1.26 1.60 4.88 4.95 3.81
19 of 35
A3 F-Chan -1.78 -1.99 -2.24 -2.00 3.53 3.41 2.54 3.16 V1 F-Chan -1.06 -0.95 -1.22 -1.08 3.53 3.44 3.61 3.53 V2 F-Chan -0.53 -0.66 -0.59 -0.59 2.70 2.82 2.82 2.78 V3 F-Chan -0.57 -0.96 -0.86 -0.80 7.39 7.25 6.67 7.10 A1 H-Chan -1.72 -1.47 -1.53 -1.57 4.09 3.63 3.10 3.61 A2 H-Chan -1.18 -1.28 -1.19 -1.22 3.56 5.38 6.45 5.13 A3 H-Chan -1.87 -2.16 -2.21 -2.08 1.63 2.07 4.21 2.64 V1 H-Chan -1.26 -1.43 -2.11 -1.60 3.00 4.86 3.95 3.94 V2 H-Chan -1.54 -2.13 -1.33 -1.67 3.13 8.82 3.63 5.19 V3 H-Chan -2.51 -3.49 -3.16 -3.05 3.33 6.23 5.58 5.05
6.5. Conclusions Based on the results of this study, we conclude the following: • Straight 305 mm (1 ft) overhang soffit (both aluminum and vinyl) installed with J-channels to
nailing strips is expected to fail at pressures well above design requirements in hurricane-prone areas
• Straight 610 mm overhang (2 ft) soffit sections consistently failed at lower pressures than their 305 mm equivalents, yet many of the product approval documents reviewed for this study list the same value for different overhang lengths.
• The observed failure pressures of the straight 610 mm soffit were generally within 20% of the published design pressures, which implies that the true load factor is at or below unity.
• The difference in the failure pressures for the straight 610 mm overhang vinyl soffit for the quasi-static and dynamic loads is not statistically significant. This result may be attributed to the dominant mode of failure, panel unlocking. Failures at the fasteners (e.g., pullover, tearing of the nail slot) almost always followed panel unlocking. Future research is needed to address the fatigue resistance of the fasteners / panels is a limit state criterion for design.
• Aluminum soffits failed at larger pressures from dynamic loading than quasi-static loading. • Panel unlocking was the dominant failure mode; material yielding at the fastener was a
secondary failure mode. Fastener withdrawal does not appear to be an issue. • The range of observed failure pressures caused by dynamic loading were consistent with
field observations of soffit damage to single-story homes in Hurricane Charley made by Gurley and Masters (2011). The subject homes experienced failures in 50 m/s (110 mph) winds, which corresponds to ~1.5 kPa threshold in suburban conditions at the height of a one-story building.
• Corner sections were shown to be more susceptible to wind loading than straight sections. We note that very little guidance for installing corner sections is available in the public domain. The findings suggest that the product manufacturers should provide detailed instructions. Moreover, standardized product approval testing protocols should be updated to evaluate the performance of corner sections, which appear to be the weak link in the system.
7. Wind Resistance of Stucco, Fiber Cement Board and OSB Soffits Additional testing was performed to evaluate the wind resistance performances of fiber cement board, oriented strand board and stucco soffits. This section describes the experimental
20 of 35
configuration and results from the experiments. In contrast to the vinyl and aluminum soffits, failure below design pressure does not appear to be a concern.
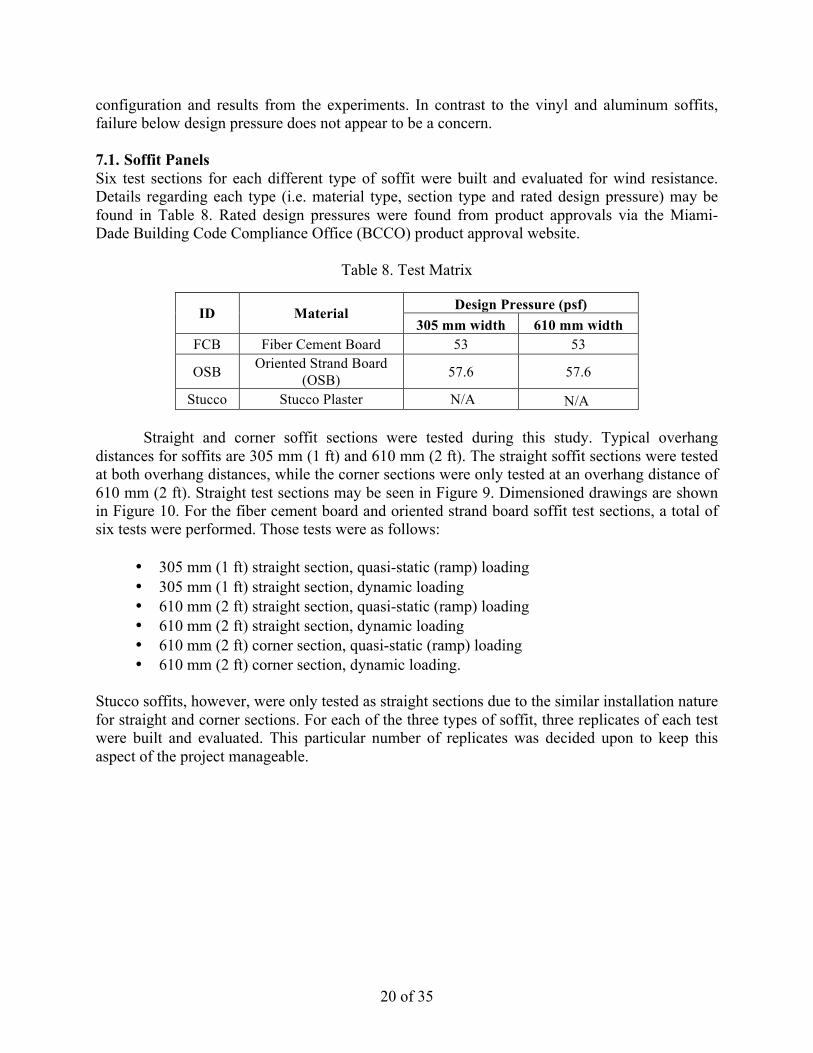
7.1. Soffit Panels Six test sections for each different type of soffit were built and evaluated for wind resistance. Details regarding each type (i.e. material type, section type and rated design pressure) may be found in Table 8. Rated design pressures were found from product approvals via the Miami-Dade Building Code Compliance Office (BCCO) product approval website.
Table 8. Test Matrix
ID Material Design Pressure (psf) 305 mm width 610 mm width
FCB Fiber Cement Board 53 53
OSB Oriented Strand Board (OSB) 57.6 57.6
Stucco Stucco Plaster N/A N/A Straight and corner soffit sections were tested during this study. Typical overhang distances for soffits are 305 mm (1 ft) and 610 mm (2 ft). The straight soffit sections were tested at both overhang distances, while the corner sections were only tested at an overhang distance of 610 mm (2 ft). Straight test sections may be seen in Figure 9. Dimensioned drawings are shown in Figure 10. For the fiber cement board and oriented strand board soffit test sections, a total of six tests were performed. Those tests were as follows:
• 305 mm (1 ft) straight section, quasi-static (ramp) loading • 305 mm (1 ft) straight section, dynamic loading • 610 mm (2 ft) straight section, quasi-static (ramp) loading • 610 mm (2 ft) straight section, dynamic loading • 610 mm (2 ft) corner section, quasi-static (ramp) loading • 610 mm (2 ft) corner section, dynamic loading.
Stucco soffits, however, were only tested as straight sections due to the similar installation nature for straight and corner sections. For each of the three types of soffit, three replicates of each test were built and evaluated. This particular number of replicates was decided upon to keep this aspect of the project manageable.
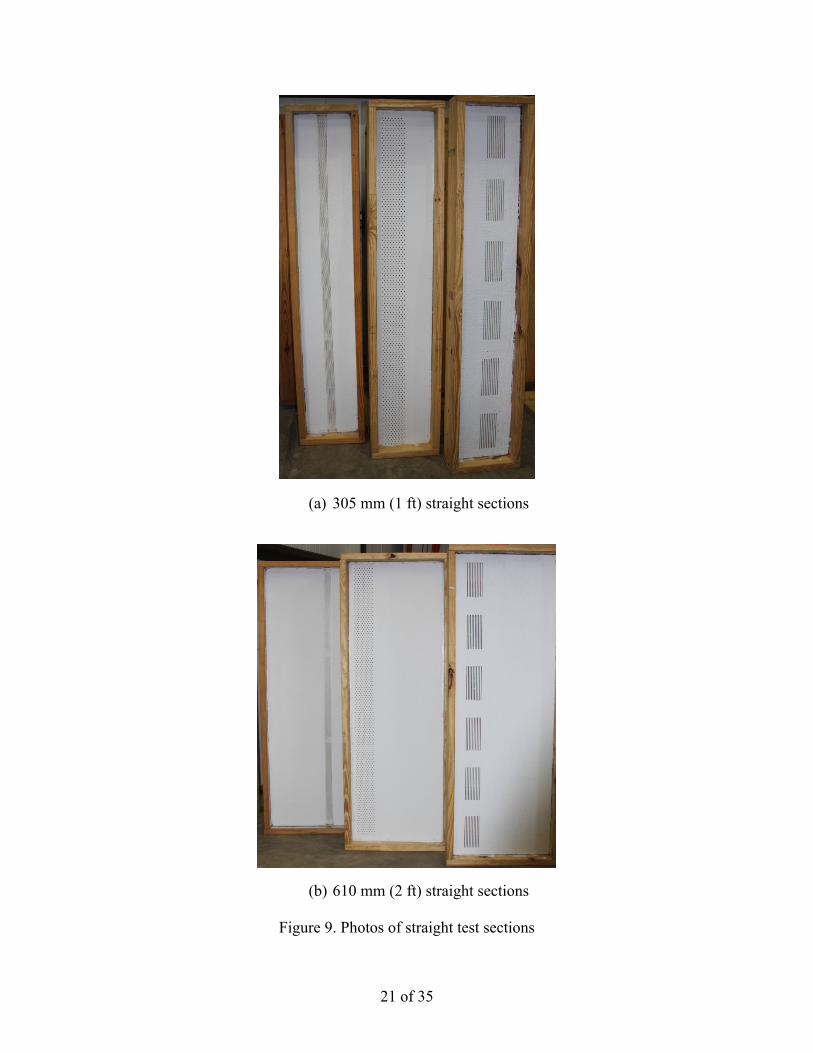
21 of 35
(a) 305 mm (1 ft) straight sections
(b) 610 mm (2 ft) straight sections
Figure 9. Photos of straight test sections
22 of 35
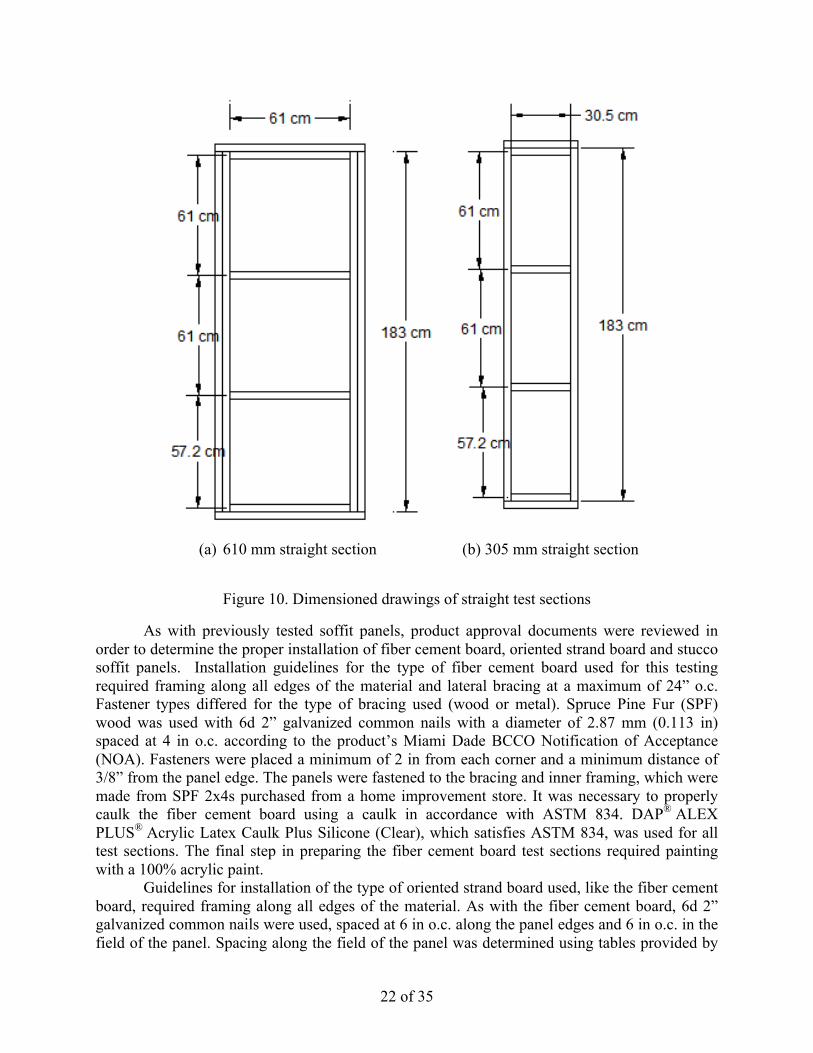
(a) 610 mm straight section (b) 305 mm straight section
Figure 10. Dimensioned drawings of straight test sections
As with previously tested soffit panels, product approval documents were reviewed in order to determine the proper installation of fiber cement board, oriented strand board and stucco soffit panels. Installation guidelines for the type of fiber cement board used for this testing required framing along all edges of the material and lateral bracing at a maximum of 24” o.c. Fastener types differed for the type of bracing used (wood or metal). Spruce Pine Fur (SPF) wood was used with 6d 2” galvanized common nails with a diameter of 2.87 mm (0.113 in) spaced at 4 in o.c. according to the product’s Miami Dade BCCO Notification of Acceptance (NOA). Fasteners were placed a minimum of 2 in from each corner and a minimum distance of 3/8” from the panel edge. The panels were fastened to the bracing and inner framing, which were made from SPF 2x4s purchased from a home improvement store. It was necessary to properly caulk the fiber cement board using a caulk in accordance with ASTM 834. DAP® ALEX PLUS® Acrylic Latex Caulk Plus Silicone (Clear), which satisfies ASTM 834, was used for all test sections. The final step in preparing the fiber cement board test sections required painting with a 100% acrylic paint.
Guidelines for installation of the type of oriented strand board used, like the fiber cement board, required framing along all edges of the material. As with the fiber cement board, 6d 2” galvanized common nails were used, spaced at 6 in o.c. along the panel edges and 6 in o.c. in the field of the panel. Spacing along the field of the panel was determined using tables provided by
23 of 35
APA in the product approval provided by the Florida Building Code. A 1/8 in gap was placed between joining pieces and following installation, the oriented strand board was properly caulked and painted. For all test sections, an inner frame constructed of 2x4s fit inside the outer frame constructed of 2x8s.
Installation specifications for stucco soffit panels were not available via the Florida Building Code Product Approval documentation; therefore guidance was sought from experts in the stucco and lath industry. Construction of the stucco soffits was completed by a licensed contractor following requirements set forth in ASTM C926 and ASTM C1063. A soffit vent, measuring 183 cm (6 ft) in length and 5.1 cm (2 in) in width, was placed in each of the test sections. Following construction, stucco test sections were caulked and painted with the caulk and paint used for fiber cement board and oriented strand board soffit test sections, in order to remain consistent.
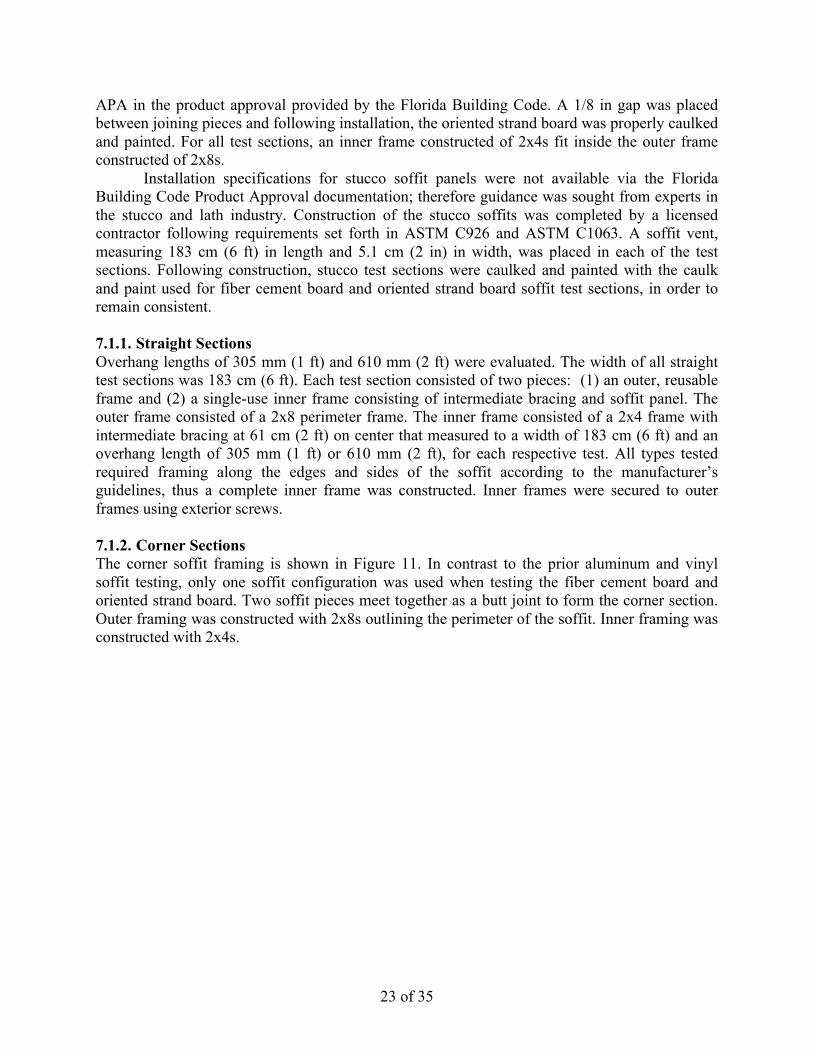
7.1.1. Straight Sections Overhang lengths of 305 mm (1 ft) and 610 mm (2 ft) were evaluated. The width of all straight test sections was 183 cm (6 ft). Each test section consisted of two pieces: (1) an outer, reusable frame and (2) a single-use inner frame consisting of intermediate bracing and soffit panel. The outer frame consisted of a 2x8 perimeter frame. The inner frame consisted of a 2x4 frame with intermediate bracing at 61 cm (2 ft) on center that measured to a width of 183 cm (6 ft) and an overhang length of 305 mm (1 ft) or 610 mm (2 ft), for each respective test. All types tested required framing along the edges and sides of the soffit according to the manufacturer’s guidelines, thus a complete inner frame was constructed. Inner frames were secured to outer frames using exterior screws. 7.1.2. Corner Sections The corner soffit framing is shown in Figure 11. In contrast to the prior aluminum and vinyl soffit testing, only one soffit configuration was used when testing the fiber cement board and oriented strand board. Two soffit pieces meet together as a butt joint to form the corner section. Outer framing was constructed with 2x8s outlining the perimeter of the soffit. Inner framing was constructed with 2x4s.
24 of 35
Figure 11. Dimensioned drawings of corner test sections
7.1.3. Installation of Poly Sheeting Poly sheeting was used to reduce the amount of airflow allowed through the venting of the soffits tested. Pieces of the poly sheeting were measured and cut to cover the vents on each soffit type. Use of the poly sheeting allowed the system to produce a maximum pressure of -7 kPa, although for some tests failure occurred before the maximum pressure was reached. However, poly sheeting was used for all of the quasi-static (ramp) and dynamic tests to keep the testing regimen consistent throughout the entire testing cycle. 7.2. Experimental Configuration 7.2.1. Testing Apparatus The testing apparatus was identical to the system described in Section 4 with some modifications made to the hardware to improve the flow characteristics. 7.2.2. Load Sequences Half of the straight and corner test sections constructed were subjected to quasi-static (ramp) loading. In this process, the pressure was increased at 1 kPa per minute until failure was reached, which led to the determination of the pressure at which the materials were no longer able to withstand a uniform, constant pressure. Dynamic loading was applied to the remaining test sections using the same pressure signal used for the aluminum and vinyl soffit testing. 7.2.3. Procedure Test sections were placed face down, in the same direction as if on an actual building, on the pressure chamber and secured using hand clamps. The respective pressure sequence (quasi-static or dynamic) was applied to the test section until failure occurred or the HAPLA system reached
25 of 35
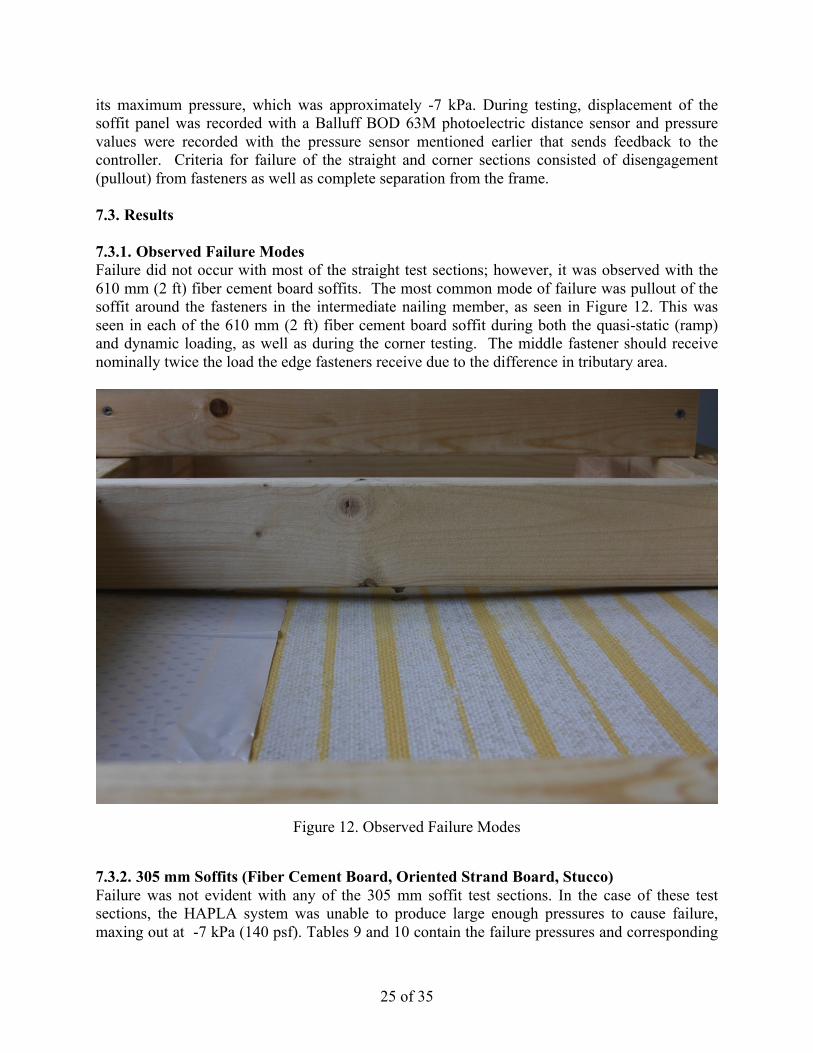
its maximum pressure, which was approximately -7 kPa. During testing, displacement of the soffit panel was recorded with a Balluff BOD 63M photoelectric distance sensor and pressure values were recorded with the pressure sensor mentioned earlier that sends feedback to the controller. Criteria for failure of the straight and corner sections consisted of disengagement (pullout) from fasteners as well as complete separation from the frame. 7.3. Results 7.3.1. Observed Failure Modes Failure did not occur with most of the straight test sections; however, it was observed with the 610 mm (2 ft) fiber cement board soffits. The most common mode of failure was pullout of the soffit around the fasteners in the intermediate nailing member, as seen in Figure 12. This was seen in each of the 610 mm (2 ft) fiber cement board soffit during both the quasi-static (ramp) and dynamic loading, as well as during the corner testing. The middle fastener should receive nominally twice the load the edge fasteners receive due to the difference in tributary area.
Figure 12. Observed Failure Modes
7.3.2. 305 mm Soffits (Fiber Cement Board, Oriented Strand Board, Stucco) Failure was not evident with any of the 305 mm soffit test sections. In the case of these test sections, the HAPLA system was unable to produce large enough pressures to cause failure, maxing out at -7 kPa (140 psf). Tables 9 and 10 contain the failure pressures and corresponding
26 of 35
deflections for the quasi-static (ramp) and dynamic loadings of the 305 mm soffit test sections, respectively. The results conclude that these 305 mm (1 ft) soffit panels—when installed to manufacturer’s guidelines—are able to withstand quasi-static (ramp) wind loads up to a maximum of -7 kPa (140 psf). These loads far exceed factored load requirements for low-rise buildings (nominally 7-8 kPa). Similar to the quasi-static loading, no mode of failure was observed on any of the 305 mm (1 ft) soffit panels during dynamic loading.
Table 9. Results of quasi-static (ramp) loading of 305 mm straight sections
ID pFAILURE(kPa) δ (cm) Trial 1 Trial 2 Trial 3 Avg. Trial 1 Trial 2 Trial 3 Avg.
FCB DNF DNF DNF DNF 7.75 1.83 0.78 3.45 OSB DNF DNF DNF DNF 2.48 3.07 2.81 2.79
Stucco DNF DNF DNF DNF 1.14 5.20 8.47 4.94
Table 10. Results of dynamic loading of 305 mm straight sections
ID pFAILURE(kPa) δ (cm) Trial 1 Trial 2 Trial 3 Avg. Trial 1 Trial 2 Trial 3 Avg.
FCB DNF DNF DNF DNF 5.61 5.37 4.84 5.27 OSB DNF DNF DNF DNF 3.84 2.76 2.01 2.87
Stucco DNF DNF DNF DNF 5.47 5.09 6.31 5.62 7.3.3. 610 mm Soffits (Fiber Cement Board) Fiber cement board soffits with an overhang length of 610 mm (2 ft) did not perform as well as the 305 mm (1 ft) soffits when subjected to quasi-static (ramp loading). Pullout of the board from the fasteners in the intermediate bracing occurred roughly around -1.5 kPa, with total failure occurring at an average maximum pressure of -5.5 kPa. Table 11 contains the maximum deflections and pressures for each of the three quasi-static tests, and Table 12 contains the results from dynamic loading. Design pressures for the fiber cement board soffit tested were +/- 53 psf, which corresponds to approximately +/- 2.8 kPa. Thus, even though failure did occur, it occurred above the design pressures specified for the product. Pullout of the board from the fasteners in the intermediate bracing was seen during the dynamic loading however, complete failure was not observed on the 610 mm (2 ft) fiber cement board soffit. 7.4. 610 mm Soffits (Oriented Strand Board) None of the 610 mm (2 ft) sections failed, reaching the maximum pressure of -7 kPa possible by the HAPLA system; though pullout of the soffit at one location in the intermediate bracing did begin to occur. This was observed on one of the three replicates. Design pressures for the OSB soffit product were +/- 57.6 psf, which corresponds to approximately +/- 2.9 kPa. Dynamic loading of the 610 mm (2 ft) oriented strand board soffit produced results similar to that of the quasi-static (ramp) loading. No failures occurred, with small deflections being the only data recorded.
27 of 35
7.5. 610 mm Soffits (Stucco) Quasi-static (ramp) loading of the 610 mm stucco soffits did not cause failure. Loading was applied to the test sections until the HAPLA system reached its maximum pressure of -7 kPa. Deflection was measured at the center of the middle section, created by the intermediate bracing. Small variations in deflection were present, which could be accounted for by the placement of the vent in the soffit frame. The deflections and pressures for quasi-static and dynamic loading may be found in Tables 11 and 12, respectively. As seen with the quasi-static (ramp) loading, no failures were observed.
Table 11. Results of quasi-static (ramp) loading of 610 mm straight sections
ID pFAILURE(kPa) δ (cm) Trial 1 Trial 2 Trial 3 Avg. Trial 1 Trial 2 Trial 3 Avg.
FCB -5.60 -5.10 -5.82 -5.51 119.76 112.40 112.31 114.82 OSB DNF DNF DNF DNF 0.83 1.49 0.94 1.08
Stucco DNF DNF DNF DNF 1.75 2.58 1.37 1.90
Table 12. Results of dynamic loading of 610 mm straight sections
ID pFAILURE(kPa) δ (cm) Trial 1 Trial 2 Trial 3 Avg. Trial 1 Trial 2 Trial 3 Avg.
FCB -4.45 - -4.51 -4.48 2.14 - 2.73 2.43 OSB DNF DNF DNF DNF 1.15 1.02 1.03 1.07
Stucco DNF DNF DNF DNF 0.84 0.94 - 0.89 7.5.1. 610 mm Soffits (FCB, Corner) Quasi-static (ramp) loading of the 610 mm (2 ft) FCB corner sections produced results similar to the 610 mm FCB straight sections. Failure was seen with each of the three replicates. Pullout of the FCB from the intermediate bracing occurred on the 610 mm x 121.9 cm (2 ft x4 ft) section but was not seen on the 610 mm x 610 mm (2 ft x 2 ft) section at approximately -4.6 kPa. 7.5.2. 610 mm Soffits (OSB, Corner) Quasi-static (ramp) loading of the 610 mm (2 ft) OSB corner sections also produced results similar to the 610 mm OSB straight sections tested prior to the corner sections. Failure did not occur, although small deflections were recorded.
Table 13. Results of quasi-static (ramp) loading of 610 mm corner sections
ID pFAILURE(kPa) δFAILURE(cm) Trial 1 Trial 2 Trial 3 Avg. Trial 1 Trial 2 Trial 3 Avg.
FCB -4.91 -4.23 - -4.57 1.06 1.08 * 1.07 OSB -7.05 -7.22 -7.21 -7.16 1.34 4.17 0.99 2.17
28 of 35
Table 14. Results of dynamic loading of 610 mm corner sections
ID pFAILURE(kPa) dFAILURE(cm) Trial 1 Trial 2 Trial 3 Avg. Trial 1 Trial 2 Trial 3 Avg.
FCB -4.32 -3.12 -3.16 -3.53 0.85 2.09 1.82 1.59 OSB DNF DNF DNF DNF 0.69 0.95 0.85 0.83
7.6. Conclusions In contrast to the aluminum and vinyl soffit sections, the OSB, stucco and fiber cement board systems generally performed adequately under steady and time-varying wind load conditions with the exception of the fiber cement board, which did not fail at 150% of the unfactored design pressure.
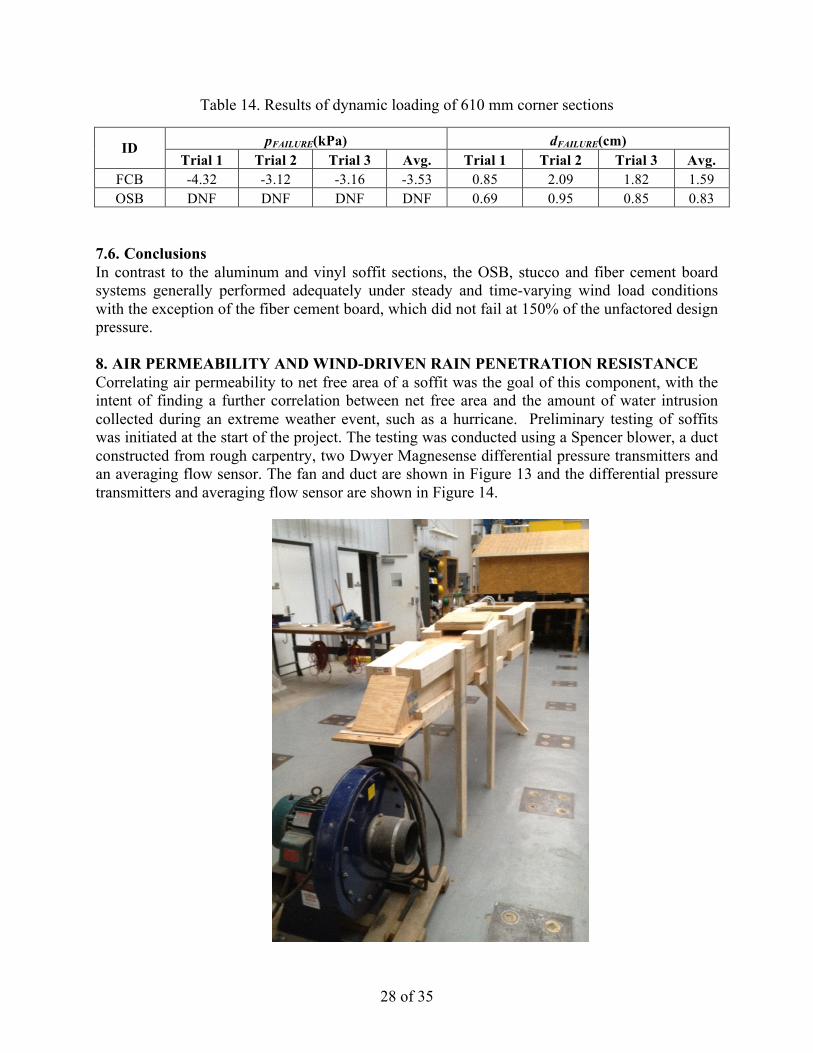
8. AIR PERMEABILITY AND WIND-DRIVEN RAIN PENETRATION RESISTANCE Correlating air permeability to net free area of a soffit was the goal of this component, with the intent of finding a further correlation between net free area and the amount of water intrusion collected during an extreme weather event, such as a hurricane. Preliminary testing of soffits was initiated at the start of the project. The testing was conducted using a Spencer blower, a duct constructed from rough carpentry, two Dwyer Magnesense differential pressure transmitters and an averaging flow sensor. The fan and duct are shown in Figure 13 and the differential pressure transmitters and averaging flow sensor are shown in Figure 14.
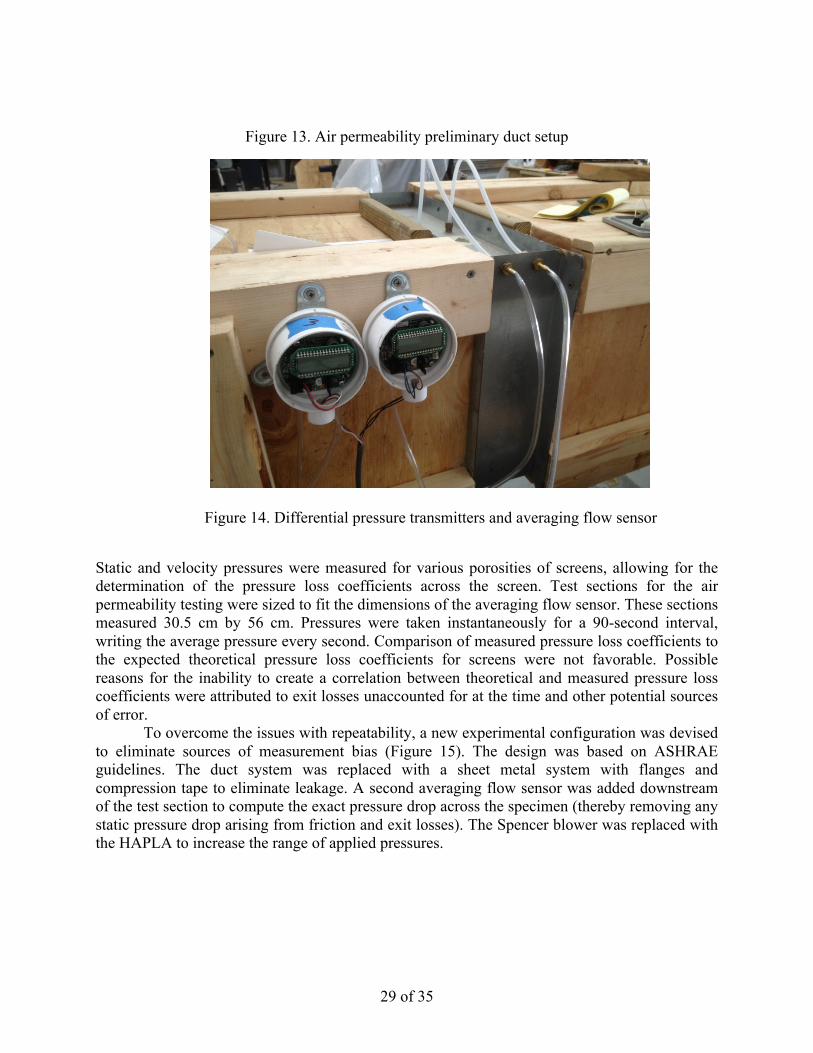
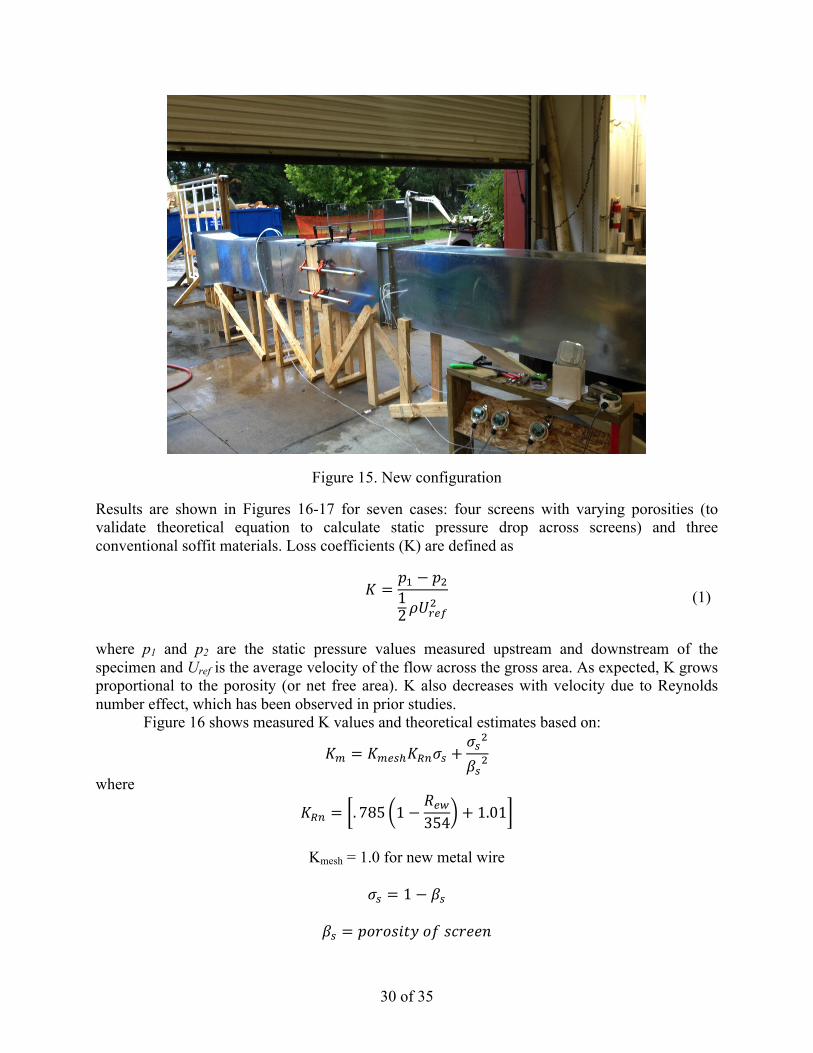
29 of 35
Figure 13. Air permeability preliminary duct setup
Figure 14. Differential pressure transmitters and averaging flow sensor
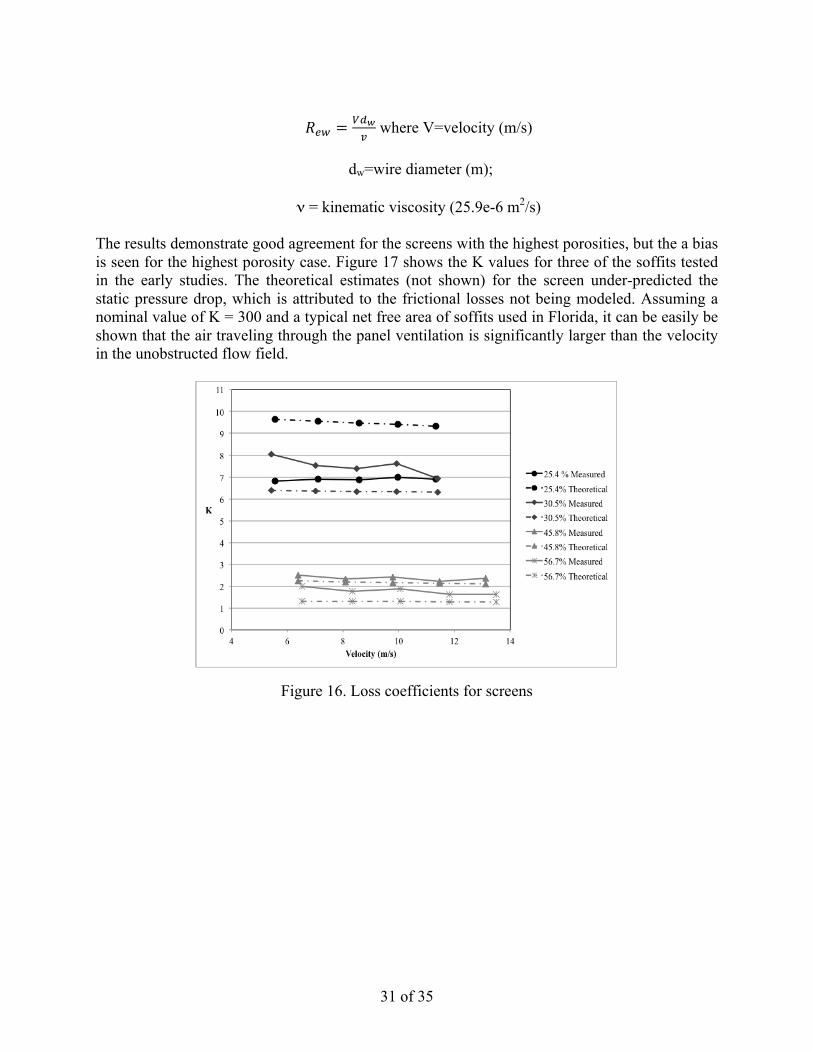
Static and velocity pressures were measured for various porosities of screens, allowing for the determination of the pressure loss coefficients across the screen. Test sections for the air permeability testing were sized to fit the dimensions of the averaging flow sensor. These sections measured 30.5 cm by 56 cm. Pressures were taken instantaneously for a 90-second interval, writing the average pressure every second. Comparison of measured pressure loss coefficients to the expected theoretical pressure loss coefficients for screens were not favorable. Possible reasons for the inability to create a correlation between theoretical and measured pressure loss coefficients were attributed to exit losses unaccounted for at the time and other potential sources of error. To overcome the issues with repeatability, a new experimental configuration was devised to eliminate sources of measurement bias (Figure 15). The design was based on ASHRAE guidelines. The duct system was replaced with a sheet metal system with flanges and compression tape to eliminate leakage. A second averaging flow sensor was added downstream of the test section to compute the exact pressure drop across the specimen (thereby removing any static pressure drop arising from friction and exit losses). The Spencer blower was replaced with the HAPLA to increase the range of applied pressures.
30 of 35
Figure 15. New configuration
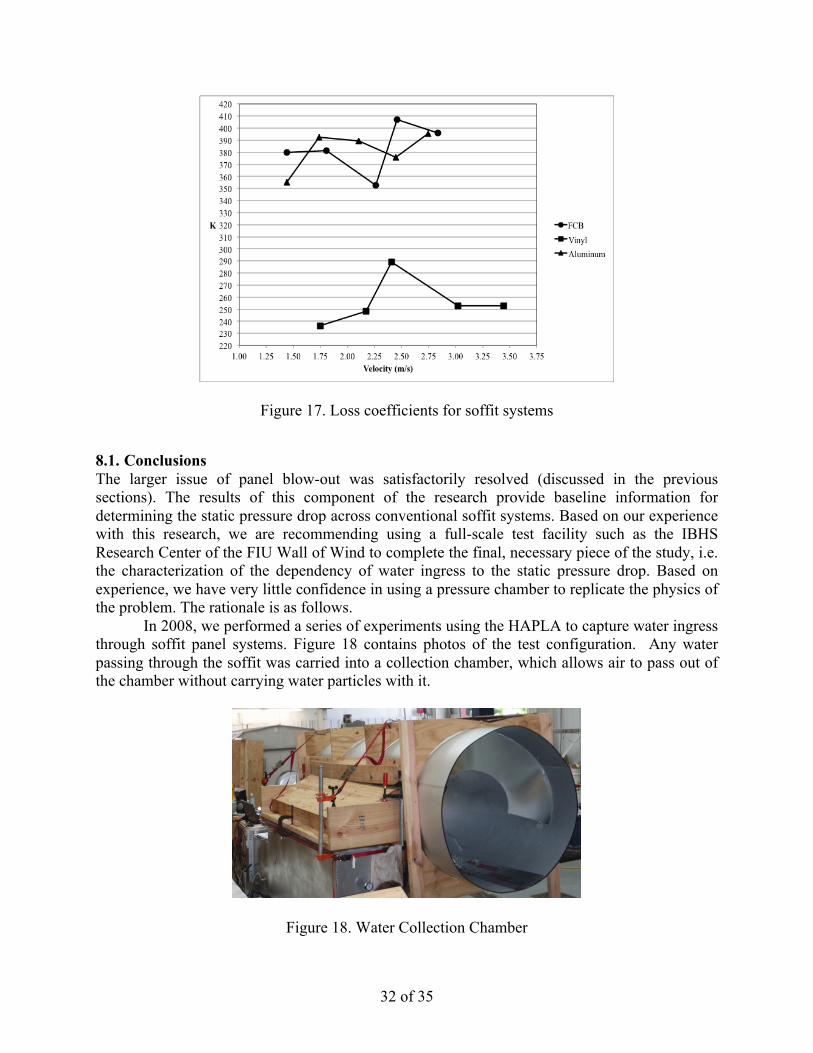
Results are shown in Figures 16-17 for seven cases: four screens with varying porosities (to validate theoretical equation to calculate static pressure drop across screens) and three conventional soffit materials. Loss coefficients (K) are defined as 𝐾 =
𝑝! − 𝑝!12𝜌𝑈!"#
! (1)
where p1 and p2 are the static pressure values measured upstream and downstream of the specimen and Uref is the average velocity of the flow across the gross area. As expected, K grows proportional to the porosity (or net free area). K also decreases with velocity due to Reynolds number effect, which has been observed in prior studies. Figure 16 shows measured K values and theoretical estimates based on:
𝐾! = 𝐾!"#!𝐾!"𝜎! +𝜎!!
𝛽!!
where
𝐾!" = . 785 1−𝑅!"354 + 1.01
Kmesh = 1.0 for new metal wire
𝜎! = 1− 𝛽!
𝛽! = 𝑝𝑜𝑟𝑜𝑠𝑖𝑡𝑦 𝑜𝑓 𝑠𝑐𝑟𝑒𝑒𝑛
31 of 35
𝑅!" =
!!!!
where V=velocity (m/s)
dw=wire diameter (m);
ν = kinematic viscosity (25.9e-6 m2/s) The results demonstrate good agreement for the screens with the highest porosities, but the a bias is seen for the highest porosity case. Figure 17 shows the K values for three of the soffits tested in the early studies. The theoretical estimates (not shown) for the screen under-predicted the static pressure drop, which is attributed to the frictional losses not being modeled. Assuming a nominal value of K = 300 and a typical net free area of soffits used in Florida, it can be easily be shown that the air traveling through the panel ventilation is significantly larger than the velocity in the unobstructed flow field.
Figure 16. Loss coefficients for screens
32 of 35
Figure 17. Loss coefficients for soffit systems
8.1. Conclusions The larger issue of panel blow-out was satisfactorily resolved (discussed in the previous sections). The results of this component of the research provide baseline information for determining the static pressure drop across conventional soffit systems. Based on our experience with this research, we are recommending using a full-scale test facility such as the IBHS Research Center of the FIU Wall of Wind to complete the final, necessary piece of the study, i.e. the characterization of the dependency of water ingress to the static pressure drop. Based on experience, we have very little confidence in using a pressure chamber to replicate the physics of the problem. The rationale is as follows. In 2008, we performed a series of experiments using the HAPLA to capture water ingress through soffit panel systems. Figure 18 contains photos of the test configuration. Any water passing through the soffit was carried into a collection chamber, which allows air to pass out of the chamber without carrying water particles with it.
Figure 18. Water Collection Chamber
33 of 35
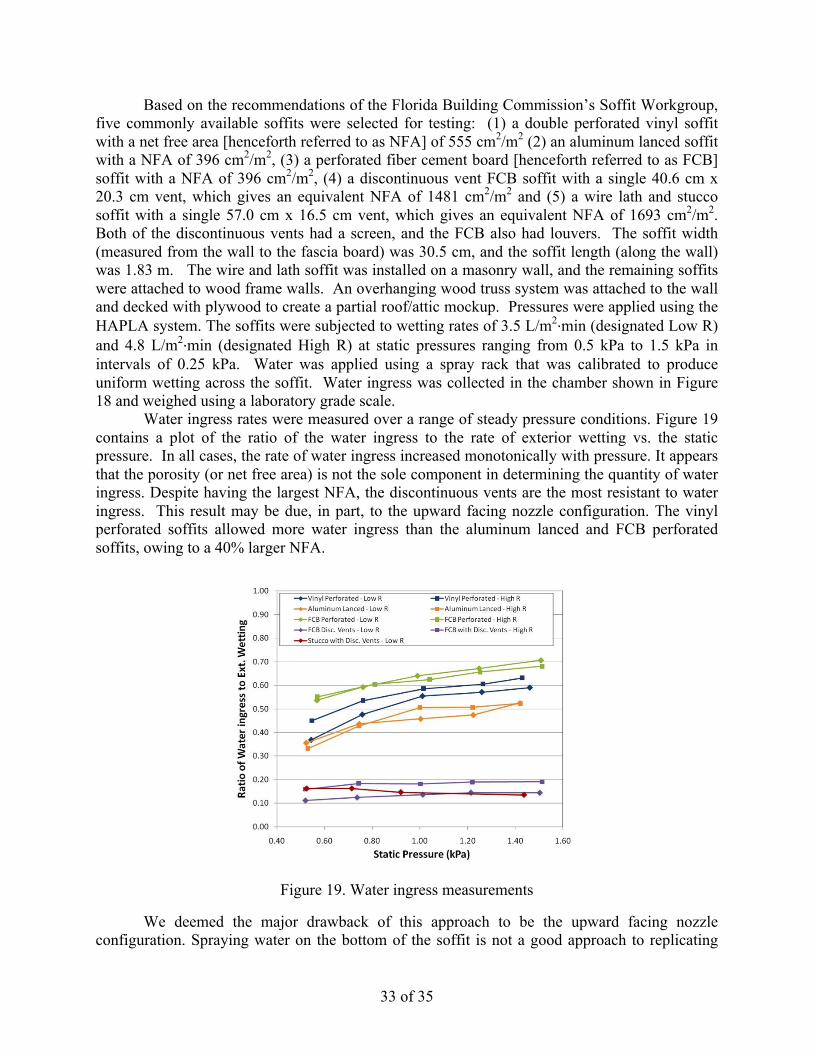
Based on the recommendations of the Florida Building Commission’s Soffit Workgroup, five commonly available soffits were selected for testing: (1) a double perforated vinyl soffit with a net free area [henceforth referred to as NFA] of 555 cm2/m2 (2) an aluminum lanced soffit with a NFA of 396 cm2/m2, (3) a perforated fiber cement board [henceforth referred to as FCB] soffit with a NFA of 396 cm2/m2, (4) a discontinuous vent FCB soffit with a single 40.6 cm x 20.3 cm vent, which gives an equivalent NFA of 1481 cm2/m2 and (5) a wire lath and stucco soffit with a single 57.0 cm x 16.5 cm vent, which gives an equivalent NFA of 1693 cm2/m2. Both of the discontinuous vents had a screen, and the FCB also had louvers. The soffit width (measured from the wall to the fascia board) was 30.5 cm, and the soffit length (along the wall) was 1.83 m. The wire and lath soffit was installed on a masonry wall, and the remaining soffits were attached to wood frame walls. An overhanging wood truss system was attached to the wall and decked with plywood to create a partial roof/attic mockup. Pressures were applied using the HAPLA system. The soffits were subjected to wetting rates of 3.5 L/m2·∙min (designated Low R) and 4.8 L/m2·∙min (designated High R) at static pressures ranging from 0.5 kPa to 1.5 kPa in intervals of 0.25 kPa. Water was applied using a spray rack that was calibrated to produce uniform wetting across the soffit. Water ingress was collected in the chamber shown in Figure 18 and weighed using a laboratory grade scale. Water ingress rates were measured over a range of steady pressure conditions. Figure 19 contains a plot of the ratio of the water ingress to the rate of exterior wetting vs. the static pressure. In all cases, the rate of water ingress increased monotonically with pressure. It appears that the porosity (or net free area) is not the sole component in determining the quantity of water ingress. Despite having the largest NFA, the discontinuous vents are the most resistant to water ingress. This result may be due, in part, to the upward facing nozzle configuration. The vinyl perforated soffits allowed more water ingress than the aluminum lanced and FCB perforated soffits, owing to a 40% larger NFA.
Figure 19. Water ingress measurements
We deemed the major drawback of this approach to be the upward facing nozzle configuration. Spraying water on the bottom of the soffit is not a good approach to replicating
34 of 35
the physics of the problem and certainly does not result in an even distribution of wetting and splashing characteristics. 8.2. References [1] Gurley KR, Masters FJ. Post 2004 hurricane field survey of residential building
performance. Natural Hazards Review 2011; 12: 177-183. [2] CTS. Tropical Cyclone Yasi. structural damage to buildings. Technical Report No. 57,
Cyclone Testing Station; 2011. Available at www.jcu.edu.au. [3] FEMA. Mitigation assessment team report: Hurricane Charley in Florida, observations,
recommendations, and technical guidance. FEMA Rep. No. 488. FEMA, 2005. Washington, D.C.
[4] FEMA. Summary report on building performance, Hurricane Katrina 2005. FEMA Rep. No. 548. FEMA, 2006. Washington, D.C.
[5] Australian Building Codes Board. National Construction Code. Canberra, 2011. [6] Standards Australia. AS/NZS1170.2 – Wind Actions. Sydney, New South Wales,
Australia; 2002. [7] ASTM D5206-06a. Standard test method for windload resistance of rigid plastic siding.
West Conshohocken, PA: American Society of Testing and Materials, 2010. [8] ASTM E330-02. standard test method for structural performance of exterior windows,
doors, skylights and curtain walls by uniform static air pressure difference. West Conshohocken, PA: American Society of Testing and Materials, 2010.
[9] FBC. Criteria for testing impact resistant building envelope components using uniform static air pressure. Testing Application Standard (TAS) 202-94. Florida Building Code; 1994.
[10] FBC. Criteria for testing products subject to cyclic wind pressure loading. Testing Application Standard (TAS) 203-94, Florida Building Code; 1994.
[11] ASCE 7-05. Minimum design loads for buildings and other structures. Reston, VA: American Society of Civil Engineers; 2006.
[12] Vickery PJ. Component and cladding wind loads for soffits. Journal of Structural Engineering 2008; 134(5), 846-853.
[13] Kopp GA, Morrison MJ, Gavanski E, Henderson DJ, Hong HP. The Three Little Pigs’ Project: hurricane rick mitigation by integrated wind tunnel and full-scale laboratory tests. Natural Hazards Review 2010; November, 151-161.
[14] Vickery PJ, Masters FJ, Powell MD, Wadheraa D. Hurricane hazard modeling: the past, present and future. Journal of Wind Engineering and Industrial Aerodynamics 2009. 97(7-8), 392-405.
[15] VSI. Vinyl siding installation manual. Washington, D.C.: Vinyl Siding Institute; 2007. Available at http://www.vinylsiding.org/installation/manual.
[16] Cook NJ, Keevil AP, Stobart RK. BRERWULF—the big bad wolf. Journal of Wind Engineering and Industrial Aerodynamics; 1988, 29, 99-107.
[17] Lieblein J. Efficient methods of extreme value methodology. Washington, DC, 1974: US National Bureau of Standards Report No. NBSIR 74-602.
[18] St. Pierre LM, Kopp GA, Surry D, Ho TCE. The UWO contribution to the NIST aerodynamic database for wind loads on low buildings: part 2. Comparison of data with
35 of 35
wind load provisions. Journal of Wind Engineering and Industrial Aerodynamics; 2005, 93, 31-59.