task 4 report technologies - eceee€¦ · 4 introduction to task 4 task 4 follows the meerp...
TRANSCRIPT

1
Preparatory study on the Review of
Regulation 617/2013 (Lot 3)
Computers and Computer Servers
Task 4 report
Technologies
Final version for consultation
2nd February 2017

2
VITO NV
Boeretang 200
2400 Mol
Belgium
vito.be
Prepared by:
Viegand Maagøe and VITO
Study team: Larisa Maya-Drysdale, Michelle Peled, Jonathan Wood, Mette Rames and Jan
Viegand (Viegand Maagøe)
Quality manager: Wai Chung Lam (VITO)
Website design and management: Karel Styns (VITO)
Contract manager: Karolien Peeters (VITO)
Prepared for:
European Commission
DG ENER C.3
Office: DM24 04/048
B-1049 Brussels, Belgium
Contact person: Paolo Tosoratti
E-mail: [email protected]
Project website: computerregulationreview.eu
Specific contract no.: ENER/C3/2012-418 LOT1/11/FV 2015-543
Implements Framework Contract: ENER/C3/2012-418 LOT N° 1
This study was ordered and paid for by the European Commission, Directorate-General
for Energy.
The information and views set out in this study are those of the author(s) and do not
necessarily reflect the official opinion of the Commission. The Commission does not
guarantee the accuracy of the data included in this study. Neither the Commission nor any
person acting on the Commission’s behalf may be held responsible for the use which may
be made of the information contained therein.
This report has been prepared by the authors to the best of their ability and knowledge.
The authors do not assume liability for any damage, material or immaterial, that may arise
from the use of the report or the information contained therein.
© European Union, February 2017.
Reproduction is authorised provided the source is acknowledged.
More information on the European Union is available on the internet (http://europa.eu).
Viegand Maagøe A/S
Nr. Farimagsgade 37
1364 Copenhagen K
Denmark
viegandmaagoe.dk

3
Table of Contents List of tables ......................................................................................................... 4
List of figures ........................................................................................................ 5
Abbreviations ........................................................................................................ 6
Introduction to the task reports ............................................................................... 8
4 Introduction to Task 4 .....................................................................................10
4.1 Technical product description ......................................................................10
4.1.1 Average technology of personal computers .............................................10
4.1.2 Average technology of components ........................................................17
4.1.3 BAT – Best Available Technology at product level .....................................28
4.1.4 BAT – Best Available Technology at a component level .............................33
4.1.5 BNAT – Best Not Available Technology ....................................................42
4.2 Use of materials for average technologies and BAT ........................................44
4.2.1 Desktop computers ..............................................................................45
4.2.2 Notebook computers ............................................................................50
4.2.3 Tablet/slate computers .........................................................................55

4
List of tables Table 1. Desktop computer average technology configuration. ...................................11
Table 2. Power demand in various modes for average technology of desktop computers.
..........................................................................................................................12
Table 3. Integrated desktop computer average technology configuration. ....................12
Table 4. Power demand in various modes for integrated desktop average technology. ...13
Table 5. Notebook computer average technology configuration. .................................13
Table 6. Power demand in various modes for notebook average technology. ................14
Table 7. Tablet computer average technology configuration. ......................................14
Table 8. Power demand in various modes for tablet average technology. .....................15
Table 9. Workstation computer average technology configuration. ..............................15
Table 10. Power demand in various modes for Workstation average technology. ..........15
Table 11. Thin client and integrated thin client computer average technology
configuration........................................................................................................16
Table 12. Power demand in various modes for thin client and integrated thin client
average technology. .............................................................................................16
Table 13. Maximum levels of efficiency reported in 80PLUS registered IPS. ..................18
Table 14. IPS efficiency requirements in the current computer regulation. ...................18
Table 15. Performances of Range Intel CPUs, ...........................................................20
Table 16. Internet Browser Usage and Notebook Battery Lifetime. .............................28
Table 17. Operating System and Notebook Battery Life under different usage conditions.
..........................................................................................................................28
Table 18. Technical specifications and energy characteristics of BAT for desktop
computers. ..........................................................................................................29
Table 19. Technical specifications and energy characteristics of BAT for integrated
desktop computers. ..............................................................................................29
Table 20. Technical specifications and energy characteristics of BAT for notebook
computers. ..........................................................................................................30
Table 21. Technical specifications and energy characteristics of BAT for table/slate
computers. ..........................................................................................................31
Table 22. Technical specifications and energy characteristics of BAT for workstations. ...31
Table 23. Technical specifications and energy characteristics of BAT for all in one
computers. ..........................................................................................................32
Table 24. Technical specifications and energy characteristics of BAT for thin clients. .....33
Table 25. Power Demands and Performances of high specification dGfxs .....................36
Table 26. Maximum efficiencies observed amongst 80PLUS Registered PSUs. ...............38
Table 27. BAT Efficiencies of Storage Devices. ..........................................................41
Table 28. The evolution of supported low power states in. .........................................41
Table 29. Bill of materials (BoM) of average and BAT desktop computers on the European
market. ...............................................................................................................45
Table 30. Bill of materials (BoM) of identified integrated desktop computers on the
European market (including BAT). ..........................................................................49
Table 31. Bill of materials (BoM) of average and BAT notebook computers on the
European market. .................................................................................................50
Table 32. Material composition of HDD and SSD according to JRC review194. ................51
Table 33. Bill of materials (BoM) of average and BAT tablet/slate computers on the
European market. .................................................................................................55

5
List of figures Figure 1. Average Efficiencies of IPS Registered with the 80Plus Programme 2014 to 2016
. .........................................................................................................................18
Figure 2. Average Short-Long Idle Delta (W) for Displays in ENERGY STAR registered
Integrated Desktop Computers. .............................................................................27
Figure 3. Average Short-Long Idle Delta (W) for Displays in ENERGY STAR registered
Notebook Computers. ...........................................................................................27
Figure 4. BAT Efficiencies of IPS Registered with the 80Plus Programme 2014 to 2016 . 38
Figure 5. BAT Efficiencies of displays in ENERGY STAR registered Integrated desktop
computers ...........................................................................................................39
Figure 6. BAT Efficiencies of displays in ENERGY STAR registered notebook computers ..39
Figure 8:The naked Mac Pro (source MacWorld 37) ....................................................47
Figure 9. Material composition of a HDD model for desktop computers placed on the EU
market204. ...........................................................................................................48
Figure 10. Material composition of a HDD model for notebook computers placed on the
EU market. ..........................................................................................................52
Figure 11. Material composition of a SSD model for notebook computers placed on the EU
market. ...............................................................................................................53
Figure 12. Average material composition of EPS for notebook computers with output
powers from 60W to 90W. .....................................................................................55

6
Abbreviations
AC Alternate Current
AVFS Adaptive Voltage and Frequency Scaling
B2B Business to Business
B2C Business to Consumers
BAT Best Available Techhnology
BoM Bill of Materials
CCFL Cold cathode fluorescent lamp
CPU Central processing unit
DBEF Dual Brightness Enhancement Film
DC Direct Current
dGfx Discrete Graphic Card
DFS Dynamic frequency scaling
DIY Do-it-yourself
DRAM Dynamic RAM
DVS Dynamic voltage scaling
EC European Commission
eDRAM Embedded Dynamic RAM
EEE Electrical and electronic equipment
EGA External graphics adapter
EMEA Europe, Middle East and Africa
EPA Environmental Protection Agency (USA)
EPS External power supply
ESOs European Standardisation Organisations
EU European Union
GPU Graphics processing unit
HDD Hard disk drives
iGfx Integrated graphics processing unit
IPS Internal power supply
JRC Joint Research Centre
LCD Liquid crystal display
LED Light emitting diode
Li-ion Lithium-ion battery
NiCad Nickel-Cadmium battery
NiMH Nickel-metal hydride battery
ODD Optical disk drive
OS Operating System
PCB Printed Circuit Board
PCI Peripheral Component Interconnect
PRO Producer Responsibility Organisation
PSR Panel self-refresh
PSU Power Supply Unit
RAM Random access memory

7
SME Small and medium enterprise
SoC State of charge of a battery
SRAM Static RAM
SSD Solid state drives
SSHD Solid state hybrid drive
VR Virtual Reality
WEEE Waste Electrical and Electronic Equipment

8
Introduction to the task reports This is the introduction to the interim report of the preparatory study on the Review of
Regulation 617/2013 (Lot 3) for Computers and Computer Servers. The interim report
has been split into five tasks, following the structure of the MEErP methodology. Each
task report has been uploaded individually in the project’s website. These task reports
present the technical basis to define future ecodesign and/or energy labelling
requirements based on the existing Regulation (EU) No 617/2013.
The task reports start with the definition of the scope for this review study (i.e. task 1),
which assesses the current scope of the existing regulation in light of recent
developments with relevant legislation, standardisation and voluntary agreements in the
EU and abroad. The assessment results in a refined scope for this review study.
Following it is task 2, which updates the annual sales and stock of the products in scope
according to recent and future market trends and estimates future stocks. Furthermore,
it provides an update on these trends as well as on consumer expenditure data which will
be used on the assessment of additional life cycle consumer costs if/when setting new
requirements.
Then it is task 3, which presents a detailed overview of use patterns of products in scope
according to consumer use and technological developments. It also provides an analysis
of other aspects that affect the energy consumption during the use of these products,
such as component technologies, power supply load efficiency and user interface in
particular power management practices. Furthermore, it also touches on aspects that are
important for material and resource efficiency such as repair, maintenance and
replacement practices, and it gives an overview of what happens to these products at
their end of life. Finally, this task also touches on standardised methods to quantify
energy consumption in the different power modes, touching on the active mode, and it
presents an overview of the energy consumption of products in scope based on
manufacturers and ENERGY STAR database information.
Task 4 presents an analysis of current average technologies at product and component
level, and it identifies the Best Available Technologies both at product and component
level. An overview of the technical specifications as well as their overall energy
consumption is provided when data is available. Finally, the chapter concludes with an
overview of the product configurations in terms of components and key materials of
current average and Best Available Technologies placed on the European market.
Simplified tasks 5 & 6 report presents the base cases, which will be later used to define
the current and future impact of the current computer regulation if no action is taken.
The report shows the base cases energy consumption at product category level and their
life cycle costs. It also provides a high-level overview of the life cycle global warming
potential of desktops and notebooks giving an idea of the contribution of each life cycle
stage to the overall environmental impact. Finally, it presents some identified design
options which will be used to define reviewed ecodesign requirements.
Task 7.1 report presents the policy options for an amended ecodesign regulation on
computers and computer servers. The options have been developed based on the work
throughout this review study, dialogue with stakeholders and with the European
Commission. The report presents an overview of the barriers and opportunities for the

9
reviewed energy efficiency policy options, and the rationale for the new material
efficiency policy options. This report will be the basis to calculate the estimated energy
and material savings potentials by implementing these policy options, in comparison to
no action (i.e. Business as Usual – BAU).
The task reports follow the MEErP methodology, with some adaptations which suit the
study goals.

10
4 Introduction to Task 4 Task 4 follows the MEErP methodology and includes the following:
1. A description of the identified average technology at product level on the
current European market including technical specifications and energy
consumption levels.
2. A description of the identified average technology at component level.
3. A description of the Best Available Technology at product level, including
technical specifications and energy consumption information.
4. A description of the Best Available Technology at a component level.
5. A short overview of the potential aspects that will define the Best Not yet
Available Technology on the European market.
An overview of the implications in terms of use of materials for average technologies and
BAT. A description on the use patterns and end of life has been presented already in task
3. Therefore, this task focuses on the technologies and the demand of components and
materials.
4.1 Technical product description
4.1.1 Average technology of personal computers
The average technology of personal computers is described on product type level in the
following sections. The average technology was found for each product group by looking
at the most frequently occurring performance measures , for various components
including CPU, GPU, storage drives, and PSU, i.e. by finding the most frequent statistical
values for each product configuration. The analysis to find the most frequently occurring
value was made for one parameter at a time. The specific performance parameters are
all mentioned for each base case in the sections below. The most frequently occurring
values for each parameter were then used as definition for the average technical product
design. For each base case the database was searched for the products fitting all of the
values for the parameters.
Since even the best available data (from the ENERGY STAR database) did not include full
datasets for all products, the number of data points that were used to determine each
power demand data point is shown along with the most frequently occurring value
(mode). This can be seen in Table 1, where it is not shown how many of the products
were equipped with a HDD vs. a SSD, but just shows that out of 1248 that have any data
about HD type, most have HDD for desktops.
In the ENERGY STAR data, some products are over-specified on some parameters,
especially the RAM. An online search at retailer websites1 was therefore performed, which
clearly showed a tendency towards over-specifying RAM for desktops, integrated
desktops and notebooks, which has therefore been corrected accordingly in the average
technology descriptions. Retailer website search was also used to determine the most
common storage capacity, since this parameter was often not reported in the ENERGY
STAR database.
1 https://www.cyberport.de/pc-und-zubehoer/pc-systeme/liste.html and https://www.shop.bt.com/category/computing,desktops-and-monitors,desktop-pcs/11101

11
The CPU performance score was in most cases not reported in the ENERGY STAR
databases, but was calculated by multiplying the most common number of physical cores
in the CPU and the base speed per core for each product group.
The ETEC values in all the following tables are based on the ENERGY STAR 6.1 calculation
method, and thus the ENERGY STAR use patterns, since these are more up-to-date than
the ecodesign use patterns.
4.1.1.1 Desktop computers
The average technology of desktop computers can be seen in Table 1. The table shows
that the typical desktop computer has a processor with 2 physical cores, a base speed of
3.4 GHz per core and system memory of 4 GB RAM. The system memory has been found
by looking at retailer websites2, as the ENERGY STAR data was specified too high on this
parameter, stating that 32 GB RAM were the most common system memory in desktop
computers. The retailer websites, however, showed that 56% of the desktops had a
system memory of 4 GB RAM, 32% 8 GB RAM and only 2% had 32 GB RAM. The last
column in Table 1 (‘no. of products with data available’) shows the number of products in
the ENERGY STAR database for which the specified product characteristic was found. This
shows that while CPU data (both number of cores and speed) were often available, RAM
and IPS efficiency data were not found as often.
Table 1. Desktop computer average technology configuration.
Performance parameter Most frequent
value
No. of products
with data available
CPU cores 2 2087
Base CPU Speed Per Core, GHz 3.4 GHz 2087
CPU performance score 6.8
RAM 4 GB 536
HD type HDD 1248
Storage drives count 1 2077
Total storage capacity 500 GB 816
GPU type None 641
GPU GB/sec - -
PSU rated output 300 watt 1010
IPS efficiency, 10% 79% 401
IPS efficiency, 20% 84% 770
IPS efficiency, 50% 87% 769
IPS efficiency, 100% 83% 771
To determine the power demand for the average technology for desktop computers
defined in Table 1, the ENERGY STAR databases were searched. Three computers were
found that met the criteria in Table 1. All three computers were from the EU ENERGY
STAR database and all were ENERGY STAR category I2 and ecodesign Category B. One of
the computers is from 2015, and two are from 2016. The IPS efficiencies were not given
for these products in the ENERGY STAR database, but power load factor at 100% load
was 90% for 2 of the products and 99% for one product. Table 2 shows the average
power demand of the three computers in various power modes, which will be used as the
representative of the average technology for further calculations of desktop computers.
2 https://www.cyberport.de/pc-und-zubehoer/pc-systeme/liste.html and https://www.shop.bt.com/category/computing,desktops-and-monitors,desktop-pcs/11101

12
Table 2. Power demand in various modes for average technology of desktop computers.
Power mode Power demand
Lowest Average Highest
Short idle 22.4 W 22.9 W 23.6 W
Long idle 21.33 W 21.8 W 22.4 W
Sleep 0.9 W 1.3 W 1.82 W
Off 0.30 W 0.45 W 0.57 W
TEC, ENERGY STAR 98.5 kWh/year 101.0 kWh/year 103.4 kWh/year
4.1.1.2 Integrated desktop
For integrated desktops the definition of the average technology includes the size and
resolution of the integrated display in the computer. The installed storage capacity was
assumed to be the same as for desktop computers, whereas online search showed that
most integrated desktops had 8 GB RAM of system memory compared to the 4 GB which
is most common in not-integrated desktop computers. One of the reasons might be that
it is harder to upgrade RAM in integrated desktops, and therefore they are sold with
more RAM from the beginning. Another is that the consumers expect that their integrated
desktop take longer to become obsolete since their initial investment was higher.
Table 3. Integrated desktop computer average technology configuration.
Performance parameter Most frequent value No. of products with data available
CPU cores 2 1018
Base CPU Speed Per Core, GHz 3.00 GHz 1009
CPU performance score 6
RAM 8 GB 65
HD type HDD 762
Storage drives count 1 1018
Total storage capacity 500 GB 816
GPU type None
PSU rated output 180 570
IPS efficiency, 10% 87% 344
IPS efficiency, 20% 89% 414
IPS efficiency, 50% 90% 392
IPS efficiency, 100% 89% 414
Integrated Display size (sq in) 161.5 737
Integrated display MP 2.07 901
Three integrated desktops were found that matched the average technology
specifications in Table 3, all in the US ENERGY STAR database from 2014, and all
category B in ecodesign. Two of the computers are category I2 in ENERGY STAR and
from 2014, one is category I1 from 2015. The screen sizes varied a lot in the ENERGY
STAR data set, from 1.4 to 26.5 dm2 (6 inch to 34 inch diagonal) for integrated desktops.
None of the three computers that matched the other criteria matched the screen size
exactly. Screens sizes of the three computers where between12.8 to 15.0 dm2 (21.5 inch
to 23 inch diagonal). None of the computers had any PSU data available. The average of
the three computers’ power demand in various power modes are shown in Table 4, and
will be used to represent the integrated desktop average technology in further
calculations.

13
Table 4. Power demand in various modes for integrated desktop average technology.
Power mode Power demand
Lowest Average Highest
Short Idle 30.7 W 32.93 W 34.8 W
Long idle 16.0 W 22.8 W 33.3 W
Sleep 0.80 W 1.30 W 1.80 W
Off 0.30 W 0.53 W 1.00 W
E TEC 119.7 kWh/year 133.27 kWh/year 151.6 kWh/year
When comparing Table 4 with Table 2 it can be concluded that the short idle mode power
demand is significantly higher for the integrated desktop than for the desktop. The
reason for this difference is that the short idle mode power demand for integrated
desktops has been measured before the display has turned off, which has a large impact
on power consumption.
4.1.1.3 Notebook
For notebook computers, the RAM and storage capacity information was found by
searching on retailer websites to find the most common values. The search showed that
most notebooks (52%) had 8 GB RAM system memory and 33% had 4 GB RAM, whereas
only 11% had 16 GB, as the ENERGY STAR database showed the most frequently
occurring value. The notebook average technology was therefore defined with notebooks
having 8 GB RAM as seen in Table 5. This is the same amount as for integrated desktops,
and higher than for desktops, because notebooks are also harder to upgrade with extra
RAM for the user, and are therefore provided with more by the manufactures.
Table 5. Notebook computer average technology configuration.
Performance parameter Most frequent
value
No. of products with
data available
CPU cores 2 2911
Base CPU Speed Per Core, GHz 2.6 GHz 2891
CPU performance score 5.2
RAM 8 GB 1039
HD type HDD 1432
Storage drives count 1 1529
Total storage capacity 500 GB 1257
GPU type None
PSU rated output 65 506
EPS average efficiency 88% 182
Integrated display size (sq in) 103 1994
Integrated display MP 1.00- 1.05 1994
As can be seen in Table 5, there was relatively little data available for EPS’s shipped with
notebook computers in the ENERGY STAR database. Given that EPS efficiency is covered
by a separate ecodesign regulation, this data shortage will only have a minimal impact
on results of this project.
Three computers fit the average technology configuration shown in Table 5, all three are
listed in the US database from 2016. The three products are category I1 in the ENERGY
STAR database and category A in ecodesign. None of the computers fit the base CPU
speed of 2.6 GHz, but instead has a base speed of 2.4 GHz. Two have a rated PSU output
of 65 watts, one has 40 watts, but none of them have PSU efficiency data in the ENERGY
STAR database. All of the products have screens that fit with the average technology

14
configuration. The power demand in various power modes, shown in Table 6, is the
average of the three products.
Table 6. Power demand in various modes for notebook average technology.
Power mode Power demand
Lowest Average Highest
Short idle 6.3 W 7.1 W 8.0 W
Long idle 2.8 W 4.30 W 5.4 W
Sleep 0.40 W 0.43 W 0.50 W
Off 0.20 W 0.40 W 0.50 W
E TEC 17.78 kWh/year 24.75 kWh/year 29.83 kWh/year
4.1.1.4 Tablets/slates
For tablet computers, the storage capacity, which was found by searching online retailer
websites, was quite evenly split between 16 GB, 32 GB, and 128 GB with shares of 25%,
22% and 21%, respectively. All sizes are therefore written in the average technology
specification in Table 7. For the system memory, the internet search and the ENERGY
STAR data showed that 2 GB RAM is the most common for tablets.
Table 7. Tablet computer average technology configuration.
Performance parameter Most frequent value No. of products with data available
CPU cores 2 96
Base CPU Speed Per Core, GHz 1.3 GHz 93
CPU performance score 2.6
RAM 2 GB 204
HD type SSD 84
Storage drives count 1 90
Total storage capacity 16/32/128 GB 446
GPU type None 212
PSU rated output 10 64
EPS average efficiency 88% 31
Integrated Display size (sq in) 28-73 83
Integrated display MP 2.07 83
Due to the small dataset of tablets in the ENERGY STAR databases (212 products), no
products fit the average technology configuration in Table 7 exactly, but three do with
some discrepancies. All three products are form the US database, one from 2013 and two
form 2014. The three products are category I1 in ENERGY STAR and category A in
ecodesign. All three products have 2 physical CPU cores, but one has 2 GB RAM and
base speed of 1.6 GHz, whereas the other two have 1 GB RAM and base speed of 1.3
GHz. Two of the products have screens of 29.96 square inch and 3.15 megapixels,
whereas the last product has a screen that is 127.15 square inch and 2.07 megapixel.
The average of three products are despite their differences estimated to be a good
representation of an average tablet. The power demand averages and energy
consumption, which will be used to represent the tablet average technology in further
calculations, are shown in Table 8.

15
Table 8. Power demand in various modes for tablet average technology.
Power mode Power demand
Short Idle 4.13 W
Long idle 0.30 W
Sleep 0.54 W
Off 0.20 W
E TEC 13.23 kWh/year
4.1.1.5 Workstation
Workstations are generally higher performing computers, with no upper limit for
performance and no energy requirements so far in the ecodesign regulation in force. The
performance parameters of workstations might therefore be much higher for some
products on the market, than what is shown in Table 9, which is defining the average
technology for workstations. As seen in the table the workstations have higher CPU
performance than the other product groups with 4 physical cores and 3.5 GHz base
speed per core. Also the most common dGfx type is G7, which is the highest category in
the ecodesign regulation.
Most of the workstations in the ENERGY STAR database had no data on internal storage
capacity, but for the three that had it was 9TB, 3 TB and 1.5 TB. 1.5 TB was therefore
used as a conservative estimate.
Table 9. Workstation computer average technology configuration.
Performance parameter Most frequent value No. of products with data available
CPU cores 4 42
Base CPU Speed Per Core, GHz 3.5 GHz 75
CPU performance score 14.0
RAM 16 GB 75
HD type HDD 35
Storage drives count 2 75
Total storage capacity 1500 GB
GPU type G7 32
GPU GB/sec 64 31
PSU rated output 700 7
IPS efficiency, 10% 84% 24
IPS efficiency, 20% 91% 28
IPS efficiency, 50% 92% 28
IPS efficiency, 100% 90% 28
One product fits the workstation average technology description in Table 9. It is from the
US database from 2016, and has performance score 14 (4 CPU cores with base speed 3.5
GHz). The product has dGfx G7, but has 2 SSDs instead of HDDs. The total storage
capacity is not recorded in the database. The rated PSU output was not reported, but the
efficiencies matched for 20%, 50% and 100% load, while the 10% load efficiency was a
little higher (87%) than the average technology definition. The power demand in various
power modes for the workstation average technology is shown in Table 10.
Table 10. Power demand in various modes for Workstation average technology.
Power mode Power demand
Lowest Average Highest
Short idle 69.5 W 69.5 W 69.5 W
Long idle 72.3 W 72.3 W 72.3 W
Sleep 4.50 W 4.50 W 4.50 W

16
Power mode Power demand
Lowest Average Highest
Off 2.00 W 2.00 W 2.00 W
Max 243.3 W 243.3 W 243.3 W
P TEC 39.8 kWh/year 39.8 kWh/year 39.8 kWh/year
4.1.1.6 Thin client and integrated thin client
Thin clients and integrated thin clients are analysed as one product group. The ENERGY
STAR data set contained no data on total storage capacity, and it was not possible to find
it on retailer websites, probably since thin client products are sold under different names.
Therefore, no storage capacity has been defined in the average technology description in
Table 11. The CPU performance score for thin clients is lower than for other products,
since most of the computing work is done on a server.
Table 11. Thin client and integrated thin client computer average technology configuration.
Performance parameter Most frequent value No. of products with data available
CPU cores 2 75
Base CPU Speed Per Core, GHz 1.0 GHz 126
CPU performance score 2.0
RAM 2 MB 126
HD type SSD 55
Storage drives count 1 65
Total storage capacity No data
GPU type None 126
PSU rated output N/A 0
EPS average efficiency 88% 21
Integrated Display size (sq in) 226 18
Integrated display MP 2.07 18
Two thin client computers fit the parameters in Table 11, one thin client and one
integrated thin client, both from the US ENERGY STAR database and both from 2014. The
thin client that is not integrated has only one CPU core, and therefore a CPU performance
score of 1 rather than 2. The display in the integrated thin client is 337 square inches
and 3.15 megapixels. Neither of the products has any PSU data recorded in the ENERGY
STAR database. Table 12 shows the average power demand in various power modes for
the two thin clients, which will be used to represent the thin client average technology in
further calculations.
Table 12. Power demand in various modes for thin client and integrated thin client average technology.
Power mode Power demand
Lowest Average Highest
Short idle 6.0 W 14.4 W 22.8 W
Long idle 5.5 W 8.35 W 11.2 W
Sleep 0.4 W 0.80 W 1.2 W
Off 0.4 W 0.60 W 0.8 W
TEC (ES) 29.3 kWh/year 57.84 kWh/year 86.4 kWh/year

17
4.1.2 Average technology of components
4.1.2.1 Power supply units (PSU)
Computer power supply units (PSUs) convert AC (alternating current) mains electricity
sources into DC (direct current) at specific voltages (e.g. 12 V, 5 V, 3.3 V for IPS) which
are then used by different components within the computer. Two main types of PSUs are
used with personal computers; External PSUs (EPS) and Internal PSUs (IPS). EPS are
typically used with mobile computers, such as notebook computers, and IPS are typically
used with non-mobile computers such as desktop computers.
The efficiency of EPS placed on the EU market is addressed in an existing ecodesign
regulation3 and so these products will not be addressed in detail within this report.
The IPS traditionally used in personal computers are normally switched-mode power
supplies (SMPS) with power factor correction (PFC)4 rather than older linear power
supplies. Many personal computer power supplies conform to the ATX specification which
dictates physical design and voltage tolerances but a range of other IPS types are used
especially in smaller footprint products. This means that they do not all confirm the ATX
specification. Furthermore, the load rating (i.e. the amount of power that an IPS can
supply) of IPS used in personal computers can vary considerably due to the wide range
of performances and associated power demands found in this product group.
The efficiency of IPS are determined by system power losses as well as the thermal
performance of integrated circuits (ICs), printed circuit boards (PCBs) and other
components. The efficiency of IPS has increased considerably in recent years largely as a
result of initiatives, such as the 80PLUS programme, ENERGY STAR and the EU ecodesign
regulation on computers, placing requirements on these product types. Improvements in
IPS efficiencies have been achieved through enhancements in power converter circuitries
as well as improvements in semiconductors and magnetic materials. Whilst technical
changes to IPS have resulted in vastly increased power conversion efficiencies under
load, conversion efficiencies at low loading levels remain low. PSU efficiency is reduced
under low load conditions largely due to transistor switching losses with losses being
proportional to the switching frequency. Many IPS available on the market include a
smaller integrated circuit to provide standby voltage at 5V (named “5VSB”) used for
power on via keyboard and mouse. This functionality allows computers with large IPS to
meet low power mode requirements included in initiatives such as ENERGY STAR and the
EU ecodesign regulation on computers without the need to include a hard-off switch on a
computer.
Previous reports written as part of this project have shown how the efficiencies of IPS
vary considerably across individual products and loading levels. Figure 1 illustrates the
average efficiencies for IPS registered with the 80PLUS programme during the period
2014 to 2016 and tested at 230V/50Hz. The results clearly indicate that average
efficiencies seen in products on the market are well above the EU ecodesign regulation
on computers IPS efficiency requirements (shown by the horizontal lines and detailed in
Table 13). This suggests that the EU ecodesign regulation requirements (shown in Table
3 COMMISSION REGULATION (EC) No 278/2009 of 6 April 2009 implementing Directive 2005/32/EC of the European Parliament and of the Council with regard to ecodesign requirements for no-load condition electric power consumption and average active efficiency of external power supplies, available from http://eur-lex.europa.eu/legal-content/EN/TXT/?uri=CELEX%3A32009R0278 4 The power factor of an AC electrical power supply is defined as the ratio of the real power flowing to the load to the apparent power in the circuit.

18
14) for efficiencies at 20%, 50% and 100% loading can be updated. In addition, as
manufacturers are now reporting efficiencies at 10% loading it would be possible to
develop EU ecodesign requirements on this loading level.
Figure 1. Average Efficiencies of IPS Registered with the 80Plus Programme 2014 to 2016 5.
Table 13. Maximum levels of efficiency reported in 80PLUS registered IPS.
Maximum Efficiency at loading profile
10% load 20% load 50% load 100% load
89.9% 94.3% 94.3% 93.5%
Table 14. IPS efficiency requirements in the current computer regulation.
5. INTERNAL POWER SUPPLY EFFICIENCY (R. 617/2013)
Desktop
computer,
integrated desktop
computer, desktop
thin client,
workstation, and
small-scale server
Requirements on IPS
5.1. From 1 July 2014
All computer internal power supplies shall not perform at less
than:
(a) 85 % efficiency at 50 % of rated output power;
(b) 82 % efficiency at 20 % and 100 % of rated output power;
(c) power factor = 0.9 at 100 % of rated output power.
Internal power supplies with a maximum rated output power of
less than 75W are exempt from the power factor requirement.
5 Plugload Solutions, 80 PLUS® Certified Power Supplies and Manufacturers, available from https://www.plugloadsolutions.com/80PlusPowerSuppliesDetail.aspx?id=0&type=4

19
4.1.2.2 Central processing units (CPU)
All personal computers, with the exemption of some thin clients, have a central
processing unit (CPU) which is typically located on a motherboard. The CPU can be
thought of as the “brains of a computer” in that it performs the basic arithmetic, logical,
control and input/output (I/O) operations specified by a programme’s instructions.
The computational performances of CPUs have increased considerably over the last
decade but the rate of increase in performance appears to be reducing in recent years.
The level of computational performance and wider functionality provided by a CPU is
determined by many factors including:
CPU frequency (base and maximum)
Number of cores
Number of threads per core
Process node (i.e. size and number of transistors)
Cache memory configuration and capacity
Amount and type of RAM memory supported
Number, type and control of I/Os (e.g. number of PCIe lanes supported)
Presence of integrated graphics processing units
Operating voltage, dynamic voltage scaling functionality
CPU socket and chipset
Modern personal computer CPUs typically include multiple physical cores (mostly
between 2 and 4 but high specification CPUs may have 10 or more) with a number of
threads (often between 2 and 4 but high specification CPUs may have 12 or more) which
support parallel computing per core.
CPUs can generally perform faster than main system RAM can provide data. CPU caches,
which are relatively small amounts of memory either on the CPU package or close to it,
bridge the gap between the ability of CPUs to process data and the ability of main system
RAM to provide data. The amount and type of cache memory installed in CPUs is also an
important consideration in CPU performance. Cache memory is most typically Static RAM
(SRAM) but embedded DRAM (eDRAM) is also used.
CPU energy efficiency technologies can be largely split into those that help to reduce
energy use associated with dynamic power (i.e. power demand increases due to
increased clock speed, transistor count and voltage) and leakage (i.e. the energy
associated with transistors conducting small amounts of current even when turned off).
CPU manufacturers have been able to significantly reduce the power demand, especially
during inactive states, of many of their products in recent years. Some of these savings
have been achieved through enhanced voltage and frequency scaling technologies, which
reduce the dynamic power demand of CPUs when full performance is not required. Other
fixes have involved including new types of materials into the CPU package in order to
reduce current leakage. Further improvements have been made through the introduction
of deeper sleep states within the “C-state” hierarchy which can allow CPUs to draw very
little power in idle states. C-states are CPU idle states where parts of a processor are
shutdown when CPU cores are unused. There are two types of C-states, with “core C-
states” reflecting the position where individual cores of a CPU are power managed and
“package C-states” where the CPU circuitry that supports the CPU cores is also power
managed. The “C0 state” represents the situation where a CPU is active and higher C-
states (C1 to C7) represent conditions where parts of the CPU are power managed. The

20
higher the “C-state” number the more aggressive the power reduction. Many current
CPUs support high C-states (e.g. C6 and C7) but these are not always implemented on
products due to incompatibilities with some less advanced IPS.
CPU manufacturers have also made significant advances in reducing power demand when
CPUs are in active states. Power management of the CPU during active states is
described by “P-states” (performance states). P-states follow a similar nomenclature to
the C-states in that higher numbers (e.g. P6) represent reduced levels of activity with P0
representing the highest performing P-State. Dynamic frequency scaling (DFS) and
dynamic voltage scaling (DVS) are used, in combination, to implement the various P-
states supported the CPU and therefore reduce power demand requirements. Reduction
of the CPU core voltages helps to reduce leakage current across the CPU transistors. This
leakage can be further reduced in high P-states through inclusion of new materials such
as those found in hafnium-based high-k dielectrics or through transistor architecture
changes such as in FinFETs (Fin Field Effect Transistor). Whilst higher P-states result in
reduced power demand they are also accompanied by a reduced in the maximum
transistor speed (i.e. frequency). The P-states of a CPU are decided by the operating
system (OS) based on computational demands and so balancing the need between power
demand and performance. The time required to change from one P-state to another is
relatively short and so there is little to no impact ion usability.
Table 15 illustrates some of the energy efficiency improvements that were made in three
CPUs launched to market in 2015 compared to CPUs launched in 2014. The CPUs
launched in 2015 have significantly lower idle mode power demands but performance,
compared to similar 2014 CPUs, increased. Much of this improvement in energy efficiency
was likely brought about by a decrease in the reduction of the node size from 22nm to
12nm. Future reductions in node size are expected in the next few years and so
efficiencies are expected improve further.
Table 15. Performances of Range Intel CPUs6,7
CPU Manufacturer
Intel
CPU Name Core i3 Core i5 Core i7
4360 4690K 5675C 4790K 5775C 5920K 5930K 5960X
Market Release Date
May-14 Jun-14 Jun-15
Jun-14 Jun-15
Aug-14 Aug-14 Aug-14
Core Count 2 4 4 4 4 6 6 8
Thread Count 4 4 4 8 8 12 12 16
Base Frequency (GHz)
3.7 3.5 3.1 4 3.3 3.3 3.5 3
Turbo Frequency (all cores) (GHz)
3.7 3.5 4.2 3.6 3.4 3.6 3.3
Manufacturing Process (nm)
22 22 14 22 14 22 22 22
Integrated graphics (Yes/No)
Yes Yes Yes Yes Yes No No No
Thermal Design Power (W)
54 88 65 88 65 140 140 140
Idle Power Demand (W)
7.6 7.8 4.6 7.9 4.7 10.6 11.8 12.9
Gaming Power Demand (W)
62.3 64.5 42.1 67.5 51.8 69.8 72.5 85.8
6 CPU technical data sourced from http://www.cpu-world.com/ 7 CPU performances data sourced from http://www.tomshardware.com/reviews/intel-core-i7-5775c-i5-5675c-broadwell,4169.html

21
CPU
Manufacturer
Intel
CPU Name Core i3 Core i5 Core i7
4360 4690K 5675C 4790K 5775C 5920K 5930K 5960X
Market Release
Date
May-14 Jun-14 Jun-
15
Jun-14 Jun-
15
Aug-14 Aug-14 Aug-14
Microsoft Word Task (Seconds to completion)
0.80 0.71 0.77 0.71 0.80 0.78 0.75 0.82
Adobe CC Photoshop Heavy Workload (Seconds to completion)
2.41 2.15 2.20 2.02 2.52 2.68 2.49 2.94
Arithmetic - Multi-Threaded Performance
(GOPS)
57.3 92.5 96.5 131.3 121.6 154.4 172.6 218.1
Arithmetic - Single-Threaded Performance (GOPS)
14.3 23.1 24.1 16.4 15.2 12.8 14.4 13.6
Bioshock Infinite (Score)
31.5 39.2 86.2 41 89.1
4.1.2.3 Motherboard (i.e. Printed Circuit Board)
All personal computers have a motherboard which is a type of printed circuit board (PCB)
that provides connections (i.e. sockets) for most of the main computer components such
as the CPU, RAM, storage and discrete graphics cards (dGfx). The motherboard also
contains all the circuitry and interface controllers (e.g. network interface controllers, PCIe
controllers, USB controllers, voltage regulation, and serial advanced technology
attachment (SATA) controllers), which allow for communication amongst the different
computer components. Many motherboards, especially those in non-mobile computers,
allow for future expandability through multiple sockets that can be populated by
additional components (e.g. extra dual in-line memory module (DIMM) sockets for
additional sticks of RAM).
Motherboard power demand is highly dependent on both the amount of computational
performance supported and the amount of functionality provided. That is, motherboards
are designed to accommodate different specification CPUs with the highest performance
CPUs only being able to be used in high specification motherboards. Motherboards can
also support a wide range of functionalities through the types and numbers of connection
sockets that they provide. Whilst motherboard power demand is largely determined by
performance attributes it can also be controlled to a certain extent through effective
power management technologies. For example, some motherboards include software and
hardware solutions that allow specific parts of the motherboard, such as fans and LEDs,
to be turned off. In addition, individual unpopulated connections, such as PCIe sockets,
can be power managed into sleep states further reducing power demand.
The power demand of a motherboard can also be reduced through the inclusion of higher
specification voltage regulators which control the voltage provided by the power supply
and convert it into the appropriate voltage required by the CPU, RAM, chipset and other
motherboard based components.
4.1.2.4 Random Access Memory
Random Access Memory (RAM), also known as main memory, primary memory, or
system memory, is a component that temporarily stores information to be used by the

22
CPU and graphics processing units (GPUs). RAM is a volatile memory, meaning that it
requires constant power in order to keep the data from being lost. The major amount of
RAM in personal computers is used in dual in-line memory modules (DIMMS) which are
made up of a series of dynamic random-access memory (DRAM) integrated circuits.
These memory modules are connected to motherboards via DIMM sockets.
Data from programmes that are running are loaded into RAM for quick access by the
CPU. Therefore, the amount and type of RAM installed in a computer can strongly
determine overall performance. That is, the faster the CPU can access data in RAM the
faster the whole system can run.
Most system memory RAM used in personal computers is double data rate synchronous
dynamic random-access memory (DDR SDRAM) with DDR4, the latest DRAM variant,
having been released in 2014. DDR4 runs at a lower voltage (1.2V (1.05V for the low
voltage version)) than preceding DDR3 RAM. This lower voltage, coupled with improved
power management capabilities, means that DDR4 is significantly more energy efficient
per GB of installed RAM than preceding DDR technologies. Increasing amounts of RAM in
a personal computer can result in higher power demands. This increase in power demand
is more closely related to the number of RAM DIMMS installed in a product than the
amount of GB provided per DIMM. For example, 8GB of RAM provided over two RAM
modules would likely have a higher power demand than a single 8GB RAM module.
Whilst DDR4 is the latest type of RAM used in personal computers, newer memory
technologies are likely to be launched to market in the near to medium term. The DDR5
specification is due to be completed by the end of 2016 with market availability expected
sometime around 2020. Other memory technologies such as high bandwidth memory
(HBM) are already being used in some personal computers albeit not as main system
memory. HBM technologies may offer double the amount of memory bandwidth per watt
compared to current DRAM technologies.
4.1.2.5 Storage
Most personal computers include at least one component which provides a means of
permanently storing data. The most common data storage device used in personal
computers is the hard disk drive (HDD). The HDD has been used in personal computers
since the 1960s so is a very mature technology. HDDs utilise rapidly rotating disks, called
“platters” which are coated with magnetic material. Magnetic heads, flying close to the
platter surface on a moving actuator arm, read and write data to the platter surfaces as
they are spinning. The most common types of HDD found in current personal computers
are based on 3.5 inch or 2.5 inch platters. The 3.5 inch platters, being larger are
normally capable of storing more data and are typically found in non-mobile personal
computers such as desktop computers. The smaller 2.5 inch HDDs are normally found in
mobile products such as notebook computers. As well as size differentiators, HDDs also
come in a range of speeds typically ranging from 5,400 revolutions per minute (rpm) to
7,200 rpm. The faster the HDD the quicker data can be accessed and stored onto the
platters.
The power demand of HDDs is highly correlated with the spin rate of the platters. That is,
HDDs which provide faster speeds also have higher power demands as more powerful
motors are needed to achieve the spin rate. Larger sized platters also require more
power to spin so 3.5 inch HDDs tend to have higher power demands than 2.5 inch HDDs.
HDDs also normally provide at least two lower power modes in additional to their full

23
operational state. During idle states platters are continually spun at a reduced rate in
order to minimise the amount of time it takes for the HDD to regain full operability.
Given this continued spinning, power demand in idle states can still be significant. HDDs
also often support a range of sleep or standby states within which the platters no longer
spin and additional components are powered down. Wake up times during sleep or
standby states can be relatively high, especially in deep sleep states where most HDD
components are powered off, meaning that these low power states can be impractical
where quick access to main HDD functionality is required.
Solid state disks (SSDs) are another commonly used type of non-volatile (i.e.
permanent) storage device found in personal computers. All SSDs use integrated circuit
assemblies as memory, with most being NAND-based flash memory, rather than
magnetic disks as with HDDs. Being flash based components SSDs have no mechanically
moving parts. SSDs have several advantages over HDDs including faster access times,
resulting in programmes can be loaded and saved more quickly, and reduced noise. As a
result of the faster access times, SSDs have the ability to wake from idle states much
more quickly. This quick transition time from idle to active states, coupled with low idle
power demand, can allow SSDs to use significantly less energy than comparable HDDs as
it can power down without impacting usability. It is important to note that as the internal
DRAM size of SSDs increases more controllers are needed, which can result in higher
specification SSDs using more energy than traditional HDDs under some workload
situations. Nevertheless, in many circumstances SSDs provide opportunity for energy
savings when replacing HDDs. Whilst flash based SSDs first came to market in the late
1980’s and have some clear benefits over HDDs, they have not been able to replace
HDDs in the market place due to their extra costs. Whilst, SSDs remain more expensive
per GB of storage than HDDs, their costs are reducing and are already common in
higher-end mobile computers.
The third major type of storage product used in personal computers is the “hybrid
drive”8, combining a small SSD and a larger HDD in a single storage volume. This
provides the advantages of the quick response times of the SSD, and is primarily used
for storage of the operating system and commonly used files, and the larger storage
capacity and cost advantages of an HDD. As well as providing the functionality and costs
advantages of both the SSD and HDD, hybrid drives can also share the lower power
demand characteristics of the SSD due to the fact that the HDD can be spun down more
frequently without impacting usability.
4.1.2.6 Graphic processing units (GPU)
Personal computers include at least one graphics processing unit (GPU) which are
specialised processors that render images, animations and video for output to a display.
The GPUs used in personal computers are either integrated GPUs (iGfx) or discrete GPUs
(dGfx). Integrated GPUs (iGfx) are found either directly on the motherboard, sharing
system memory, or on the CPU die. Discrete GPUs (dGfx) are discrete internal
components, typically plugged into a PCIe slot, containing one or more GPUs with a local
memory controller interface and local graphics-specific memory. The graphics capabilities
of dGfxs are typically much higher than those provided by iGfxs. The performances of
both dGfxs and iGFxs has increased considerably in the last few years and will likely
8 Other branded names are commonly used, such as "Fusion Drive" (Apple) or ExpressCache (Condusiv).

24
increase at an even greater rate with the inclusion of new memory technologies, such as
HBM, into new products.
The power demands and energy use characteristics of dGfxs and iGfxs share few
similarities due to the way in which the components work and the levels of performance
provided by each type. Power demands of dGfx can be very high in active states with this
power demand being strongly correlated to performance levels. The idle power demand
of some dGfx can also be considerable but dGfx manufacturers have taken a number of
steps over the last few years to greatly reduce idle mode power demands. The dGfx
manufacturers have included advanced voltage and frequency scaling technologies into
their dGfxs but they have also included the ability to power down virtually the entire
functional unit of a dGfx and reduce wake times considerably. The energy efficiency
improvements are most noticeable in long idle where attached displays are turned off
and so the dGfx is providing no functionality. Power demands of dGfx have also been
reduced in short idle but to a lesser extent due to the fact that displays remain on in this
mode and so any connected dGfx still provide some functionality beyond maintaining
system context.
The energy efficiency of iGfxs has also increased significantly over the last few years as
improvements in CPU efficiency technologies follow through into iGfxs.
Hybrid graphics approaches have also been developed whereby both an integrated and
discrete GPU are included in a computer. These hybrid approaches facilitate the use of
the more powerful dGfx when required but then revert to the iGfx when high
performance graphics abilities are not required. Hybrid graphics approaches are more
commonly implemented in notebook computers and integrated desktop computers due to
the integrated nature of the display connections allowing for better management of GPU
outputs. Conversely, in a desktop computer with a dGFx installed the display normally
connects to the external dGfx display connections therefore bypassing any iGfx. As such
it is more difficult to implement hybrid graphics solutions in desktop computers. Whilst
attempts have been made to introduce hybrid graphics to desktop computers that have
not been widely accepted in the marketplace.
4.1.2.7 Integrated displays
Some personal computers, most notably integrated desktops and notebook computers,
have integrated displays rather than relying on connection to an external monitor as with
desktop computers.
Virtually all integrated displays are based on liquid crystal display (LCD) panels. LCD
panels are made from two sheets of polarizing material, orientated at 90 degrees to each
other, with liquid crystal solutions organised into sub-pixels between them. As an electric
current is passed through the liquid it causes the molecules to align so that light is either
blocked or let through to a colour filter. Colour filters normally consist of three different
colours Red, Green and Blue (RGB) with each placed in front of a sub-pixel. The three
sub-pixels together form a pixel. The viewable colour of each pixel in an LCD panel is
then determined by varying the amount of light that is let through each sub-pixel and
onto the colour filters.
LCD panels do not generate their own light and so the light produced within LCD panels
comes from backlighting (i.e. lighting behind the first polarising sheet). In the early
generations of LCD displays, the backlight was generated by cold cathode fluorescent

25
lamps (CCFLs), a technology now disappeared. Displays now on the market are more
commonly backlighted by by light emitting diodes (LEDs). LEDs are either placed around
the edge of a display (i.e. edge lit backlighting) or across the span of the display (i.e.
full-array backlighting or direct-type structure). In edge lit LCDs an additional light guide
plate that reflects the light from the edges across the entire area of the display. Full-
array backlighting is typically more expensive to produce, due to a larger number of LEDs
required, but can produce more evenly spread light across a display. To aid the spread of
light across the back of an LCD panel back reflectors, diffusers and brightness
enhancement film (BEF) or dual brightness enhancement film (DBEF) are also used. The
luminance of LED backlights is typically controlled using either “global dimming”, where
all LED backlights are set to the same luminance levels, or “local dimming” (also known
as high dynamic range technology) where LED backlights can be controlled individually or
in zones.
There are three major types of LCD integrated display panels on the market, Twisted
Nematic (TN), Vertical Alignment (VA) and In-Plane switching (IPS), each with their own
characteristics and associated advantages and disadvantages. TN panels, which are the
cheapest type of LCD panel to produce for integrated displays, typically enjoy fast refresh
rates but have narrow viewing angles, reduced colour contrasts and limited luminance.
TN panels also benefit from the fact that when no voltage is passed across and LCD cell
then white light is let through (rather than being blocked), meaning that less power is
needed to produce the white backgrounds of common office applications. VA panels enjoy
better viewing angles, colour reproduction and higher luminance levels but tend to have
slower refresh times. IPS panels have wide viewing angles, provide accurate colours but
have slow response times.
As well as panel type, there are a number of technical features which determine the
overall technical performance of an integrated display. The most important feature of
displays which dictate performance is display size. Larger displays require more
backlighting and LCD cells which in turn increases power demands. The size of displays in
mobile computers, such as notebook computers, is largely limited by impacts on
portability. The integrated displays in non-mobile personal computers, such as integrated
desktop computers, are not limited by portability concerns and so could follow the
general trend of display size growth seen in other products such as computer monitors.
The resolution of an integrated display (i.e. the number of pixels it contains) is also an
important determinate of performance with higher resolution counts supporting improved
image quality. Resolution count, measured in megapixels (MP), has been increasing over
the last few years with high definition (HD) (i.e. 2.07MP) displays now common. The
resolution of integrated displays is likely to increase further in the next few years as
demand grows for ultra HD (UHD) (i.e. 8.3MP) and even higher definition displays.
Resolution count can impact power demand in displays as more electronics are needed to
drive the extra pixels. The extra pixels often result in increased pixel density (i.e. pixels
per area unit) which can in turn reduce the amount of light that reaches the front of the
display necessitating the need for more backlighting.
Higher performance displays, known as Enhanced Performance Displays (EPD), are
becoming more popular in standalone computer monitors but have yet to find their way
into integrated personal computer displays in large numbers. EPD displays, most
commonly based on IPS panels, have higher colour gamut, wider viewing angles, greater
colour contrast ratios and high resolutions. These types of displays can have higher
26
power demands due to lower transmissivity of light through additional filters and
potentially due to increased data processing requirements. Traditionally EPDs have been
used in fields such as computer aided design and computer game development, but are
increasingly being sold into mainstream uses.
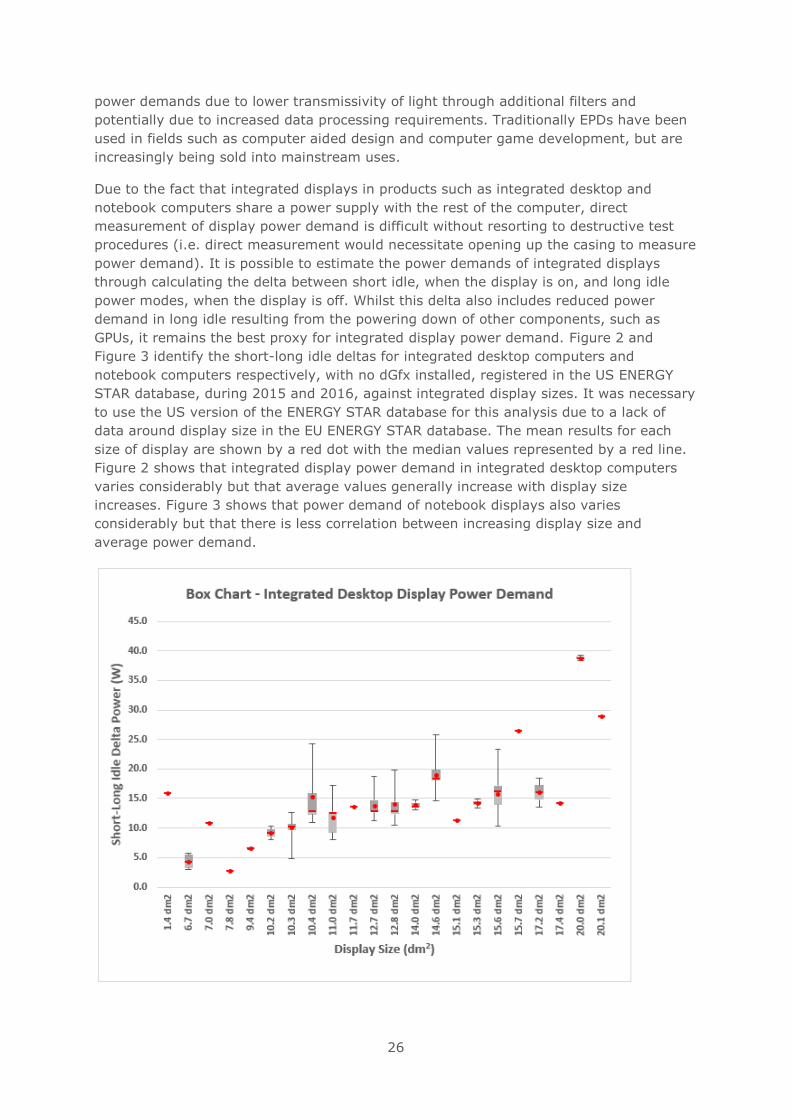
Due to the fact that integrated displays in products such as integrated desktop and
notebook computers share a power supply with the rest of the computer, direct
measurement of display power demand is difficult without resorting to destructive test
procedures (i.e. direct measurement would necessitate opening up the casing to measure
power demand). It is possible to estimate the power demands of integrated displays
through calculating the delta between short idle, when the display is on, and long idle
power modes, when the display is off. Whilst this delta also includes reduced power
demand in long idle resulting from the powering down of other components, such as
GPUs, it remains the best proxy for integrated display power demand. Figure 2 and
Figure 3 identify the short-long idle deltas for integrated desktop computers and
notebook computers respectively, with no dGfx installed, registered in the US ENERGY
STAR database, during 2015 and 2016, against integrated display sizes. It was necessary
to use the US version of the ENERGY STAR database for this analysis due to a lack of
data around display size in the EU ENERGY STAR database. The mean results for each
size of display are shown by a red dot with the median values represented by a red line.
Figure 2 shows that integrated display power demand in integrated desktop computers
varies considerably but that average values generally increase with display size
increases. Figure 3 shows that power demand of notebook displays also varies
considerably but that there is less correlation between increasing display size and
average power demand.

27
Figure 2. Average Short-Long Idle Delta (W) for Displays in ENERGY STAR registered Integrated
Desktop Computers.
Figure 3. Average Short-Long Idle Delta (W) for Displays in ENERGY STAR registered Notebook
Computers.
4.1.2.8 Software
The software installed on computers can have large impacts on functionality. The most
important piece of software included on a computer is the operating system. It is the
operating system that controls the power management of both the entire computer as
well as individual components. This functionality is supported through power
management standards such as the Advanced Configuration and Power Interface (ACPI)
specification which in turn is supported by most, but not all, commonly used operating
systems. To be effective, operating systems need to support power management under a
broad range of user conditions without impacting usability of a computer. That is,
operating systems should be able to support powering down a computer to a variety of
power modes and then also reliably support waking the computer back to an operating
condition. When operating systems fail to reliably support power management
functionality it can lead to power management settings being disabled and therefore
result in more energy use.
As at least some power management functionality is standard on all major operating
systems, costs to the user are nil. There may be some costs for the operating system
developers, especially where power management functionality has been shown not to be
fully functional thereby necessitating changes.
Further detailed information about the potential energy savings of power management
functionalities is given in the BAT section. Individual programmes installed on computers
can also have a large impact on power demands. Table 16 shows the results of battery

28
life testing on a single notebook using different internet browsers. The results show that
internet browsers can have a significant impact on system power demand, resulting in
reduced battery life for the most resource intensive programmes. All other software and
hardware configurations on the tested notebook remained the same apart from the
internet browser.
Table 16. Internet Browser Usage and Notebook Battery Lifetime. 9
Internet Browser Battery Life
(Minutes)
Edge 13.1 385
Chrome 50 355
Opera 37 (w/Flash 21.0) 352
Firefox 46.0 (w/Flash 21.0) 338
Internet Explorer 11
(w/Flash 21.0)
335
Major pieces of software such as the operating system can also impact energy use of
computers. Table 17 shows the results of battery life testing on a notebook computers
where different activities were undertaken. Even though Windows 10 is a newer
operating system, battery life was reduced during video playback after Windows 8.1 was
replaced with Windows 10. Again, the tests were performed on the same notebook
computers under the same conditions (i.e. same video, Wi-Fi connected, power saving
features turned on and display brightness set to 120 cd/m2)
Table 17. Operating System and Notebook Battery Life under different usage conditions.
Activity
Battery Life (Minutes)
Windows
8.1
Windows
10
Wi-Fi
browsing 194 200
Video
playback 260 213
Gaming 61 61
In both examples above, the level of functionality provided by the different software
packages was broadly comparable but energy use was not. This suggests that some
software packages are more energy efficient than others just as some hardware
components are more efficient than others. These differences in notebook battery life
illustrate the importance of considering software when assessing the energy efficiency of
computers.
4.1.3 BAT – Best Available Technology at product level
4.1.3.1 Desktop computers
There are many different types of desktop and integrated desktop computers available on
the EU market which provide different levels of functionality and performances. Given
these differences in functionality and performance no one single product could be
described as offering BAT that covers all usage scenarios. The product selected and
shown in Table 18 is an example of a desktop computer that will provide many of the
9 PCWORLD, 2016, “Which browser is best for battery life: We test Edge vs. Chrome vs. Opera vs. Firefox”, available from http://www.pcworld.com/article/3087338/browsers/which-browser-is-best-on-battery-we-test-edge-vs-chrome-vs-opera-vs-firefox.html

29
basic home and office productivity functions that users require, whilst doing so in a small
form factor and using little energy in the process.
Table 18. Technical specifications and energy characteristics of BAT for desktop computers.
Performance parameter Product Details
Manufacturer Apple
Commercial name Mac mini10
TEC at 230V (kWh) 20.94
Short idle state power (W) 5.00
Long idle state power (W) 3.10
Sleep mode power (W) 0.80
Off mode power (W) 0.30
CPU cores (no.) 2.00
Base CPU Speed Per Core
(GHz)
3.00
CPU performance score 6.00
RAM (GB) 16.00
GPU type iGfx
GPU GB/sec -
IPS efficiency, 10% 88%
IPS efficiency, 20% 89%
IPS efficiency, 50% 90%
IPS efficiency, 100% 89%
Sound pressure level
(operator position)
12dBA at idle
4.1.3.2 Integrated desktop computers
As with desktop computers, the range of functionalities and performances provided by
integrated desktop computers varies significantly amongst products on the EU market. As
such, in reality there may be many products at different levels of functionality and
performance that could be described as BAT. The product shown in Table 19 is an
example of BAT for one type of integrated desktop computer. The product has low short
idle power demands, is able to significantly reduce power demand in long idle and has
reasonable sleep and off mode power demands. In addition, the product includes an IPS
that is efficient across all of the reported loading levels.
Table 19. Technical specifications and energy characteristics of BAT for integrated desktop
computers.
Performance parameter Product Details
Manufacturer Apple
Commercial name 21.5 inch iMac11
TEC at 230V (kWh) 59.52
Short idle state power (W) 15.10
Long idle state power (W) 7.00
Sleep mode power (W) 2.00
Off mode power (W) 0.80
CPU cores (no.) 2.00
Base CPU Speed Per Core
(GHz)
3.80
10 Based on Mac mini energy and materials data representing models MGEM2, MGEN2, MGEQ2. See http://images.apple.com/environment/pdf/products/desktops/Macmini_PER_oct2014.pdf 11 Based on iMac energy and materials data representing models MK142, MK442, MK452. See http://images.apple.com/environment/pdf/products/desktops/21_5inch_iMac_PER_Oct2015.pdf

30
Performance parameter Product Details
CPU performance score 7.6
RAM (GB) 2.00
Display Size (dm2) 11.03
Display Resolution (MP) 1.44
Storage Type HDD
Storage drives count 1.00
Total Storage capacity
(GB)
500
GPU type iGfx
GPU GB/sec -
PSU rated output (W) 120.00
IPS efficiency, 10% 84%
IPS efficiency, 20% 89%
IPS efficiency, 50% 92%
IPS efficiency, 100% 90%
4.1.3.3 Notebook computers
As with most personal computers, functionality and performances found in notebook
computers on the EU market vary considerably. Therefore, identifying a single product as
being BAT does not consider the fact that there are likely many BAT products at different
levels of functionality and performances. The example BAT product shown in Table 20
reflects a notebook computer that provides a relatively high level of performance in
terms of RAM provision but slightly lower performances in terms of CPU, storage and
graphics processing abilities. The example BAT notebook has a very low short idle power
demand, employs a good degree of power management to reduce long idle power
demand to less than 1W and has very low sleep and off mode power demand
requirements.
Table 20. Technical specifications and energy characteristics of BAT for notebook computers.
Performance parameter Product Details
Manufacturer Apple
Commercial name 12-inch
MacBook12
TEC at 230V (kWh) 8.94
Short idle state power (W) 2.70
Long idle state power (W) 0.80
Sleep mode power (W) 0.30
Off mode power (W) 0.10
CPU cores (no.) 2.00
Base CPU Speed Per Core
(GHz)
1.10
CPU performance score 2.2
RAM (GB) 8.00
Display Size (dm2) 4.18
Display Resoluition (MP) 3.32
Storage Type Flash
Storage drives count 1
GPU type iGfx
GPU GB/sec -
12 Based on Mac mini energy and materials data representing models MLH72, MLHA2, MLHE2, MMGL2, MLH82, MLHC2, MLHF2, MMGM2. See http://images.apple.com/environment/pdf/products/notebooks/MacBook_PER_April2016.pdf

31
Performance parameter Product Details
EPS rated output (W) 29.00
EPS average efficiency 88%
4.1.3.4 Tablet/slate computers
There is less variability in the functional and performances attributes of tablet/slate
computers than with other types of personal computer. This reduced variability is
primarily due to the fact that these products do not typically offer high levels of
computing performance. The main functional variability in tablets is the size and quality
of the integrated display. The product shown in Table 21 has very low overall energy use,
very low short idle power demand and low off mode power demand. The sleep mode
power demand is higher than expected which may be a result of a reporting error.
Table 21. Technical specifications and energy characteristics of BAT for table/slate computers.
Performance parameter Product Details
Manufacturer Apple
Commercial name 9.7-inch iPad
Pro13
TEC at 230V (kWh) 6.92
Short idle state power (W) 1.00
Long idle state power (W) 0.30
Sleep mode power (W) 1.10
Off mode power (W) 0.30
CPU cores (no.) 2.00
Base CPU Speed Per Core
(GHz)
2.30
CPU performance score 4.6
RAM (GB) 2.00
Display Size (dm2) 2.91
Display Resoluition (MP) 3.15
Storage Type Flash memory
Storage drives count 1
GPU type iGfx
GPU GB/sec -
EPS rated output (W) 10.70
EPS average efficiency 79%
4.1.3.5 Workstations
Workstation computers are designed to provide a high level of computational
performance. Given that there remains a strong correlation between computing
performance and overall computer energy use, a BAT workstation computer doesn’t
necessarily use a small amount of energy. The product shown in Table 22 is a very high
performance workstation computer but provides this high level of performance efficiently.
Indeed the product’s “weighted power consumption” (PTEC) is almost 70% less than the
requirement given to this product under the ENERGY STAR v6.1 specification.
Table 22. Technical specifications and energy characteristics of BAT for workstations.
Performance parameter Product Details
Manufacturer Lenovo
13 See http://images.apple.com/environment/pdf/products/ipad/9.7-inch_iPadPro_PER_mar2016.pdf

32
Performance parameter Product Details
Commercial name ThinkStation
P910
Power Demand (PTEC) 41.80
Short idle state power (W) 74.00
Long idle state power (W) 71.50
Sleep mode power (W) 6.40
Off mode power (W) 2.40
CPU cores (no.) 14.00
Base CPU Speed Per Core
(GHz)
2.00
CPU performance score 28
RAM (GB) 32.00
Storage Type SSD
Storage drives count 2.00
GPU type G7
GPU GB/sec 192
IPS efficiency, 10% 84%
IPS efficiency, 20% 91%
IPS efficiency, 50% 92%
IPS efficiency, 100% 89%
4.1.3.6 All in one computers
There are relatively few all-in-one computers on the EU market and so the choices
around selecting a BAT product are limited. The product shown in Table 23 shows an
example BAT all-in-one that has relatively low short idle power demands in comparison
to other products on the market and has employed some power management
functionality as witnessed by the relatively low sleep mode power demand.
Table 23. Technical specifications and energy characteristics of BAT for all in one computers.
Performance parameter Product Details
Manufacturer DELL
Commercial name XPS 18
TEC at 230V (kWh) 64.30
Short idle state power (W) 17.00
Long idle state power (W) 7.90
Sleep mode power (W) 1.70
Off mode power (W) 0.30
CPU cores (no.) 2.00
Base CPU Speed Per Core
(GHz)
2.00
CPU performance score 4.00
RAM (GB) 8.00
Display Size (dm2) 9.41
Display Resoluition (MP) 2.07
GPU type iGfx
4.1.3.7 Thin Client
The level of functionality and performance in thin clients on the EU market is less diverse
than for other types of personal computers. This is mainly due to the fact that most of
the computational performance provided when using a thin client is conducted on servers
rather than on the thin client product. The example BAT product shown in Table 24 has
relatively low short and long idle power demands in comparison to competing products

33
and employs a sleep mode which is not found on all thin clients. The example BAT
products is also equipped with a relatively efficient EPS.
Table 24. Technical specifications and energy characteristics of BAT for thin clients.
Performance parameter Product Details
Manufacturer IGEL
Commercial name IGEL-UD2
Series
TEC at 230V (kWh) 22.29
Short idle state power (W) 4.70
Long idle state power (W) 4.30
Sleep mode power (W) 0.60
Off mode power (W) 0.50
CPU cores (no.) 4.00
Base CPU Speed Per Core
(GHz)
1.90
CPU performance score 7.60
RAM (GB) 2.00
GPU type iGfx
GPU GB/sec -
EPS average efficiency 85%
4.1.4 BAT – Best Available Technology at a component level
4.1.4.1 CPU efficiency
The performance levels of CPUs vary considerably and as such it is difficult to identify a
single CPU that can be identified as “best available technology” (BAT). That is, whilst
some CPUs have very low power demands across all power modes they may not offer
high levels of performance (e.g. have lower frequencies and core numbers) or may have
limited functionality (e.g. no iGfx included). As such, comparisons against CPUs that offer
higher levels of performance and greater functionalities but with corresponding higher
power demands are not completely justifiable when attempting to identify BAT. If CPU
performances and power demand can be accurately measured, then there is a possibility
of using a “performance per watt” approach to identify the most efficient CPUs under
given conditions. That is, whilst a high-powered CPU may provide more performance per
watt of power demand, the level of performance and associated power demand may still
be too high for that product to be considered “efficient”. However, measuring the power
demands of CPUs is complex due to the fact that it is an internal component and as such
CPU power demand can be difficult to isolate from the power demands of other
components such as the motherboard. CPU power demands can be estimated through
measurement of current, or voltage across a shunt resistor placed in the CPU power
supply circuit, using a clamp meter but results may not be accurate. Some software
packages are also available that estimate the power demand of a CPU during use.
CPU energy efficiencies can vary considerably depending on the amount of work that is
being done by the CPU at any given moment. That is, whilst some CPUs may be very
efficient in an idle state (i.e. when they are conducting no or very little work) they may
not be very efficient during active states (i.e. when the CPU is conducting work).
Rather than identifying a single CPU that represents BAT it is more appropriate to identify
the energy efficiency technologies used within CPUs that represent BAT.

34
CPU support for high core and package C-states (i.e. C6, C7 or above) is an important
consideration as these can help reduce idle mode power demand considerably. Many
CPUs now support C6 and C7 states which provide the opportunity for much greater
granular power management. This has allowed some CPU manufacturers to support
“micro-sleeps” where most parts of a CPU can be powered down and brought back to an
active state following nano-second periods of inactivity such as the time gasp between
keystrokes during typing. Whilst CPU C-state support can be described as BAT it is also
important to consider that the rest of the computer components also need to support this
CPU energy efficiency functionality. As such, high C-state support will only be BAT in
computer systems (so including firmware and software) that fully support this
functionality.
Despite significant improvements already having been made across most products,
current leakage across CPU transistors remains an important consideration in CPU energy
efficiency. As transistor sizes reduce (die shrinking) high leakage current due to short-
channel effects and varying dopant levels becomes problematic. New CPU architectures
based on non-planar or "3D" transistors (i.e. multiple gate field-effect transistors
(MuGFETs)), such as Fin Field Effect Transistor (FinFET) or Tri-gate transistors, can
significantly reduce current leakage across transistors compared to traditional planar
MOSFETs. As such, CPUs based on 3D transistor structures could be described as BAT,
especially for higher performance CPUs where the leakage problems that are solved by
the switch in CPU architecture design are more important.
The majority of CPUs on the market support at least some voltage and frequency scaling
in response to the amount of work being conducted. In most implementations, the
computer OS requests a particular level of performance (i.e. P-state) from the CPU.
Based on commands originating from the OS, the CPU frequencies and voltage levels are
adjusted. The granularity of this DVFS (dynamic voltage and frequency scaling) is limited
to the way in which the P-states are defined by the computer manufacturer. Whilst these
technologies are important, due to their ubiquity, they cannot readily be described as
BAT. Nevertheless, these technologies have been enhanced in newer CPUs with the OS
handing control of frequency and voltage scaling back to the CPU itself. This enhanced
control over frequency and voltage scaling requires dedicated microcontrollers included
on the CPU package, which can identify the most efficient clock rate at any given time
and also support micro-sleeps where no work is being conducted. The increased
granularity of DVFS will likely results in further energy savings and so could be described
as BAT. These types of technologies are more likely to be found in mobile computers,
where there is a strong need to reduce energy use to extend battery life, than in mains
powered products for where there are fewer drivers to reduce the amount of energy
used. Users of non-mobile products may still have concerns over the amount of energy
consumed by their products due to impacts on electricity bills, and so these newer
technologies should be encouraged in non-mobile as well as mobile products.
4.1.4.2 Software efficiency
A computer’s OS has a large degree of responsibility for the energy used by a computer
across all power states (i.e. active, idle and low power modes).
Many operating systems include power management functionality with settings that can
be defined by users, such as the ability to enter low power modes (e.g. sleep mode) after
a certain period of inactivity. Whilst this functionality is common practice, and so could
not normally be defined as BAT, the functionality is not always reliable. That is, whilst an

35
OS may support powering down of a computer into a low power mode it may not fully
support powering the computer back to an active mode with all settings, such as network
connections, intact. This unreliability can cause power management functionalities to be
disabled, by either users or central IT staff, due to negative impacts on usability. As
such, an OS that reliably supports powering down of computers into low power modes
with a smooth transition back to an active, or idle state, with full functionality can be
described as BAT.
As discussed in the previous section, a computer’s OS currently plays a large part in
controlling the efficiency of CPUs but this responsibility is likely to be handed back to the
CPU itself as technology improves. A computer’s OS may also control power management
of other components such as wireless controllers and, to a certain extent, dGfxs. OS can
also manage the computing resources that are dedicated to individual programmes
opened on the computer. For example, OS can identify when a programme is not being
used and then throttle performance, suspend or even terminate the programme. Again,
whilst these OS functionalities are common place it could still be described as BAT where
the activities are performed without impacting the usability of products.
Some OS on the market do not support ACPI S3 type sleep modes but rather rely on
using long idle as a way to reduce power demand during periods of inactivity. The
reliance on long idle over sleep modes is normally found in low powered products such as
tablet computers but can also be found in some notebook and desktop computers. If long
idle power demand is only marginally less than short idle power demand this could be
viewed as unacceptable. However, where long idle power demand is significantly less
than short idle power demand, and the product is frequently placed in long idle without
impacting the usability of the product, then this could potentially be described as
approaching BAT.
Newer CPUs support an innovative set of sleep states called S0i”x” states. These include
new power states which will allow personal computers to work more like a smartphone in
that information, such as emails and software updates, will be able to be sent to a
computer even when it is sleeping. From a hardware perspective, it means that during
activation of the S0ix states whole parts of a system on chip (SoC design) can be
powered down. This means that the system will be very efficient.
Microsoft are actively trying to encourage and support use of S0i”x” states through a
functionality called “Modern Standby”.14 “Modern Standby” functionality is currently only
available in a small number of example products, but the IT industry is actively trying to
encourage its development by ensuring that new hardware supports the functionality.
4.1.4.3 GPU efficiency
Identifying the power demand of iGfxs, and hence a BAT value, is a complex undertaking
because they are normally included as an integral part of a CPU package. As such, as
with CPUs, given the difficulty with identifying exact power demand levels, BAT for iGfxs
needs to be defined in terms of the technologies included to improve energy efficiency.
As most iGfxs are an integral part of the CPU package, the efficiency improvement
technologies that could be viewed as BAT are much the same as those listed for CPUs.
Identifying a BAT line for dGfx is less challenging as power demand can either be
measured directly or estimated. The power demands of dGfxs used within desktop and
14 https://msdn.microsoft.com/en-us/library/windows/hardware/mt282515(v=vs.85).aspx

36
workstation computers can be measured directly using an oscilloscope, high-resolution
current probes and a riser card placed between the motherboard and the dGfx. This
approach to testing the power demand of dGfx is a complex undertaking and requires
opening of the computer casing. The power demands of dGfx within desktop and
workstation computers can also be estimated by identifying the difference in power
demand when a dGfx is installed and when no dGfx is installed (N.B. this approach
requires that the computer has a CPU with iGfx). Measuring the power demand of dGfxs
included within mobile products could be conducted in a similar manner where the dGfx
can be easily removed and replaced.
As previously discussed, dGfx manufacturers have taken a number of important steps to
reduce the power demands of their products in recent years. Table 25 illustrates the
performances and directly measured power demands of high performance dGfxs available
on the EU market15. It is clear that dGfx manufacturers have been able to substantially
reduce idle power demand in even their highest specification products to around 10W.
The two dGfxs in bolded text could be assumed to represent idle mode BAT.
Table 25. Power Demands and Performances of high specification dGfxs
Discrete GPU Name
Date Launched to Market
Framebuffer Bandwidth
(GB/s)
Idle Power
Demand (W)
Power Demand (Furmark Test) (W)
Idle Efficiency (W/GB/s)
Active Efficiency (W/GB/s)
AMD Fury Nano Aug-15 512.0 11.0 181.0 0.021 0.354
NVidia Geforce GTX 1080 FE
May-16 320.0 7.0 176.0 0.022 0.550
NVidia Titan X (Pascal)
Aug-16 480.0 11.0 252.0 0.023 0.525
NVidia GeForce GTX 1070 FE
Jun-16 256.0 9.0 150.0 0.035 0.586
MSI R9 390 Gaming 8G
Jun-15 384.0 15.0 309.0 0.039 0.805
MSI R9 390X Gaming 8G
Jun-15 384.0 15.0 367.0 0.039 0.956
MSI GTX 1060 Gaming X 3G
Aug-16 192.0 10.0 122.0 0.052 0.635
MSI GTX 1060 Gaming X 6G
Aug-16 192.0 10.0 130.0 0.052 0.677
AMD RX 480 8GB Jun-16 256.0 16.0 168.0 0.063 0.656
MSI R9 380X Gaming 4G
Nov-15 182.4 13.0 251.0 0.071 1.376
MSI GTX 1050 Ti Gaming X 4G
Oct-16 112.0 8.0 71.0 0.071 0.634
MSI GTX 970 Gaming 4G
Sep-14 196.0 14.0 205.0 0.071 1.046
MSI GTX 980 Gaming 4G
Sep-14 224.0 16.0 209.0 0.071 0.933
Asus RX 470 StriX Aug-16 211.0 16.0 145.0 0.076 0.687
Gigabyte GTX 960 Gaming G1
Jan-15 112.0 11.0 167.0 0.098 1.491
Whilst idle mode power demands for the high performance dGfxs shown in Table 4 are
low, the same cannot be said for the power demands under load. It is clear that when
these high-performance products are placed under load (e.g. running the Furmark
benchmark) their power demands are likely to be higher than the rest of the computer
combined. Despite these high power demand levels it is clear that the AMD Fury, which
15 dGfx power demand measurements sourced from http://www.tomshardware.co.uk/nvidia-geforce-gtx-1050-ti,review-33685-6.html

37
utilises high bandwidth memory (HBM) in place of GDDR5 memory, and which provides
the highest framebuffer bandwidth, is also the most efficient under this particular loading
scenario. As such, the AMD Fury dGfx could be considered as reflecting BAT under this
scenario.
As previously mentioned, hybrid graphics approaches, which are predominantly used in
mobile and integrated desktop computers, can also provide a significant amount of
energy savings when configured appropriately. In some hybrid graphics solutions, the
dGfx is always powered on when a mobile product is connected to a mains power source.
In more sophisticated hybrid graphics implementations, the dGfx is only utilised when
higher graphics performances are required. The more sophisticated approach to hybrid
graphics will likely lead to a dGfx being in an active state for less time and therefore save
more energy. As such only hybrid graphics solutions that support performance based
selection of a dGfx should be considered BAT.
4.1.4.4 Internal Power Supply efficiency
Efficiency data for IPSs used in personal computers is widely available through the
80PLUS programme and as such it is a straightforward process to identify BAT efficiency
levels. Figure 4 illustrates the BAT efficiencies for IPS registered through the 80PLUS
programme and compares these levels to the requirements listed in the EU ecodesign
regulation on computers. It is clear from the results that the BAT efficiency levels are far
in advance of the current EU ecodesign requirements.

38
Figure 4. BAT Efficiencies of IPS Registered with the 80Plus Programme 2014 to 2016 16.
Table 26 identifies the single highest efficiencies per loading state noted within the
80Plus registered IPS. The results show that the current EU ecodesign IPS efficiency
requirements (85% efficiency at 50% load and 82% efficiency at both 20% and 100%
loading) are significantly below BAT levels.
Table 26. Maximum efficiencies observed amongst 80PLUS Registered PSUs.
Maximum Observed Efficiency at loading profile
10% load 20% load 50% load 100% load
89.9 94.3 94.3 93.5
4.1.4.5 Integrated display efficiency
Figure 5 and Figure 6 illustrate the minimum short-long idle deltas for integrated desktop
and notebook computers, without any dGfxs installed, in the US ENERGY STAR database.
The values show that estimated minimum display power demands vary considerably
amongst each product type but some consistency is evident for notebook displays over
2.5 dm2. The high degree of variability in BAT values is likely an artefact of estimating
display power demand using the short-long idle delta as it does not take account of other
components, such as the CPUs, which are also likely to have variable short-long idle
deltas.
16 Plugload Solutions, 80 PLUS® Certified Power Supplies and Manufacturers, available from https://www.plugloadsolutions.com/80PlusPowerSuppliesDetail.aspx?id=0&type=4
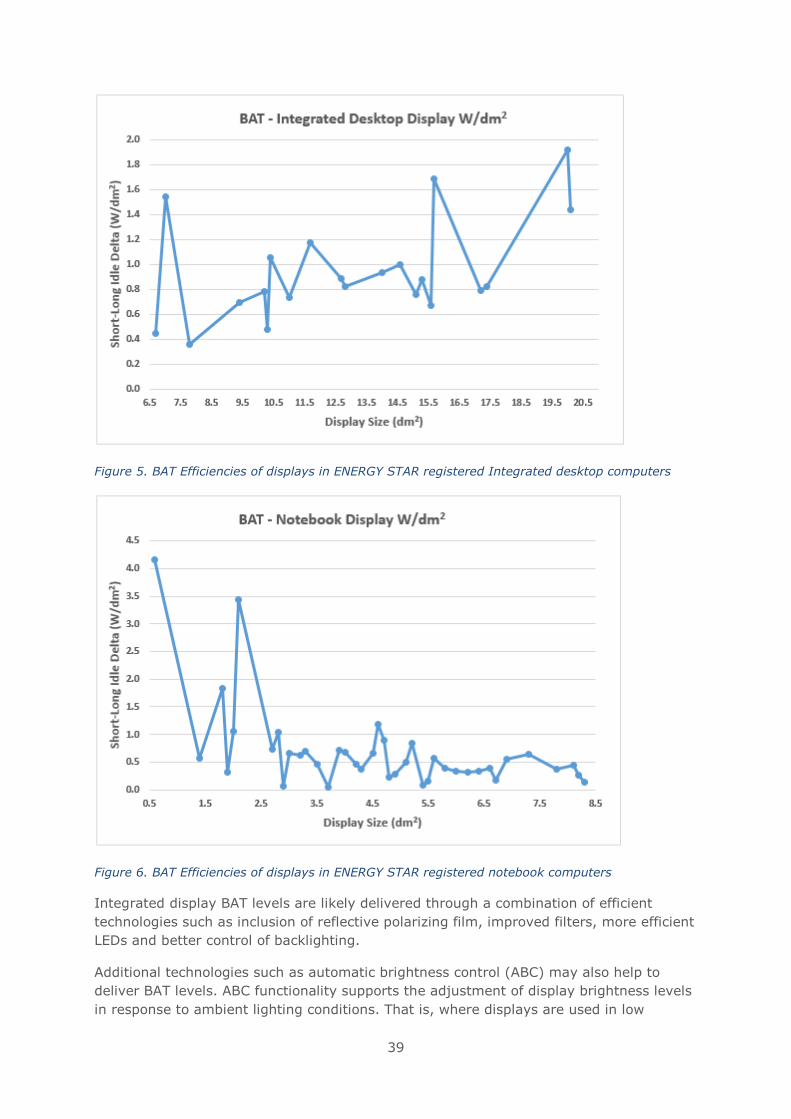
39
Figure 5. BAT Efficiencies of displays in ENERGY STAR registered Integrated desktop computers
Figure 6. BAT Efficiencies of displays in ENERGY STAR registered notebook computers
Integrated display BAT levels are likely delivered through a combination of efficient
technologies such as inclusion of reflective polarizing film, improved filters, more efficient
LEDs and better control of backlighting.
Additional technologies such as automatic brightness control (ABC) may also help to
deliver BAT levels. ABC functionality supports the adjustment of display brightness levels
in response to ambient lighting conditions. That is, where displays are used in low
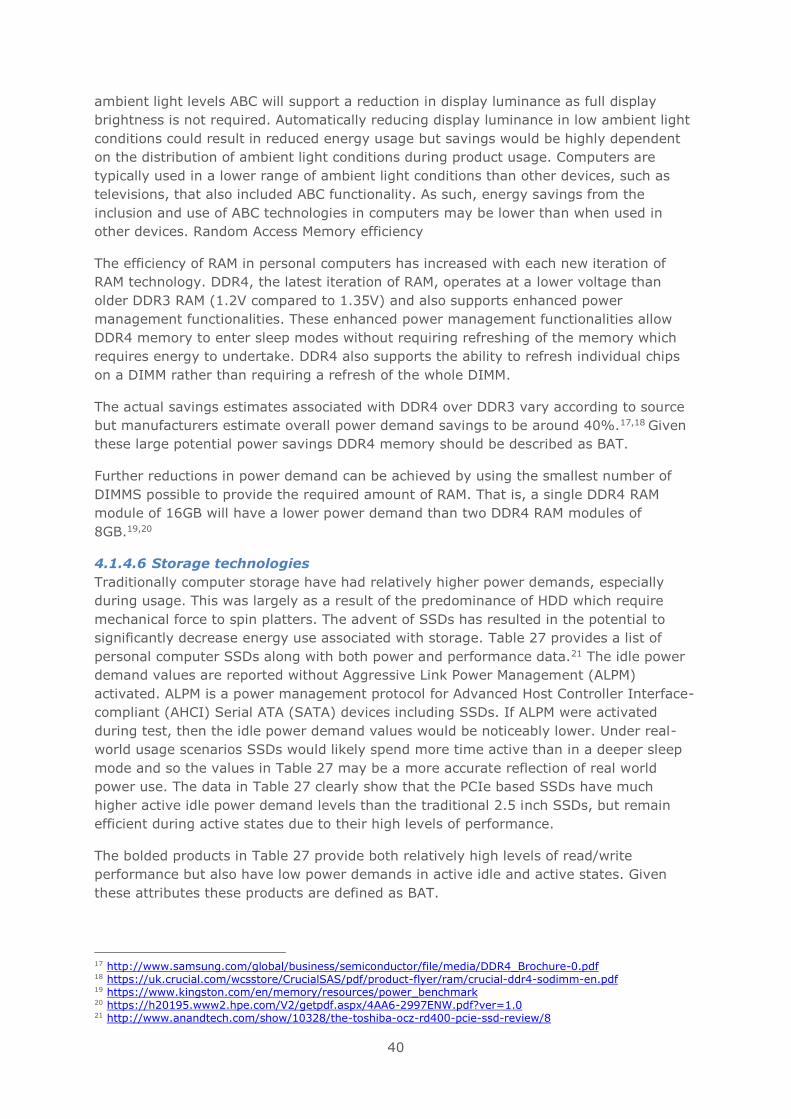
40
ambient light levels ABC will support a reduction in display luminance as full display
brightness is not required. Automatically reducing display luminance in low ambient light
conditions could result in reduced energy usage but savings would be highly dependent
on the distribution of ambient light conditions during product usage. Computers are
typically used in a lower range of ambient light conditions than other devices, such as
televisions, that also included ABC functionality. As such, energy savings from the
inclusion and use of ABC technologies in computers may be lower than when used in
other devices. Random Access Memory efficiency
The efficiency of RAM in personal computers has increased with each new iteration of
RAM technology. DDR4, the latest iteration of RAM, operates at a lower voltage than
older DDR3 RAM (1.2V compared to 1.35V) and also supports enhanced power
management functionalities. These enhanced power management functionalities allow
DDR4 memory to enter sleep modes without requiring refreshing of the memory which
requires energy to undertake. DDR4 also supports the ability to refresh individual chips
on a DIMM rather than requiring a refresh of the whole DIMM.
The actual savings estimates associated with DDR4 over DDR3 vary according to source
but manufacturers estimate overall power demand savings to be around 40%.17,18 Given
these large potential power savings DDR4 memory should be described as BAT.
Further reductions in power demand can be achieved by using the smallest number of
DIMMS possible to provide the required amount of RAM. That is, a single DDR4 RAM
module of 16GB will have a lower power demand than two DDR4 RAM modules of
8GB.19,20
4.1.4.6 Storage technologies
Traditionally computer storage have had relatively higher power demands, especially
during usage. This was largely as a result of the predominance of HDD which require
mechanical force to spin platters. The advent of SSDs has resulted in the potential to
significantly decrease energy use associated with storage. Table 27 provides a list of
personal computer SSDs along with both power and performance data.21 The idle power
demand values are reported without Aggressive Link Power Management (ALPM)
activated. ALPM is a power management protocol for Advanced Host Controller Interface-
compliant (AHCI) Serial ATA (SATA) devices including SSDs. If ALPM were activated
during test, then the idle power demand values would be noticeably lower. Under real-
world usage scenarios SSDs would likely spend more time active than in a deeper sleep
mode and so the values in Table 27 may be a more accurate reflection of real world
power use. The data in Table 27 clearly show that the PCIe based SSDs have much
higher active idle power demand levels than the traditional 2.5 inch SSDs, but remain
efficient during active states due to their high levels of performance.
The bolded products in Table 27 provide both relatively high levels of read/write
performance but also have low power demands in active idle and active states. Given
these attributes these products are defined as BAT.
17 http://www.samsung.com/global/business/semiconductor/file/media/DDR4_Brochure-0.pdf 18 https://uk.crucial.com/wcsstore/CrucialSAS/pdf/product-flyer/ram/crucial-ddr4-sodimm-en.pdf 19 https://www.kingston.com/en/memory/resources/power_benchmark 20 https://h20195.www2.hpe.com/V2/getpdf.aspx/4AA6-2997ENW.pdf?ver=1.0 21 http://www.anandtech.com/show/10328/the-toshiba-ocz-rd400-pcie-ssd-review/8

41
Table 27. BAT Efficiencies of Storage Devices.
Storage Product Name Storage
Product Type
Idle
Power
Demand
(No
ALPM)
(W)
Mixed
4KB
Random
Read/
Write
(W)
Mixed
4KB
Random
Read/
Write
(MB/s)
Efficiency
-
(W/MB/s)
OCZ RD400 512GB PCIe SSD 2.53 3.14 251.74 0.012
OCZ RD400 1TB PCIe SSD 2.49 3.13 248.39 0.013
OCZ RD400 256GB PCIe SSD 2.48 3.03 241.52 0.013
Samsung 950 Pro 512GB PCIe SSD 1.64 2.83 218.34 0.013
Samsung 950 Pro 256GB PCIe SSD 1.63 2.67 194.97 0.014
Samsung 850 Pro 1TB SSD 2.5-Inch 0.36 2.30 171.46 0.013
Samsung 850 Pro 256GB SSD 2.5-Inch 0.31 1.94 168.14 0.012
Samsung 850 Pro 512GB SSD 2.5-Inch 0.30 1.93 167.9 0.011
Samsung 850 EVO 500GB SSD 2.5-Inch 0.31 1.60 162.07 0.010
Samsung 850 EVO 250GB SSD 2.5-Inch 0.31 1.55 149.63 0.010
Samsung 850 EVO 1TB SSD 2.5-Inch 0.32 2.21 127.04 0.017
OCZ Vector 180 480GB SSD 2.5-Inch - 1.67 106.62 0.016
OCZ Vector 180 240GB SSD 2.5-Inch 0.61 1.54 104.56 0.015
OCZ Vector 180 960GB SSD 2.5-Inch - 1.82 101.13 0.018
OCZ Trion 150 240GB SSD 2.5-Inch 0.16 1.63 78.07 0.021
OCZ Trion 150 960GB SSD 2.5-Inch 0.20 1.68 77.94 0.022
OCZ Trion 150 480GB SSD 2.5-Inch 0.18 1.60 70.87 0.023
4.1.4.7 Advanced power management
The way in which low power modes have been implemented in common operating
systems has evolved. Table 28 shows the evolution of these low power modes in the
Windows operating systems. Power management functionality in some other operating
systems, such as the Apple’s macOS, has also evolved and improved in recent years.
Power management functionality may not be so advanced in some minor operating
systems.
The advent of S0iX states in new CPU chipsets along with the development of Modern
Standby” are examples of advanced power management functionalities that may save
significant amounts of energy going forward. Many of the failings of current power
management functionality, such as the ability for users to disable, may be solved by the
further use of “Modern Standby”.
Table 28. The evolution of supported low power states in.
Operating
System
Windows 7 Windows 8 Windows 10
Supported Sleep States
ACPI S3 & S4 ACPI S3 & S4 Connected Standby &
ACPI S4
ACPI S3 & S4 Modern Standby &
ACPI S4
Supported Devices
Desktops
Integrated Desktops
Mobile computers
Smart phones
Architecture X86/X64 X86/X64 X86/X64/ARM X86/X64 X86/X64/ARM
The low power mode infrastructure has evolved in several ways within Windows 10. In
particular, Modern Standby expands upon the Windows 8.1 Connected Standby power
model to allow greater compatibility across component types. For example, Modern
Standby supports systems based on a wide range of storage technologies (i.e. HDD, SSD
and SSHD). Furthermore, network interface cards (NICs) that could not be supported

42
under Connected Standby can be supported under Modern Standby. Modern Standby, is
implemented through the S0 low power idle model. Network activity can also be more
easily limited in Modern Standby has the flexibility to configure the default behaviour to
limit which could help to reduce low power demand levels.
Modern Standby takes advantage of the more flexible power scaling within modern
chipsets and can be implemented on a wide range of mobile and non-mobile computers.
Computers using the Modern Standby functionality can be can be configured to be either
connected or disconnected to a network. However, the computer remains in the S0 low
power state irrespective of whether the product is connected or disconnected from to a
network.
Modern Standby potentially provides several advantages over older low power state
technologies, such as ACPI S3, including:
Faster resume from a low power state. Microsoft claims that resume time from the
low power states under Modern Standby is at least twice as fast as ACPI S3
resume22. These faster resume times could improve user experience with power
management helping to ensure that the functionality is not disabled and provide
more energy savings.
Computers connected to a network can be programmed to wake based on specific
network patterns. This can allow products to receive updates, emails and VoIP
calls without the need to leave a computer turned on.
Waking a computer from ACPI S3 requires the functionality to be integrated into
the BIOS. The reliance on the BIOS aspect increases wake times and makes
implementation more difficult. Modern Standby only requires a hardware interrupt
and so may eliminate any need for firmware interaction.
Previous implementations of connected standby in Windows 8.1 required that the system
woke at least once every thirty seconds to process work. Systems with Modern Standby
implemented within Windows 10 only wake when necessary such as for OS maintenance
updates or the user wakes the system. This has the potential to save further energy.
Modern Standby is supported in both Windows 10 desktop and Windows 10 Mobile. It is
likely that growth of Modern Standby will mostly be centred on mobile computers but
could extend to desktop computers where energy saving potentials are probably higher.
Panel self-refresh (PSR) technology is another example of an advanced power
management functionality that offers the potential to save energy during short periods of
user inactivity before a power down event occurs (i.e. the computer powers down to long
idle, sleep mode or hibernate mode). This technology involves the inclusion of a small
amount of memory that stores frames allowing GPUs to be powered down when a display
doesn’t need to be refreshed.
4.1.5 BNAT – Best Not Available Technology
Identifying BNAT in computer components is a complex undertaking because the industry
moves fast and what may appear as a future BNAT opportunity may be quickly
superseded by a new emerging technology. This section of the report investigates some
future BNAT opportunities within the main computer components.
22 https://msdn.microsoft.com/en-us/library/windows/hardware/mt282186(v=vs.85).aspx

43
4.1.5.1 CPU Efficiency
CPU efficiency is likely to continue to evolve as reductions in process size continue (i.e.
down to 7nm and 5nm). As the process size of CPUs and other components continues to
reduce, leakage current will become an increasing concern for energy efficiency. New
materials and architecture designs will be required to reduce leakage. This may include
the development of improved node processes using new materials such as carbon
nanofibers.
CPU power management opportunities are also likely to improve with the advent of
better and wider implementation of SI0x states across CPUs and SoC designs. With the
support of software based solutions such as Modern Standby computers could act much
more like smart phones, in terms of power management functionality, and become
significantly more efficient.
4.1.5.2 Software Efficiency
Microsoft are actively working with hardware manufacturers to ensure that Modern
Standby is supported across more computer products. This holds the potential to
significantly reduce energy usage in products that support this functionality.
4.1.5.3 Graphics Processing Unit Efficiency
The energy efficiency levels found in both iGfx and dGfx is likely to continue to increase
in future, mirroring the improvements in CPUs and OS.
Usage of high band width memories (HBM) in future iGfX and dGfx will likely lead to
significant improvements in performance whilst also offering reduced energy
consumption.
4.1.5.4 IPS Efficiency
IPS efficiency is likely to further increase in future with the advent of two stage IPS which
tackle inefficiencies at low load levels: the delta between active state power demand and
idle power demand is growing, hence the load on the IPS is decreasing in idle mode
which then results in further inefficiencies. Two stage IPSs will include a smaller IPS that
provides power to computers at low loading levels and allowing the power management
of the larger IPS. This new technology is currently being developed in the market and is
likely to become more important going forward as loading levels on higher performance
computers continue to fall.
4.1.5.5 Integrated Display Efficiency
Improvements in integrated display efficiencies will mirror improvements found in the
external display and television products. This will likely include the development of
quantum dot based integrated displays which hold the potential to significantly reduce
the power needed for panel backlighting.
4.1.5.6 Memory Efficiency
Further power demand savings are expected from DDR4 memory as production moves to
a 10nm process. It is estimated that a further power demand saving of between 10% to
20% per DIMM could be realised as a result of this shift to a smaller manufacturing
process.23
23 https://news.samsung.com/global/samsung-starts-mass-producing-industrys-first-10-nanometer-class-dram

44
HBM may also be used in RAM modules going forward, offering much greater
performances with lower power demand levels.
4.1.5.7 Storage Technologies
New types of storage products such as the Intel Optane drives are due to start finding
their way to market in the near future.24 These products which provide non-volatile
memory (NVM) will offer much faster retrieval of stored data, at RAM retrieval
performance levels, whilst also purportedly offering improvements in energy efficiency.
4.1.5.8 Enhanced power management
It is expected that innovations such as Microsoft Modern Standby will continue to be
adopted by manufacturers going forward and that this type of functionality will be
supported in other OS available on the market.
4.2 Use of materials for average technologies and BAT
The life cycle of personal computers is represented by the production, distribution, use
and end of life of personal computers. The geographical coverage of personal computers
used in the European market through their life cycle is usually quite broad. Materials and
components are primarily manufactured in Europe, the USA and Asia, shipped to China
for assembly, then back to Europe for consumer use and disassembly at their end of life,
and finally shipped to Asia, Africa or other countries for reuse, recycling and final
disposal. Therefore, their life cycle is complex, covering many steps and involving many
actors in the supply, use and disposal chain, and implying the use of a wide range of
materials and resources and creating environmental impacts through the whole life cycle.
From previous studies25,26,27,28 and what has been declared by some manufacturers, it is
clear that the hot spots in the life cycle of computers in terms of material and resource
use are the production and use stages, however if more reuse and recycling of personal
computers happen at the end of life, the overall use of materials and the computers’
overall environmental impacts can be reduced. Furthermore, by increasing the reuse and
recycling of components and materials locally where the use of the computers takes
place, more access to highly valuable materials is achieved within the EU. This also
increases the amount of materials available for reuse and/or recycling which is necessary
to make their recovery more economically attractive.
A detailed description of the use patterns and the paths of personal computers at their
end of life has already been presented in the task 3. The focus of this chapter is on the
manufacturing, specifically on product configuration and use of materials, of average
technologies and BAT of personal computers.
The manufacturing of personal computers happens at different times and places, starting
with the extraction of raw materials, the manufacturing of components and the assembly
of the computer product. The places where these activities happen are different
according to the sourcing of the parts to manufacture the components and the
availability of raw materials to produce these parts. The components used in a personal
24 http://www.intel.com/content/www/us/en/architecture-and-technology/non-volatile-memory.html 25 Lot 3 Preparatory study on personal computers (desktops and laptops) and computer monitors, 2007. 26 Ecological and economic aspects when comparing workplace computers for use in public authorities, including user behavior. Öko-Institut e.V. and TU Berlin, 2016 (in German, summary in English). 27 Paradigm Shift in Green IT – Extending the Life-Times of Computers in the Public Authorities in Germany. Prakash et al., 2016. Electronics Goes Green Conference Proceedings. 28 Personal computer life cycle assessment study: the case of Western Australia. Sirait et al., 2012.

45
computer influence the computer’s overall performance, as it has been discussed
previously. In some cases, the materials used for manufacturing of the components also
influence the performance of the computer. It is therefore that when assessing potential
materials’ substitution, the performance of the component and the overall performance
of the computer need to be looked at by assessing how this substitution would affect
them. These considerations need to be taken into account when suggesting changes of
the design of the computer in order to reduce the use of materials and resources and the
computers’ overall environmental impact.
In order to get an overview of the components and parts used in personal computers
currently on the market, the average Bill of Materials (BoM) for three of the product
categories defined in task 1 are presented in the next sections (i.e. desktops incl.
integrated desktops, notebooks and tablets). BoMs for workstations, thin clients, all-in-
ones and small scale servers were not available, and thus this chapter focuses only on
the three abovementioned product groups. The BoMs are presented as the average of
products currently in the market, as well as for the Best Available Technology (BAT)
identified for each product category. It is important to notice that the average BoMs were
established based on information available in literature and product declarations from the
manufacturers, and thus it may not reflect the whole range of products placed on the
market. However, they are considered representative considering the information
available.
4.2.1 Desktop computers
BoM data for desktop computers (excluding integrated desktop computers) was retrieved
from six datasets, both from reviews of desktop computers available on the
market29,30,31,32 and from information available from manufacturers33,34.
An average BoM was established from these datasets, which is shown at a component
level (shown in Table 29). Data for materials is complex, since most of these components
are formed by mixtures of many different materials. Due to this complexity is not
possible to find BoM information at a material level, except for some of the key
components. The average BoM was considered to represent the average technology on
the market considering data availability limitations, and the BoM for BAT is based on the
products identified in chapter 1.4. The BoMs are presented in Table 29.
Table 29. Bill of materials (BoM) of average and BAT desktop computers on the European market.
Component Weight in average
technology (kg)
Range of weight in average technology
(kg)
Weight in BAT (kg)
Housing 4.94 0.78 – 8.70 0.78
29 Sirait et al (2012). Personal Computer Life Cycle Assessment Study: The Case of Western Australia. 10th Global Conference on Sustainable Manufacturing, Oct 31-Nov 2 2012. Istanbul, Turkey: Middle East Technical University METU. Available at: http://espace.library.curtin.edu.au/R?func=dbin-jump-full&local_base=gen01-era02&object_id=190720 30 JRC Technical Report (draft version, November 2016). Analysis of material efficiency aspects of personal computers product group. 31 Teehan, Paul; Kandlikar, Milind (2013a): Comparing Embodied Greenhouse Gas Emissions of Modern Computing and Electronics Products. In: Environmental Science & Technology, 47(9), S. 3997–4003. 32 Hischier and Wãger (2014). The Transition from Desktop Computers to Tablets: A Model for Increasing Resource Efficiency? Available at: http://publicationslist.org/data/patrick.waeger/ref-124/2014_Hischier_W%C3%A4ger_Transition_from_Desktop_Computers_AAM.pdf 33 Mac Pro Environmental Report (2013). Available at: http://images.apple.com/environment/pdf/products/desktops/MacPro_PER_oct2013.pdf 34 Mac mini Environmental Report (2014). Available at: http://images.apple.com/environment/pdf/products/desktops/Macmini_PER_oct2014.pdf

46
Component
Weight in average
technology (kg)
Range of weight in
average technology (kg)
Weight in BAT
(kg)
Printed circuit board 1.18 0.33 – 2.77 0.33
Hard disk drive or
Solid state drive* 0.33 0.11 – 0.55 0.10
Power supply unit 0.99 0.09 – 1.62 0.09
Cable 0.37 0.06 – 0.712 0.06
Fan 0.07 n.a. not present
Radiator** 0.57 n.a. not present
Total weight of
desktop computer 8.45 1.36 – 13.50 1.36
*=most of the datasets contain HDD, with the newer and smaller models moving towards SSD; **=radiators are mainly used
in high-end desktop computers for, e.g. gaming, as part of a liquid or fan-less air cooling system35; n.a.=only one dataset
available for this component thus range not available.
The range of weight of each component differs greatly for desktop computers, as the
designs include many sizes and ranges from mini-PCs36 to tower desktop computers used
for gaming. In spite of this variation, an average was established to define a
representative from the market in terms of product configuration. This market
representative of the average technology is then used to identify key components that
present a potential for recovery and that contain materials that present an economic
and/or environmental incentive for recovery. In the case of desktop computers, key
components are HDD, PCB, CPU, graphic processing unit (GPU) and RAM. In some
models, the CPU, GPU and RAM will be soldered to the PCB as it is the case of the new
Apple Mac mini37. Cables are usually recovered at sorting stations at the end of life from
conventional tower desktop computers and it is assumed they will be so as well for mini-
PCs, due to their content of copper.
35 http://www.digitaltrends.com/computing/heres-why-you-should-liquid-cool-your-cpu/ 36 A desktop computer in a small case that takes up very little desk space. There are numerous Windows mini PCs, and the Mac comes in a mini model as well. Configurable with the same CPUs and capacities as full-size desktop computers, a mini PC has no internal expansion (see http://www.pcmag.com/encyclopedia/term/64512/mini-pc). 37 http://www.macworld.co.uk/how-to/mac/how-upgrade-processor-in-your-mac-3591567/

47
While carrying out this analysis it was acknowledged that several manufacturers are
placing mini-PCs on the European market and based on information of the German public
procurement of IT solutions38, it can be assumed that the demand of these type of
desktop computers will increase in the European
market in the future. However, the accessibility of key
components in conventional tower desktop computers
at their end of life is, according to JRC30, already
largely implemented because it is relatively easy and
cheaper to perform manual dismantling (according to
JRC, key components are generally fastened with
standard screws and full disassembly takes about 2-4
minutes). On the other hand, the still low presence of
these products on the European market poses some
challenges for their dismantling at the end of life, but
it can be foreseen that it will be more challenging than
that of conventional tower desktop computers.
Furthermore, some newer tower desktop designs like
the Mac Pro present some challenges to upgradeability
for the storage modules (HDD or SSD)39, because the
SSD comes as built-in storage on the side of the
computer (see Figure 8) which comes as one internal
blade that has a limited third-party availability.
Furthermore, the Peripheral Component Interconnect
(PCI) slots require unique designs to fit additional
hardware into the computer40,41.
The material composition of HDD is based on information available from one of the most
commonly found brands of HDDs found in desktop computers placed on the European
market42, and the relative material composition is shown in Figure 8. Due to lack of data
availability, the composition herein presented of HDD is assumed to be the best available
representative of what is found on the European market today.
38 German Federal Ministry for the Environment, Nature Conservation, Construction and Reactor Safety (2016). Ecological and economic aspects when comparing workplace computers for use in public authorities, including user behavior (eco-APC). Available at: https://www.umweltbundesamt.de/sites/default/files/medien/377/publikationen/endbericht_oko-apc_2016_09_27.pdf 39 http://www.macworld.co.uk/review/mac-pro/mac-pro-review-apples-workstation-3455533/?p=2 40 http://www.everymac.com/systems/apple/mac_pro/mac-pro-cylinder-faq/how-to-upgrade-mac-pro-cylinder-ssd-storage.html 41 https://www.cnet.com/news/how-upgradable-is-the-new-mac-pro/ 42 Barracuda LP HDD Prodyct Life Cycle Analysis Summary (2011). Available at: http://www.seagate.com/files/www-content/global-citizenship/en-us/docs/final-barracuda-lca-summary-report-ams-3-24-14-10-1-2013.pdf
Figure 7:The naked Mac Pro (source
MacWorld 37)

48
Figure 8. Material composition of a HDD model for desktop computers placed on the EU market42.
Figure 8 shows that 82% of the HDD is made of highly recyclable metals (i.e. aluminium
and iron), while other valuable metals such as copper, silicium, chromium and nickel
form 16% of the HDD. The other 2% is formed by other metals such as zinc and a
mixture of plastics. Neodymium, considered a rare earth element and listed as a critical
raw material represents 0.36% of the total mass of the HDD. Considering the average
weight of the HDD is 0.33kg, this would be about 1.2g of Neodymium in the whole
storage drive.
4.2.1.1 Integrated desktop computers
The availability of BoM data for integrated desktop computers was limited to three
product models on the EU market43,44,45. Due the few data points found, the BoM is
shown for each of these products in Table 30. Furthermore, one of these products has
been identified as the BAT for integrated desktops as seen in Table 30.
43 Product Water Footprint Report of Computer (2015). ThinkCentre X1 - Machine type: 10HT, 10JW, 10KE, 10JX, 10JY, 10KF, 10K0, 10HU. Lenovo. Available at: https://www.lenovo.com/social_responsibility/us/en/product_water_footprint/ThinkCentre_X1_Water_Footprint_Declaration.pdf 44 27-inch iMac with Retina 5K Display Environmental Report (2015). Available at: http://images.apple.com/environment/pdf/products/desktops/27inch_iMacR5K_PER_Oct2015.pdf 45 21.5-inch iMac and 21.5-inch iMac with Retina 4K Display Environmental Report (2015). Available at: http://images.apple.com/environment/pdf/products/desktops/21_5inch_iMac_PER_Oct2015.pdf
62.69%
18.88%
5.59%
4.64% 2.50%
1.70%
0.81%
0.49%
0.37%
0.37%
0.33%
0.31%0.23%
0.18%
0.17%0.17%
0.13%
0.12%
0.12%
0.11%
0.09%4.00%
Material composition of a HDD model for desktop computers on the EU
market
Aluminium Iron Copper
Si Chromium Nickel
Zinc Fibrous glass wool Neodymium
Magnesium (metal) Manganese LCP polymer
POM (polyoxymethylene copolymer) DOPO halogen free flame retardant Polyester material
Acrylate urethane oligomer Proprietary Epoxy resin
Acrylic polymer Fused silica Tin

49
Table 30. Bill of materials (BoM) of identified integrated desktop computers on the European
market (including BAT).
Component Weight product 143
(kg) Weight product 244
(kg)
Weight product 3 (BAT)45
(kg)
Housing 3.66 4.05 2.56
Display unit 2.26 3.20 2.04
Printed circuit boards 0.17 0.52 0.31
Storage 0.09 0.42 0.10
CPU 0.01 not declared not declared
RAM 0.02 not declared not declared
Power supply unit 0.20 0.48 0.29
Cables 0.02 0.13 0.10
Speakers 0.07 0.48 0.26
LED backlight 0.01 not declared not declared
Fans 0.04 fanless fanless
Total weight of
integrated desktop 6.50 9.29 5.68
Some of the components declared in product 1 are not declared in products 2 and 3. CPU
and RAM are not declared for products 2 and 3 since it is assumed that they are
mounted/soldered on to the mainboard (i.e. the PCB) and are, therefore, not declared
separately. Furthermore, product 1 declares both CPU and RAM as part of the mainboard
(i.e. the PCB), which confirms this assumption. Products 2 and 3 use a fanless, passive
cooling system46,. The LED backlight is an accessory offered by the models declared in
product 147 (although it appears from internet search that only a few have it available),
which is the same case for products 2 and 3. However, the manufacturer for products 2
and 3 does not declare this accessory in their BoMs. Due to the small size of this
accessory and its relative low importance to the recovery of components and materials,
the availability of this feature in products 2 and 3 was not pursued further.
Concerning key components, it is assessed that these are the display because of the
mercury content, the PCB because of the valuable materials it contains such as copper
and gold, and the HDD because of its content of Neodymium and highly recyclable
materials. However, it is the understanding of the study team that the integrated
desktops are treated exactly the same as electronic displays at the end of life, since no
difference can be perceived by staff doing the sorting at the dismantling facilities.
Furthermore, the design does not permit easy recovery of the key components that are
unique to computers which were mentioned before. However, if ecodesign requirements
are implemented for material efficiency of electronic displays, these may aid to the
recovery of some of these components (e.g. the PCB).
46 http://www.mactech.com/content/apple-patent-thin-passive-cooling-system 47 http://shop.lenovo.com/us/en/itemdetails/10LLPAR6US/460/B13D3E47F9B14FE3B5B269DC4F6AA922
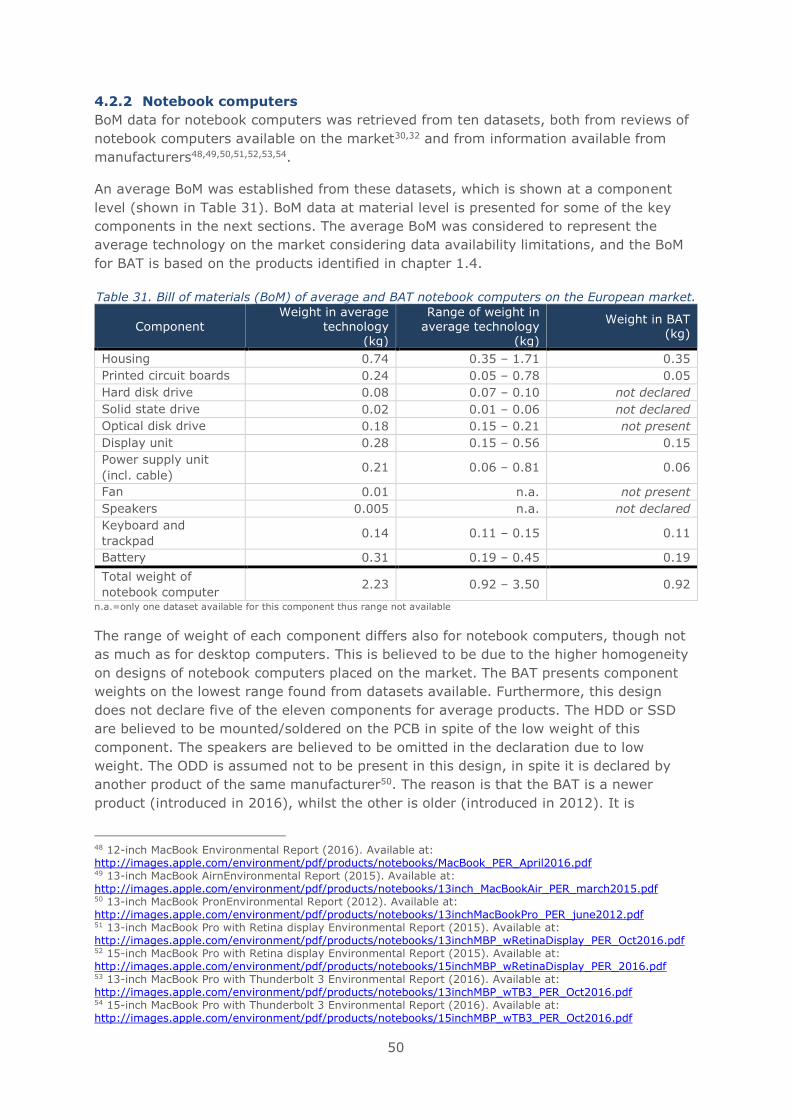
50
4.2.2 Notebook computers
BoM data for notebook computers was retrieved from ten datasets, both from reviews of
notebook computers available on the market30,32 and from information available from
manufacturers48,49,50,51,52,53,54.
An average BoM was established from these datasets, which is shown at a component
level (shown in Table 31). BoM data at material level is presented for some of the key
components in the next sections. The average BoM was considered to represent the
average technology on the market considering data availability limitations, and the BoM
for BAT is based on the products identified in chapter 1.4.
Table 31. Bill of materials (BoM) of average and BAT notebook computers on the European market.
Component Weight in average
technology (kg)
Range of weight in average technology
(kg)
Weight in BAT (kg)
Housing 0.74 0.35 – 1.71 0.35
Printed circuit boards 0.24 0.05 – 0.78 0.05
Hard disk drive 0.08 0.07 – 0.10 not declared
Solid state drive 0.02 0.01 – 0.06 not declared
Optical disk drive 0.18 0.15 – 0.21 not present
Display unit 0.28 0.15 – 0.56 0.15
Power supply unit
(incl. cable) 0.21 0.06 – 0.81 0.06
Fan 0.01 n.a. not present
Speakers 0.005 n.a. not declared
Keyboard and
trackpad 0.14 0.11 – 0.15 0.11
Battery 0.31 0.19 – 0.45 0.19
Total weight of
notebook computer 2.23 0.92 – 3.50 0.92
n.a.=only one dataset available for this component thus range not available
The range of weight of each component differs also for notebook computers, though not
as much as for desktop computers. This is believed to be due to the higher homogeneity
on designs of notebook computers placed on the market. The BAT presents component
weights on the lowest range found from datasets available. Furthermore, this design
does not declare five of the eleven components for average products. The HDD or SSD
are believed to be mounted/soldered on the PCB in spite of the low weight of this
component. The speakers are believed to be omitted in the declaration due to low
weight. The ODD is assumed not to be present in this design, in spite it is declared by
another product of the same manufacturer50. The reason is that the BAT is a newer
product (introduced in 2016), whilst the other is older (introduced in 2012). It is
48 12-inch MacBook Environmental Report (2016). Available at: http://images.apple.com/environment/pdf/products/notebooks/MacBook_PER_April2016.pdf 49 13-inch MacBook AirnEnvironmental Report (2015). Available at: http://images.apple.com/environment/pdf/products/notebooks/13inch_MacBookAir_PER_march2015.pdf 50 13-inch MacBook PronEnvironmental Report (2012). Available at: http://images.apple.com/environment/pdf/products/notebooks/13inchMacBookPro_PER_june2012.pdf 51 13-inch MacBook Pro with Retina display Environmental Report (2015). Available at: http://images.apple.com/environment/pdf/products/notebooks/13inchMBP_wRetinaDisplay_PER_Oct2016.pdf 52 15-inch MacBook Pro with Retina display Environmental Report (2015). Available at: http://images.apple.com/environment/pdf/products/notebooks/15inchMBP_wRetinaDisplay_PER_2016.pdf 53 13-inch MacBook Pro with Thunderbolt 3 Environmental Report (2016). Available at: http://images.apple.com/environment/pdf/products/notebooks/13inchMBP_wTB3_PER_Oct2016.pdf 54 15-inch MacBook Pro with Thunderbolt 3 Environmental Report (2016). Available at: http://images.apple.com/environment/pdf/products/notebooks/15inchMBP_wTB3_PER_Oct2016.pdf

51
assumed that models from 2012 still offer the CD/DVD reading capability and thus need
an ODD. However, it is expected that this component will be phased out from notebook
computers in the European market, once older models are not placed on the market any
longer.
In spite of the weight variation, an average was established to define the representative
from the market in terms of product configuration. Key components of notebook
computers for recovery are identified by JRC30 as the battery, the PCB (larger than
10cm2), the LCD panel (larger than 1dm2) and the storage units (SSD and HDD). ODD is
also mentioned but this is not considered relevant as it was explained before. It is
expected that in the future more notebook computers come with SSD instead of HDD.
Therefore, the relative composition of both storage options is presented in Table 32.
Moreover, the material compositions of an HDD model and an SSD model from a brand
found in notebooks placed on the European market are shown in Figure 9 and
Figure 10.
Table 32. Material composition of HDD and SSD according to JRC review30.
Material HDD relative composition
(%) SSD relative composition
(%)
Aluminium 45.0% 30.3%
Steel 31.2% -
41.10%
26.58%
8.71%
6.61%
2.63%
2.18%
1.22% 0.96%
0.91%
0.88%
0.86%
0.68%
0.66%
0.61%
0.58%
0.44%0.44%
0.43%
0.39%
0.37%
0.32%
0.28%
0.22%
0.22% 0.20%
0.20%0.18%
0.17%
0.17%
0.16%
0.16%
0.13%0.12%
0.11%
0.11%
5.40%
Material composition of a SSD for notebook computers on the EU market
Iron Aluminium Crystalline silica Copper (metallic)
Silicon Chromium Fibrous-glass-wool Fused silica
Proprietary Neodymium LCP polymer Acrylic polymer
Nickel "DOPO" halogen free flame retardant Diiron-trioxide Magnesium oxide
POM (plastic) Polyester material Carbon Manganese
Acrylate urethane oligomer Polyurethane Tin Glass fibre
Aluminium oxide Barium titanate (IV) Poly (bisphenol A carbonate) Benzenedicarboxylic acid polymer
Epoxy resin Silver Phthalocyanine Homopolymer
Polyester resin Polyacrylate Hexafluoropropene polymer

52
Material HDD relative composition
(%)
SSD relative composition
(%)
Iron 8.7% 15.0%
Copper 0.4% 4.8%
Magnet 3.9% -
Polychlorinated biphenyl 3.9% -
Polycarbonate/ABS 3.9% -
Polycarbonate/Glass fibre 3.0% -
Fused silica - 9.0%
Epoxy resin - 6.1%
Aluminium oxide - 4.8%
Magnesium silicate talc - 3.2%
Silicon - 3.1%
Tantalum - 2.7%
LCP polymer - 1.9%
Dioxygen - 1.8%
Tin - 1.8%
Vinyl silicone oil - 1.7%
Fibrous-glass-wool - 1.4%
C.I. pigment black 28 - 1.3%
Carbon - 1.2%
Other materials - 9.9%

53
Figure 9. Material composition of a HDD model for notebook computers placed on the EU market55.
55 Momentus HDD Product Life Cycle Analysis Summary (2011). Available at: http://www.seagate.com/files/www-content/global-citizenship/en-us/docs/momentus-lca-summary-report-9-26-2013.pdf
30.70%
28.31%
11.40%
4.49% 3.46%
3.07%2.70%
1.94%
1.48% 1.33%
1.28%1.17%
0.86%0.80%
0.64%
0.42%
0.39%0.34%0.33%
0.30%
0.28%
0.27%
0.26%
0.26%
0.25%
0.21%
0.20%
0.19%
0.17%
0.16%
0.15%
0.14%
0.14%
0.13%
0.10%
4.67%
Material composition of a HDD for notebook computers on the EU market
Iron Aluminium Copper (metallic)
Fibrous-glass-wool Crystalline silica Nickel
Silicon "DOPO" halogen free flame retardant Chromium
Silica LCP polymer Phenol, polymer with formaldehyde, glycidyl ether
Fused silica Proprietary Neodymium
Polyester material POM (plastic) Manganese
Silver Phosphorus Aluminium oxide
Barium titanate (IV) Acrylate urethane oligomer Polyacrylate
Benzenedicarboxylic acid polymer Araldite GY 250 Tin
Acrylic polymer Poly (bisphenol A carbonate) Barite
Zinc Glass fibre Carbon
Epoxy resin Diiron-trioxide

54
Figure 10. Material composition of a SSD model for notebook computers placed on the EU market56.
56 Momentus XT SSHD Product Life Cycle Analysis Summary (2011). Available at: http://www.seagate.com/files/www-content/global-citizenship/en-us/docs/final-momentus-xt-lca-summary-report-ams-3-12-14-10-1-2013.pdf
41.10%
26.58%
8.71%
6.61%
2.63%
2.18%
1.22% 0.96%
0.91%
0.88%
0.86%
0.68%
0.66%
0.61%
0.58%
0.44%0.44%
0.43%
0.39%
0.37%
0.32%
0.28%
0.22%
0.22% 0.20%
0.20%0.18%
0.17%
0.17%
0.16%
0.16%
0.13%0.12%
0.11%
0.11%
5.40%
Material composition of a SSD for notebook computers on the EU market
Iron Aluminium Crystalline silica Copper (metallic)
Silicon Chromium Fibrous-glass-wool Fused silica
Proprietary Neodymium LCP polymer Acrylic polymer
Nickel "DOPO" halogen free flame retardant Diiron-trioxide Magnesium oxide
POM (plastic) Polyester material Carbon Manganese
Acrylate urethane oligomer Polyurethane Tin Glass fibre
Aluminium oxide Barium titanate (IV) Poly (bisphenol A carbonate) Benzenedicarboxylic acid polymer
Epoxy resin Silver Phthalocyanine Homopolymer
Polyester resin Polyacrylate Hexafluoropropene polymer

55
Concerning the material composition of HDD, Table 32 and Figure 9 agree on the amount
of highly recyclable metals in the component (i.e. aluminium, iron and/or steel). It is
assumed that iron substitutes steel and vice versa and that is why the composition of
these metals differs in both datasets. However, three of the major differences are:
The high difference in copper content, which is one of the metals that are looked
at when recovering electronics at the end of life. This may be because the
manufacturer’s model is older than the dataset from the JRC review. It is known
that one of the trends in electronics is to use less copper.
The higher presence of plastics in the dataset from the JRC review, which may be
due to the same reason as for the lower content of copper.
The presence of Neodymium in the HDD from the manufacturer. This may be
because the content is small and thus it is not declared by the studies reviewed by
JRC.
Concerning the material composition of SSD, Table 32 and Figure 10 agree again on the
high content of aluminium and iron (although it is much higher in the manufacturer’s
declared dataset). Furthermore, there is more alignment on the content of copper in both
datasets as well as on the content of the other metals, polymers and elements. However,
the same difference on the presence of Neodymium is observed as it is only declared by
the manufacturer.
4.2.2.1 External power supply (EPS) units
As explained in previous tasks, there is an interest to know the amount of materials and
resources saved by avoiding the use of product/model specific external power supply
units and using universal types which can be used with several notebooks and/or
computer products. Because of this interest, the material composition of the average EPS
of the market for notebook computers was investigated by JRC30. An average
composition is presented in Figure 11, which was updated to include a more recent
analysis from 2014.
13%
18%
7%
16%
45%
Material composition of average EPS for notebook computers
on the EU marketBulk plastics
Technical plastics
Polyvinyl chloride (PVC)
High-impact polystyrene
(HIPS)
Iron
Steel
Non-ferro metals
Copper
Electronics
Cables
Plugs

56
Figure 11. Average material composition of EPS for notebook computers with output powers from
60W to 90W57.
Figure 11 shows that most of the materials in the average EPS are plastics, non-ferro
metals, copper and electronics. This is expected since the metals are used for the
conduction of electricity, the plastics for the construction and insulation and the
electronics for the power adapter. This material composition includes both the power
adapter and the cable.
4.2.3 Tablet/slate computers
BoM data for tablet/slate computers was retrieved from seven datasets, from a review of
twenty tablets/slates available on the market30, from a review of tablets used on the
market during the year 201432 or from information available from
manufacturers58,59,60,61,62.
An average BoM was established from these datasets, which is shown at a component
level (shown in Table 33). BoM data at material level is presented for some of the key
components in the next sections. The average BoM was considered to represent the
average technology on the market considering data availability limitations, and the BoM
for BAT is based on the products identified in chapter 1.4.
Table 33. Bill of materials (BoM) of average and BAT tablet/slate computers on the European market.
Component Weight in average
technology (kg)
Range of weight in average technology
(kg)
Weight in BAT (kg)
Housing 0.14 0.05 – 0.27 0.08
Printed circuit board 0.04 0.02 – 0.06 0.04
Display unit 0.17 0.1 – 0.3 0.17
Power supply unit
(incl. cable) 0.05 0.02 – 0.06 0.03
Speakers 0.003 n.a. not declared
Battery 0.13 0.09 – 0.17 0.13
Total weight of
tablet/slate computer 0.53 0.30 – 0.72 0.45
n.a.=only one dataset available for this component thus range not available
The range of weight of each component is less than that for notebook and desktop
computers as the design of these products across the European market are even more
homogeneous. In the case of tablet/slate computers, the BAT does not represent the
lowest range of components weight as for notebook computers. The only component not
declared for BAT but declared for the average products in the market are the speakers,
and it is assumed that they are not present in the declaration due to their very low
weight and thus very little contribution to the material use. Storage units, RAM module
and CPU are not declared in any BoM for tablets/slates indicating that all the products
57 Based on five review studies from 2003 to 2014. 58 12.9-inch iPad Pro Environmental Report (2015). Available at: http://images.apple.com/environment/pdf/products/ipad/12.9-inch_iPad_Pro_PER_nov2015.pdf 59 9.7-inch iPad Pro Environmental Report (2016). Available at: http://images.apple.com/environment/pdf/products/ipad/9.7-inch_iPadPro_PER_mar2016.pdf 60 iPad Air 2 Environmental Report (2014). Available at: http://images.apple.com/environment/pdf/products/ipad/iPadAir2_PER_oct2014.pdf 61 iPad Air 2 Environmental Report (2014). Available at: http://images.apple.com/environment/pdf/products/ipad/iPadAir2_PER_oct2014.pdf 62 iPad mini 2 Environmental Report (2013). Available at: http://images.apple.com/environment/pdf/products/ipad/iPadmini2_PER_sept2015.pdf

57
assessed in the datasets have these components mounted/soldered on to the PCB.
Generally, it is noticed that there is no major difference in most components between the
average product and the BAT, which implies that the technologies in the EU market for
this product category are generally very similar in terms of material use.
In spite of the weight variation, an average was established to define the representative
from the market in terms of product configuration. Key components of tablet computers
for recovery identified by JRC30 are the same as for the notebooks. However, in the case
of tablets/slates the recovery of anything else than the battery and the LCD panel may
be impossible, if there is no manual dismantling prior shredding as described in the task
3.