tariffs in world seafood trade · tariffs in world seafood trade. fao fisheries ... for the...
TRANSCRIPT
FAO Fisheries Circular No. 1016 FIIU/C1016 (En) ISSN 0429-9329
TARIFFS IN WORLD SEAFOOD TRADE

Copies of FAO publications can be requested from: Sales and Marketing Group
Information Division FAO
Viale delle Terme di Caracalla 00100 Rome, Italy
E-mail: [email protected] Fax: (+39) 06 57053360
FAO Fisheries Circular No. 1016 FIIU/C1016 (En)
TARIFFS IN WORLD SEAFOOD TRADE
by Arne Melchior Senior Researcher Norwegian Institute of International Affairs Oslo, Norway
FOOD AND AGRICULTURE ORGANIZATION OF THE UNITED NATIONS Rome, 2006
The designations employed and the presentation of material in this information product do not imply the expression of any opinion whatsoever on the part of the Food and Agriculture Organization of the United Nations concerning the legal or development status of any country, territory, city or area or of its authorities, or concerning the delimitation of its frontiers or boundaries.
All rights reserved. Reproduction and dissemination of material in this information product for educational or other non-commercial purposes are authorized without any prior written permission from the copyright holders provided the source is fully acknowledged. Reproduction of material in this information product for resale or other commercial purposes is prohibited without written permission of the copyright holders. Applications for such permission should be addressed to the Chief, Publishing Management Service, Information Division, FAO, Viale delle Terme di Caracalla, 00100 Rome, Italy or by e-mail to [email protected]
© FAO 2006

iii
PREPARATION OF THIS DOCUMENT
This Fisheries Circular was commissioned by FAO as a background document for use in its capacity-building activities on fisheries issues in multilateral trade negotiations.
iv
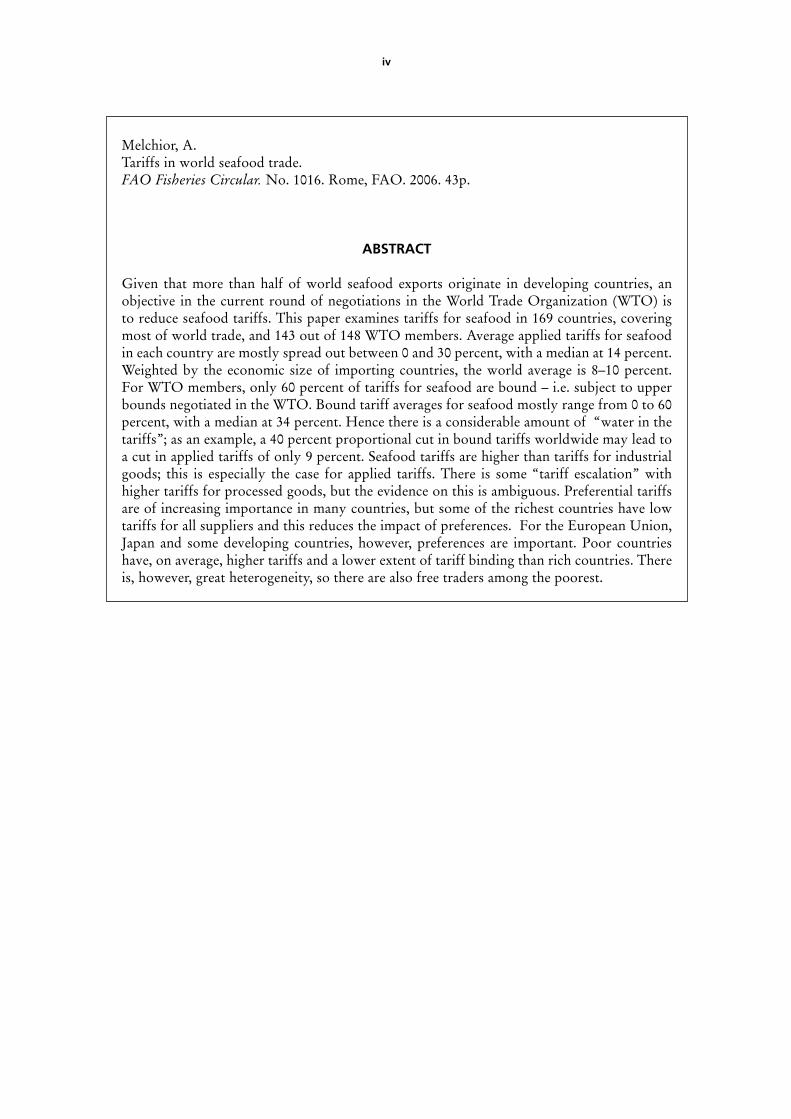
Melchior, A. Tariffs in world seafood trade.FAO Fisheries Circular. No. 1016. Rome, FAO. 2006. 43p.
ABSTRACT
Given that more than half of world seafood exports originate in developing countries, an objective in the current round of negotiations in the World Trade Organization (WTO) is to reduce seafood tariffs. This paper examines tariffs for seafood in 169 countries, covering most of world trade, and 143 out of 148 WTO members. Average applied tariffs for seafood in each country are mostly spread out between 0 and 30 percent, with a median at 14 percent. Weighted by the economic size of importing countries, the world average is 8–10 percent. For WTO members, only 60 percent of tariffs for seafood are bound – i.e. subject to upper bounds negotiated in the WTO. Bound tariff averages for seafood mostly range from 0 to 60 percent, with a median at 34 percent. Hence there is a considerable amount of “water in the tariffs”; as an example, a 40 percent proportional cut in bound tariffs worldwide may lead to a cut in applied tariffs of only 9 percent. Seafood tariffs are higher than tariffs for industrial goods; this is especially the case for applied tariffs. There is some “tariff escalation” with higher tariffs for processed goods, but the evidence on this is ambiguous. Preferential tariffs are of increasing importance in many countries, but some of the richest countries have low tariffs for all suppliers and this reduces the impact of preferences. For the European Union, Japan and some developing countries, however, preferences are important. Poor countries have, on average, higher tariffs and a lower extent of tariff binding than rich countries. There is, however, great heterogeneity, so there are also free traders among the poorest.
v
CONTENTS
Preparation of this document iii
Abstract iv
Acknowledgements vi
Acronyms vii
1. Introduction: tariffs and the WTO negotiation round 1
2. Data and methodology 2
3. The extent of tariff binding 6
4. Tariff levels for seafood: bound vs. MFN applied tariffs 7
5. Are seafood tariffs higher than tariffs for other goods? 9
6. “Water in the tariffs” 10
7. Tariff preferences: the global picture 13
8. Tariff preferences: selected countries 15
9. Tariff escalation? 18
10. Final remarks 20
References 20
Appendix
TABLE A1 Classification of seafood products for the analysis of tariff barriers in world seafood trade 22
TABLE A2A Tariff data, country averages for seafood 23
TABLE A2B Tariff data, country averages for seafood: countries that became EU members in May 2004 37
TABLE A3A Water in the tariffs: simulation of tariff cuts for seafood, changes in bound rates 38
TABLE A3B Water in the tariffs: simulation of tariff cuts for seafood, changes in MFN applied rates 41
vi
ACKNOWLEDGEMENTS
I thank Audun Lem and William Emerson, FAO for useful comments to an earlier draft. I am also grateful to the World Integrated Trade Solution staff at the United Nations Conference on Trade and Development and the World Bank, especially Hiroaki Kuwahara, for assistance on some technical issues related to data retrieval. The responsibility for remaining errors nevertheless rests on the author.
vii
ACRONYMS
ACP African, Caribbean and Pacific Group of States
CIA Central Intelligence Agency
COMTRADE United Nations commodity trade statistics database
EFTA European Free Trade Association
EU European Union
FTA Free Trade Agreement
GATT General Agreement on Tariffs and Trade
GDP Gross domestic product
GNI Gross national income
GSP Generalized system of preferences
IDB Integrated database (WTO)
LDCs Least developed countries
MFN Most favoured nation
NAMA Non-agricultural market access
OCT Overseas countries and territories
PPP Purchasing power parity
TRAINS Trade analysis and information system database (UNCTAD)
TRQs Tariff rate quotas
UNCTAD United Nations Conference on Trade and Development
WITS World Integrated Trade Solution
WTO World Trade Organization

1
1. INTRODUCTION: TARIFFS AND THE WTO NEGOTIATION ROUND
In the current round of trade negotiations in the World Trade Organization (WTO), the “Doha Development Agenda”, tariff reductions for seafood are on the agenda. The Doha Round accounts for seafood trade in different ways; tariffs are probably the most important topic but subsidies and anti-dumping regulations are also of considerable interest.
In the WTO negotiations, seafood tariffs are negotiated along with manufacturing tariffs and non-tariff barriers in the so-called NAMA (Non-Agricultural Market Access) negotiating group. The WTO secretariat has provided useful overviews on tariffs for manufacturing and seafood taken together (see WTO, 2002a,b), but not for individual sectors. The purpose of this paper is to fill this gap, by providing a comprehensive overview of seafood tariffs. For illustrative purposes, we also present some calculations concerning tariff reductions.
In the WTO negotiations, the core approach to tariff reduction is a formula that is to be negotiated and thereafter applied to individual tariff lines (or tariff averages, in some proposals). In addition, it has been suggested that tariffs should be eliminated completely for sectors of particular interest to developing countries. In 2003, seven particular sectors were suggested for such treatment. The proposal presented (see WTO, 2003a) was as follows:
“In addition to the application of the formula, a sector elimination approach is proposed in order to eliminate and bind all tariffs on products of particular export interest to developing and least-developed country participants. Therefore, the following sectors are proposed: Electronics & Electrical goods; Fish & Fish products; Footwear; Leather goods; Motor Vehicle parts & components; Stones, Gems, & Precious Metals; and Textiles & Clothing.”
Hence seafood is included among the seven sectors of particular interest to developing countries. As shown by Vannuccini (2003), developing countries now represent more than half of world exports of seafood, and the sector is important in the exports of developing countries (see also Roheim, 2005). According to Melchior (2004), the seafood sector deserves its position among the priority sectors for developing countries. Not only is the developing country share of world exports relatively high for seafood; seafood exports are also dispersed among many developing nations. Among the seven sectors suggested above, seafood is also the one where the least developed countries (LDCs) share is highest (ibid.).
To date there has not been a decision in the WTO negotiations regarding whether sectorial tariff elimination will be undertaken, or whether seafood will be among the chosen sectors. It seems likely that the tariff-cutting formula will be the most important element of tariff liberalization.
Ideally, we need an analysis of how tariff reforms will affect production and trade worldwide. This big task is, however, beyond the scope of this paper. The purpose here is to undertake a comprehensive mapping and assessment of the pattern and level of tariffs. We will ask questions such as:
• What are tariffs levels in different countries and overall, and do rich and poor countries have different tariff levels?
• To what extent are bound tariffs higher than the applied ones, and what is the role of preferential tariffs?
• Are tariffs for seafood higher than tariffs in other sectors?• Is there tariff escalation so that tariffs are higher for more processed goods?
We will examine these issues using a comprehensive data set covering virtually all of world trade.
Earlier work addressing seafood tariffs include Finger, Ingco and Reincke (1996), who presented calculations for 40 countries after the Uruguay Round (UR). The authors found a trade-weighted
2
average of bound tariffs after the UR at 5.2 percent for fish and fish products, and a corresponding figure at 4.4 percent for most favoured nation (MFN) applied tariffs. According to FAO (2003), “average weighted import tariffs on fish products in developed countries were reduced to around 4.5 percent” after the UR. These figures are strongly affected by the large share of world imports accounted for by the European Union (EU), Japan and the United States of America, and they hide that the majority of countries in the world in fact have much higher seafood tariffs. As we shall see, the figures are also affected by the country coverage. Adding more countries tends to increase the average, since the rich low-tariff countries were among the first to submit their data.
2. DATA AND METHODOLOGY
Table A1 in the Appendix presents the study’s product coverage. Most of the analysis is undertaken for seafood as a whole, but in section 9 we also present some evidence for various subcategories (definition shown in Appendix). According to Table A1, world seafood trade in 2003 was at US$75 800 million, with 52 percent being exported from low and middle income countries.
This analysis would not have been possible without the great improvements in the accessibility to tariff and trade data. For the purpose of the analysis, we use five different databases:
• Commodity trade statistics database of the United Nations (COMTRADE) is used to obtain trade data.
• The trade analysis and information system database (TRAINS) of the United Nations Conference on Trade and Development (UNCTAD) is used for retrieving tariff data, and also some import data.
• The integrated database (IDB) of WTO is used to get tariff data.• The Fishstat+ database of FAO is used to obtain supplementary information on fish
production and trade. • The World Development Indicators of the World Bank is the main source of supplementary
country data, e.g. on income levels.
The first three of these databases are accessible using the software WITS (World Integrated Trade Solution), developed jointly by the World Bank and the United Nations Conference on Trade and Development (UNCTAD).1 TRAINS as well as IDB contain data on:
• bound tariffs, i.e. upper bounds for tariffs that are negotiated in the WTO and fixed in country tariff schedules, and
• MFN applied tariffs, i.e. the tariffs applied to countries without any form of trade preferences.
As we shall see, bound tariffs are on average considerably higher than the applied ones for seafood.2
In addition to bound and MFN applied tariffs, TRAINS also contains some data on preferential tariffs; e.g. tariffs under the generalized system of preferences (GSP) or in free trade agreements.
1 The World Integrated Trade Solution (WITS) simplifies data retrieval to a considerable extent, since data for pre-defined aggregates may be requested (instead of obtaining more detailed data and undertaking all the calculations oneself). In order to avoid mistakes, it is however necessary to check thoroughly the data underlying WITS output. For example, we obtained some tariff averages from WITS that were based on traded items only, i.e. with very limited data coverage for some countries that might give very misleading results. In order to control this, we have also used detailed data and checked the underlying data coverage behind all figures.
2 Countries are free to change their MFN applied tariffs as long as they are below the bound rates; hence MFN applied tariffs may vary across years. In most cases, such variations imply that countries reduce their applied tariffs, but in some cases, the opposite may be true.
3
Data coverage for preferential tariffs is less comprehensive, but we shall nevertheless present some evidence. We shall use the term “actually applied” for these tariffs.
All the tariff calculations undertaken here are based on ad valorem tariff rates; i.e. tariffs expressed as a percentage of the value of goods.3 We generally report the number of observations for the tariff averages calculated, and we do not present results that are based on a very limited number of observations.
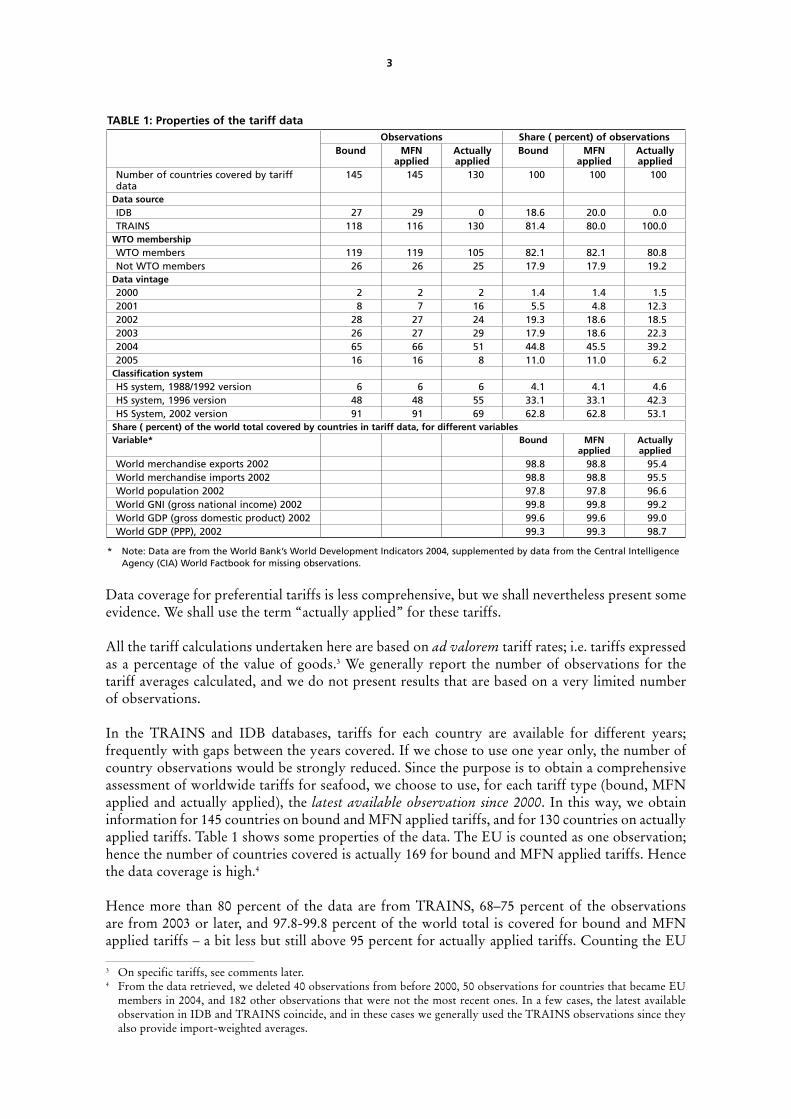
In the TRAINS and IDB databases, tariffs for each country are available for different years; frequently with gaps between the years covered. If we chose to use one year only, the number of country observations would be strongly reduced. Since the purpose is to obtain a comprehensive assessment of worldwide tariffs for seafood, we choose to use, for each tariff type (bound, MFN applied and actually applied), the latest available observation since 2000. In this way, we obtain information for 145 countries on bound and MFN applied tariffs, and for 130 countries on actually applied tariffs. Table 1 shows some properties of the data. The EU is counted as one observation; hence the number of countries covered is actually 169 for bound and MFN applied tariffs. Hence the data coverage is high.4
Hence more than 80 percent of the data are from TRAINS, 68–75 percent of the observations are from 2003 or later, and 97.8-99.8 percent of the world total is covered for bound and MFN applied tariffs – a bit less but still above 95 percent for actually applied tariffs. Counting the EU
TABLE 1: Properties of the tariff data Observations Share ( percent) of observations
Bound MFN applied
Actually applied
Bound MFN applied
Actually applied
Number of countries covered by tariff data
145 145 130 100 100 100
Data source IDB 27 29 0 18.6 20.0 0.0TRAINS 118 116 130 81.4 80.0 100.0
WTO membership WTO members 119 119 105 82.1 82.1 80.8Not WTO members 26 26 25 17.9 17.9 19.2
Data vintage 2000 2 2 2 1.4 1.4 1.52001 8 7 16 5.5 4.8 12.32002 28 27 24 19.3 18.6 18.52003 26 27 29 17.9 18.6 22.32004 65 66 51 44.8 45.5 39.22005 16 16 8 11.0 11.0 6.2
Classification systemHS system, 1988/1992 version 6 6 6 4.1 4.1 4.6HS system, 1996 version 48 48 55 33.1 33.1 42.3HS System, 2002 version 91 91 69 62.8 62.8 53.1
Share ( percent) of the world total covered by countries in tariff data, for different variablesVariable* Bound MFN
appliedActually applied
World merchandise exports 2002 98.8 98.8 95.4World merchandise imports 2002 98.8 98.8 95.5World population 2002 97.8 97.8 96.6World GNI (gross national income) 2002 99.8 99.8 99.2World GDP (gross domestic product) 2002 99.6 99.6 99.0World GDP (PPP), 2002 99.3 99.3 98.7
* Note: Data are from the World Bank’s World Development Indicators 2004, supplemented by data from the Central Intelligence Agency (CIA) World Factbook for missing observations.
3 On specific tariffs, see comments later.4 From the data retrieved, we deleted 40 observations from before 2000, 50 observations for countries that became EU
members in 2004, and 182 other observations that were not the most recent ones. In a few cases, the latest available observation in IDB and TRAINS coincide, and in these cases we generally used the TRAINS observations since they also provide import-weighted averages.
4
as 25 instead of one, the total number of countries covered increases to 169, and we see that 143 WTO members (at the time of writing) are covered for bound and MFN applied tariffs; i.e. only five WTO members are missing.
The table also shows that most of the data are using the 1996 or 2002 versions of the Harmonized System. HS is an international standard of classification down to the 6-digit level of classification. At this level, seafood – as defined in Table A1 in the Appendix – includes 106 categories in HS 1988/92 and HS1996, and 113 in HS2002.
The classification of goods is only harmonized internationally to the level of detail corresponding to 6 digits. Many countries have more detailed national classifications; frequently at the 8-digit level. An issue is whether simple tariff averages are affected by classification. If, for example, a 6-digit category with high protection is subdivided into numerous tariff lines, it will affect the simple tariff average upward. As an illustration, consider simple averages for the EU at different levels of aggregation, for EU’s MFN applied tariffs in 2005. This is shown in Table 2.
Hence the tariff average drops by almost two percentage points as we approach the 6-digit level. EU is however an extreme case; other countries generally have fewer tariff lines.
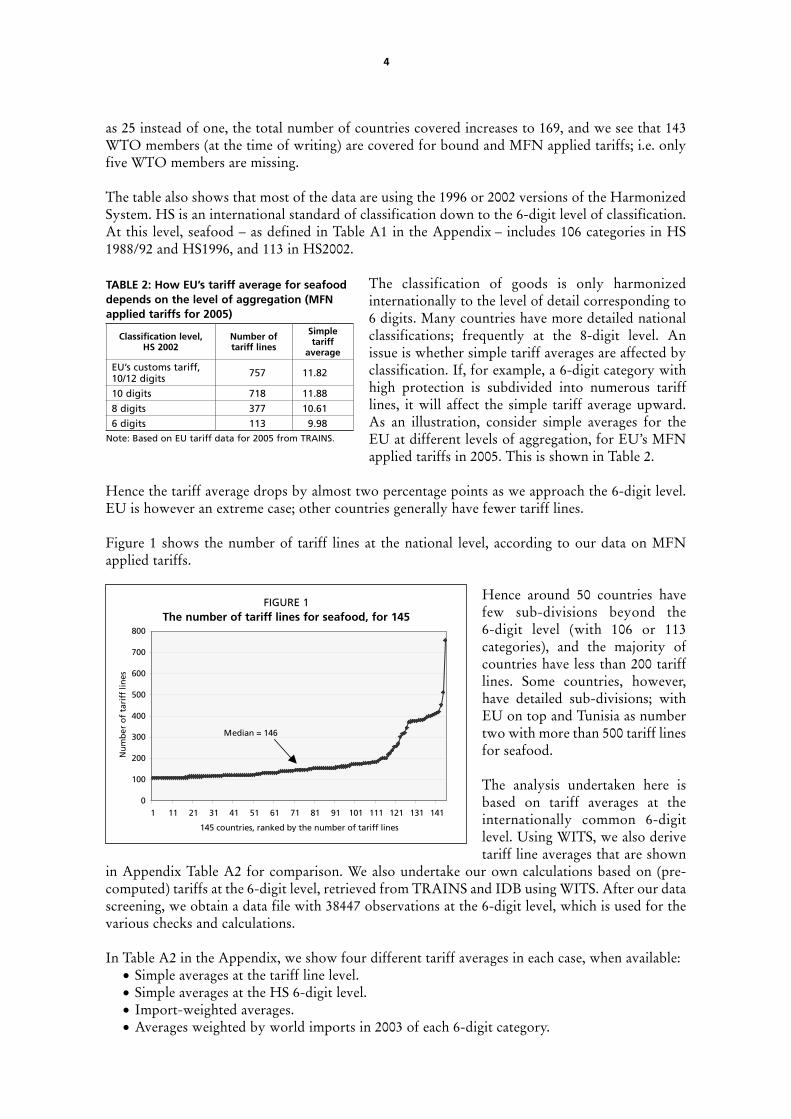
Figure 1 shows the number of tariff lines at the national level, according to our data on MFN applied tariffs.
Hence around 50 countries have few sub-divisions beyond the 6-digit level (with 106 or 113 categories), and the majority of countries have less than 200 tariff lines. Some countries, however, have detailed sub-divisions; with EU on top and Tunisia as number two with more than 500 tariff lines for seafood.
The analysis undertaken here is based on tariff averages at the internationally common 6-digit level. Using WITS, we also derive tariff line averages that are shown
in Appendix Table A2 for comparison. We also undertake our own calculations based on (pre-computed) tariffs at the 6-digit level, retrieved from TRAINS and IDB using WITS. After our data screening, we obtain a data file with 38447 observations at the 6-digit level, which is used for the various checks and calculations.
In Table A2 in the Appendix, we show four different tariff averages in each case, when available:• Simple averages at the tariff line level.• Simple averages at the HS 6-digit level.• Import-weighted averages.• Averages weighted by world imports in 2003 of each 6-digit category.
TABLE 2: How EU’s tariff average for seafood depends on the level of aggregation (MFN applied tariffs for 2005)
Classification level, HS 2002
Number of tariff lines
Simple tariff
average
EU’s customs tariff, 10/12 digits 757 11.82
10 digits 718 11.88
8 digits 377 10.61
6 digits 113 9.98Note: Based on EU tariff data for 2005 from TRAINS.
FIGURE 1The number of tariff lines for seafood, for 145
0
100
200
300
400
500
600
700
800
1 11 21 31 41 51 61 71 81 91 101 111 121 131 141
145 countries, ranked by the number of tariff lines
Nu
mb
er o
f ta
riff
lin
es
Median = 146
5
It is well known from the literature that import-weighted averages may be biased because imports, and thereby the weights, are affected by the tariffs. Say, for example, that tariffs are zero for some items, and 1 000 percent for the rest. If there are no imports of the latter, the trade-weighted average will be zero – which is clearly misleading. In order to avoid this, but still take into account the economic magnitude of categories, we also present averages for each country that are weighted by world imports, or equivalently world exports, of the categories in question.
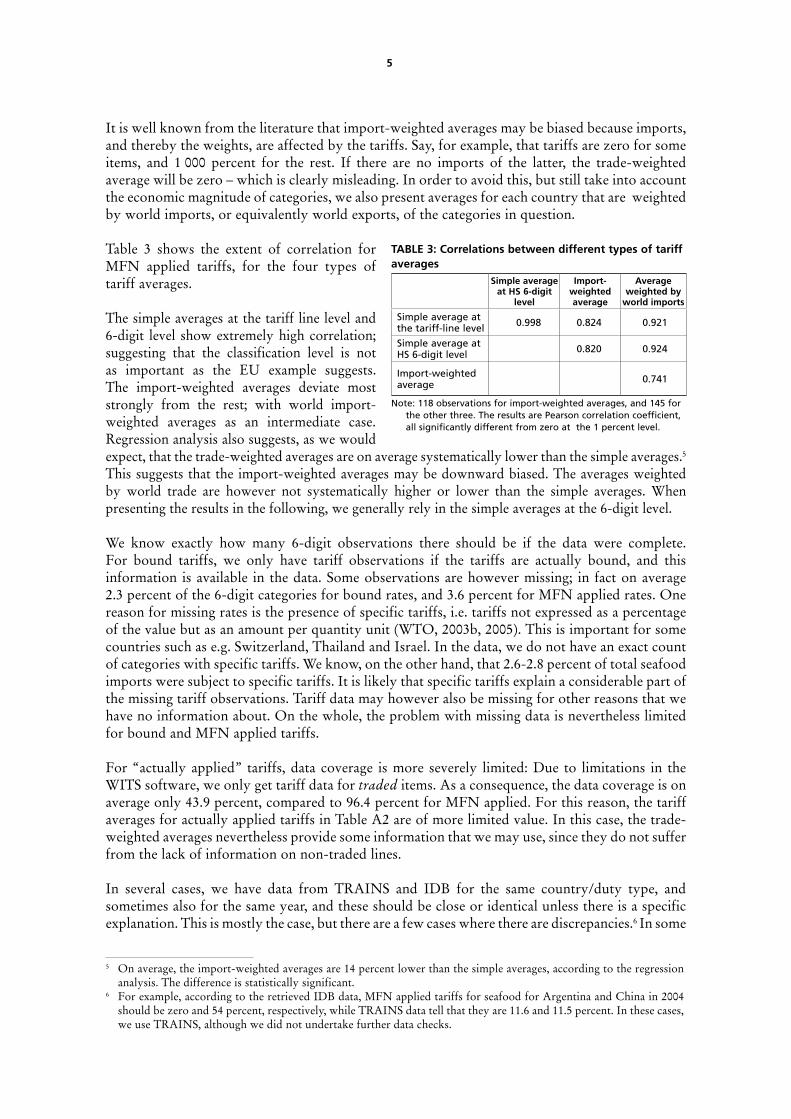
Table 3 shows the extent of correlation for MFN applied tariffs, for the four types of tariff averages.
The simple averages at the tariff line level and 6-digit level show extremely high correlation; suggesting that the classification level is not as important as the EU example suggests. The import-weighted averages deviate most strongly from the rest; with world import-weighted averages as an intermediate case. Regression analysis also suggests, as we would expect, that the trade-weighted averages are on average systematically lower than the simple averages.5 This suggests that the import-weighted averages may be downward biased. The averages weighted by world trade are however not systematically higher or lower than the simple averages. When presenting the results in the following, we generally rely in the simple averages at the 6-digit level.
We know exactly how many 6-digit observations there should be if the data were complete. For bound tariffs, we only have tariff observations if the tariffs are actually bound, and this information is available in the data. Some observations are however missing; in fact on average 2.3 percent of the 6-digit categories for bound rates, and 3.6 percent for MFN applied rates. One reason for missing rates is the presence of specific tariffs, i.e. tariffs not expressed as a percentage of the value but as an amount per quantity unit (WTO, 2003b, 2005). This is important for some countries such as e.g. Switzerland, Thailand and Israel. In the data, we do not have an exact count of categories with specific tariffs. We know, on the other hand, that 2.6-2.8 percent of total seafood imports were subject to specific tariffs. It is likely that specific tariffs explain a considerable part of the missing tariff observations. Tariff data may however also be missing for other reasons that we have no information about. On the whole, the problem with missing data is nevertheless limited for bound and MFN applied tariffs.
For “actually applied” tariffs, data coverage is more severely limited: Due to limitations in the WITS software, we only get tariff data for traded items. As a consequence, the data coverage is on average only 43.9 percent, compared to 96.4 percent for MFN applied. For this reason, the tariff averages for actually applied tariffs in Table A2 are of more limited value. In this case, the trade-weighted averages nevertheless provide some information that we may use, since they do not suffer from the lack of information on non-traded lines.
In several cases, we have data from TRAINS and IDB for the same country/duty type, and sometimes also for the same year, and these should be close or identical unless there is a specific explanation. This is mostly the case, but there are a few cases where there are discrepancies.6 In some
5 On average, the import-weighted averages are 14 percent lower than the simple averages, according to the regression analysis. The difference is statistically significant.
6 For example, according to the retrieved IDB data, MFN applied tariffs for seafood for Argentina and China in 2004 should be zero and 54 percent, respectively, while TRAINS data tell that they are 11.6 and 11.5 percent. In these cases, we use TRAINS, although we did not undertake further data checks.
TABLE 3: Correlations between different types of tariff averages
Simple average at HS 6-digit
level
Import- weighted average
Average weighted by
world imports
Simple average at the tariff-line level 0.998 0.824 0.921
Simple average at HS 6-digit level 0.820 0.924
Import-weighted average 0.741
Note: 118 observations for import-weighted averages, and 145 for the other three. The results are Pearson correlation coefficient, all significantly different from zero at the 1 percent level.
6
cases, there are plausible explanations. For example, the MFN applied tariffs of Albania in 2001 are higher than the bound tariffs; this is because the reported bound tariffs were to be implemented over time. In other cases, we do not have obvious explanations about data inconsistencies, and there is still more to do with respect to data verification. In the whole, however, we consider the data to be of good quality.
3. THE EXTENT OF TARIFF BINDING
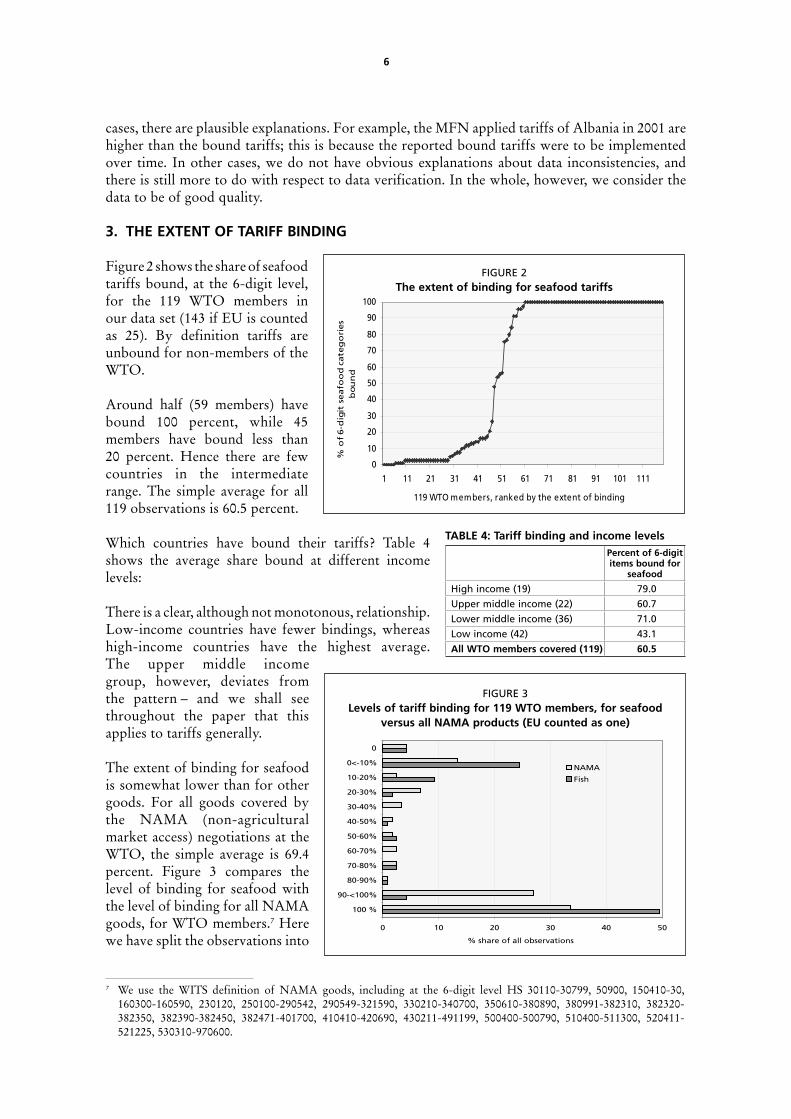
Figure 2 shows the share of seafood tariffs bound, at the 6-digit level, for the 119 WTO members in our data set (143 if EU is counted as 25). By definition tariffs are unbound for non-members of the WTO.
Around half (59 members) have bound 100 percent, while 45 members have bound less than 20 percent. Hence there are few countries in the intermediate range. The simple average for all 119 observations is 60.5 percent.
Which countries have bound their tariffs? Table 4 shows the average share bound at different income levels:
There is a clear, although not monotonous, relationship. Low-income countries have fewer bindings, whereas high-income countries have the highest average. The upper middle income group, however, deviates from the pattern – and we shall see throughout the paper that this applies to tariffs generally.
The extent of binding for seafood is somewhat lower than for other goods. For all goods covered by the NAMA (non-agricultural market access) negotiations at the WTO, the simple average is 69.4 percent. Figure 3 compares the level of binding for seafood with the level of binding for all NAMA goods, for WTO members.7 Here we have split the observations into
FIGURE 2The extent of binding for seafood tariffs
0
10
20
30
40
50
60
70
80
90
100
1 11 21 31 41 51 61 71 81 91 101 111
119 WTO members, ranked by the extent of binding
% o
f 6-d
igit
seafo
od c
ate
go
ries
bou
nd
TABLE 4: Tariff binding and income levelsPercent of 6-digit items bound for
seafood
High income (19) 79.0
Upper middle income (22) 60.7
Lower middle income (36) 71.0
Low income (42) 43.1
All WTO members covered (119) 60.5
FIGURE 3Levels of tariff binding for 119 WTO members, for seafood
versus all NAMA products (EU counted as one)
0 10 20 30 40 50
100 %
90-<100%
80-90%
70-80%
60-70%
50-60%
40-50%
30-40%
20-30%
10-20%
0<-10%
0
% share of all observations
NAMA
Fish
7 We use the WITS definition of NAMA goods, including at the 6-digit level HS 30110-30799, 50900, 150410-30, 160300-160590, 230120, 250100-290542, 290549-321590, 330210-340700, 350610-380890, 380991-382310, 382320-382350, 382390-382450, 382471-401700, 410410-420690, 430211-491199, 500400-500790, 510400-511300, 520411-521225, 530310-970600.
7
deciles, plus zero and 100 as separate categories, and we calculate the share of countries in each decile.
Although more countries have 100 percent binding for fish than for all NAMA trade, the share below 10 percent is clearly larger for seafood.
4. TARIFF LEVELS FOR SEAFOOD: BOUND VS. MFN APPLIED TARIFFS
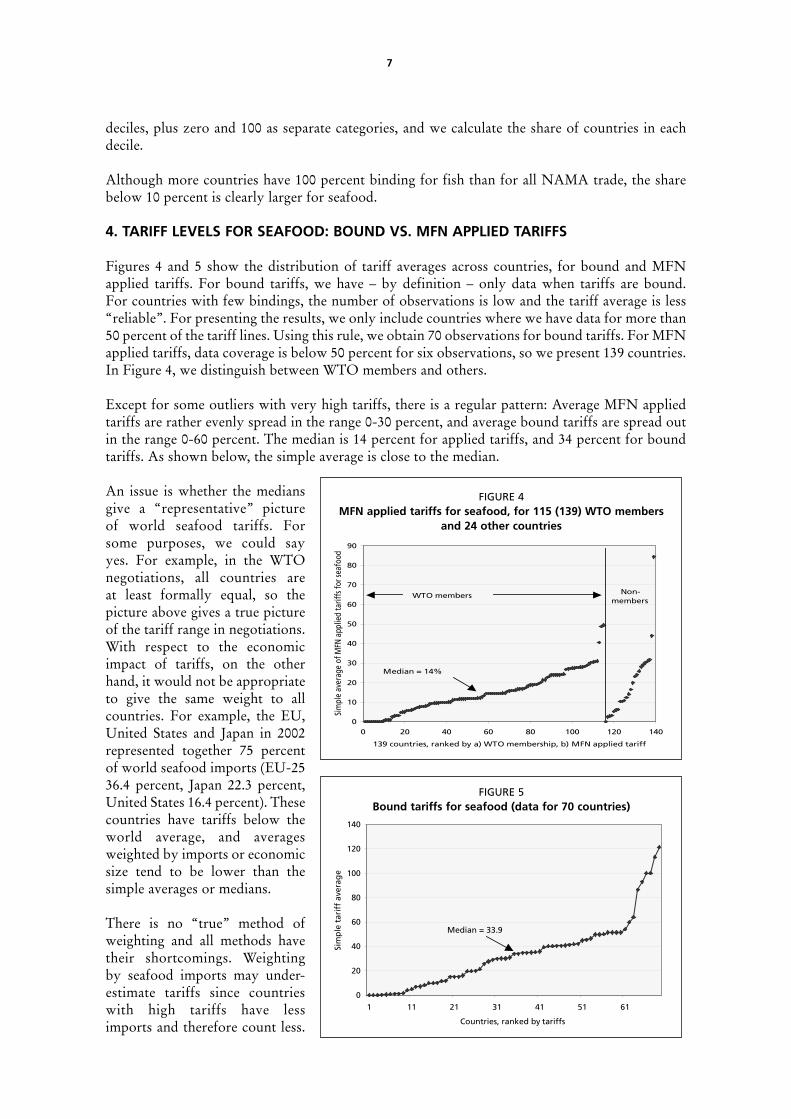
Figures 4 and 5 show the distribution of tariff averages across countries, for bound and MFN applied tariffs. For bound tariffs, we have – by definition – only data when tariffs are bound. For countries with few bindings, the number of observations is low and the tariff average is less “reliable”. For presenting the results, we only include countries where we have data for more than 50 percent of the tariff lines. Using this rule, we obtain 70 observations for bound tariffs. For MFN applied tariffs, data coverage is below 50 percent for six observations, so we present 139 countries. In Figure 4, we distinguish between WTO members and others.
Except for some outliers with very high tariffs, there is a regular pattern: Average MFN applied tariffs are rather evenly spread in the range 0-30 percent, and average bound tariffs are spread out in the range 0-60 percent. The median is 14 percent for applied tariffs, and 34 percent for bound tariffs. As shown below, the simple average is close to the median.
An issue is whether the medians give a “representative” picture of world seafood tariffs. For some purposes, we could say yes. For example, in the WTO negotiations, all countries are at least formally equal, so the picture above gives a true picture of the tariff range in negotiations. With respect to the economic impact of tariffs, on the other hand, it would not be appropriate to give the same weight to all countries. For example, the EU, United States and Japan in 2002 represented together 75 percent of world seafood imports (EU-25 36.4 percent, Japan 22.3 percent, United States 16.4 percent). These countries have tariffs below the world average, and averages weighted by imports or economic size tend to be lower than the simple averages or medians.
There is no “true” method of weighting and all methods have their shortcomings. Weighting by seafood imports may under-estimate tariffs since countries with high tariffs have less imports and therefore count less.
FIGURE 4MFN applied tariffs for seafood, for 115 (139) WTO members
and 24 other countries
0
10
20
30
40
50
60
70
80
90
0 20 40 60 80 100 120 140
139 countries, ranked by a) WTO membership, b) MFN applied tariff
Sim
ple
aver
age
of M
FN a
pplie
d ta
riffs
for s
eafo
od
WTO members Non-members
Median = 14%
FIGURE 5Bound tariffs for seafood (data for 70 countries)
0
20
40
60
80
100
120
140
1 11 21 31 41 51 61
Countries, ranked by tariffs
Sim
ple
tar
iff
aver
age
Median = 33.9
8
Weighting by gross domestic product (GDP) may solve this problem, but differences in demand are then neglected. All forms of weighting based on current economic activity may also underestimate the significance of tariffs in the longer run; India’s economic size is currently small relative to its share of the world’s population, but the country grows rapidly so this may change over time.
Based on these considerations, we show averages with different weights. We use alternatively as weights (a) population, (b) gross national income (GNI) in current US$, (c) GDP in purchasing power parity (PPP) dollars, and (d) fish imports.8 We show results for the whole sample as well as different income groups. For the latter purpose, we use the World Bank’s classification of income groups.9
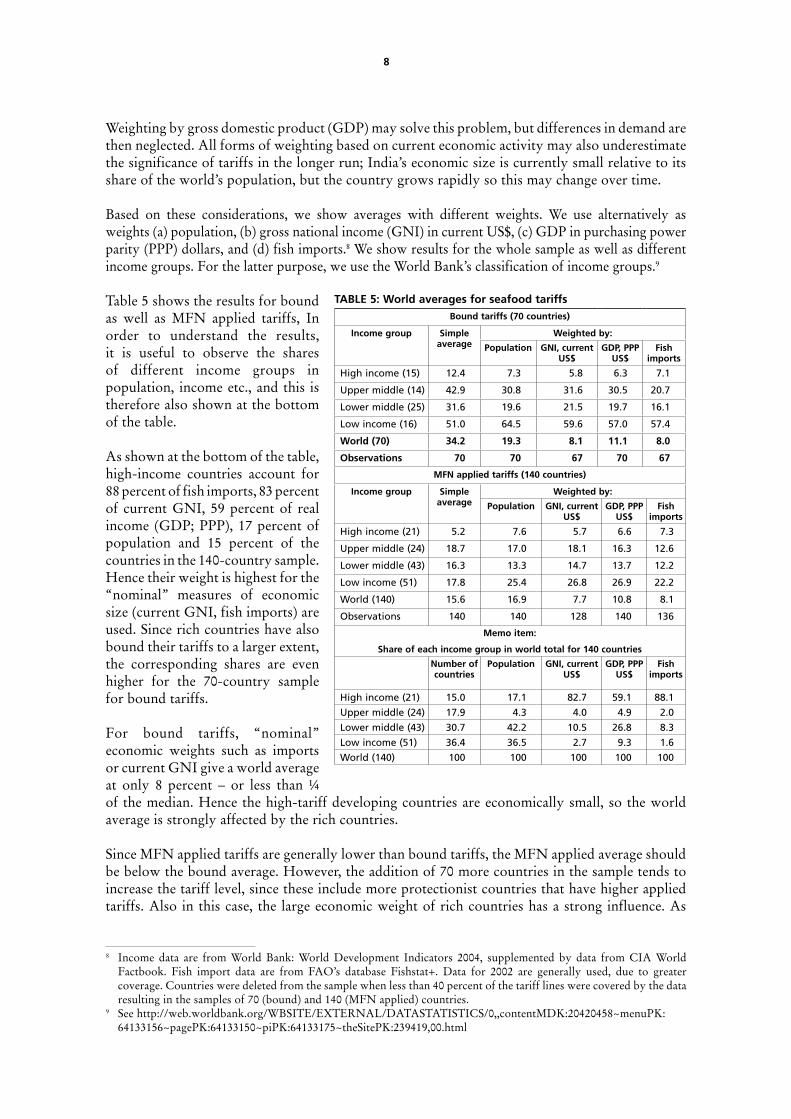
Table 5 shows the results for bound as well as MFN applied tariffs, In order to understand the results, it is useful to observe the shares of different income groups in population, income etc., and this is therefore also shown at the bottom of the table.
As shown at the bottom of the table, high-income countries account for 88 percent of fish imports, 83 percent of current GNI, 59 percent of real income (GDP; PPP), 17 percent of population and 15 percent of the countries in the 140-country sample. Hence their weight is highest for the “nominal” measures of economic size (current GNI, fish imports) are used. Since rich countries have also bound their tariffs to a larger extent, the corresponding shares are even higher for the 70-country sample for bound tariffs.
For bound tariffs, “nominal” economic weights such as imports or current GNI give a world average at only 8 percent – or less than ¼ of the median. Hence the high-tariff developing countries are economically small, so the world average is strongly affected by the rich countries.
Since MFN applied tariffs are generally lower than bound tariffs, the MFN applied average should be below the bound average. However, the addition of 70 more countries in the sample tends to increase the tariff level, since these include more protectionist countries that have higher applied tariffs. Also in this case, the large economic weight of rich countries has a strong influence. As
TABLE 5: World averages for seafood tariffsBound tariffs (70 countries)
Income group Simple average
Weighted by:
Population GNI, current US$
GDP, PPP US$
Fish imports
High income (15) 12.4 7.3 5.8 6.3 7.1
Upper middle (14) 42.9 30.8 31.6 30.5 20.7
Lower middle (25) 31.6 19.6 21.5 19.7 16.1
Low income (16) 51.0 64.5 59.6 57.0 57.4
World (70) 34.2 19.3 8.1 11.1 8.0
Observations 70 70 67 70 67
MFN applied tariffs (140 countries)
Income group Simple average
Weighted by:
Population GNI, current US$
GDP, PPP US$
Fish imports
High income (21) 5.2 7.6 5.7 6.6 7.3
Upper middle (24) 18.7 17.0 18.1 16.3 12.6
Lower middle (43) 16.3 13.3 14.7 13.7 12.2
Low income (51) 17.8 25.4 26.8 26.9 22.2
World (140) 15.6 16.9 7.7 10.8 8.1
Observations 140 140 128 140 136
Memo item:
Share of each income group in world total for 140 countries
Number of countries
Population GNI, current US$
GDP, PPP US$
Fish imports
High income (21) 15.0 17.1 82.7 59.1 88.1
Upper middle (24) 17.9 4.3 4.0 4.9 2.0
Lower middle (43) 30.7 42.2 10.5 26.8 8.3
Low income (51) 36.4 36.5 2.7 9.3 1.6
World (140) 100 100 100 100 100
8 Income data are from World Bank: World Development Indicators 2004, supplemented by data from CIA World Factbook. Fish import data are from FAO’s database Fishstat+. Data for 2002 are generally used, due to greater coverage. Countries were deleted from the sample when less than 40 percent of the tariff lines were covered by the data resulting in the samples of 70 (bound) and 140 (MFN applied) countries.
9 See http://web.worldbank.org/WBSITE/EXTERNAL/DATASTATISTICS/0,,contentMDK:20420458~menuPK: 64133156~pagePK:64133150~piPK:64133175~theSitePK:239419,00.html
9
a result, the weighted world average is almost the same as for bound tariffs; at 8 percent if we use “nominal” measures. The similarity between bound and applied averages should not be erroneously interpreted in the sense that bound and applied tariffs are approximately equal. As shown in Figures 4 and 5, this is generally not true, and we shall provide more specific evidence in Section 6.
If we use “real” (price level adjusted) PPP measures of income, the world tariff average increases by three percentage points, to 11 percent. And if we weight by population, the average increases to 19 percent for bound and 17 percent for MFN applied tariffs.
We expect that the average weighted by fish imports should be lower than e.g. GDP-weighted figures, due to the standard “weighting bias”: Countries with high tariffs have little imports so their weight is reduced. Comparing with GNI/GDP-weighted averages, our expectation is fulfilled in 11 out of 12 cases for developing countries. The weighting bias is therefore an issue particularly for countries with relatively high tariffs.
For high-income countries, the weighted averages for MFN applied tariffs are higher than the simple average. The reason is mainly that the EU has tariffs above the average for the group (simple MFN applied average for the EU is 11.7 percent). A similar effect is present for low-income countries, where India has relatively high applied tariffs and this raises the weighted average for the group.
While it is true that income and tariff levels are correlated, the upper middle income countries stand out with higher tariffs than we would expect from this ranking.10
The analysis shows that there is not a single true measure for the world tariff average for seafood. In the WTO context, it is appropriate to think of average bound tariffs above 30 percent, but for measuring the actual burden of tariffs faced by importers, figures around 10 percent are more appropriate.
In the calculations above, we have not accounted for preferential tariffs, which may bring tariffs below the MFN applied level. We revert to these in Sections 7 and 8.
5. ARE SEAFOOD TARIFFS HIGHER THAN TARIFFS FOR OTHER GOODS?
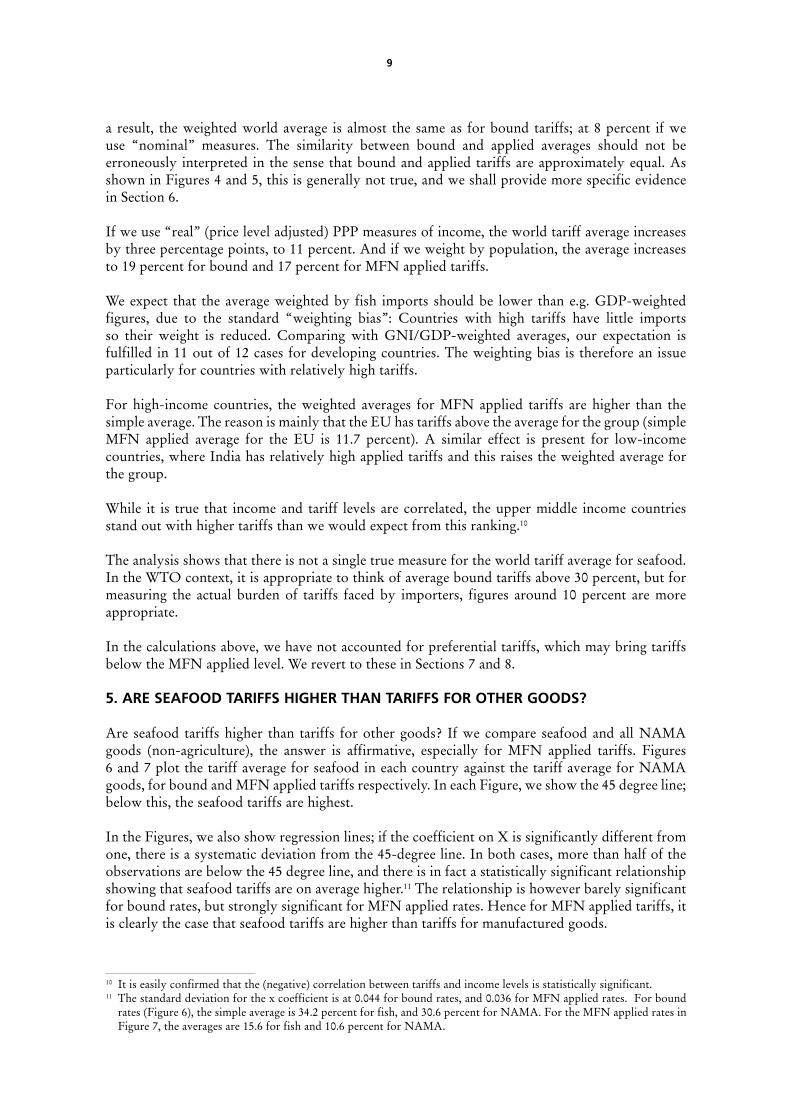
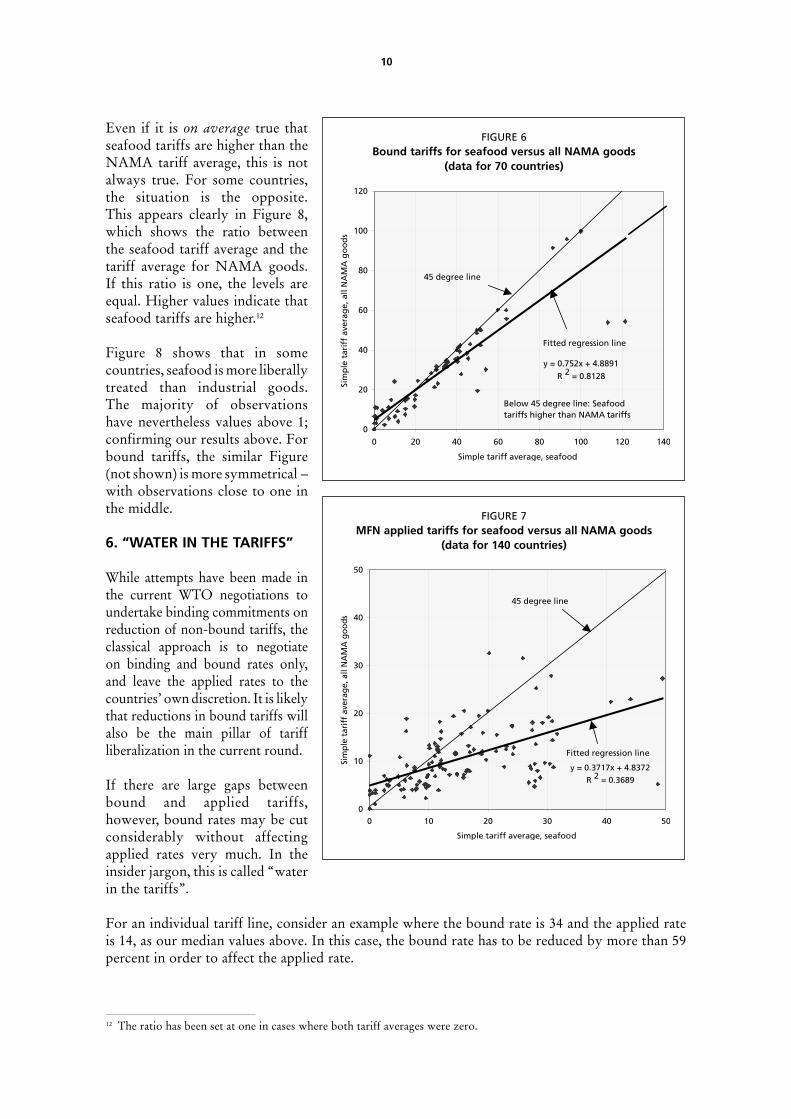
Are seafood tariffs higher than tariffs for other goods? If we compare seafood and all NAMA goods (non-agriculture), the answer is affirmative, especially for MFN applied tariffs. Figures 6 and 7 plot the tariff average for seafood in each country against the tariff average for NAMA goods, for bound and MFN applied tariffs respectively. In each Figure, we show the 45 degree line; below this, the seafood tariffs are highest.
In the Figures, we also show regression lines; if the coefficient on X is significantly different from one, there is a systematic deviation from the 45-degree line. In both cases, more than half of the observations are below the 45 degree line, and there is in fact a statistically significant relationship showing that seafood tariffs are on average higher.11 The relationship is however barely significant for bound rates, but strongly significant for MFN applied rates. Hence for MFN applied tariffs, it is clearly the case that seafood tariffs are higher than tariffs for manufactured goods.
10 It is easily confirmed that the (negative) correlation between tariffs and income levels is statistically significant.11 The standard deviation for the x coefficient is at 0.044 for bound rates, and 0.036 for MFN applied rates. For bound
rates (Figure 6), the simple average is 34.2 percent for fish, and 30.6 percent for NAMA. For the MFN applied rates in Figure 7, the averages are 15.6 for fish and 10.6 percent for NAMA.
10
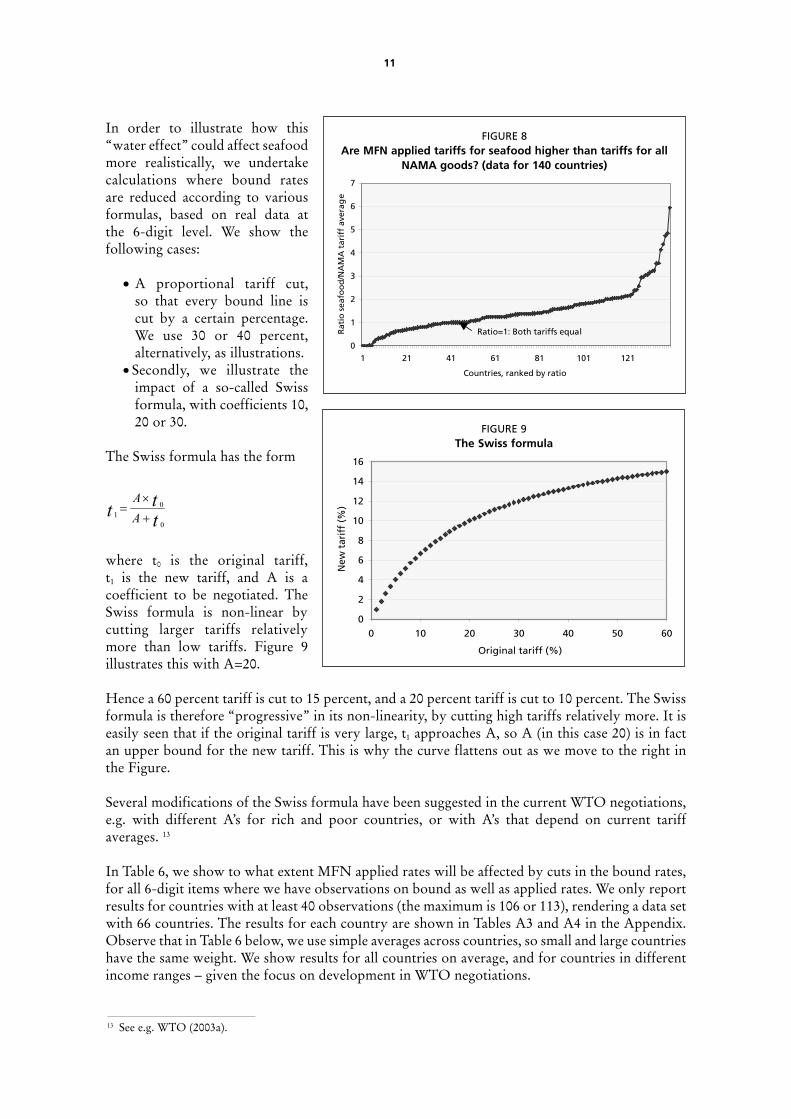
Even if it is on average true that seafood tariffs are higher than the NAMA tariff average, this is not always true. For some countries, the situation is the opposite. This appears clearly in Figure 8, which shows the ratio between the seafood tariff average and the tariff average for NAMA goods. If this ratio is one, the levels are equal. Higher values indicate that seafood tariffs are higher.12
Figure 8 shows that in some countries, seafood is more liberally treated than industrial goods. The majority of observations have nevertheless values above 1; confirming our results above. For bound tariffs, the similar Figure (not shown) is more symmetrical – with observations close to one in the middle.
6. “WATER IN THE TARIFFS”
While attempts have been made in the current WTO negotiations to undertake binding commitments on reduction of non-bound tariffs, the classical approach is to negotiate on binding and bound rates only, and leave the applied rates to the countries’ own discretion. It is likely that reductions in bound tariffs will also be the main pillar of tariff liberalization in the current round.
If there are large gaps between bound and applied tariffs, however, bound rates may be cut considerably without affecting applied rates very much. In the insider jargon, this is called “water in the tariffs”.
For an individual tariff line, consider an example where the bound rate is 34 and the applied rate is 14, as our median values above. In this case, the bound rate has to be reduced by more than 59 percent in order to affect the applied rate.
FIGURE 6Bound tariffs for seafood versus all NAMA goods
(data for 70 countries)
y = 0.752x + 4.8891
R 2 = 0.8128
0
20
40
60
80
100
120
0 20 40 60 80 100 120 140
Simple tariff average, seafood
Sim
ple
tar
iff
aver
age,
all
NA
MA
go
od
sFitted regression line
45 degree line
Below 45 degree line: Seafood tariffs higher than NAMA tariffs
FIGURE 7MFN applied tariffs for seafood versus all NAMA goods
(data for 140 countries)
y = 0.3717x + 4.8372
R 2 = 0.3689
0
10
20
30
40
50
0 10 20 30 40 50
Simple tariff average, seafood
Sim
ple
tar
iff
aver
age,
all
NA
MA
go
od
s
Fitted regression line
45 degree line
12 The ratio has been set at one in cases where both tariff averages were zero.
11
In order to illustrate how this “water effect” could affect seafood more realistically, we undertake calculations where bound rates are reduced according to various formulas, based on real data at the 6-digit level. We show the following cases:
• A proportional tariff cut, so that every bound line is cut by a certain percentage. We use 30 or 40 percent, alternatively, as illustrations.
• Secondly, we illustrate the impact of a so-called Swiss formula, with coefficients 10, 20 or 30.
The Swiss formula has the form
01
0
A
Att t
×=
+
where t0 is the original tariff, t1 is the new tariff, and A is a coefficient to be negotiated. The Swiss formula is non-linear by cutting larger tariffs relatively more than low tariffs. Figure 9 illustrates this with A=20.
Hence a 60 percent tariff is cut to 15 percent, and a 20 percent tariff is cut to 10 percent. The Swiss formula is therefore “progressive” in its non-linearity, by cutting high tariffs relatively more. It is easily seen that if the original tariff is very large, t1 approaches A, so A (in this case 20) is in fact an upper bound for the new tariff. This is why the curve flattens out as we move to the right in the Figure.
Several modifications of the Swiss formula have been suggested in the current WTO negotiations, e.g. with different A’s for rich and poor countries, or with A’s that depend on current tariff averages. 13
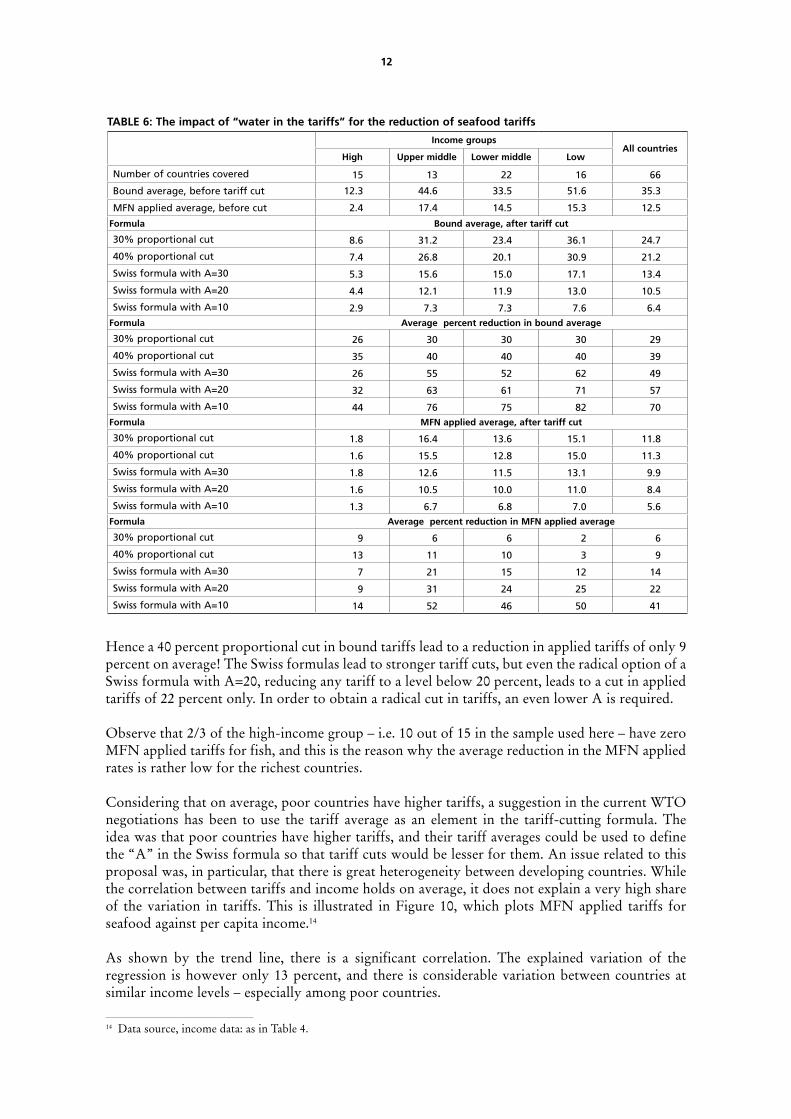
In Table 6, we show to what extent MFN applied rates will be affected by cuts in the bound rates, for all 6-digit items where we have observations on bound as well as applied rates. We only report results for countries with at least 40 observations (the maximum is 106 or 113), rendering a data set with 66 countries. The results for each country are shown in Tables A3 and A4 in the Appendix. Observe that in Table 6 below, we use simple averages across countries, so small and large countries have the same weight. We show results for all countries on average, and for countries in different income ranges – given the focus on development in WTO negotiations.
FIGURE 8Are MFN applied tariffs for seafood higher than tariffs for all
NAMA goods? (data for 140 countries)
0
1
2
3
4
5
6
7
1 21 41 61 81 101 121
Countries, ranked by ratio
Rat
io s
eafo
od
/NA
MA
tar
iff
aver
age
Ratio=1: Both tariffs equal
FIGURE 9The Swiss formula
0
2
4
6
8
10
12
14
16
0 10 20 30 40 50 60
Original tariff (%)
New
tar
iff
(%)
13 See e.g. WTO (2003a).
12
Hence a 40 percent proportional cut in bound tariffs lead to a reduction in applied tariffs of only 9 percent on average! The Swiss formulas lead to stronger tariff cuts, but even the radical option of a Swiss formula with A=20, reducing any tariff to a level below 20 percent, leads to a cut in applied tariffs of 22 percent only. In order to obtain a radical cut in tariffs, an even lower A is required.
Observe that 2/3 of the high-income group – i.e. 10 out of 15 in the sample used here – have zero MFN applied tariffs for fish, and this is the reason why the average reduction in the MFN applied rates is rather low for the richest countries.
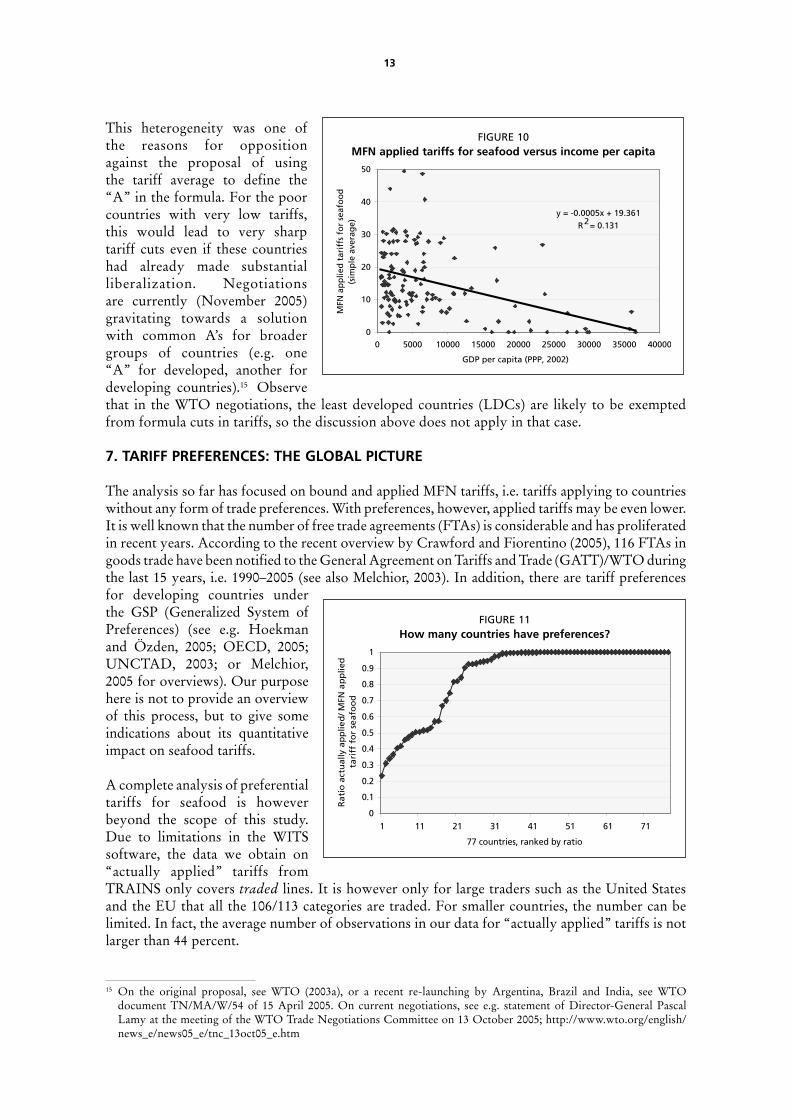
Considering that on average, poor countries have higher tariffs, a suggestion in the current WTO negotiations has been to use the tariff average as an element in the tariff-cutting formula. The idea was that poor countries have higher tariffs, and their tariff averages could be used to define the “A” in the Swiss formula so that tariff cuts would be lesser for them. An issue related to this proposal was, in particular, that there is great heterogeneity between developing countries. While the correlation between tariffs and income holds on average, it does not explain a very high share of the variation in tariffs. This is illustrated in Figure 10, which plots MFN applied tariffs for seafood against per capita income.14
As shown by the trend line, there is a significant correlation. The explained variation of the regression is however only 13 percent, and there is considerable variation between countries at similar income levels – especially among poor countries.
TABLE 6: The impact of “water in the tariffs” for the reduction of seafood tariffs
Income groupsAll countries
High Upper middle Lower middle Low
Number of countries covered 15 13 22 16 66
Bound average, before tariff cut 12.3 44.6 33.5 51.6 35.3
MFN applied average, before cut 2.4 17.4 14.5 15.3 12.5
Formula Bound average, after tariff cut
30% proportional cut 8.6 31.2 23.4 36.1 24.7
40% proportional cut 7.4 26.8 20.1 30.9 21.2
Swiss formula with A=30 5.3 15.6 15.0 17.1 13.4
Swiss formula with A=20 4.4 12.1 11.9 13.0 10.5
Swiss formula with A=10 2.9 7.3 7.3 7.6 6.4Formula Average percent reduction in bound average
30% proportional cut 26 30 30 30 29
40% proportional cut 35 40 40 40 39
Swiss formula with A=30 26 55 52 62 49
Swiss formula with A=20 32 63 61 71 57
Swiss formula with A=10 44 76 75 82 70Formula MFN applied average, after tariff cut
30% proportional cut 1.8 16.4 13.6 15.1 11.8
40% proportional cut 1.6 15.5 12.8 15.0 11.3
Swiss formula with A=30 1.8 12.6 11.5 13.1 9.9
Swiss formula with A=20 1.6 10.5 10.0 11.0 8.4
Swiss formula with A=10 1.3 6.7 6.8 7.0 5.6Formula Average percent reduction in MFN applied average
30% proportional cut 9 6 6 2 6
40% proportional cut 13 11 10 3 9
Swiss formula with A=30 7 21 15 12 14
Swiss formula with A=20 9 31 24 25 22
Swiss formula with A=10 14 52 46 50 41
14 Data source, income data: as in Table 4.
13
This heterogeneity was one of the reasons for opposition against the proposal of using the tariff average to define the “A” in the formula. For the poor countries with very low tariffs, this would lead to very sharp tariff cuts even if these countries had already made substantial liberalization. Negotiations are currently (November 2005) gravitating towards a solution with common A’s for broader groups of countries (e.g. one “A” for developed, another for developing countries).15 Observe that in the WTO negotiations, the least developed countries (LDCs) are likely to be exempted from formula cuts in tariffs, so the discussion above does not apply in that case.
7. TARIFF PREFERENCES: THE GLOBAL PICTURE
The analysis so far has focused on bound and applied MFN tariffs, i.e. tariffs applying to countries without any form of trade preferences. With preferences, however, applied tariffs may be even lower. It is well known that the number of free trade agreements (FTAs) is considerable and has proliferated in recent years. According to the recent overview by Crawford and Fiorentino (2005), 116 FTAs in goods trade have been notified to the General Agreement on Tariffs and Trade (GATT)/WTO during the last 15 years, i.e. 1990–2005 (see also Melchior, 2003). In addition, there are tariff preferences for developing countries under the GSP (Generalized System of Preferences) (see e.g. Hoekman and Özden, 2005; OECD, 2005; UNCTAD, 2003; or Melchior, 2005 for overviews). Our purpose here is not to provide an overview of this process, but to give some indications about its quantitative impact on seafood tariffs.
A complete analysis of preferential tariffs for seafood is however beyond the scope of this study. Due to limitations in the WITS software, the data we obtain on “actually applied” tariffs from TRAINS only covers traded lines. It is however only for large traders such as the United States and the EU that all the 106/113 categories are traded. For smaller countries, the number can be limited. In fact, the average number of observations in our data for “actually applied” tariffs is not larger than 44 percent.
FIGURE 10MFN applied tariffs for seafood versus income per capita
y = -0.0005x + 19.361R2 = 0.131
0
10
20
30
40
50
0 5000 10000 15000 20000 25000 30000 35000 40000
GDP per capita (PPP, 2002)
MFN
ap
plie
d t
arif
fs f
or
seaf
oo
d
(sim
ple
ave
rag
e)
FIGURE 11How many countries have preferences?
0
0.1
0.2
0.3
0.4
0.5
0.6
0.7
0.8
0.9
1
1 11 21 31 41 51 61 71
77 countries, ranked by ratio
Ra
tio
act
ual
ly a
pp
lied
/ MFN
ap
plie
d
tari
ff f
or
seaf
oo
d
15 On the original proposal, see WTO (2003a), or a recent re-launching by Argentina, Brazil and India, see WTO document TN/MA/W/54 of 15 April 2005. On current negotiations, see e.g. statement of Director-General Pascal Lamy at the meeting of the WTO Trade Negotiations Committee on 13 October 2005; http://www.wto.org/english/news_e/news05_e/tnc_13oct05_e.htm
14
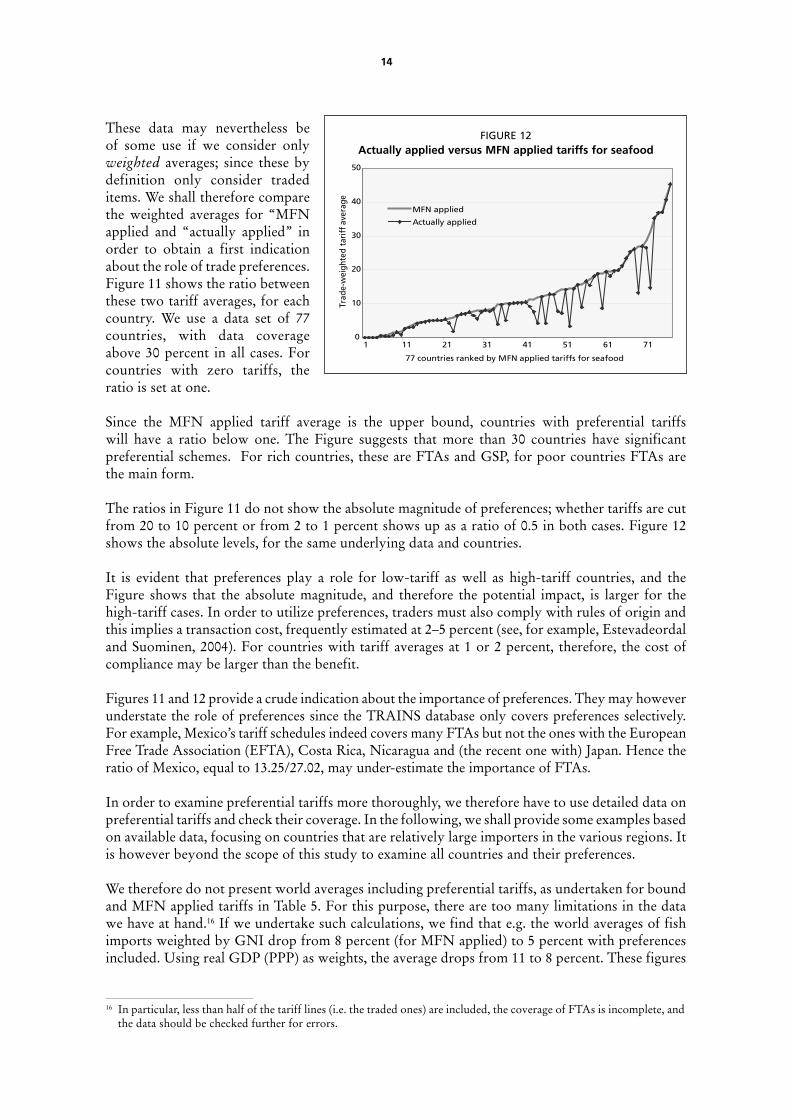
These data may nevertheless be of some use if we consider only weighted averages; since these by definition only consider traded items. We shall therefore compare the weighted averages for “MFN applied and “actually applied” in order to obtain a first indication about the role of trade preferences. Figure 11 shows the ratio between these two tariff averages, for each country. We use a data set of 77 countries, with data coverage above 30 percent in all cases. For countries with zero tariffs, the ratio is set at one.
Since the MFN applied tariff average is the upper bound, countries with preferential tariffs will have a ratio below one. The Figure suggests that more than 30 countries have significant preferential schemes. For rich countries, these are FTAs and GSP, for poor countries FTAs are the main form.
The ratios in Figure 11 do not show the absolute magnitude of preferences; whether tariffs are cut from 20 to 10 percent or from 2 to 1 percent shows up as a ratio of 0.5 in both cases. Figure 12 shows the absolute levels, for the same underlying data and countries.
It is evident that preferences play a role for low-tariff as well as high-tariff countries, and the Figure shows that the absolute magnitude, and therefore the potential impact, is larger for the high-tariff cases. In order to utilize preferences, traders must also comply with rules of origin and this implies a transaction cost, frequently estimated at 2–5 percent (see, for example, Estevadeordal and Suominen, 2004). For countries with tariff averages at 1 or 2 percent, therefore, the cost of compliance may be larger than the benefit.
Figures 11 and 12 provide a crude indication about the importance of preferences. They may however understate the role of preferences since the TRAINS database only covers preferences selectively. For example, Mexico’s tariff schedules indeed covers many FTAs but not the ones with the European Free Trade Association (EFTA), Costa Rica, Nicaragua and (the recent one with) Japan. Hence the ratio of Mexico, equal to 13.25/27.02, may under-estimate the importance of FTAs.
In order to examine preferential tariffs more thoroughly, we therefore have to use detailed data on preferential tariffs and check their coverage. In the following, we shall provide some examples based on available data, focusing on countries that are relatively large importers in the various regions. It is however beyond the scope of this study to examine all countries and their preferences.
We therefore do not present world averages including preferential tariffs, as undertaken for bound and MFN applied tariffs in Table 5. For this purpose, there are too many limitations in the data we have at hand.16 If we undertake such calculations, we find that e.g. the world averages of fish imports weighted by GNI drop from 8 percent (for MFN applied) to 5 percent with preferences included. Using real GDP (PPP) as weights, the average drops from 11 to 8 percent. These figures
FIGURE 12Actually applied versus MFN applied tariffs for seafood
0
10
20
30
40
50
1 11 21 31 41 51 61 71
77 countries ranked by MFN applied tariffs for seafood
Trad
e-w
eigh
ted
tari
ff a
vera
ge
MFN applied
Actually applied
16 In particular, less than half of the tariff lines (i.e. the traded ones) are included, the coverage of FTAs is incomplete, and the data should be checked further for errors.
15
are however uncertain and should be considered as crude indications rather than reliable results. Also in this case, the weight of the large high-income importers has strong influence so the average is close to the figure for the high-income group. In the context of e.g. WTO negotiations, a figure of 5 percent would nevertheless give a wrong impression about the true level of seafood tariffs.
8. TARIFF PREFERENCES: SELECTED COUNTRIES
In the following, we present some evidence of trade preferences for seafood in selected countries, based on tariff-line data in each case.
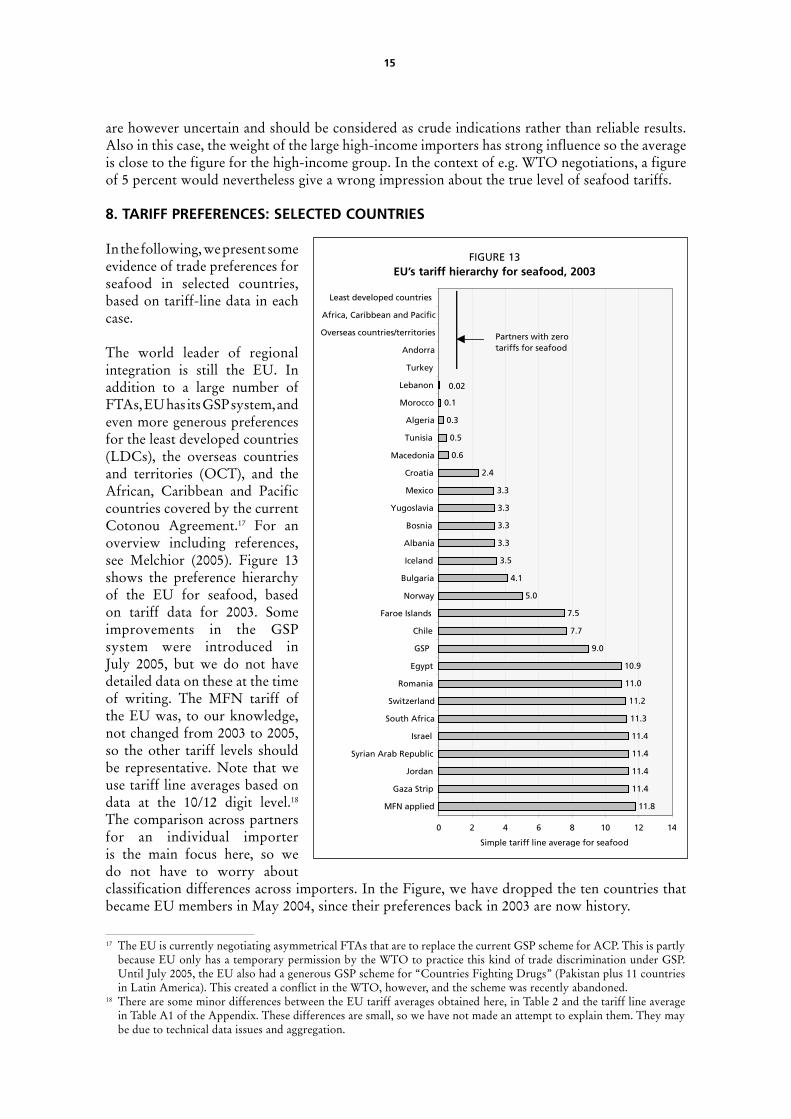
The world leader of regional integration is still the EU. In addition to a large number of FTAs, EU has its GSP system, and even more generous preferences for the least developed countries (LDCs), the overseas countries and territories (OCT), and the African, Caribbean and Pacific countries covered by the current Cotonou Agreement.17 For an overview including references, see Melchior (2005). Figure 13 shows the preference hierarchy of the EU for seafood, based on tariff data for 2003. Some improvements in the GSP system were introduced in July 2005, but we do not have detailed data on these at the time of writing. The MFN tariff of the EU was, to our knowledge, not changed from 2003 to 2005, so the other tariff levels should be representative. Note that we use tariff line averages based on data at the 10/12 digit level.18 The comparison across partners for an individual importer is the main focus here, so we do not have to worry about classification differences across importers. In the Figure, we have dropped the ten countries that became EU members in May 2004, since their preferences back in 2003 are now history.
FIGURE 13EU’s tariff hierarchy for seafood, 2003
11.8
11.4
11.4
11.4
11.4
11.3
11.2
11.0
10.9
9.0
7.7
7.5
5.0
4.1
3.5
3.3
3.3
3.3
3.3
2.4
0.6
0.5
0.3
0.1
0 2 4 6 8 10 12 14
MFN applied
Gaza Strip
Jordan
Syrian Arab Republic
Israel
South Africa
Switzerland
Romania
Egypt
GSP
Chile
Faroe Islands
Norway
Bulgaria
Iceland
Albania
Bosnia
Yugoslavia
Mexico
Croatia
Macedonia
Tunisia
Algeria
Morocco
Lebanon
Turkey
Andorra
Overseas countries/territories
Africa, Caribbean and Pacific
Least developed countries
Simple tariff line average for seafood
Partners with zero tariffs for seafood
0.02
17 The EU is currently negotiating asymmetrical FTAs that are to replace the current GSP scheme for ACP. This is partly because EU only has a temporary permission by the WTO to practice this kind of trade discrimination under GSP. Until July 2005, the EU also had a generous GSP scheme for “Countries Fighting Drugs” (Pakistan plus 11 countries in Latin America). This created a conflict in the WTO, however, and the scheme was recently abandoned.
18 There are some minor differences between the EU tariff averages obtained here, in Table 2 and the tariff line average in Table A1 of the Appendix. These differences are small, so we have not made an attempt to explain them. They may be due to technical data issues and aggregation.
16
Hence at least in 2003,19 ordinary GSP was not very generous for seafood; implying a rather modest tariff cut from 11.8 to 9.0 percent. LDCs, the African, Caribbean and Pacific Group of States (ACP) and overseas countries and territories (OCT) top the list with zero tariffs, and the FTAs span from almost complete tariff elimination to almost no reduction at all. From the “Christmas tree” it is clear that trade preferences play a major role for the EU, with tariff gaps at up to 12 percent for seafood. It should be observed that for seafood, EU tariffs are sometimes lowered within tariff rate quotas (TRQs). These have not been taken into account here, and the results should be interpreted with some caution due to this.
In North America, the United States and Canada also have FTAs and GSP. While tariff preferences may be quite important for e.g. textiles, agriculture and some manufactured goods, they are less important for seafood (see Melchior, 2005). The reason is that the average tariff level for seafood is low (around 1 percent for both, at the 6-digit level).
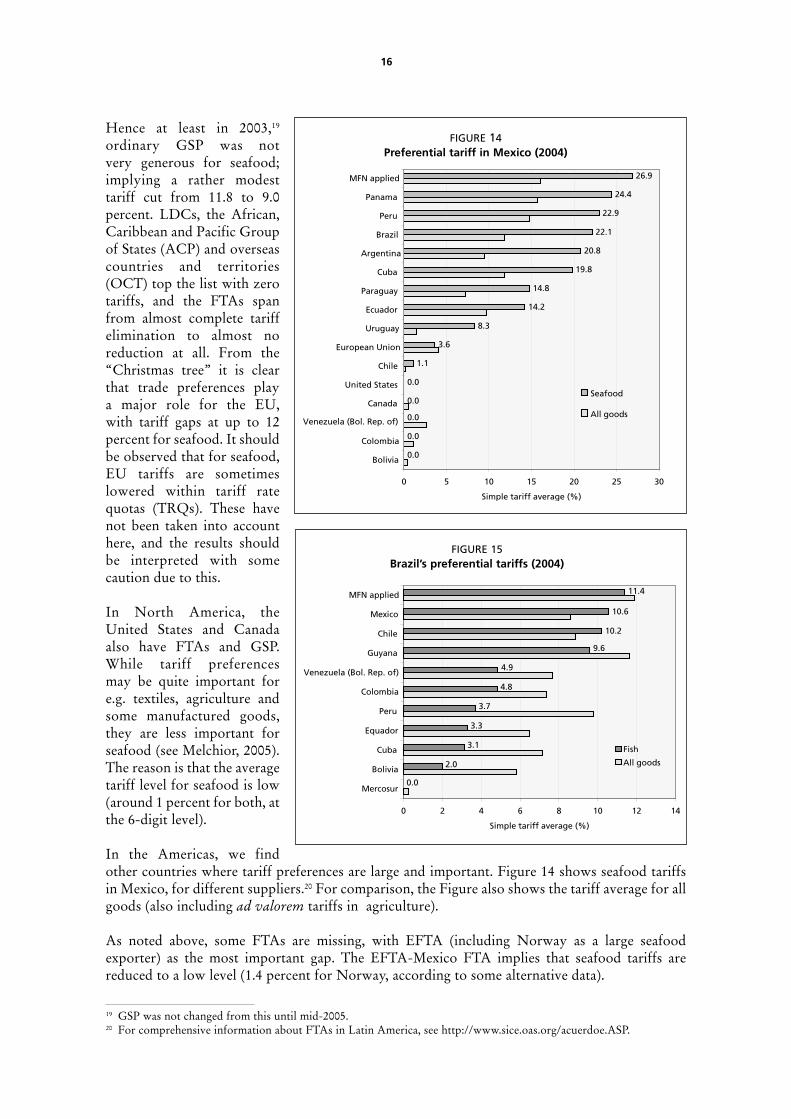
In the Americas, we find other countries where tariff preferences are large and important. Figure 14 shows seafood tariffs in Mexico, for different suppliers.20 For comparison, the Figure also shows the tariff average for all goods (also including ad valorem tariffs in agriculture).
As noted above, some FTAs are missing, with EFTA (including Norway as a large seafood exporter) as the most important gap. The EFTA-Mexico FTA implies that seafood tariffs are reduced to a low level (1.4 percent for Norway, according to some alternative data).
FIGURE 14Preferential tariff in Mexico (2004)
0.0
0.0
0.0
0.0
0.0
1.1
3.6
8.3
14.2
14.8
19.8
20.8
22.1
22.9
24.4
26.9
0 5 10 15 20 25 30
Bolivia
Colombia
Venezuela (Bol. Rep. of)
Canada
United States
Chile
European Union
Uruguay
Ecuador
Paraguay
Cuba
Argentina
Brazil
Peru
Panama
MFN applied
Simple tariff average (%)
Seafood
All goods
FIGURE 15Brazil’s preferential tariffs (2004)
2.0
3.1
3.3
3.7
4.8
4.9
9.6
10.2
10.6
11.4
0.0
0 2 4 6 8 10 12 14
Mercosur
Bolivia
Cuba
Equador
Peru
Colombia
Venezuela (Bol. Rep. of)
Guyana
Chile
Mexico
MFN applied
Simple tariff average (%)
Fish
All goods
19 GSP was not changed from this until mid-2005. 20 For comprehensive information about FTAs in Latin America, see http://www.sice.oas.org/acuerdoe.ASP.
17
With MFN tariffs at 27 percent, the tariff preferences of Mexico imply large differences between suppliers. Preferences within the Americas are important, but Mexico, along with Chile in particular, has been among the most ambitious in terms of expanding its FTA network worldwide. In addition to the EU and EFTA, this now also covers Japan. We will revert to the Mexico-Japan FTA later.
Figure 15 illustrates Brazil’s tariff structure:
All of Brazil’s preferences are in Latin America, with Mercosur (also including Argentina, Uruguay and Paraguay) obtaining complete tariff elimination for seafood, and almost complete tariff elimination for other goods. Observe the considerable difference in tariff levels for Chile and Peru; two large seafood exporters in the region.
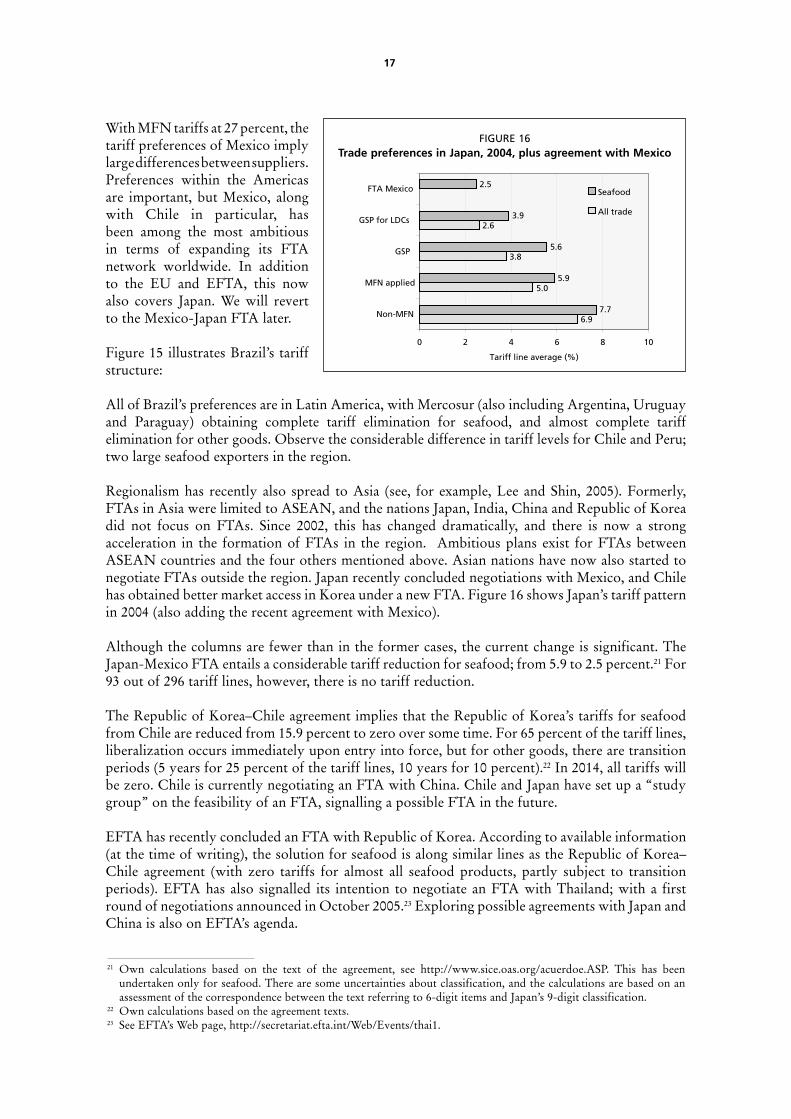
Regionalism has recently also spread to Asia (see, for example, Lee and Shin, 2005). Formerly, FTAs in Asia were limited to ASEAN, and the nations Japan, India, China and Republic of Korea did not focus on FTAs. Since 2002, this has changed dramatically, and there is now a strong acceleration in the formation of FTAs in the region. Ambitious plans exist for FTAs between ASEAN countries and the four others mentioned above. Asian nations have now also started to negotiate FTAs outside the region. Japan recently concluded negotiations with Mexico, and Chile has obtained better market access in Korea under a new FTA. Figure 16 shows Japan’s tariff pattern in 2004 (also adding the recent agreement with Mexico).
Although the columns are fewer than in the former cases, the current change is significant. The Japan-Mexico FTA entails a considerable tariff reduction for seafood; from 5.9 to 2.5 percent.21 For 93 out of 296 tariff lines, however, there is no tariff reduction.
The Republic of Korea–Chile agreement implies that the Republic of Korea’s tariffs for seafood from Chile are reduced from 15.9 percent to zero over some time. For 65 percent of the tariff lines, liberalization occurs immediately upon entry into force, but for other goods, there are transition periods (5 years for 25 percent of the tariff lines, 10 years for 10 percent).22 In 2014, all tariffs will be zero. Chile is currently negotiating an FTA with China. Chile and Japan have set up a “study group” on the feasibility of an FTA, signalling a possible FTA in the future.
EFTA has recently concluded an FTA with Republic of Korea. According to available information (at the time of writing), the solution for seafood is along similar lines as the Republic of Korea–Chile agreement (with zero tariffs for almost all seafood products, partly subject to transition periods). EFTA has also signalled its intention to negotiate an FTA with Thailand; with a first round of negotiations announced in October 2005.23 Exploring possible agreements with Japan and China is also on EFTA’s agenda.
FIGURE 16Trade preferences in Japan, 2004, plus agreement with Mexico
6.9
5.0
3.8
2.6
7.7
5.9
5.6
3.9
2.5
0 2 4 6 8 10
Non-MFN
MFN applied
GSP
GSP for LDCs
FTA Mexico
Tariff line average (%)
Seafood
All trade
21 Own calculations based on the text of the agreement, see http://www.sice.oas.org/acuerdoe.ASP. This has been undertaken only for seafood. There are some uncertainties about classification, and the calculations are based on an assessment of the correspondence between the text referring to 6-digit items and Japan’s 9-digit classification.
22 Own calculations based on the agreement texts.23 See EFTA’s Web page, http://secretariat.efta.int/Web/Events/thai1.
18
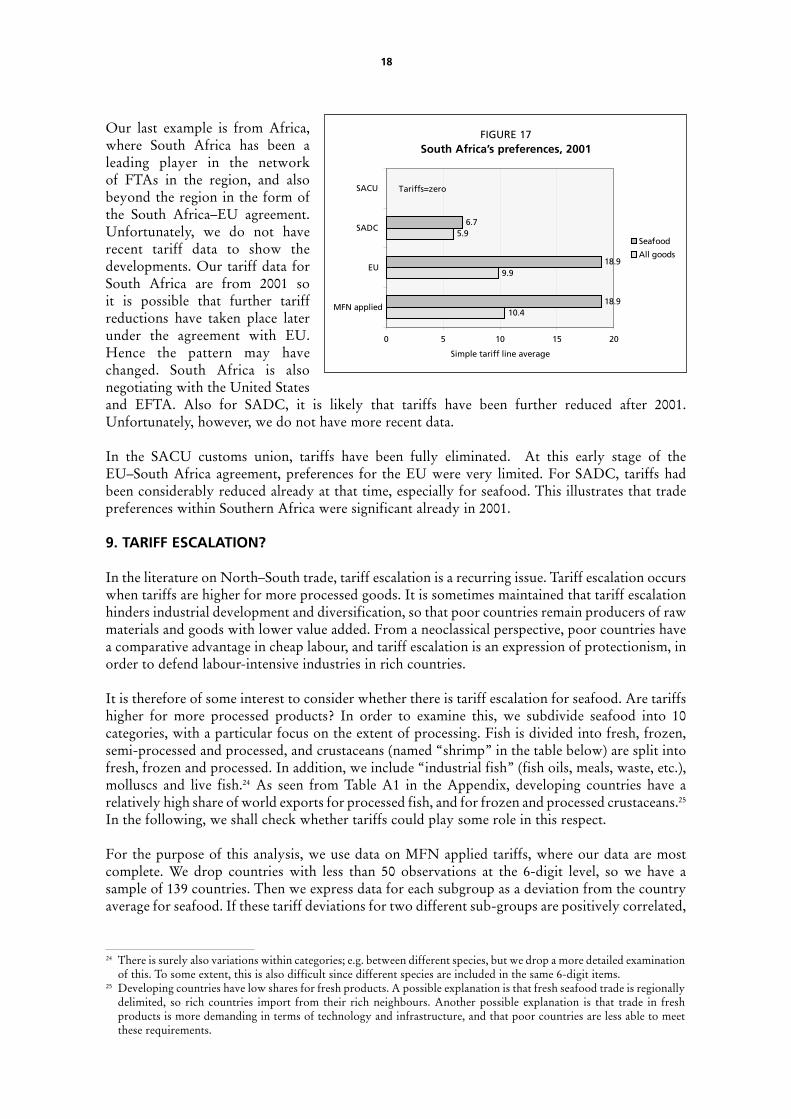
Our last example is from Africa, where South Africa has been a leading player in the network of FTAs in the region, and also beyond the region in the form of the South Africa–EU agreement. Unfortunately, we do not have recent tariff data to show the developments. Our tariff data for South Africa are from 2001 so it is possible that further tariff reductions have taken place later under the agreement with EU. Hence the pattern may have changed. South Africa is also negotiating with the United States and EFTA. Also for SADC, it is likely that tariffs have been further reduced after 2001. Unfortunately, however, we do not have more recent data.
In the SACU customs union, tariffs have been fully eliminated. At this early stage of the EU–South Africa agreement, preferences for the EU were very limited. For SADC, tariffs had been considerably reduced already at that time, especially for seafood. This illustrates that trade preferences within Southern Africa were significant already in 2001.
9. TARIFF ESCALATION?
In the literature on North–South trade, tariff escalation is a recurring issue. Tariff escalation occurs when tariffs are higher for more processed goods. It is sometimes maintained that tariff escalation hinders industrial development and diversification, so that poor countries remain producers of raw materials and goods with lower value added. From a neoclassical perspective, poor countries have a comparative advantage in cheap labour, and tariff escalation is an expression of protectionism, in order to defend labour-intensive industries in rich countries.
It is therefore of some interest to consider whether there is tariff escalation for seafood. Are tariffs higher for more processed products? In order to examine this, we subdivide seafood into 10 categories, with a particular focus on the extent of processing. Fish is divided into fresh, frozen, semi-processed and processed, and crustaceans (named “shrimp” in the table below) are split into fresh, frozen and processed. In addition, we include “industrial fish” (fish oils, meals, waste, etc.), molluscs and live fish.24 As seen from Table A1 in the Appendix, developing countries have a relatively high share of world exports for processed fish, and for frozen and processed crustaceans.25 In the following, we shall check whether tariffs could play some role in this respect.
For the purpose of this analysis, we use data on MFN applied tariffs, where our data are most complete. We drop countries with less than 50 observations at the 6-digit level, so we have a sample of 139 countries. Then we express data for each subgroup as a deviation from the country average for seafood. If these tariff deviations for two different sub-groups are positively correlated,
FIGURE 17South Africa’s preferences, 2001
10.4
9.9
5.9
18.9
18.9
6.7
0 5 10 15 20
MFN applied
EU
SADC
SACU
Simple tariff line average
Seafood
All goods
Tariffs=zero
24 There is surely also variations within categories; e.g. between different species, but we drop a more detailed examination of this. To some extent, this is also difficult since different species are included in the same 6-digit items.
25 Developing countries have low shares for fresh products. A possible explanation is that fresh seafood trade is regionally delimited, so rich countries import from their rich neighbours. Another possible explanation is that trade in fresh products is more demanding in terms of technology and infrastructure, and that poor countries are less able to meet these requirements.
19
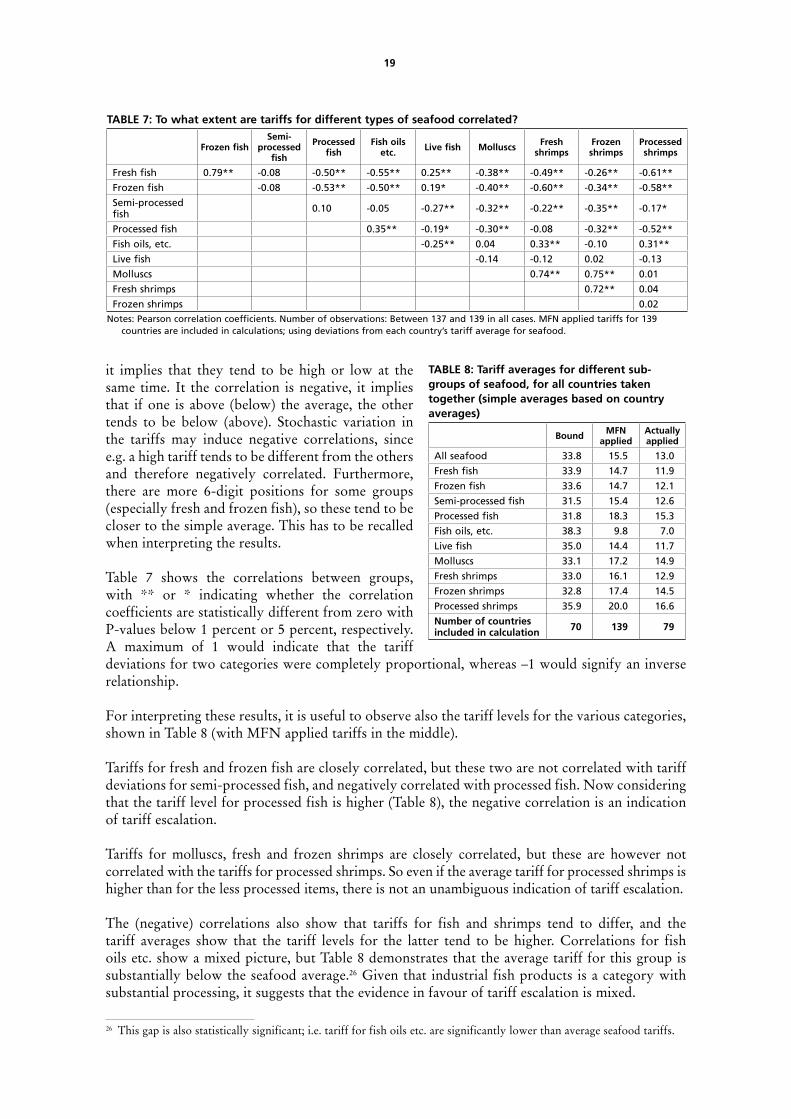
it implies that they tend to be high or low at the same time. It the correlation is negative, it implies that if one is above (below) the average, the other tends to be below (above). Stochastic variation in the tariffs may induce negative correlations, since e.g. a high tariff tends to be different from the others and therefore negatively correlated. Furthermore, there are more 6-digit positions for some groups (especially fresh and frozen fish), so these tend to be closer to the simple average. This has to be recalled when interpreting the results.
Table 7 shows the correlations between groups, with ** or * indicating whether the correlation coefficients are statistically different from zero with P-values below 1 percent or 5 percent, respectively. A maximum of 1 would indicate that the tariff deviations for two categories were completely proportional, whereas –1 would signify an inverse relationship.
For interpreting these results, it is useful to observe also the tariff levels for the various categories, shown in Table 8 (with MFN applied tariffs in the middle).
Tariffs for fresh and frozen fish are closely correlated, but these two are not correlated with tariff deviations for semi-processed fish, and negatively correlated with processed fish. Now considering that the tariff level for processed fish is higher (Table 8), the negative correlation is an indication of tariff escalation.
Tariffs for molluscs, fresh and frozen shrimps are closely correlated, but these are however not correlated with the tariffs for processed shrimps. So even if the average tariff for processed shrimps is higher than for the less processed items, there is not an unambiguous indication of tariff escalation.
The (negative) correlations also show that tariffs for fish and shrimps tend to differ, and the tariff averages show that the tariff levels for the latter tend to be higher. Correlations for fish oils etc. show a mixed picture, but Table 8 demonstrates that the average tariff for this group is substantially below the seafood average.26 Given that industrial fish products is a category with substantial processing, it suggests that the evidence in favour of tariff escalation is mixed.
TABLE 7: To what extent are tariffs for different types of seafood correlated?
Frozen fishSemi-
processed fish
Processed fish
Fish oils etc. Live fish Molluscs Fresh
shrimpsFrozen shrimps
Processed shrimps
Fresh fish 0.79** -0.08 -0.50** -0.55** 0.25** -0.38** -0.49** -0.26** -0.61**
Frozen fish -0.08 -0.53** -0.50** 0.19* -0.40** -0.60** -0.34** -0.58**
Semi-processed fish 0.10 -0.05 -0.27** -0.32** -0.22** -0.35** -0.17*
Processed fish 0.35** -0.19* -0.30** -0.08 -0.32** -0.52**
Fish oils, etc. -0.25** 0.04 0.33** -0.10 0.31**
Live fish -0.14 -0.12 0.02 -0.13
Molluscs 0.74** 0.75** 0.01
Fresh shrimps 0.72** 0.04
Frozen shrimps 0.02Notes: Pearson correlation coefficients. Number of observations: Between 137 and 139 in all cases. MFN applied tariffs for 139
countries are included in calculations; using deviations from each country’s tariff average for seafood.
TABLE 8: Tariff averages for different sub-groups of seafood, for all countries taken together (simple averages based on country averages)
Bound MFN applied
Actually applied
All seafood 33.8 15.5 13.0
Fresh fish 33.9 14.7 11.9
Frozen fish 33.6 14.7 12.1
Semi-processed fish 31.5 15.4 12.6
Processed fish 31.8 18.3 15.3
Fish oils, etc. 38.3 9.8 7.0
Live fish 35.0 14.4 11.7
Molluscs 33.1 17.2 14.9
Fresh shrimps 33.0 16.1 12.9
Frozen shrimps 32.8 17.4 14.5
Processed shrimps 35.9 20.0 16.6
Number of countries included in calculation 70 139 79
26 This gap is also statistically significant; i.e. tariff for fish oils etc. are significantly lower than average seafood tariffs.
20
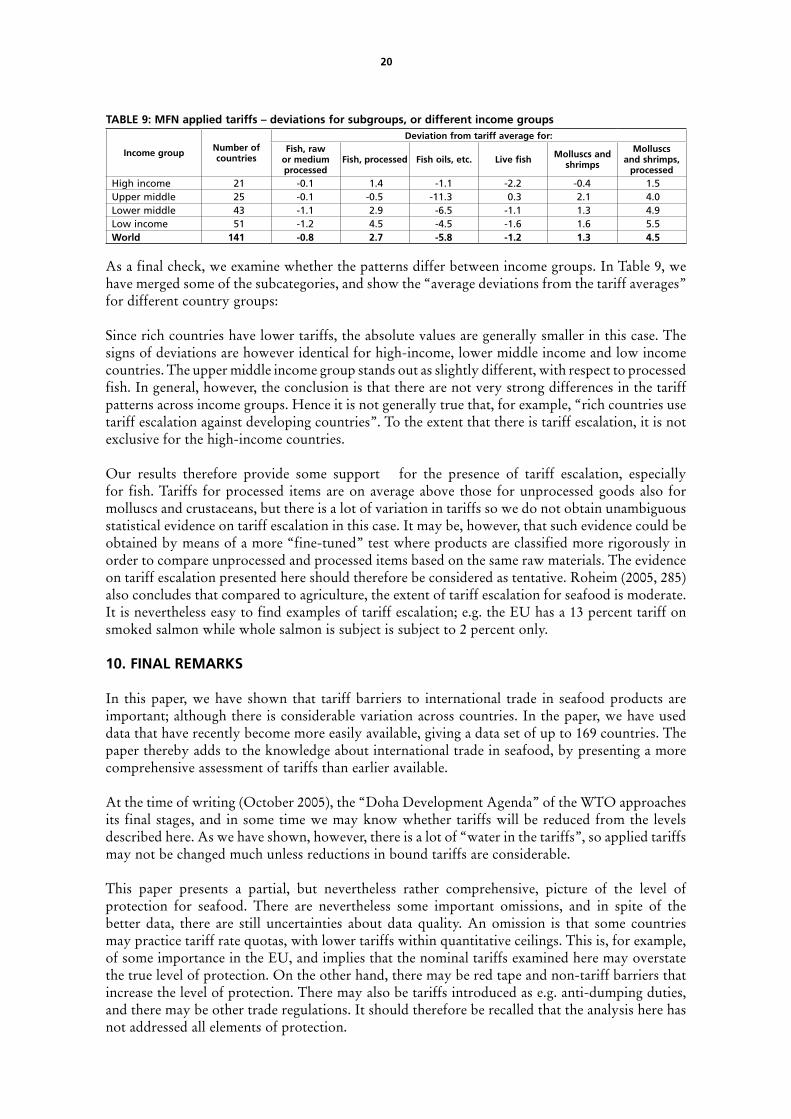
As a final check, we examine whether the patterns differ between income groups. In Table 9, we have merged some of the subcategories, and show the “average deviations from the tariff averages” for different country groups:
Since rich countries have lower tariffs, the absolute values are generally smaller in this case. The signs of deviations are however identical for high-income, lower middle income and low income countries. The upper middle income group stands out as slightly different, with respect to processed fish. In general, however, the conclusion is that there are not very strong differences in the tariff patterns across income groups. Hence it is not generally true that, for example, “rich countries use tariff escalation against developing countries”. To the extent that there is tariff escalation, it is not exclusive for the high-income countries.
Our results therefore provide some support for the presence of tariff escalation, especially for fish. Tariffs for processed items are on average above those for unprocessed goods also for molluscs and crustaceans, but there is a lot of variation in tariffs so we do not obtain unambiguous statistical evidence on tariff escalation in this case. It may be, however, that such evidence could be obtained by means of a more “fine-tuned” test where products are classified more rigorously in order to compare unprocessed and processed items based on the same raw materials. The evidence on tariff escalation presented here should therefore be considered as tentative. Roheim (2005, 285) also concludes that compared to agriculture, the extent of tariff escalation for seafood is moderate. It is nevertheless easy to find examples of tariff escalation; e.g. the EU has a 13 percent tariff on smoked salmon while whole salmon is subject is subject to 2 percent only.
10. FINAL REMARKS
In this paper, we have shown that tariff barriers to international trade in seafood products are important; although there is considerable variation across countries. In the paper, we have used data that have recently become more easily available, giving a data set of up to 169 countries. The paper thereby adds to the knowledge about international trade in seafood, by presenting a more comprehensive assessment of tariffs than earlier available.
At the time of writing (October 2005), the “Doha Development Agenda” of the WTO approaches its final stages, and in some time we may know whether tariffs will be reduced from the levels described here. As we have shown, however, there is a lot of “water in the tariffs”, so applied tariffs may not be changed much unless reductions in bound tariffs are considerable.
This paper presents a partial, but nevertheless rather comprehensive, picture of the level of protection for seafood. There are nevertheless some important omissions, and in spite of the better data, there are still uncertainties about data quality. An omission is that some countries may practice tariff rate quotas, with lower tariffs within quantitative ceilings. This is, for example, of some importance in the EU, and implies that the nominal tariffs examined here may overstate the true level of protection. On the other hand, there may be red tape and non-tariff barriers that increase the level of protection. There may also be tariffs introduced as e.g. anti-dumping duties, and there may be other trade regulations. It should therefore be recalled that the analysis here has not addressed all elements of protection.
TABLE 9: MFN applied tariffs – deviations for subgroups, or different income groups
Income group Number of countries
Deviation from tariff average for:Fish, raw
or medium processed
Fish, processed Fish oils, etc. Live fish Molluscs and shrimps
Molluscs and shrimps,
processedHigh income 21 -0.1 1.4 -1.1 -2.2 -0.4 1.5Upper middle 25 -0.1 -0.5 -11.3 0.3 2.1 4.0Lower middle 43 -1.1 2.9 -6.5 -1.1 1.3 4.9Low income 51 -1.2 4.5 -4.5 -1.6 1.6 5.5World 141 -0.8 2.7 -5.8 -1.2 1.3 4.5