tailor made lasr agonists modulate quorum sensing in ... · tailor made lasr agonists modulate...
TRANSCRIPT
S1
Supporting Information
Tailor Made LasR Agonists Modulate Quorum Sensing in
Pseudomonas aeruginosa
Nira Rabin, Antonia Delago,
Boaz Inbal, Pnina Krief and Michael M. Meijler
Department of Chemistry and the National Institute for Biotechnology in the Negev, Ben-Gurion
Universityof the Negev, Be’er-Sheva 84105, Israel.
E-mail: [email protected]
Table of contents
SurfRx S2
Figure 1: Side and top views of the C12 ligand and its SES S2
Figure 2: LasR and its SES S3
Figure 3: C12 ligand and its derived pharmacophoric points S3
Figure 4: LasR and its derived pharmacophoric points S4
Figure 5: Conformers and electrostatic SES maps of 8 (C12-piperidine) S4
Table 1: Summary of weight, radius and overlap score of the donor features S5
Figure 6: Stability molecular dynamics runs for 8 (C12-piperidine) S6
Figure 7: RMSD of the protein and ligand in C12-piperidine MD simulations S7
Figure 8: RMSD per residue in C12-piperidine MD simulations S8
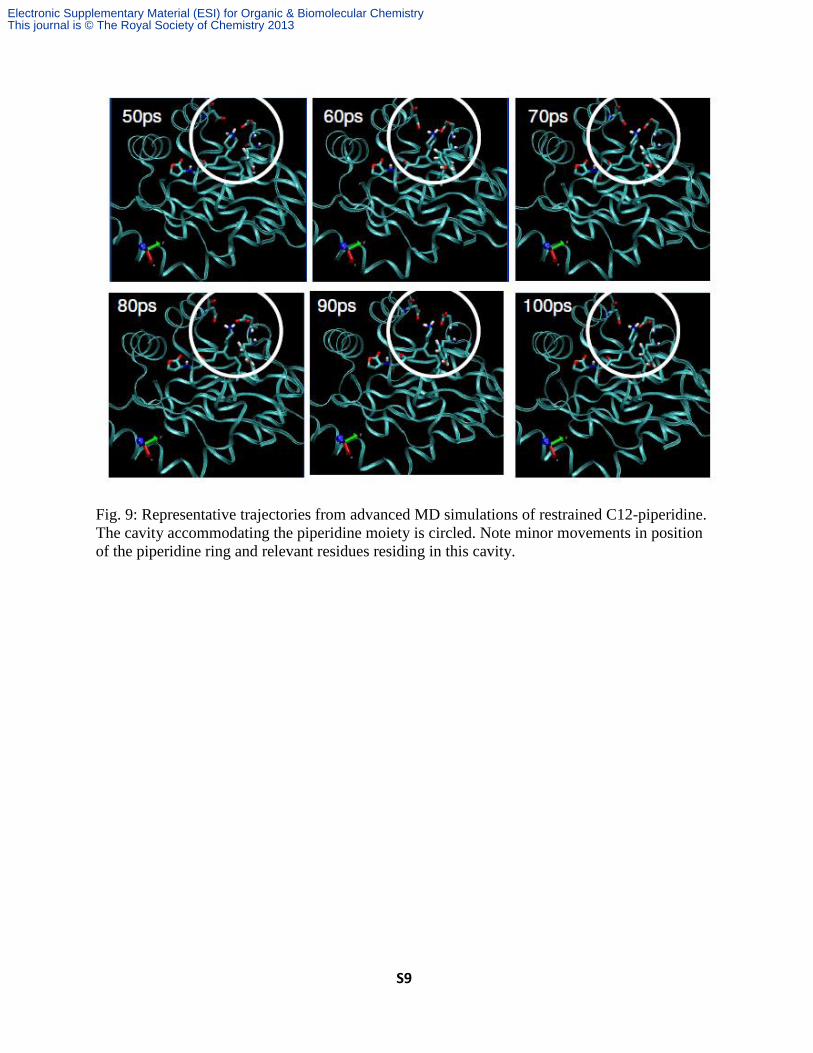
Figure 9: Representative trajectories from advanced MD simulations of restrained C12-
piperidine S9
1H NMR and
13C NMR spectra for compounds 1-2, 4-8 S10-S18
Figure 10: Chiral-HPLC chromatogram of 7A and 7B S19
Electronic Supplementary Material (ESI) for Organic & Biomolecular ChemistryThis journal is © The Royal Society of Chemistry 2013
S2
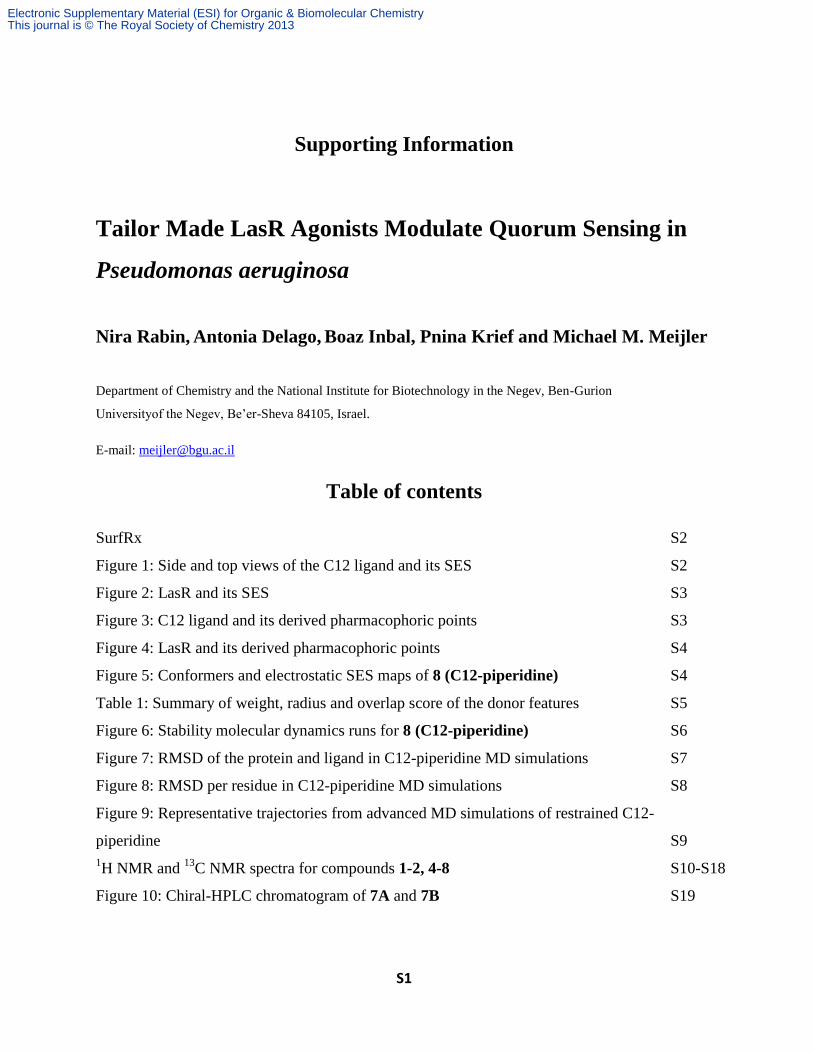
SurfRx
We used SurfRx, developed by InSilicore Ltd., to retrieve pharmacophoric points from the
LasR-C12 complex. First, we assigned atomic charges to the ligand and to the protein using
MMFF94 and CHARMM force fields, respectively. We then derived Solvent Excluded Surface
(SES) around each of the structures. Electrostatic potentials were calculated using Distance
Dependent Dielectric (DDD) model for the ligand and Poisson-Boltzmann (PB) distribution
model for the target, respectively. These potentials were separately mapped on their
corresponding SES surfaces.
Fig. 1: Side and top views of the C12 ligand from PDB structure 3IX3 (left) and its SES colored
by electrostatic potentials.
Electronic Supplementary Material (ESI) for Organic & Biomolecular ChemistryThis journal is © The Royal Society of Chemistry 2013
S3
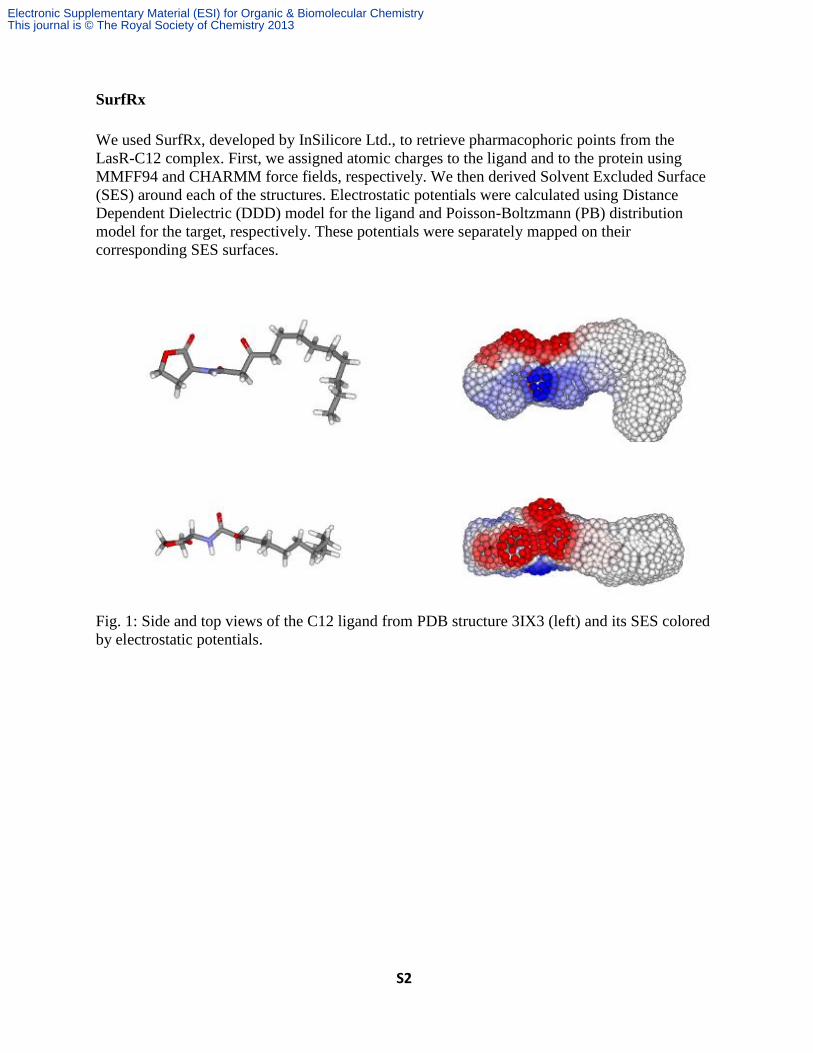
Fig. 2: LasR and its SES colored by electrostatic potentials.
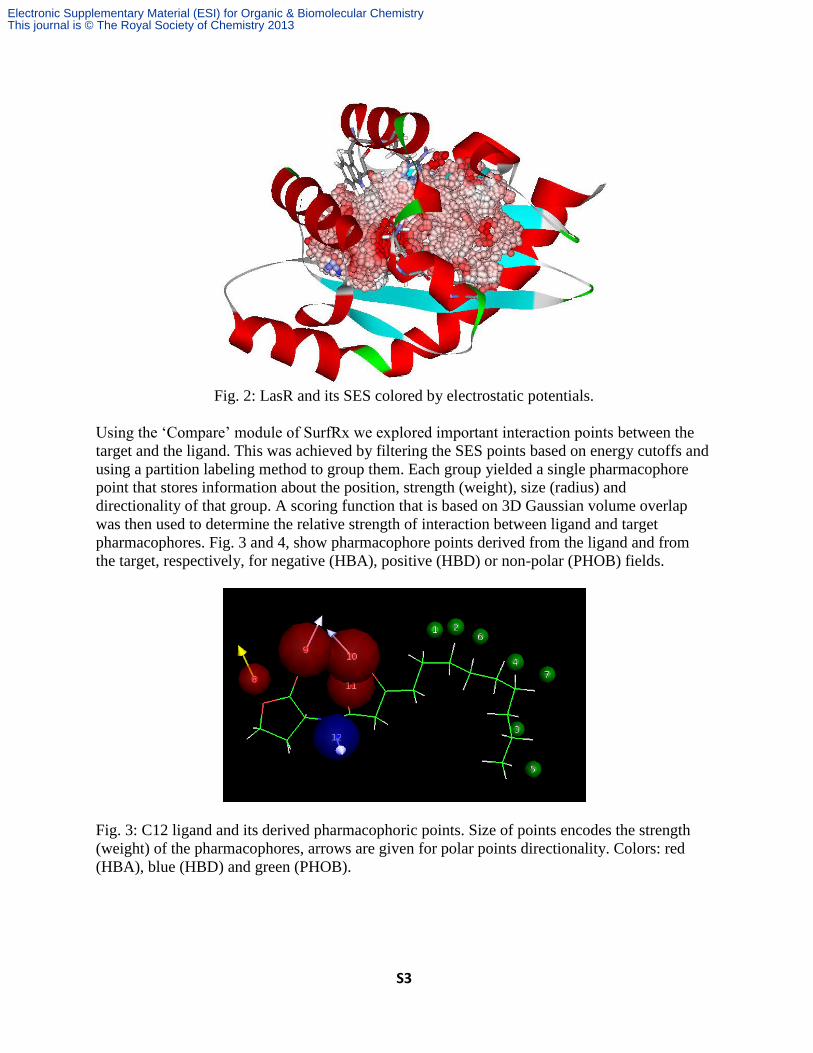
Using the ‘Compare’ module of SurfRx we explored important interaction points between the
target and the ligand. This was achieved by filtering the SES points based on energy cutoffs and
using a partition labeling method to group them. Each group yielded a single pharmacophore
point that stores information about the position, strength (weight), size (radius) and
directionality of that group. A scoring function that is based on 3D Gaussian volume overlap
was then used to determine the relative strength of interaction between ligand and target
pharmacophores. Fig. 3 and 4, show pharmacophore points derived from the ligand and from
the target, respectively, for negative (HBA), positive (HBD) or non-polar (PHOB) fields.
Fig. 3: C12 ligand and its derived pharmacophoric points. Size of points encodes the strength
(weight) of the pharmacophores, arrows are given for polar points directionality. Colors: red
(HBA), blue (HBD) and green (PHOB).
Electronic Supplementary Material (ESI) for Organic & Biomolecular ChemistryThis journal is © The Royal Society of Chemistry 2013
S4
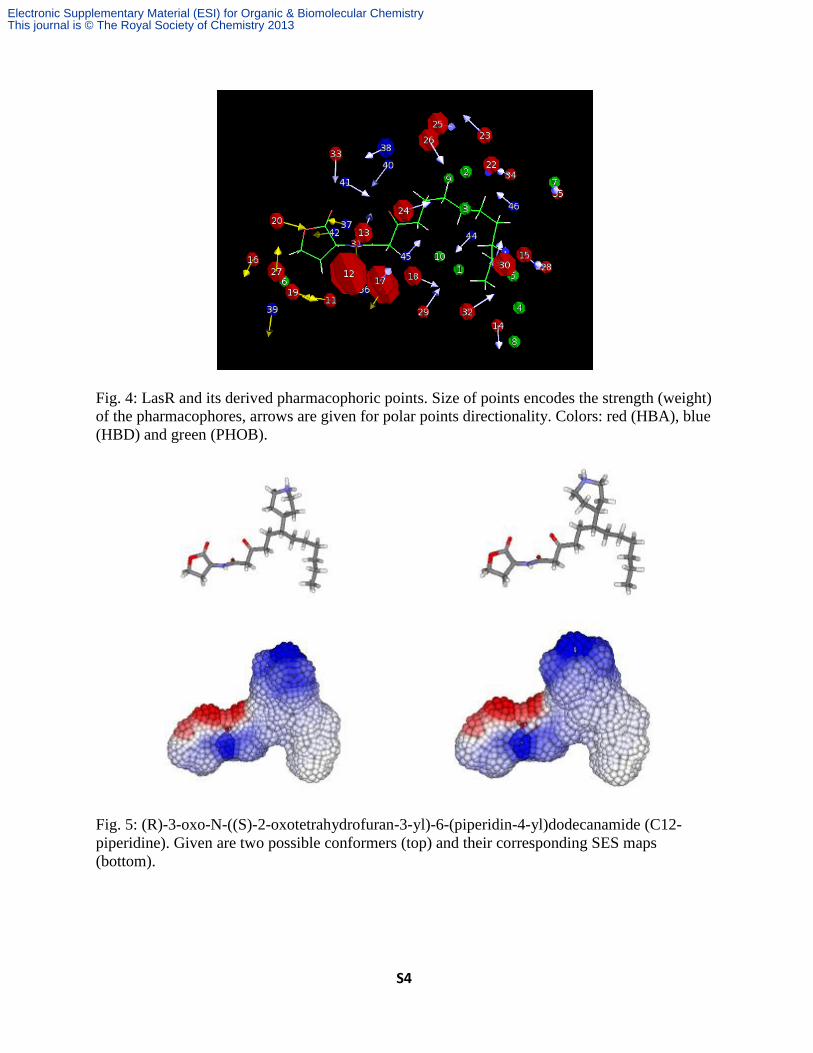
Fig. 4: LasR and its derived pharmacophoric points. Size of points encodes the strength (weight)
of the pharmacophores, arrows are given for polar points directionality. Colors: red (HBA), blue
(HBD) and green (PHOB).
Fig. 5: (R)-3-oxo-N-((S)-2-oxotetrahydrofuran-3-yl)-6-(piperidin-4-yl)dodecanamide (C12-
piperidine). Given are two possible conformers (top) and their corresponding SES maps
(bottom).
Electronic Supplementary Material (ESI) for Organic & Biomolecular ChemistryThis journal is © The Royal Society of Chemistry 2013
S5
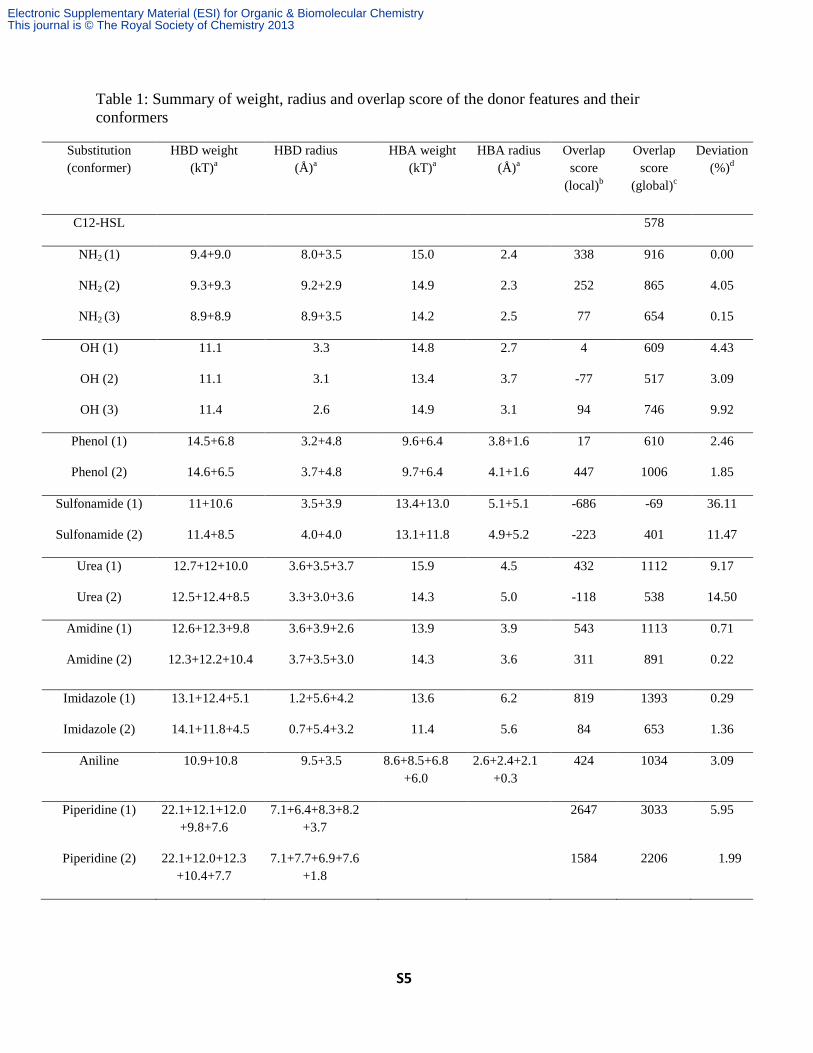
Table 1: Summary of weight, radius and overlap score of the donor features and their
conformers
Substitution
(conformer)
HBD weight
(kT)a
HBD radius
(Å)a
HBA weight
(kT)a
HBA radius
(Å)a
Overlap
score
(local)b
Overlap
score
(global)c
Deviation
(%)d
C12-HSL 578
NH2 (1) 9.4+9.0 8.0+3.5 15.0 2.4 338 916 0.00
NH2 (2) 9.3+9.3 9.2+2.9 14.9 2.3 252 865 4.05
NH2 (3) 8.9+8.9 8.9+3.5 14.2 2.5 77 654 0.15
OH (1) 11.1 3.3 14.8 2.7 4 609 4.43
OH (2) 11.1 3.1 13.4 3.7 -77 517 3.09
OH (3) 11.4 2.6 14.9 3.1 94 746 9.92
Phenol (1) 14.5+6.8 3.2+4.8 9.6+6.4 3.8+1.6 17 610 2.46
Phenol (2) 14.6+6.5 3.7+4.8 9.7+6.4 4.1+1.6 447 1006 1.85
Sulfonamide (1) 11+10.6 3.5+3.9 13.4+13.0 5.1+5.1 -686 -69 36.11
Sulfonamide (2) 11.4+8.5 4.0+4.0 13.1+11.8 4.9+5.2 -223 401 11.47
Urea (1) 12.7+12+10.0 3.6+3.5+3.7 15.9 4.5 432 1112 9.17
Urea (2) 12.5+12.4+8.5 3.3+3.0+3.6 14.3 5.0 -118 538 14.50
Amidine (1) 12.6+12.3+9.8 3.6+3.9+2.6 13.9 3.9 543 1113 0.71
Amidine (2) 12.3+12.2+10.4 3.7+3.5+3.0 14.3 3.6 311 891 0.22
Imidazole (1) 13.1+12.4+5.1 1.2+5.6+4.2 13.6 6.2 819 1393 0.29
Imidazole (2) 14.1+11.8+4.5 0.7+5.4+3.2 11.4 5.6 84 653 1.36
Aniline 10.9+10.8 9.5+3.5 8.6+8.5+6.8
+6.0
2.6+2.4+2.1
+0.3
424 1034 3.09
Piperidine (1) 22.1+12.1+12.0
+9.8+7.6
7.1+6.4+8.3+8.2
+3.7
2647 3033 5.95
Piperidine (2) 22.1+12.0+12.3
+10.4+7.7
7.1+7.7+6.9+7.6
+1.8
1584 2206 1.99
Electronic Supplementary Material (ESI) for Organic & Biomolecular ChemistryThis journal is © The Royal Society of Chemistry 2013
S6
a - Multiple pharmacophore occurrences are separated by a plus sign. The order of features is
kept between the weight and radius columns. b - Local overlap score refers to the summation of strong individual overlap scores (|x| >10)
resulting from interactions of pharmacophores corresponding to the ligand substituent part c - Global overlap score refers to the summation of strong individual overlap scores (|x| >10)
resulting from interactions of all ligand pharmacophores d - Deviation is the % change of global score from the sum of local score and score of parent
C12 compound
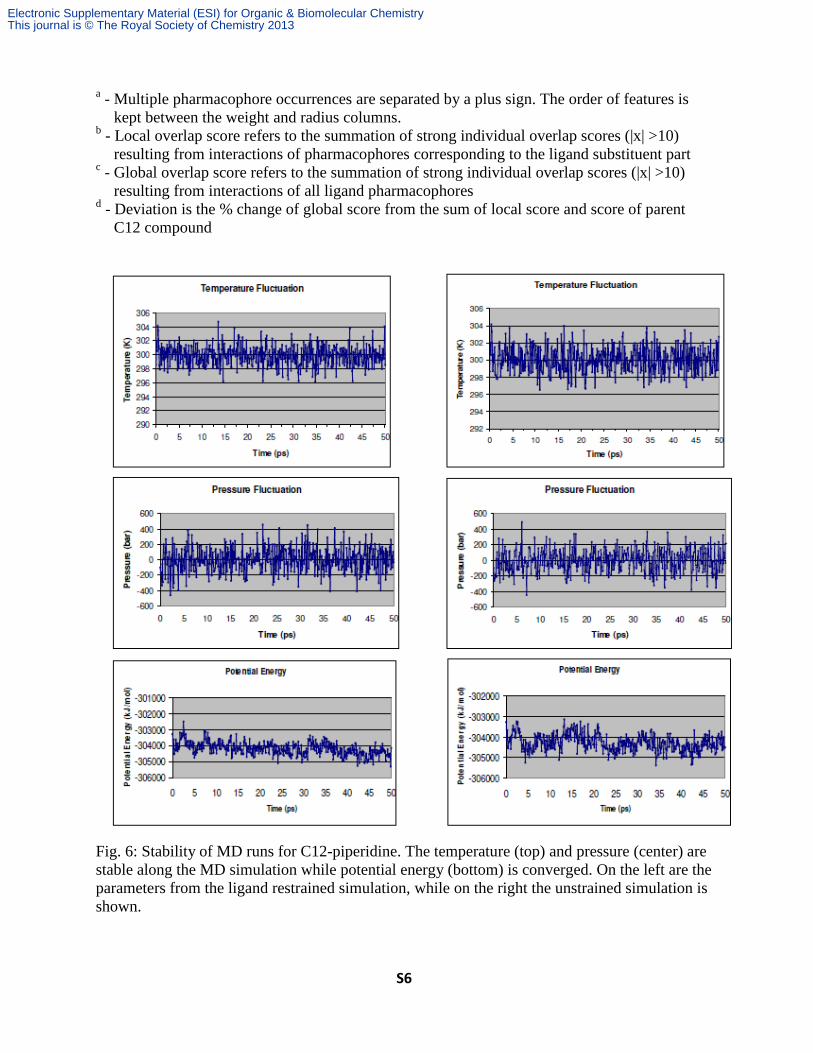
Fig. 6: Stability of MD runs for C12-piperidine. The temperature (top) and pressure (center) are
stable along the MD simulation while potential energy (bottom) is converged. On the left are the
parameters from the ligand restrained simulation, while on the right the unstrained simulation is
shown.
Electronic Supplementary Material (ESI) for Organic & Biomolecular ChemistryThis journal is © The Royal Society of Chemistry 2013
S7
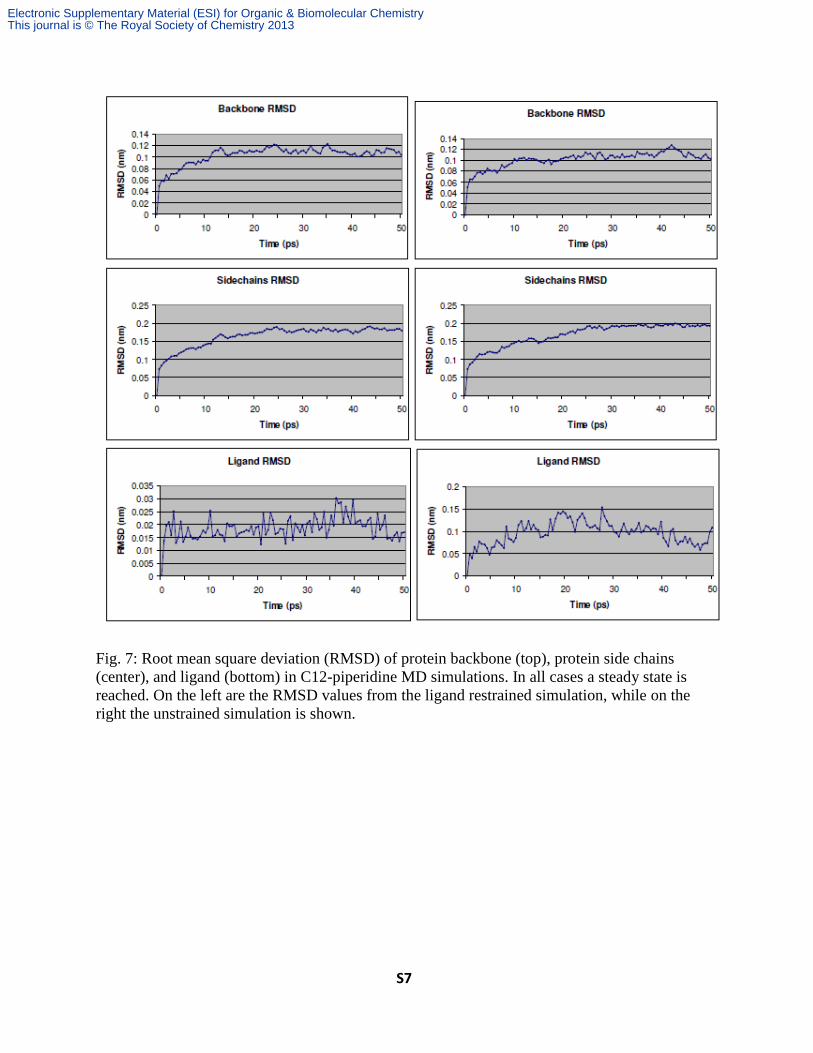
Fig. 7: Root mean square deviation (RMSD) of protein backbone (top), protein side chains
(center), and ligand (bottom) in C12-piperidine MD simulations. In all cases a steady state is
reached. On the left are the RMSD values from the ligand restrained simulation, while on the
right the unstrained simulation is shown.
Electronic Supplementary Material (ESI) for Organic & Biomolecular ChemistryThis journal is © The Royal Society of Chemistry 2013
S8
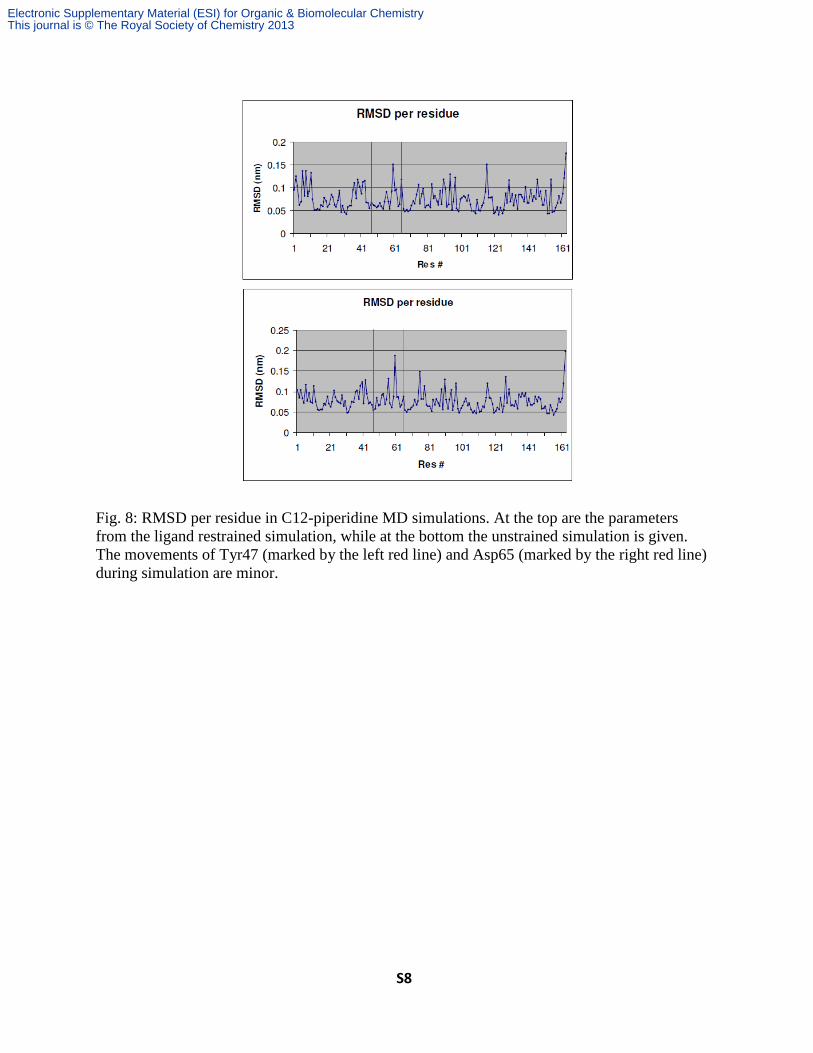
Fig. 8: RMSD per residue in C12-piperidine MD simulations. At the top are the parameters
from the ligand restrained simulation, while at the bottom the unstrained simulation is given.
The movements of Tyr47 (marked by the left red line) and Asp65 (marked by the right red line)
during simulation are minor.
Electronic Supplementary Material (ESI) for Organic & Biomolecular ChemistryThis journal is © The Royal Society of Chemistry 2013
S9
Fig. 9: Representative trajectories from advanced MD simulations of restrained C12-piperidine.
The cavity accommodating the piperidine moiety is circled. Note minor movements in position
of the piperidine ring and relevant residues residing in this cavity.
Electronic Supplementary Material (ESI) for Organic & Biomolecular ChemistryThis journal is © The Royal Society of Chemistry 2013
S10
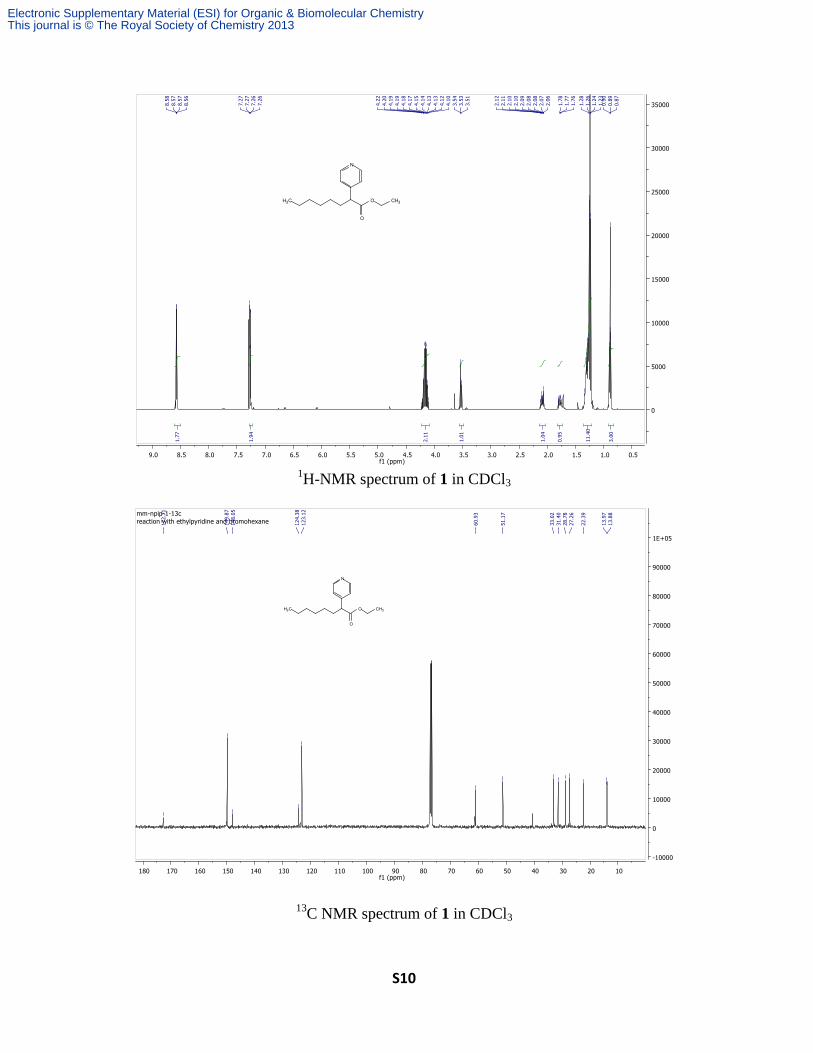
1H-NMR spectrum of 1 in CDCl3
13C NMR spectrum of 1 in CDCl3
Electronic Supplementary Material (ESI) for Organic & Biomolecular ChemistryThis journal is © The Royal Society of Chemistry 2013
S11
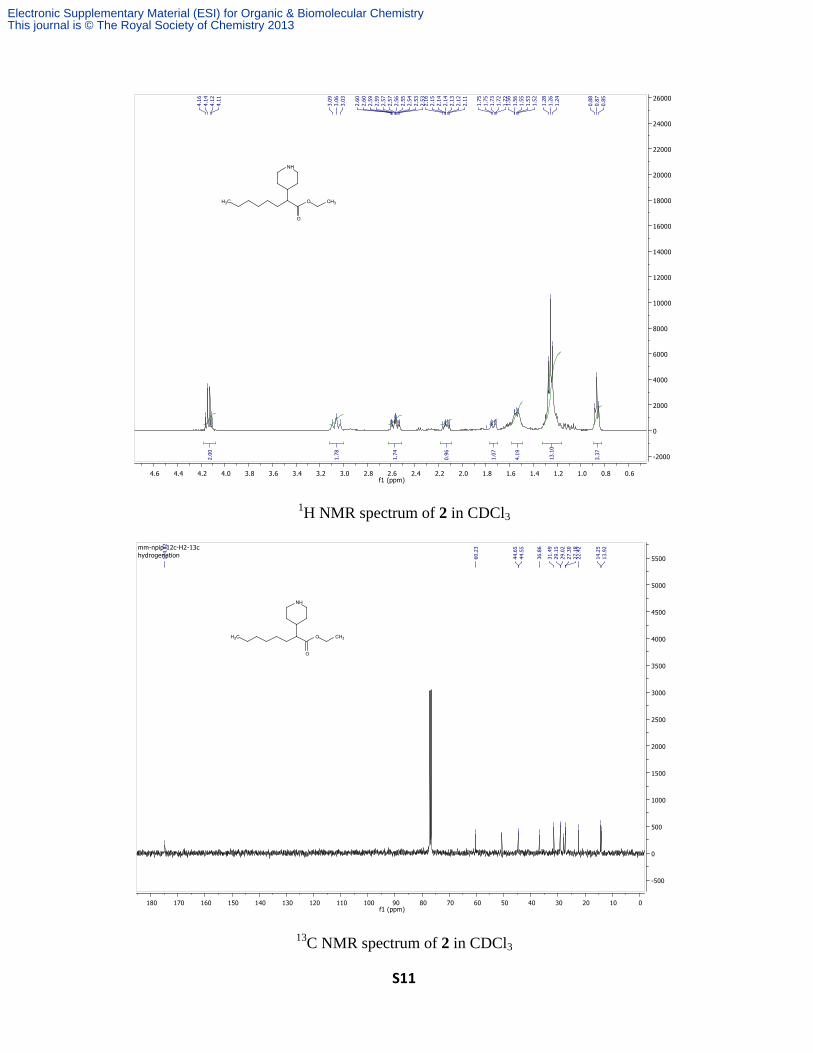
1H NMR spectrum of 2 in CDCl3
13C NMR spectrum of 2 in CDCl3
Electronic Supplementary Material (ESI) for Organic & Biomolecular ChemistryThis journal is © The Royal Society of Chemistry 2013
S12
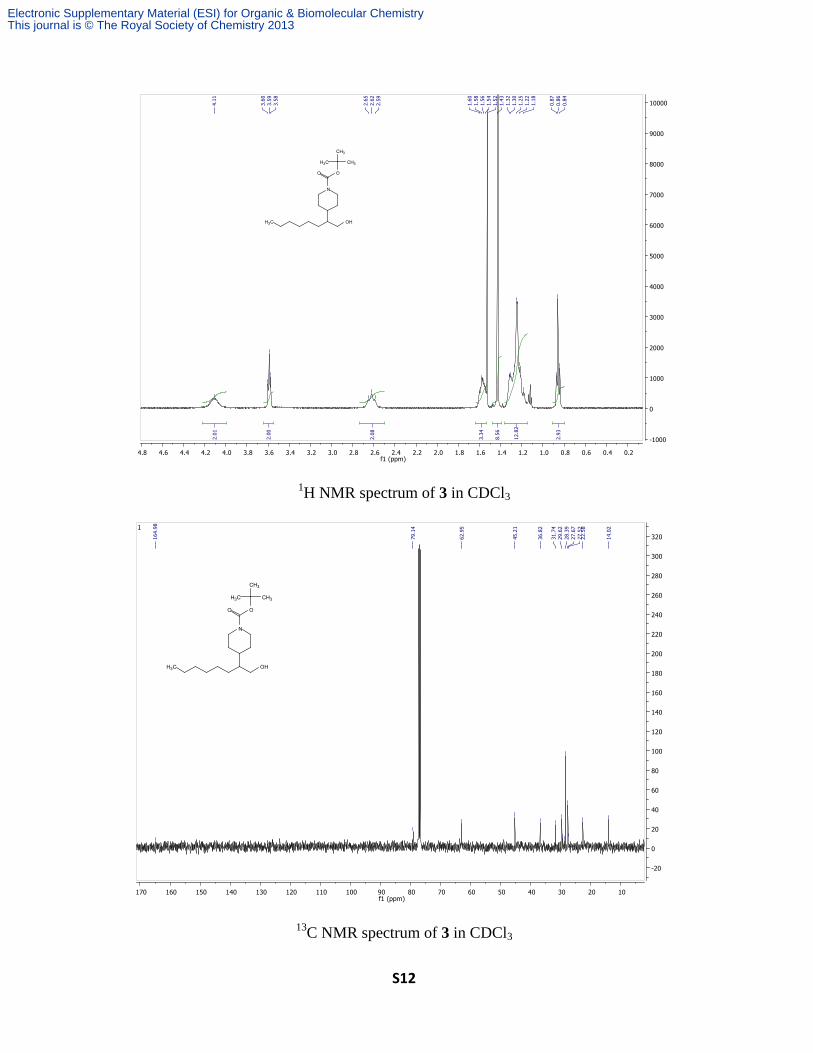
1H NMR spectrum of 3 in CDCl3
13C NMR spectrum of 3 in CDCl3
Electronic Supplementary Material (ESI) for Organic & Biomolecular ChemistryThis journal is © The Royal Society of Chemistry 2013
S13
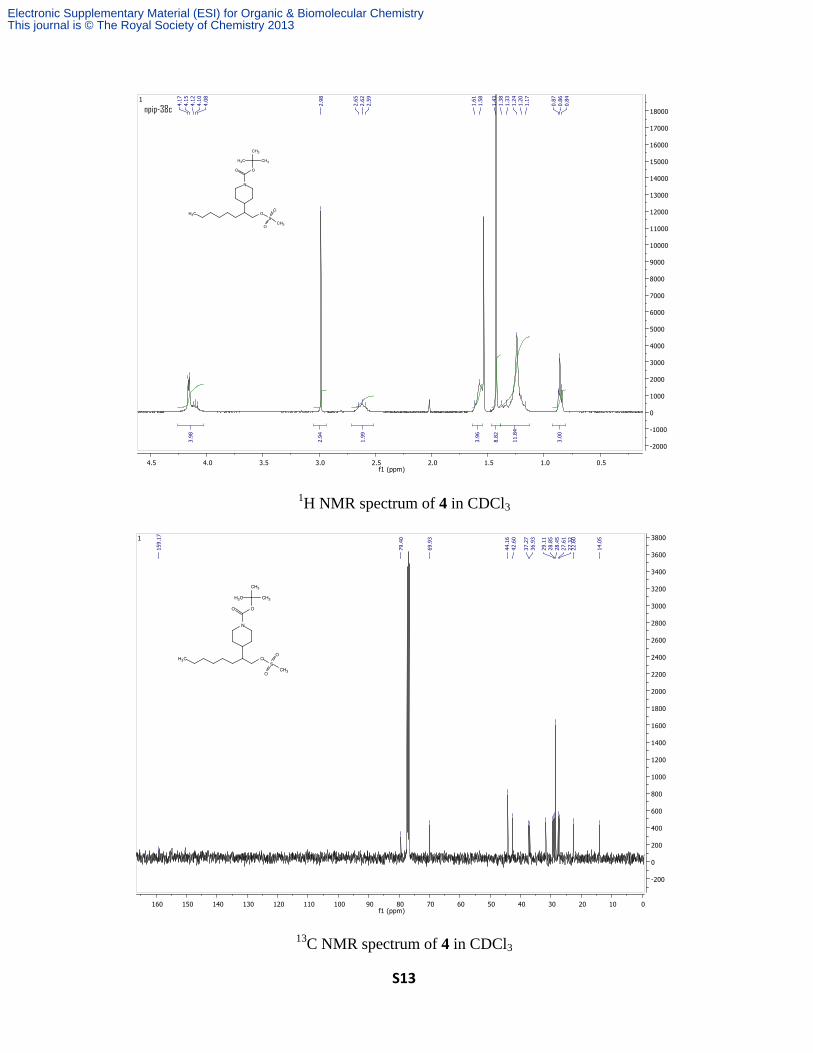
1H NMR spectrum of 4 in CDCl3
13C NMR spectrum of 4 in CDCl3
Electronic Supplementary Material (ESI) for Organic & Biomolecular ChemistryThis journal is © The Royal Society of Chemistry 2013
S14
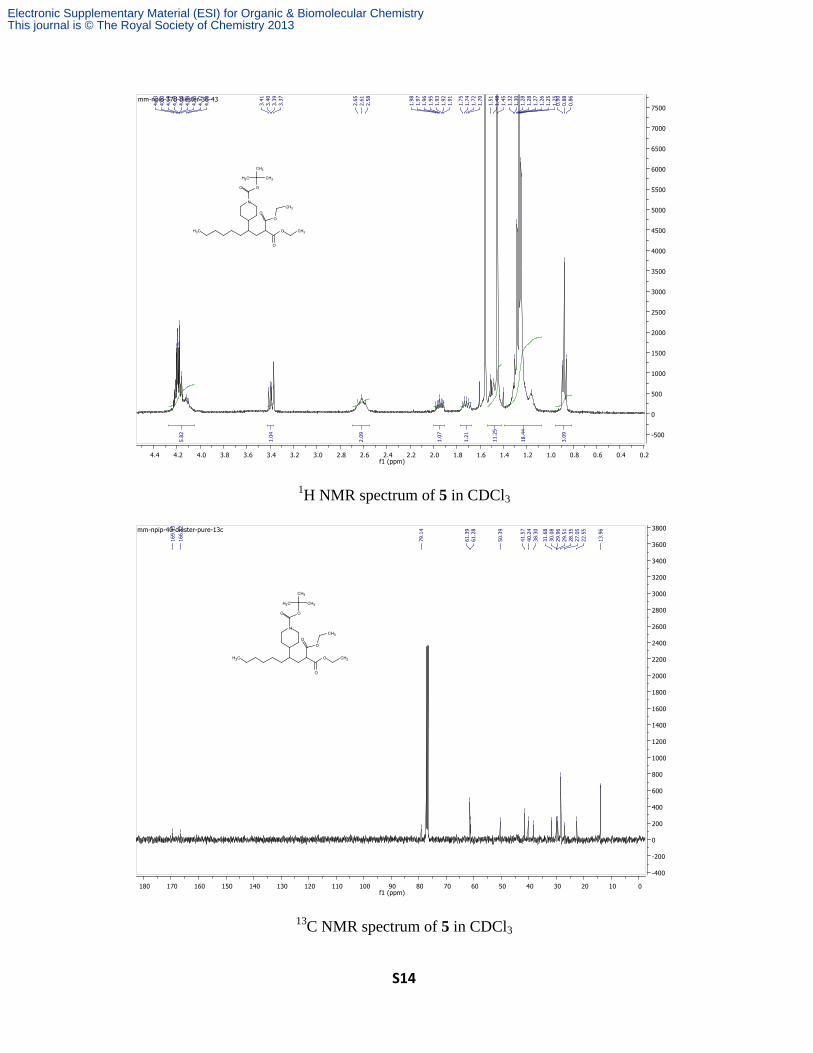
1H NMR spectrum of 5 in CDCl3
13C NMR spectrum of 5 in CDCl3
Electronic Supplementary Material (ESI) for Organic & Biomolecular ChemistryThis journal is © The Royal Society of Chemistry 2013
S15
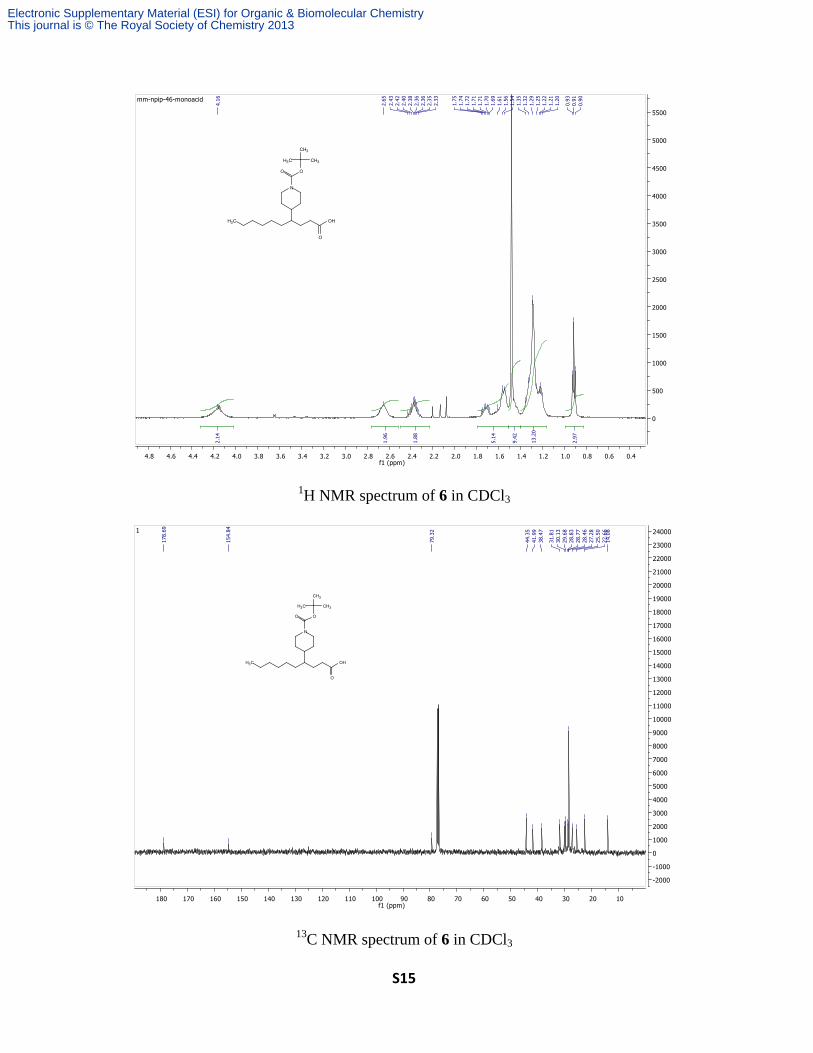
1H NMR spectrum of 6 in CDCl3
13C NMR spectrum of 6 in CDCl3
Electronic Supplementary Material (ESI) for Organic & Biomolecular ChemistryThis journal is © The Royal Society of Chemistry 2013
S16
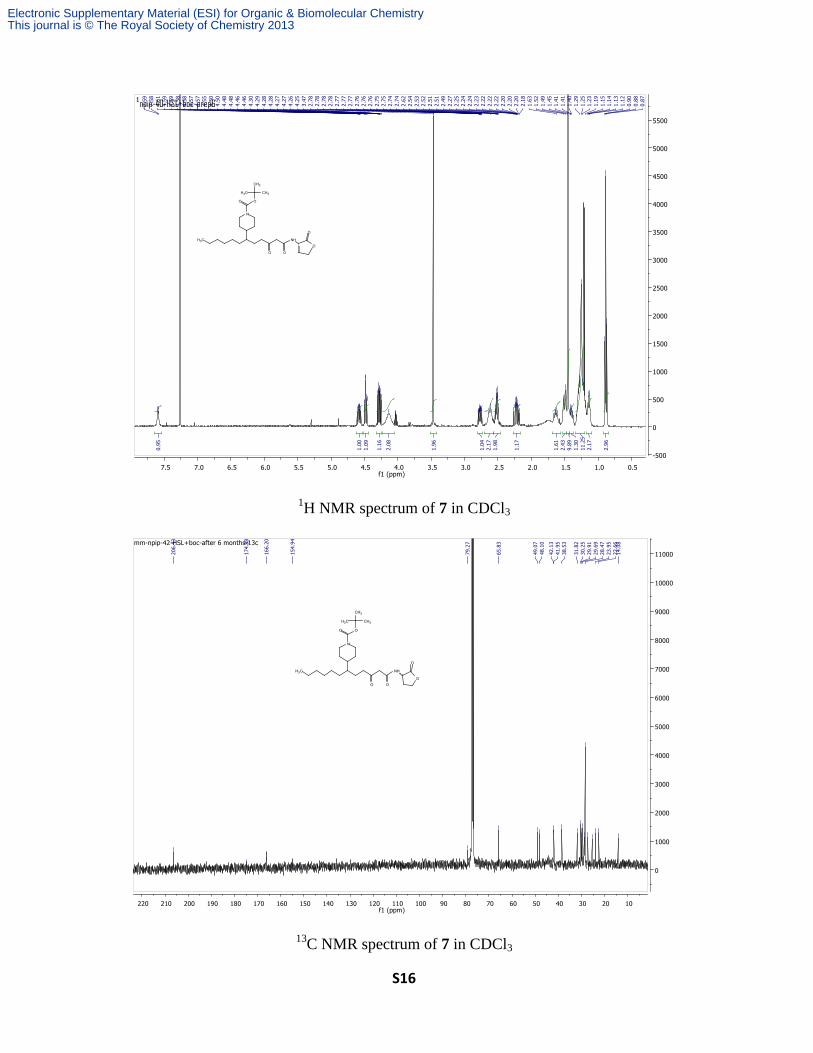
1H NMR spectrum of 7 in CDCl3
13C NMR spectrum of 7 in CDCl3
Electronic Supplementary Material (ESI) for Organic & Biomolecular ChemistryThis journal is © The Royal Society of Chemistry 2013
S17
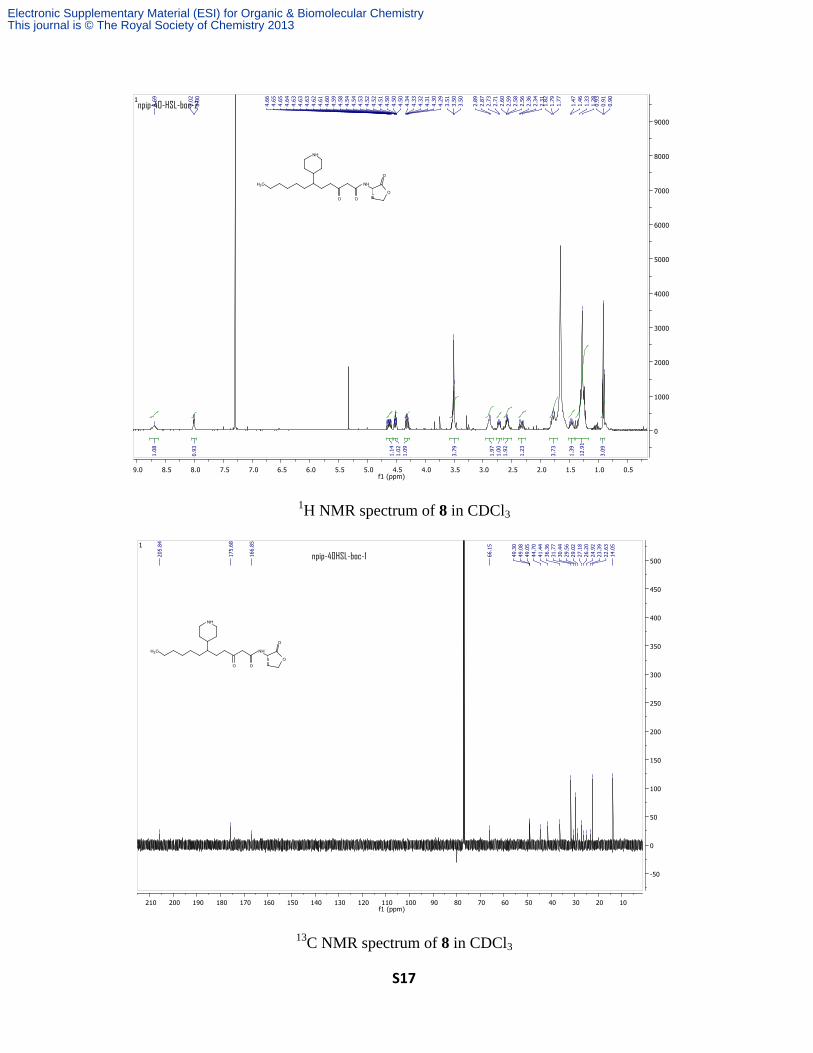
1H NMR spectrum of 8 in CDCl3
13C NMR spectrum of 8 in CDCl3
Electronic Supplementary Material (ESI) for Organic & Biomolecular ChemistryThis journal is © The Royal Society of Chemistry 2013
S18
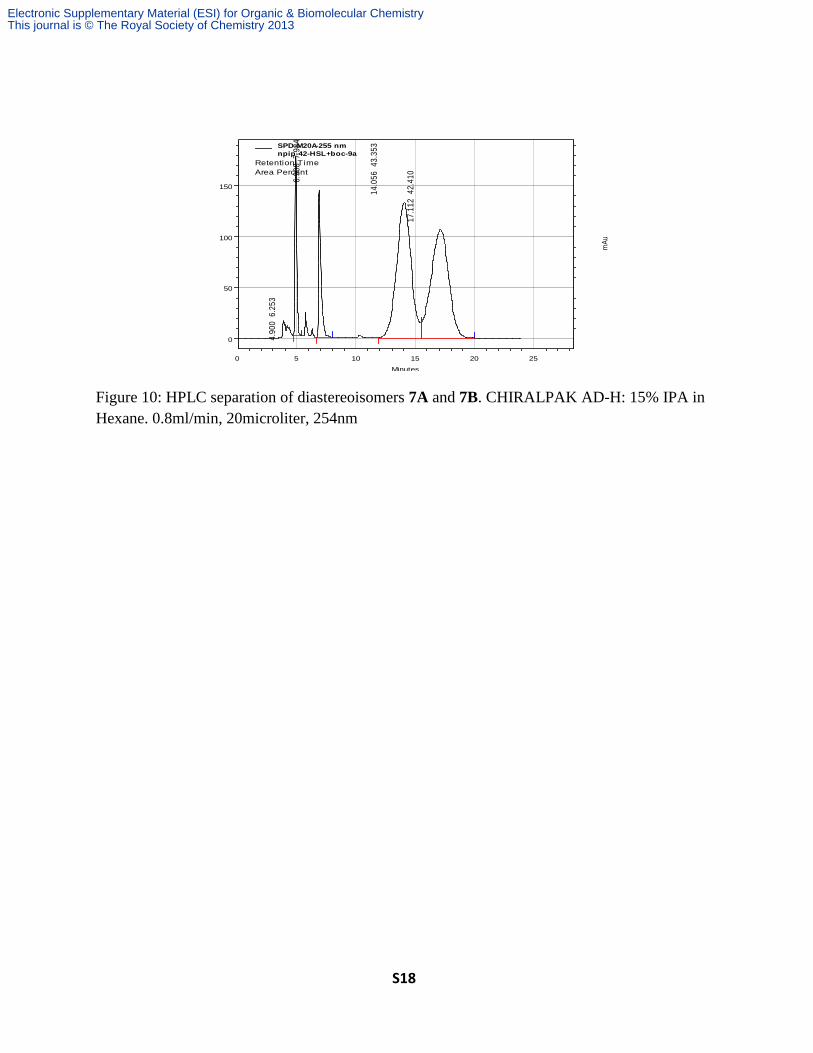
Figure 10: HPLC separation of diastereoisomers 7A and 7B. CHIRALPAK AD-H: 15% IPA in
Hexane. 0.8ml/min, 20microliter, 254nm
Minutes
0 5 10 15 20 25
mA
u
0
50
100
150
mA
u
0
50
100
150
4.9
00
6.2
53
6.9
08
7.9
84
14
.05
6
43
.35
3
17
.11
2
42
.41
0
SPD-M20A-255 nm
npip-42-HSL+boc-9a
Retention Time
Area Percent
Electronic Supplementary Material (ESI) for Organic & Biomolecular ChemistryThis journal is © The Royal Society of Chemistry 2013