tactical level planning in float glass manufacturing …taskin/pdf/float_tactical.pdftactical level...
TRANSCRIPT
Tactical Level Planning in Float Glass Manufacturingwith Co-Production, Random Yields and Substitutable
ProductsZ. Caner Taskın
Department of Industrial and Systems Engineering, University of Florida, Gainesville, FL 32611, [email protected]
A. Tamer UnalDepartment of Industrial Engineering, Bogazici University, 80815 Bebek, Istanbul, Turkey
We investigate tactical level planning problems in float glass manufacturing. Float glass
manufacturing is a process that has some unique properties such as uninterruptible produc-
tion, random yields, partially controllable co-production compositions, complex relationships
in sequencing of products, and substitutable products. Furthermore, changeover times and
costs are very high, and production speed depends significantly on the product mix. These
characteristics render measurement and management of the production capacity difficult.
The motivation for this study is a real life problem faced at Trakya Cam in Turkey. Trakya
Cam has multiple geographically separated production facilities. Since transportation of
glass is expensive, logistics costs are high. In this paper, we consider multi-site aggregate
planning, and color campaign duration and product mix planning. We develop a decision
support system based on several mixed-integer linear programming models in which pro-
duction and transportation decisions are made simultaneously. The system has been fully
implemented, and has been in use at Trakya Cam since 2005.
1 Introduction
In this paper, we study tactical level production planning problems in float glass manufac-
turing. There are some major characteristics of float glass production that are not commonly
observed in other production environments:
• The process is continuous, and production cannot be interrupted.
• Yields are random due to random errors scattered on glass surface, resulting from
processes that are not fully controllable.
• The process is of co-production type, meaning that several products must be produced
simultaneously by the nature of the process.
• Products are substitutable in the sense that demand for a lower quality product can
be satisfied by a higher quality product.
1
The motivation of this study is a real life problem faced at Trakya Cam, Turkey, which
is the largest flat glass manufacturer in Turkey. It is also among the top five flat glass
manufacturers in Europe and top ten in the world [9]. Float glass is produced from raw
materials such as sand, soda ash and limestone, and is used directly in industries such as
the construction industry. Furthermore, it is the main input for other flat glass processing
industries including automotive glass, processed glass, mirror and laminated glass. We refer
the reader to [9] and [22] for a detailed description of Trakya Cam’s supply chain.
One of the major issues in Trakya Cam has been assessing the interaction between sales
and marketing functions with the production constraints. For example, receipt of an order
for a significant amount of Product A eventually results in an increase in production of
Product A. However, Product A cannot be produced alone without accompanying Products
B and/or C (which can only partially be controlled). Therefore, increase in production of
Product A results in an increase in production of Products B and/or C as well. However,
since the production increase in Product B and C cannot be adequately foreseen by the sales
staff without an accurate production plan, inventory accumulated for Products B and C in
an uncontrolled manner are sold by offering promotions, which result in a decrease in profits.
Trakya Cam currently has four facilities (Luleburgaz, Mersin, Yenisehir, Bulgaria) that
can produce float glass at different rates. These facilities are geographically located in
relatively distant locations, and transportation costs are significant. Unique characteristics
of float glass manufacturing make measurement of “capacity” difficult, and the possible
amount of production depends significantly on the product mix. Therefore planning staff
cannot define exact capacities of facilities and analyze various trade-offs in capacity planning.
Simple rules based on past experience are used for allocating customer demands to facilities.
Since transportation costs are not explicitly considered during production planning, logistics
costs are high.
In this paper, we describe a mathematical programming based decision support system for
solving central planning problems faced in a multi-site float glass manufacturing environment.
There are two specific problems we consider:
• Campaign Duration and Product Mix Planning: Colored glass is produced in one or
two campaigns per year due to high changeover costs. Therefore, campaign planning
is important for inventory management of colored glass. The timing of the campaigns,
and the production lines used in campaigns are determined by the management. We
describe a mixed integer programming model for determining the optimal duration and
product mix of campaigns in Section 4.4.
• Multi-Site Aggregate Planning: Obtaining a production plan, which is feasible under
unique properties of float glass manufacturing, and which minimizes transportation
2
costs is a difficult problem. Production planners make certain simplifications, and
disregard some constraints in order to keep the problem at a manageable size. These
simplifications result in infeasibility in the resulting plan, as well as high logistics costs.
We describe a multi-objective mixed integer programming model that determines an
optimal production plan considering production capabilities, inventory and backlog
costs along with transportation costs in Section 4.5.
The system we describe in this paper has been fully implemented and deployed at Trakya
Cam. It helps decision making in sales, production and logistics planning. In our models,
unique production characteristics of float glass manufacturing are modeled as constraints.
Hence, production plans generated are applicable in the production environment. An output
of the model related to sales planning is identification of demand that cannot be satisfied
by available production capacity. Similarly, production capacity not allocated by existing
demand forecast is determined and is used for guiding sales. The system also considers
logistics issues by allocating customer demand to production facilities in such a way that
transportation costs are minimized. In summary, the main purpose of this study is to
develop a mixed integer linear programming based decision support system that unifies
sales, planning and logistics decisions.
The rest of the paper is organized as follows: We first provide a review of the related
literature in Section 2. We then briefly overview the float glass production, discuss planning
issues, and state some simplifying assumptions in Section 3. We develop mixed-integer
linear programming models for campaign duration and product mix planning, and multi-site
aggregate planning in Section 4. Finally, we compare the new system with the previously
employed spreadsheet-based manual planning process in Section 5, and discuss the results
that were obtained.
2 Literature Review
Aggregate production planning problems in discrete manufacturing industries have been
studied extensively. Nam and Rasaratnam [20] survey several approaches to the problem,
and Leachman and Carmon [14] investigate the effect of different mathematical formula-
tions and solution techniques. Basic models assume that demand, capacity requirement and
production yields are deterministic, and aim to find an optimal way of utilizing limited ca-
pacity to fulfill anticipated demand [3, 4, 19]. An extension of the basic models accounts
for multiple objectives such as minimization of late orders and maximization of profitability
[7, 10, 20, 24]. On the other hand, planning problems in process industries such as float
3
glass manufacturing has received relatively less attention. Crama et al. [8] discuss the char-
acteristics that separate process industries from discrete manufacturing industries. They
also survey several approaches to production planning and flow control in process industries,
focusing on the concept of “recipe,” which extends the classical Bill of Materials used in
discrete manufacturing. Liu and Sherali [17] investigate a coal blending problem, in which
the aim is to find an optimal blending plan considering coal specifications, power plant re-
quirements, blending facility capacities and associated costs. They present a mixed integer
programming formulation of the problem, and propose a heuristic solution procedure. Pend-
harkar [23] describe a fuzzy linear program approach to a planning problem in coal mines,
and Bitran and Gilbert [5] present an application in semiconductor manufacturing.
Co-production and random yields are commonly observed in process industries. Oner and
Bilgic [21] analyze a variant of the economic lot sizing problem under co-production. Bitran
and Leong [6] propose a dynamic programming algorithm for solving a planning problem,
and investigate approximate solution techniques. Joly et al. [13] consider a planning problem
in petroleum refineries, where several products are produced simultaneously. They model the
problem as a mixed-integer nonlinear program, assuming that types and ratios of co-products
are known in advance. Bitran and Gilbert [5] describe co-production issues in semiconductor
manufacturing. Semiconductor manufacturing involves a highly complex set of processes,
some of which cannot be kept under precise control, resulting in co-production of products
having several quality levels. On the contrary to [13], the authors of [5] model co-production
rates as (uncontrollable) random variables, which follow a probability distribution. Unlike
these applications, the co-production structure in float glass manufacturing allows for the
type and ratio of products produced simultaneously to be controlled within certain bounds.
Multi-site production planning problems are also well-studied in the literature. Leung
et al. [15] present a stochastic optimization approach for the multi-site planning problem
faced at a lingerie producer. Levis and Papageorgiou [16] investigate an international phar-
maceutical company. Their model accounts for different cost items and tax laws associated
with operations in different countries in order to maximize overall profit. For supply chains
in which production sites are geographically diverse, transportation costs become significant
[12]. In such cases, Guinet [11] shows that making production and transportation decisions
simultaneously gives better results than making those decisions sequentially.
There also exist studies directly addressing problems in glass manufacturing. Al-Khayyal
et al. [1] consider operational issues in glass manufacturing, and provide a decomposition
based solution procedure to determine glass cutting decisions and stacker scheduling. Liu and
Tu [18] consider the impact of inventory space limitations to production planning decisions,
rather than capacity limitations. The problem mostly applies to glass processing plants, not
4

glass manufacturing plants. Scheduling problem in glass processing plants is also investigated
in [2].
3 Problem Definition
In this section we describe the planning problem in float glass manufacturing.
3.1 Float Glass Definitions
• Float: Float is a process for producing glass in which raw materials such as sand and
soda ash are liquefied, and the solution floats over liquid tin to gain a smooth surface.
• Coating: Coating is a chemical process in which one surface of float glass is covered
with very thin layers of metal in order to enhance visual and thermal properties.
• Product groups: Product groups are identified by color, thickness and coating type
of glass.
• Products: Products within a product group are identified by size and quality of glass.
The three main size groups are jumbo size, machine size and split size. An example
product is fume colored, 4 mm, coated, jumbo size, K1 quality glass [22].
3.2 Process Issues in Float Glass Production
Property 1. Float glass production is an uninterruptible process.
Float glass production continues 24 hours a day, 365 days a year. It is not possible to stop
the glass furnace that melts raw materials to produce liquid glass. Production has to continue
throughout the lifetime of the furnace, which is typically over 10 years. Production cannot
be interrupted even if process quality is not under control, in which case nonconforming glass
is broken and scrapped at the end of the production line.
Property 2. There exist parallel production lines with different production capabilities.
Property 3. Changeover costs associated with color changes are very high.
Typical color changeover times are 3-7 days. During color changeover, the entire produc-
tion is nonconforming and is scrapped.
Property 4. Coated glass can only be produced during daytime.
Coating is a chemical process that requires daylight, and hence can only be performed
during daytime. Since production cannot be stopped, glass with the same color and thickness
is produced during nighttime.
5
Property 5. Thickness changeover can only be performed gradually.
Since glass production is a continuous process, thickness changeover has to be performed
gradually. In other words, if glass with two different thickness values is to be produced
successively, glass with all thickness values in between needs to be produced as well. Fur-
thermore, in order to allow for stabilization of the process, thickness has to be kept constant
at intermediate thickness levels for some minimum duration. Thickness changeover times
are on the order of hours.
Property 6. Multiple products have to be produced simultaneously due to random errors
scattered on glass surface.
Float glass production involves complex physical and chemical processes, some of which
are not fully controllable. This results in random errors scattered throughout glass surface.
There are several types of error, ranging from tiny visual disruptions to serious errors that
necessitate scrapping of the glass produced. Since float glass is used in many industries,
some errors that are unacceptable for some applications can be disregarded for some other
applications. For example, allowances for mirror and automotive glass are much tighter than
those for window glass, and glass to be further processed for use in ovens. The diversity in
tolerances results in definition of several quality groups based on the number and types of
errors allowed.
Glass surface is continuously observed by an optical laser system located before cutting
machines. Coordinates and types of nonconformities are determined instantly, and processed
by a software system controlling cutting machines. When a nonconformity is detected,
cutting policy is changed and glass is collected as lower quality and/or in smaller size. This
is how co-production is encountered in float glass production: non-controllable errors in
process result in simultaneous production of several products. Distribution and density of
random errors determine the maximum possible amount of production for each quality and
size group.
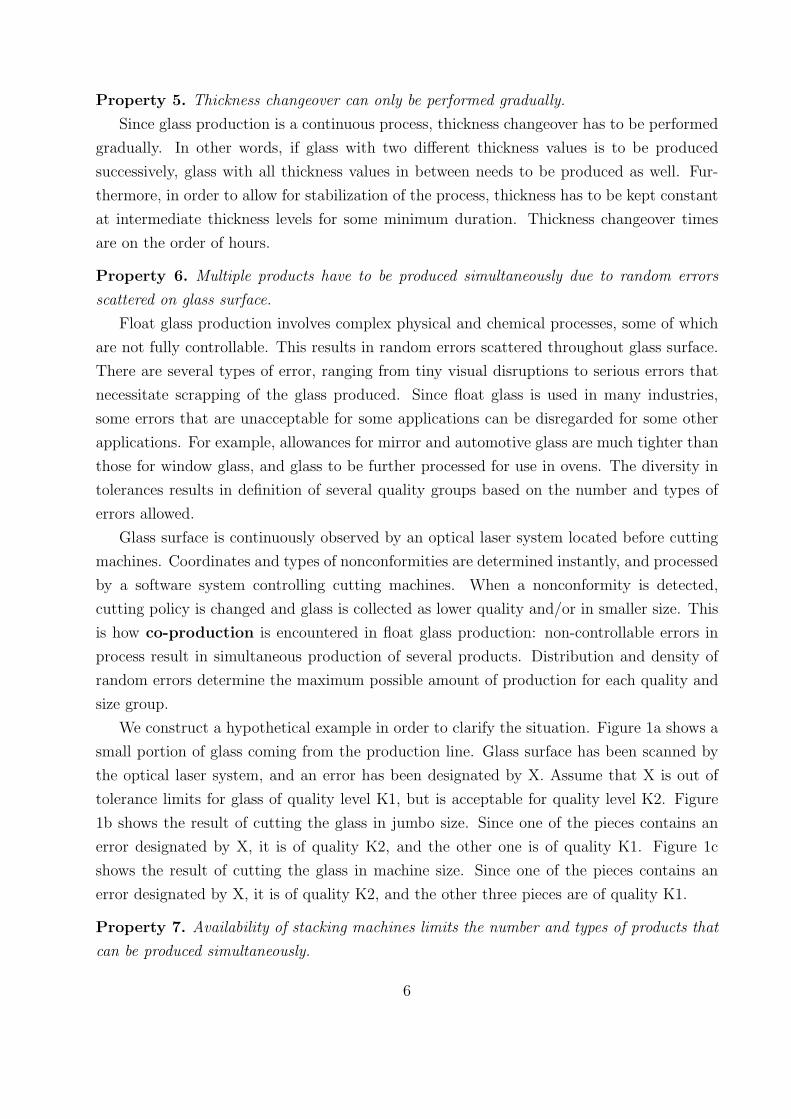
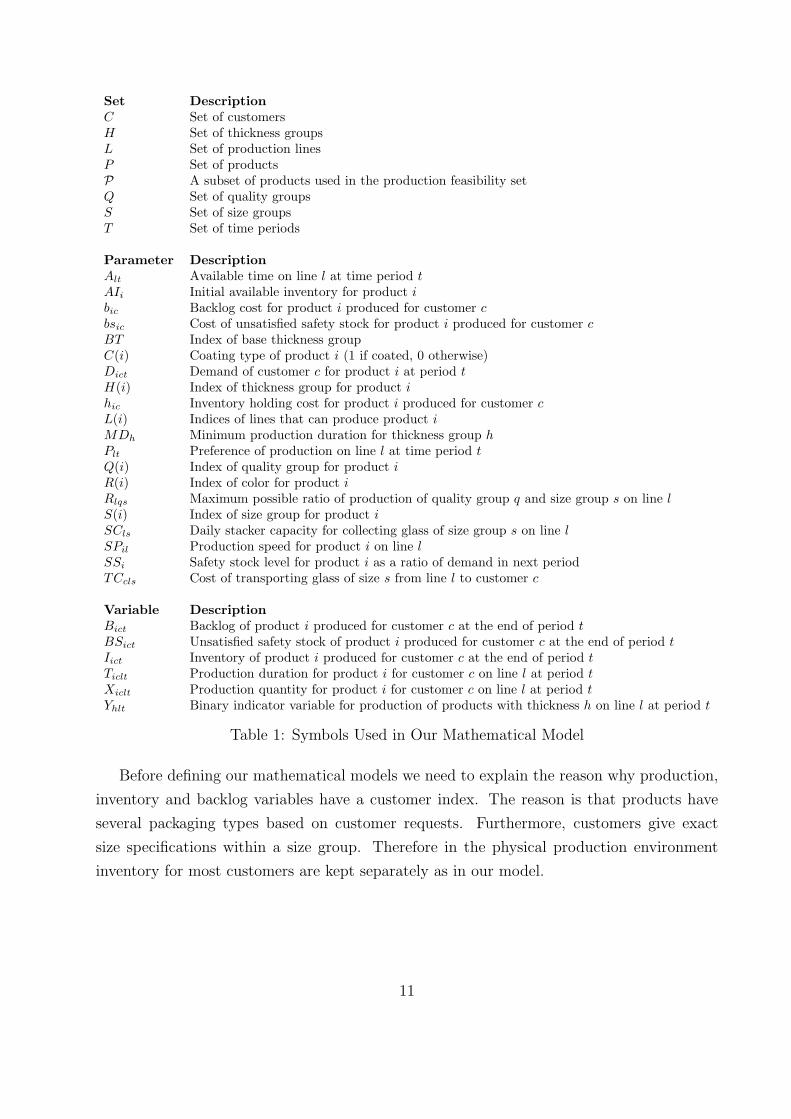
We construct a hypothetical example in order to clarify the situation. Figure 1a shows a
small portion of glass coming from the production line. Glass surface has been scanned by
the optical laser system, and an error has been designated by X. Assume that X is out of
tolerance limits for glass of quality level K1, but is acceptable for quality level K2. Figure
1b shows the result of cutting the glass in jumbo size. Since one of the pieces contains an
error designated by X, it is of quality K2, and the other one is of quality K1. Figure 1c
shows the result of cutting the glass in machine size. Since one of the pieces contains an
error designated by X, it is of quality K2, and the other three pieces are of quality K1.
Property 7. Availability of stacking machines limits the number and types of products that
can be produced simultaneously.
6
Figure 1: Compositions
After cutting at the end of production line, glass is collected by automated stacking
machines and laid on stillages for packaging. Each stacking machine can only be used to
collect glass of a specific dimension; it is not possible to collect jumbo size glass on a machine
size stacking machine or vice versa. Stacking machines have a cycle time consisting of the
time required to collect glass, move it to the required position, lay on stillage, and then return
to idle status. Machines cannot be assigned to a new task unless they are idle. Therefore,
there is a limit on the availability of each stacking machine based on its cycle time. This
is another source of co-production: even if the surface of the glass produced contained no
random errors, the fact that stacking capacity for each size group is limited would necessitate
simultaneous production of glass within several size groups.
Only one type of product can be collected by a stacking machine at any time. Therefore,
the number of products within each size group that can be produced simultaneously is
bounded by the number of stacking machines available for that size group. We refer to a
cutting policy with respect to the set of products that are produced simultaneously as a
composition.
3.3 Planning Issues in Float Glass Production
Issue 1. Production capacity cannot be adjusted through overtime, undertime or subcontract-
ing.
7
The fact that stopping production is not an option (Property 1) results in inevitable
inventory accumulation for the time periods in which capacity exceeds demand. Furthermore,
expanding production capacity by means of overtime or subcontracting is not possible. This
results in possible stock-out for time periods in which demand exceeds capacity. Therefore,
available capacity can be considered as a “given fact.” All production lines have to be fully
utilized in a feasible production plan.
Issue 2. Production capacity depends significantly on the product mix.
Due to the existence of multiple production lines on which products can be produced at
different rates (Property 2), and dynamic co-production possibility (Property 6), capacity
cannot be defined independent of the product mix.
Issue 3. Safety stocks are kept for products.
Since production plans are based on imperfect forecast information, it is desired to keep
safety stocks in order to guard against fluctuations in demand. The safety stock strategy
employed is a dynamic one in which it is desired to have inventory level at the end of a
period no less than some percentage of the forecasted demand in the next period.
Issue 4. Products can be substituted for lower quality products within the same size and
thickness group.
From a demand satisfaction point of view, customers demanding glass of a specific size
and quality are equally happy with glass having the same size and better quality. Therefore,
demand is substitutable with respect to quality, but demand substitution is not applicable
to products having different dimensions.
In Trakya Cam, demand substitution decisions are made “online” during production.
Each available stacking machine is assigned to a specific product. The software system
controlling cutting machines is given a priority list consisting of a set of products, and the
stacking machine each product is assigned to. The software system reads the distribution of
errors on glass surface from the optical laser system. Given the error distribution, the system
then cuts the glass in such a way that the product with the highest priority that is compatible
with the current error distribution is collected by the assigned stacking machine. Usage of
priority lists results in implicit product substitution: products that are not in the priority
list, and hence are not collected by stacking machines in their actual quality categorization
are automatically substituted for products with lower quality that are in the list.
The ideas of product substitution can be demonstrated visually on the hypothetical
example given in Figure 1. Given the same error distribution as in Figure 1a, adding only
the product K2/J to the priority list and assigning only one stacking machine results in the
production output shown in Figure 1d. This policy is equivalent to cutting all glass in jumbo
8
size and substituting K1 glass for K2 glass. In this case, only one end product (K2/J) is
produced. In other words, glass of quality K1 is substituted for glass of quality K2.
Issue 5. Cutting policy employed has a significant effect on types and quantities of end
products obtained.
Determining cutting policy is an important planning decision. Although random errors
on the glass surface limit possible production of each product (Property 6), the fact that
demand is substitutable within the same size group (Issue 4) allows for the application of
several cutting policies. Furthermore, it is always possible to cut glass of each size and
quality group into several pieces of smaller size having (at least) the same quality group.
Figure 1e shows the result of cutting two machine size pieces instead of the jumbo piece of
quality level K2 in Figure 1b. It can be seen that it is possible to cut two machine size glass
within quality groups K1 and K2 instead of a single jumbo within size group K2. Similarly,
Figure 1f shows the result of cutting two machine size pieces of quality level K1 instead of
the jumbo piece of quality level K1 in Figure 1b. The joint effect of surface errors, product
substitution and cutting size determination is shown on Figure 1. It can be seen that even
for this simple case, where only two size and quality groups are considered, and there exist
only a single nonconformity on the glass surface, the total number of cutting policies that can
be applied is at least five. Therefore, compositions need to be considered during production
planning, and the issue is one of the most interesting issues in float glass manufacturing.
Issue 6. Colored glass is produced in campaigns.
As discussed in Property 3, color changeovers have high associated costs, and hence
color changeovers need to be planned carefully. Since changeover costs are much more
expensive than holding inventory, colored glass is produced in campaigns in order to minimize
changeovers. A typical campaign may consist of successive production of clear, light green,
dark green, blue and clear glass. Depending on demand patterns, glass of each color is
produced in one or two campaigns a year.
Issue 7. There exist multiple production sites, and transportation costs are significant.
Most of the float glass demand in Turkey is satisfied by Trakya Cam, and products are
exported to several countries worldwide. Therefore, customers are geographically sparse and
various transportation methods are used. Production planning department decides on the
production plan for each facility, and the facility from which the demand of each customer is
to be satisfied. Currently there are four float glass production sites. Transportation of glass
is quite expensive, and logistics costs are significant since glass is a fragile material, which can
easily be broken during transportation. Specialized pieces of equipment are used in trans-
portation of glass. For example, jumbo size glass is transported by specially manufactured
trucks, which are costly to operate.
9

3.4 Assumptions
In order to build a model that can be solved within a reasonable time, and yet is an adequate
representation of the inherent complexity, we make some simplifying assumptions:
Assumption 1. Changeover time associated with thickness changeover is negligible.
Although thickness changeover has associated changeover time and cost (Property 5), we
assume that thickness changeover time is negligible, and is not modeled explicitly. From the
perspective of aggregate production planning, production speed is adjusted to incorporate
an average loss due to thickness changeover, based on historical data. This assumption is
based on the fact that changeover time for most thickness changes is on the order of hours.
Assumption 2. There exists a thickness value that corresponds to a significant percentage
of demand.
In the real production environment, it is possible to end a period at any thickness value
and begin the next period at the same thickness value. However, sequencing of thickness
values is beyond the scope of this paper. Here, we assume that production on each line in
each period starts and ends at a specific thickness value, which we refer to as base thickness
value. This assumption is based on the observation that the ratio of the demand for glass
of 4 mm thickness is approximately 60% of the total demand.
Assumption 3. Glass can only be cut in dimensions on a discrete scale.
There is a wide range of glass dimensions that can be produced, and product dimensions
can be given on a continuous scale. In this paper we assume that only discrete size groups
can be demanded by customers, and produced by production lines. Size groups that we
consider are jumbo, machine size and split size.
4 Mathematical Model
In this section, we develop a mathematical model for production planning in float glass
manufacturing. Table 1 lists the symbols used in our mathematical model, along with their
brief descriptions. We first define a production feasibility set (σ) that determines the
set of feasible production plans for a given set of products, which we denote by P, under
production capabilities discussed in Section 3.2 and Section 3.3. We later use the production
feasibility set as a black-box for campaign duration and product mix planning, and multi-site
production planning. The underlying production environment is the same for both planning
problems. Therefore, they are similar in terms of production feasibility, but have quite
different planning objectives.
10
Set DescriptionC Set of customersH Set of thickness groupsL Set of production linesP Set of productsP A subset of products used in the production feasibility setQ Set of quality groupsS Set of size groupsT Set of time periods
Parameter DescriptionAlt Available time on line l at time period tAIi Initial available inventory for product ibic Backlog cost for product i produced for customer cbsic Cost of unsatisfied safety stock for product i produced for customer cBT Index of base thickness groupC(i) Coating type of product i (1 if coated, 0 otherwise)Dict Demand of customer c for product i at period tH(i) Index of thickness group for product ihic Inventory holding cost for product i produced for customer cL(i) Indices of lines that can produce product iMDh Minimum production duration for thickness group hPlt Preference of production on line l at time period tQ(i) Index of quality group for product iR(i) Index of color for product iRlqs Maximum possible ratio of production of quality group q and size group s on line lS(i) Index of size group for product iSCls Daily stacker capacity for collecting glass of size group s on line lSPil Production speed for product i on line lSSi Safety stock level for product i as a ratio of demand in next periodTCcls Cost of transporting glass of size s from line l to customer c
Variable DescriptionBict Backlog of product i produced for customer c at the end of period tBSict Unsatisfied safety stock of product i produced for customer c at the end of period tIict Inventory of product i produced for customer c at the end of period tTiclt Production duration for product i for customer c on line l at period tXiclt Production quantity for product i for customer c on line l at period tYhlt Binary indicator variable for production of products with thickness h on line l at period t
Table 1: Symbols Used in Our Mathematical Model
Before defining our mathematical models we need to explain the reason why production,
inventory and backlog variables have a customer index. The reason is that products have
several packaging types based on customer requests. Furthermore, customers give exact
size specifications within a size group. Therefore in the physical production environment
inventory for most customers are kept separately as in our model.
11

4.1 Mathematical Constraints
Equation (1) relates production duration variables (T ) to production quantity variables (X).
Xiclt = Ticlt SPil ∀i ∈ P, c ∈ C, l ∈ L, t ∈ T (1)
Equation (2) is the inventory balance constraint that links the production quantity (X),
inventory (I), and backlog variables (B) across all time periods.
Iic(t−1) − Bic(t−1) +∑
l∈L(i)
Xiclt − Dict = Iict − Bict ∀i ∈ P , c ∈ C, t ∈ T, t > 0 (2)
Equation (3) accounts for satisfaction of safety stock levels, which are represented as a ratio
of the demand in the next period (Issue 3). We model desired safety stock levels as “soft
constraints,” penalizing violations, which are measured by BS-variables.
Iic(t−1) ≥ Dict SSi − BSic(t−1) ∀i ∈ P , c ∈ C, t ∈ T, t > 0 (3)
Equation (4) forces the value of the indicator variable Yhlt to 1 if production of glass having
thickness h is produced in production line l in time period t.∑i∈P
H(i)=h
∑c∈C
Ticlt ≤ Alt Yhlt ∀h ∈ H, l ∈ L, t ∈ T (4)
4.2 Business Model Constraints
Production cannot be interrupted in float glass manufacturing (Property 1). Equation (5)
ensures that all production lines are fully utilized in a feasible production plan:∑i∈P
∑c∈C
Ticlt = Alt ∀l ∈ L, t ∈ T (5)
However, in some solution procedures (such as our campaign duration planning algorithm
described in Section 4.4), we only consider a subset of the products, and hence, the capacity
of the lines need not be utilized completely. In that case, production line capacity constraints
need to be of the form:∑i∈P
∑c∈C
Ticlt ≤ Alt ∀l ∈ L, t ∈ T (6)
Production feasibility set will be called to have mode STRICT if the capacity constraints
are as in Equation (5), and RELAX if Equation (6) applies.
12
Coated glass can only be produced during daytime (Property 4). In aggregate planning,
this means that total production time of coated glass cannot exceed half of the available
production time. This requirement can be modeled by the following constraint:∑i∈P
∑c∈C
C(i) Ticlt ≤ 0.5 Alt ∀l ∈ L, t ∈ T (7)
Even though this formulation is correct regarding the total production of coated glass, it is
inadequate in modeling the coupling of glass produced during daytime and during nighttime:
When coated glass is produced during daytime, uncoated glass with the same thickness is
produced during nighttime. However, uncoated glass can also be produced during daytime.
In aggregate terms, this means that total production of uncoated glass is no less than total
production of coated glass for each thickness group:∑i∈P
H(i)=h
∑c∈C
(1 − C(i)) Ticlt ≥∑i∈P
H(i)=h
∑c∈C
C(i) Ticlt ∀h ∈ H, l ∈ L, t ∈ T (8)
We note that Equations (6) and (8) imply Equation (7), and hence we do not consider
Equation (7) any further.
In order to capture the thickness changeover property described in Property 5, we assume
that there exists a base thickness value BT such that production on each line at each period
starts at this thickness value (Assumption 2). Based on this assumption, feasible production
plans have a special structure regarding thickness groups: If production for any thickness
group h is planned, productions for all thickness groups between h and BT have to be
planned, too. We enforce this structure as a combination of two constraints:
Yhlt ≥ Y(h+1)lt ∀h ∈ H : h ≥ BT, l ∈ L, t ∈ T (9)
Y(h+1)lt ≥ Yhlt ∀h ∈ H : h < BT, l ∈ L, t ∈ T (10)
Equation (9) ensures that if production is planned for any thickness group above BT , pro-
duction should also be planned for the adjacent thickness group with smaller index. This
condition is enforced on all thickness groups above BT , and recursively ensures the de-
sired thickness changeover property. Equation (10) handles the symmetric case for thickness
groups below BT .
Equation (11) ensures that thickness of glass has to be kept constant at some values
for some minimum duration (MDh) in order to allow for stabilization of the process during
thickness changeover (Property 5).∑i∈P
H(i)=h
∑c∈C
Ticlt ≥ MDh Yhlt ∀h ∈ H, l ∈ L, t ∈ T (11)
13
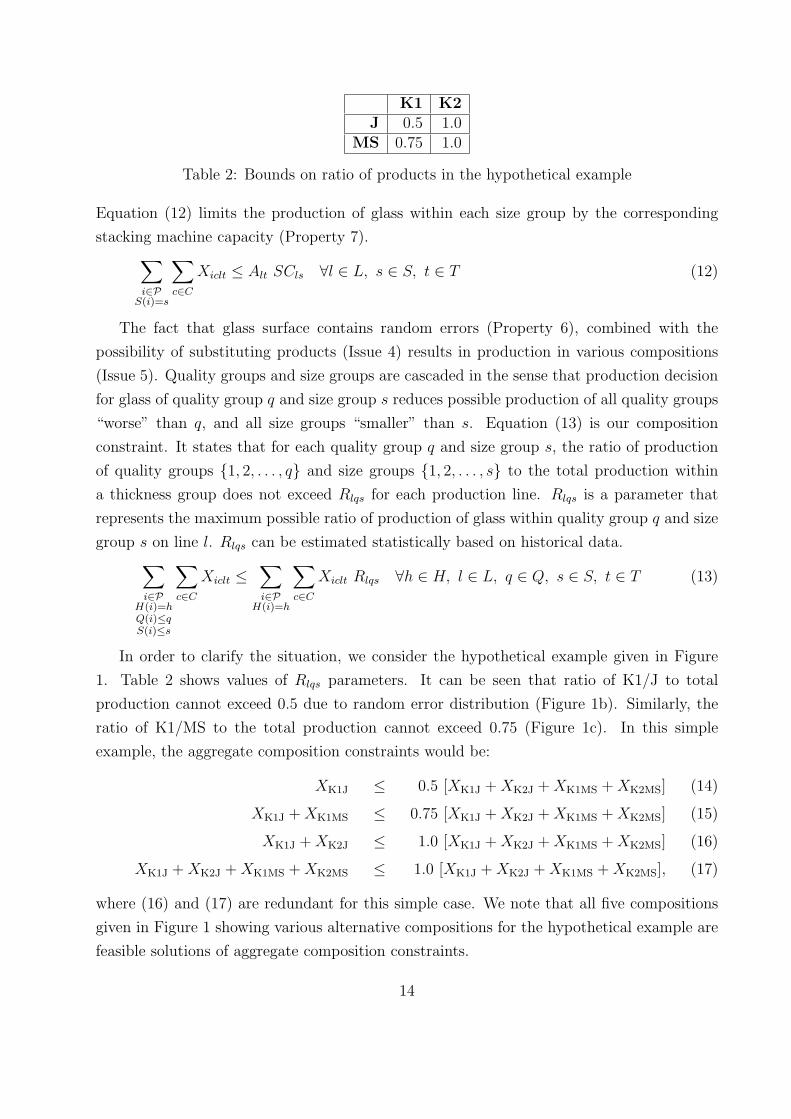
K1 K2J 0.5 1.0
MS 0.75 1.0
Table 2: Bounds on ratio of products in the hypothetical example
Equation (12) limits the production of glass within each size group by the corresponding
stacking machine capacity (Property 7).∑i∈P
S(i)=s
∑c∈C
Xiclt ≤ Alt SCls ∀l ∈ L, s ∈ S, t ∈ T (12)
The fact that glass surface contains random errors (Property 6), combined with the
possibility of substituting products (Issue 4) results in production in various compositions
(Issue 5). Quality groups and size groups are cascaded in the sense that production decision
for glass of quality group q and size group s reduces possible production of all quality groups
“worse” than q, and all size groups “smaller” than s. Equation (13) is our composition
constraint. It states that for each quality group q and size group s, the ratio of production
of quality groups {1, 2, . . . , q} and size groups {1, 2, . . . , s} to the total production within
a thickness group does not exceed Rlqs for each production line. Rlqs is a parameter that
represents the maximum possible ratio of production of glass within quality group q and size
group s on line l. Rlqs can be estimated statistically based on historical data.∑i∈P
H(i)=hQ(i)≤qS(i)≤s
∑c∈C
Xiclt ≤∑i∈P
H(i)=h
∑c∈C
Xiclt Rlqs ∀h ∈ H, l ∈ L, q ∈ Q, s ∈ S, t ∈ T (13)
In order to clarify the situation, we consider the hypothetical example given in Figure
1. Table 2 shows values of Rlqs parameters. It can be seen that ratio of K1/J to total
production cannot exceed 0.5 due to random error distribution (Figure 1b). Similarly, the
ratio of K1/MS to the total production cannot exceed 0.75 (Figure 1c). In this simple
example, the aggregate composition constraints would be:
XK1J ≤ 0.5 [XK1J + XK2J + XK1MS + XK2MS] (14)
XK1J + XK1MS ≤ 0.75 [XK1J + XK2J + XK1MS + XK2MS] (15)
XK1J + XK2J ≤ 1.0 [XK1J + XK2J + XK1MS + XK2MS] (16)
XK1J + XK2J + XK1MS + XK2MS ≤ 1.0 [XK1J + XK2J + XK1MS + XK2MS], (17)
where (16) and (17) are redundant for this simple case. We note that all five compositions
given in Figure 1 showing various alternative compositions for the hypothetical example are
feasible solutions of aggregate composition constraints.
14
4.3 Production Feasibility Set σP,MODE
Production feasibility set σP,MODE is a set that defines constraints on decision variables
related to a subset of products (P) with respect to a capacity constraint mode. In other
words, it defines a polyhedron on the space of decision variables corresponding to the set of
feasible production plans for given products. The production feasibility set can be defined
as:
σP,MODE ={Ticlt, Xiclt, Iict, Bict, BSict, Yhlt}
subject to Equations (1)–(4)
Equation (5) if MODE = STRICT
Equation (6) if MODE = RELAX
Equations (8)–(13)
Ticlt, Xiclt ≥ 0 ∀(i ∈ P , c, l, t)
Iict, Bict, BSict ≥ 0 ∀(i ∈ P, c, t)
Yhlt ∈ {0, 1} ∀(h, l, t)
4.4 Campaign Duration and Product Mix Planning
Colored glass is produced in campaigns in order to minimize high color changeover time and
cost (Issue 6). The main idea behind a campaign is to accumulate enough inventory at the
end of the campaign so that the entire demand until the next campaign can be satisfied from
inventory. It should be noted that this does not necessarily mean making production for
all demand between specified periods; demand can also be satisfied from initial inventory.
There are several issues regarding campaign planning:
• Timing of campaigns: Since each product has a different initial inventory level and
a different demand structure, the time period in which initial inventory is depleted
can be different for each product. This is the time before which additional production
needs to be planned in order to avoid stock-out for that particular product. In the case
of colored glass, the minimum of such time values for all products with the specified
color corresponds to the latest time a campaign needs to be planned for that particular
color.
• Sequencing colors within campaigns: Since changeover times between colors are se-
quence dependent (Property 3), sequence of colors within campaigns should be deter-
mined in such a way that the total changeover time is minimized.
15

Line Code Start Period Sequence Color ChangeoverPL1 Campaign1 1 1 Color1 3
Campaign1 2 Color2 4Campaign1 3 Color3 6
PL1 Campaign2 5 1 Color1 3Campaign2 2 Color4 5
Table 3: Sample sequence of campaigns
• Duration of campaigns: Duration of each campaign must be long enough for accumu-
lating enough inventory to satisfy the demand until the next campaign on the same
color. Furthermore, the duration of campaigns need to be minimized in order to avoid
accumulating excessive inventory. All other properties of float glass production are
also valid for colored glass production. Especially composition (Issue 5), product sub-
stitution (Issue 4) and thickness related issues (Property 5) complicate determining
the campaign duration.
• Planning multiple campaigns: Products with some colors facing rather high demand
are produced in more than one campaign per year. For those, timing of the second
campaign is an issue. In this case interactions between campaigns need also be planned.
If the first campaign satisfies demand of all products until the second campaign, and
yet more products need to be produced due to compositions, the co-products should
be chosen among those that have demand after the second campaign, if possible. Oth-
erwise, the co-products produced in the first campaign need to be held in inventory
for a long time while the second campaign needs to be extended in order to satisfy
demand.
Although determining timing of campaigns and the sequence of colors within each cam-
paign automatically is not difficult, Trakya Cam management decided that letting decision
makers plan the sequence and timing of campaigns allows them to have more control over the
optimization system. On the other hand, calculating optimal duration and product mix of
campaigns is a difficult optimization problem, and is tackled by our decision support system.
Decision makers determine the start time of campaigns, and colors to be produced within
each campaign along with the associated changeover durations in a format similar to Table
3.
There are two color campaigns shown on Table 3. Campaign1 is expected to start at the
beginning of period 1 on production line PL1. Color1, Color2 and Color3 will be produced
in that order, and associated changeover times are given. After Campaign1, clear glass will
be produced until period 5 at the beginning of which Campaign2 will start. Campaign2
consists of production of Color1 and Color4.
16

In the example given, Color2, Color3 and Color4 are produced only once. Demand of
the entire planning period needs to be satisfied in a single production run for those colors.
The minimum production duration and product mix for satisfying entire demand under
production constraints needs to be found. The situation is more complicated for Color1: it
is to be produced twice throughout the year. In the first campaign, entire demand up to
period 5 needs to be satisfied at minimum production time, and the rest of the demand needs
to be satisfied within the second campaign. However, production within the first campaign
that is in excess of demand needs to be planned carefully as well. It is desired that these
co-products that are carried in inventory can be used to satisfy demand after period 5 so
that inventory costs are minimized. Another benefit of this is a reduction in demand to be
satisfied from production within second campaign, resulting in a shorter production duration
for the second campaign.
An important observation is that each color is produced independently, and products with
different colors have no interaction such as compositions, thickness changeovers except being
produced on the same production line on different days. Therefore, products with different
colors can be planned in sequential phases by updating available capacities of production
lines after each phase.
Model 1. Campaign duration and product mix planning
We represent the inventory holding cost of product i for customer c by hic, and the cor-
responding backlog cost by bic. Given these parameters and the definition of the production
feasibility set, our mathematical model for planning campaigns for products with color R is
given as follows.
minimize∑
i∈P,c∈C,t∈T
(hic Iict + bic Bict + bsic BSict) +∑
i∈P,c∈C,l∈L,t∈T
(Xiclt Plt) (18)
subject to {Ticlt, Xiclt, Iict, Bict, BSict, Yhlt} ∈ σP={p:R(p)=R}, RELAX (19)
Here, Plt are parameters that denote the “preference” of using line l for production at time
period t. We initialize Plt parameters as follows: Plt values for time periods in which a
campaign is designated to begin are set to 0; Plt values for other time periods are set in
an increasing way. In the example given in Table 3 regarding Color1, P21 = P25 = 0,
P22 = P26 = 1, P23 = P27 = 2 . . . P212 = 11. Plt values for all other production lines
and/or time periods are set to be an arbitrary large value M . In the same example P11 =
P31 = P41 = P12 = P32 = · · · = M . Also note that, RELAX mode is used for the capacity
constraints, since we are only considering a subset of the products, and the entire capacity
need not be utilized within a period.
Under this setting, production feasibility set guarantees feasibility, and the structure of
the objective function guarantees the following properties:
17
• All demand is satisfied due to the penalty term on backlogs.
• Adequate amounts of safety stocks are kept due to the penalty term on unsatisfied
safety stocks.
• Campaign durations are minimized due to the penalty term on inventory carried. Since
the feasible region is defined by the the production feasibility set in RELAX mode,
the penalty term on the inventory carried guarantees that no inventory that could
be eliminated without violating other constraints (such as composition and thickness
changeover) is carried in an optimal solution.
• Production is planned as early as possible within each campaign. Plt parameters are
initialized in such a way that it is more preferable to produce early within a campaign
rather than late. Therefore, production for a later time period is not planned unless
production lines are fully utilized in earlier time periods.
Given the campaign planning model (Model 1), which finds an optimal production plan
for glass of any color, it can be used within an algorithm for planning all campaigns.
Algorithm 1. Campaign duration and product mix planning
Initialize: Sort colors in ascending order of starting period of the first campaign
for all Color R do
for all Production line l, Time period t do
Alt ← Alt − (changeover time)
Initialize Plt parameters
end for
Apply Model 1 to obtain an optimal production plan for color R
for all Production line l, Time period t do
Alt ← Alt −∑
i∈P
∑c∈C Ticlt
end for
end for
4.5 Multi-Site Aggregate Planning
The goals of production planning (in the order of priority) can be identified as:
• Obtaining a feasible production plan in terms of production capacity and various in-
teractions between products.
• Satisfying demand as long as production capacity permits, hence minimizing backlogs.
• Minimizing costs incurred by transportation activities.
• Determining production quantity and product mix so that inventory carrying costs are
minimized, while appropriate amount of safety stocks are kept.
18
Clear glass (R = 0) is planned after color campaigns by the following mathematical model:
Model 2. Multi-site aggregate planning
minimize∑
i∈P,c∈C,t∈T
[hic Iict + bsic BSict + bic Bict +
∑l∈L(Xiclt TCclS(i))
](20)
subject to {Ticlt, Xiclt, Iict, Bict, BSict, Yhlt} ∈ σP={p:R(p)=0}, STRICT (21)
Feasible region is defined by σP={p:R(p)=0},STRICT, and hence the remaining available time
after campaigns on all production lines is fully allocated to clear glass. Therefore, if the
demand is more than the available capacity, clear glass is made to stock instead of colored
glass, parallel to the policy employed by decision makers.
5 Results
In order to examine functionality and correctness of our decision support system, we tested
the system using inventory status of products at the beginning of 2005, and monthly sale
forecasts for a time period of 12 months. We then compared the production plan generated
by our system to the production plan prepared manually by the production planning staff.
The staff had been using custom designed spreadsheets on Excel for production planning.
Formulas on the spreadsheet were mainly used for error checking purposes, and decision
making was completely manual. Since the same data set used for manual planning was used
for testing our decision support system, the results are comparable.
As of 2005, Trakya Cam had two plants and four production lines. They had 35 product
groups and 140 products. The number of customer groups they targeted was around 30.
During the test runs with the planners, we discussed the assignment of cost and penalty
parameters used in the objective functions, and tried a number of scenarios to see the im-
pact to the inventory accumulation and transportation needs. Flexibility to modify these
parameters and ability to analyze the results easily were found valuable by the planners.
Based on the tests, main differences between results obtained are:
Result 1. Complexity of production planning at individual product level of detail can be
handled.
Production planning was based on color, thickness and coating of glass in manual pro-
duction planning. Size and quality groups were not considered. The main reason for this is
to reduce the dimensional complexity in order to keep the problem at a manageable size for
the decision maker. On the other hand, our decision support system is based on products,
and handles the additional complexity.
19
Result 2. Complexity of production planning at individual customer level of detail can be
handled.
Another simplification made during manual production planning was to group several
customers into a few customer groups. For example, even though Trakya Cam exports to
more than 20 countries worldwide, all foreign markets were treated as a single customer
group. Similarly, all local customers except other Trakya Cam facilities were grouped to-
gether. In contrast, individual customers can be modeled in our system, considering their
specific requirements and freight costs.
Result 3. Detailed conditions on composition and demand substitution issues are considered
adequately.
Composition (Issue 5) and product substitution (Issue 4) involve complex relationships
between products. Since it is difficult to consider those in manual planning, planning staff
could only make the production plan at product group level (Result 1), and did not con-
sider these issues explicitly. Instead, they relied on their experience about feasibility of the
plan in terms of compositions. However, comparison of production plans created manually
and by our decision support system revealed some infeasibilities in the manual production
plan regarding compositions. This was especially the case for some types of colored glass
in which demand is quite small compared to clear glass. In one case, more than 70% of
colored glass demand was for quality group K1, which is of highest quality level. However,
it is not possible to produce K1 quality glass without accompanying glass of lower quality
levels due to the composition issue (Issue 5). Investigation of the manual production plan
revealed that the amount of planned production was roughly equal to demand for glass of
this color, meaning that co-production of lower quality glass was not planned and hence,
the composition constraint was violated. The color campaign had to be revised later in the
same year in order to correct the mistakes made in planning.
Result 4. Color campaigns are planned in detail subject to production constraints.
Colored glass is produced in one or two campaigns each year, and campaign planning is
crucial for inventory management of colored glass (Issue 6). Furthermore, since the demand
for colored glass is relatively small, composition issues are more relevant in production of
colored glass compared to clear glass. Our comparison of the manual production plan with
the plan generated by our system showed that:
• Campaign durations for some of the five colors were less than the necessary duration
required to produce for demand in subsequent time periods. The main reason for this
is that composition issues were disregarded in manual planning (Result 3). Although
total amount of colored glass production planned was roughly equal to total demand,
20

it was not possible to satisfy demand of high quality glass without extending campaign
duration, and producing some glass of lower quality groups as well.
• On the other hand, durations for some campaigns were more than the sufficient dura-
tion. This was especially the case for colors for which more than one campaigns were
defined. The main reason is that planners could not optimize compositions in the first
campaign so that co-products of the first campaign are required productions for the
second campaign. This resulted in excess inventory levels after the first campaign, and
extended duration for the second campaign for production of glass that could have
been produced in the first campaign.
Result 5. Conditions on thickness changeovers and minimum production durations are en-
forced.
Thickness changeover has to be performed gradually in float glass production (Property
5). However, investigation of the production plan prepared manually revealed some inconsis-
tencies regarding thickness changeovers. For example, for a month, production for thickness
groups 4 mm and 6 mm were planned, but no production for the groups 4.2 mm, 5 mm or
5.5 mm were planned. In contrast, our decision support system contains constraints that
enforce conditions on thickness changeovers.
Result 6. Total production quantity and inventory levels are 2% lower than the ones in
manual planning.
Upon comparison of total production quantities, the figure for manual production plan
was found to be approximately 2% more than the one for our decision support system.
This result suggests that human decision makers tend to choose faster production lines
for alternative selection (Property 2) without considering other issues such as transportation
costs in detail. However, since the entire demand could already be satisfied, the additional 2%
had to be stored in inventory. We note that our decision support system already guarantees
that sufficient levels of safety stocks are kept. Therefore, the additional 2% of the production
did not have corresponding forecasted demand.
Result 7. Freight costs are considered explicitly, leading to 10% decrease in transportation
costs.
Since considering transportation costs explicitly is difficult in manual production plan-
ning, decision makers were using simple rules based on past experience for assignment of
customer demands to facilities. Furthermore, since production planning was based on aggre-
gate customer groups instead of individual customers, it was not possible to consider distance
information for individual customers. However, our decision support system considers trans-
portation costs explicitly and customer demands are defined at a more detailed level. We
21
calculated the total transportation cost for the manual production plan, and compared it
to the figure for the production plan created by our decision support system. The results
indicated a reduction of about 10% in transportation costs without any loss in quality of
service.
Result 8. Planning process speed has improved considerably.
Previously, it took 3–4 days to prepare a plan (with limited detail, as discussed in the
previous results), and hence, a new plan was only generated twice a year to evaluate the
validity of the annual production budget. With the decision support system developed in
this study, generation of a new plan, including data preparation and reporting, takes at most
two hours, which makes it possible to make multiple runs in a month.
These results convinced the managers at Trakya Cam to deploy our system. The decision
support system has been in regular use since 2005. Now that running the system and
analyzing the results are relatively simple, new tactical plans are generated every 15 days to
check the progress of sales and production realizations. In a planning session, planners try
various scenarios by changing the weights of various objectives, and analyze the results.
In the mean time, the size of the organization has grown considerably. In 2005, Trakya
Cam had two plants and four production lines; now they have four plants and seven lines.
Due to the progress of the automotive and construction industries in Turkey, demand for
colored glass has increased. So, the number of product groups (now 60), products (now 220)
and customer groups (now 40) have also increased. In all this change, the decision support
system proved to be invaluable to assess the impact of new investments and new markets.
Acknowledgments. We would like to thank Trakya Cam Flat Glass Group Sales and
Marketing Coordinator Cetin Akturk, Trakya Cam Planning and Logistics Manager Hikmet
Camlıguney, and Trakya Cam Logistics Services Engineer Guvenc Demir for their continuous
support.
References
[1] F. Al-Khayyal, P. M. Griffin, and N. R. Smith. Solution of a large-scale two-stage
decision and scheduling problem using decomposition. European Journal of Operational
Research, 132:453–465, 2001.
[2] R. Alvarez-Valdes, A. Fuertes, J. M. Tamarit, G. Gimenez, and R. Ramos. A heuristic to
schedule flexible job-shop in a glass factory. European Journal of Operational Research,
165:525–534, 2005.
22
[3] F. Barahona, S. Bermon, O. Gunluk, and S. Hood. Robust capacity planning in semi-
conductor manufacturing. Naval Research Logistics, 52:459–468, 2005.
[4] S. Bermon and S. J. Hood. Capacity optimization planning system (CAPS). Interfaces,
29:31–50, 1999.
[5] G. R. Bitran and S. M. Gilbert. Co-production processes with random yields in the
semiconductor industry. Operations Research, 42:476–491, 1994.
[6] G. R. Bitran and T. Y. Leong. Deterministic approximations to co-production problems
with service constraints and random yields. Management Science, 38:724–742, 1992.
[7] L. Cheng, E. Subrahmanian, and A. Westerberg. Design and planning under uncer-
tainty: Issues on problem formulation and solution. Computers and Chemical Engi-
neering, 27:781–801, 2003.
[8] Y. Crama, Y. Pochet, and Y. Wera. A discussion of production planning approaches in
the process industry. Technical Report 2001/42, University of Liege, 2001.
[9] Sisecam Group. Sisecam 2006 annual report. http://www.sisecam.com/investor_
rel/annual_reports/2006/annual2006.pdf, 2007.
[10] C. G. da Silva, J. Figueira, J. Lisboab, and S. Barmane. An interactive decision support
system for an aggregate production planning model based on multiple criteria mixed
integer linear programming. Omega, 34:167–177, 2006.
[11] A. Guinet. Multi-site planning: A transshipment problem. International Journal of
Production Economics, 74:21–32, 2001.
[12] A. Gupta and C. D. Maranas. Managing demand uncertainty in supply chain planning.
Computers and Chemical Engineering, 27:1219–1227, 2003.
[13] M. Joly, L. Moro, and J. Pinto. Planning and scheduling for petroleum refineries using
mathematical programming. Brazilian Journal of Chemical Engineering, 19:207–228,
2002.
[14] R. C. Leachman and T. F. Carmon. On capacity modeling for production planning with
alternative machine types. IIE Transactions, 24-4:62–72, 1992.
[15] S. C. H. Leung, Y. Wu, and K. K. Lai. A stochastic programming approach for multi-site
aggregate production planning. Journal of the Operational Research Society, 57-2:123–
132, 2006.
[16] A. A. Levis and L. G. Papageorgiou. A hierarchical solution approach for multi-site
capacity planning under uncertainty in the pharmaceutical industry. Computers and
Chemical Engineering, 28:707–725, 2004.
[17] C. M. Liu and H. D. Sherali. A coal shipping and blending problem for an electric
utility company. Omega, 28:433–444, 2000.
23

[18] X. Liu and Y. Tu. Production planning with limited inventory capacity and allowed
stockout. International Journal of Production Economics, 111:180–191, 2008.
[19] Y. Merzifonluoglu, J. Geunes, and H. E. Romeijn. Integrated capacity, demand, and
production planning with subcontracting and overtime options. Naval Research Logis-
tics, 54:433–447, 2007.
[20] S. Nam and L. Rasaratnam. Aggregate production planning – a survey of models and
methodologies. European Journal of Operational Research, 61:255–272, 1992.
[21] S. Oner and T. Bilgic. Economic lot scheduling with uncontrolled co-production. Eu-
ropean Journal of Operational Research, 188:793–810, 2008.
[22] S. Ozcelikyurek-Oner. Inventory Models of Multiple Products with Co-Production. PhD
thesis, Bogazici University, 2003.
[23] P. C. Pendharkar. A fuzzy linear programming model for production planning in coal
mines. Computers & Operations Research., 24(12):1141–1149, 1997.
[24] J. Till, G. Sand, M. Urselmann, and S. Engell. A hybrid evolutionary algorithm for
solving two-stage stochastic integer programs in chemical batch scheduling. Computers
& Chemical Engineering, 31:630–647, 2007.
24