tackling youth unemployment at the local level: cambodia case
Upload: oecd-local-economic-and-employment-leed-programme-and-its-trento-centre
Post on 24-Dec-2014
60 views
DESCRIPTION
This expert meeting of the ESSSA initiative will provide a unique opportunity to share international experience in addressing the issue of skills mismatch as a way to contribute to more inclusive growth and good quality job creation across Southeast Asian countries.TRANSCRIPT

Session II: Tackling youth unemployment at the local level- Cambodian Case
SOMEAN KUOCHNational Employment AgencyEmail: [email protected]
The 6th Expert meeting of the Employment and Skills Strategies in Southeast Asia Initiative (ESSSA)
17-18 September, 2014at Century Park Hotel, Bangkok, Thailand
Content
1. Cambodian Youth Profile and Its Key Challenges2. Policies adapted by RGC3. The Way Forward
This presentation is largely based on the data compiled by National Employment Agency and some policies recommendation have been drawn from the study of UNDP on “Investing in Human Capital-Long-term strategy for industrial development and inclusive growth”.

1. Cambodian Youth Profile and Its Key challenges

1950-55
1955-60
1960-65
1965-70
1970-75
1975-80
1980-85
1985-90
1990-95
1995-00
2000-05
2005-10
2010-15
2015-20
2020-25
2025-30
2030-35
2035-40
2040-45
2045-50
2050-55
2055-60
-100
0
100
200
300
400
500
99119
142160
122
-45
283 292 296
237206 208 201 189
166137
11292
7352
295
Population: Annual Birth, Death and Balance (in'000), 1955-2060
Source: United Nations Population Division 2011
Annual Birth
Annual Death
Annual Balance

Cambodian Population by Age Group; 2008, 2013, 2018, &2023
2008 2013 2018 20230%
10%
20%
30%
40%
50%
60%
70%
80%
90%
100%
-
2,000,000
4,000,000
6,000,000
8,000,000
10,000,000
12,000,000
14,000,000
16,000,000
18,000,000
33.8 30.1 28.5 27.7
22.3 22.5 19.8 16.7
14.4 17.7 18.6 19.1
25.3 25.4 28.1 30.8
4.3 4.4 5.0 5.7
0-14 15-2425-34 35-6465+ Total population- right axis
Source: Cambodia Population Projection (NIS,2011)
1950-55
1955-60
1960-65
1965-70
1970-75
1975-80
1980-85
1985-90
1990-95
1995-00
2000-05
2005-10
2010-15
2015-20
2020-25
2025-30
2030-35
2035-40
2040-45
2045-50
2050-55
2055-60
-200
-100
0
100
200
300
400
53.863.272.680.6
31-24.6
115.2146.4
91.8
269.6233
206.4172.6
148.8142.8131.4113.2
89 85.2
-57 -47-81.8
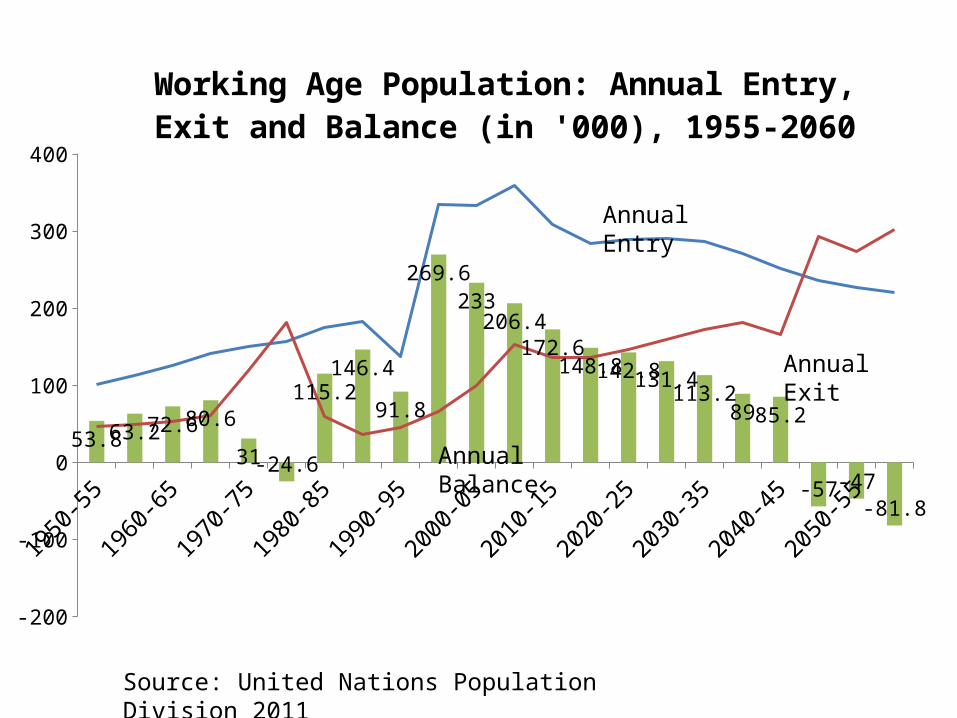
Working Age Population: Annual Entry, Exit and Balance (in '000), 1955-2060
Source: United Nations Population Division 2011
Annual Entry
Annual Exit
Annual Balance

2008 2013 2018 20230%
10%20%30%40%50%60%70%80%90%
100%
-
2,000,000
4,000,000
6,000,000
8,000,000
10,000,000
12,000,000
36.0 34.3 29.7 25.1
23.2 27.0 28.028.6
40.9 38.7 42.2 46.2
15-24 25-3435-64 Total WAP- Right axis
Cambodian Working Age Population by Age Group; 2008, 2013, 2018, &2023
Source: Cambodia Population Projection (NIS,2011)
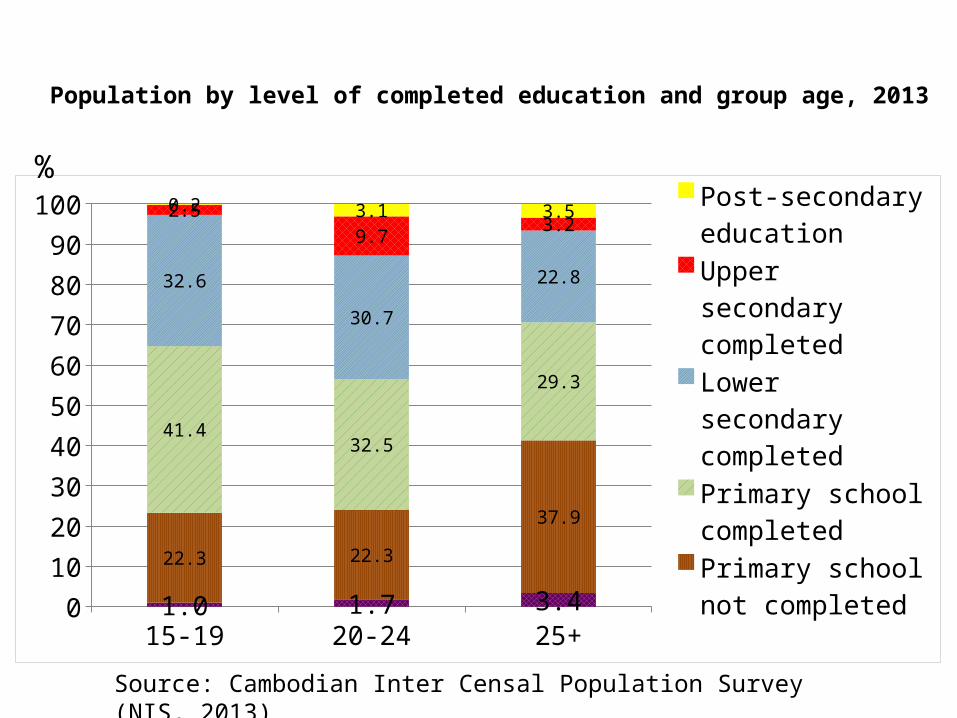
Population by level of completed education and group age, 2013
Source: Cambodian Inter Censal Population Survey (NIS, 2013)
15-19 20-24 25+0
10
20
30
40
50
60
70
80
90
100
1.0 1.7 3.4
22.3 22.3
37.9
41.432.5
29.3
32.6
30.7
22.8
2.59.7
3.20.2 3.1 3.5 Post-secondary ed-
ucation
Upper secondary completed
Lower secondary completed
Primary school completed
Primary school not completed
None or only some education
%

Cohort survival rate of student by grade; 2012-2013
grade 1
grade 2
grade 3
grade 4
grade 5
grade 6
grade 7
grade 8
grade 9
grade 10
grade 11
grade 12
Graduate
s0
100200300400500600700800900
1000
Source: EMIS 2013/2014
• Low cohort survival rate of schooling decreases significantly during primary education and even shaper at lower secondary• Low (expected) marginal returns on education
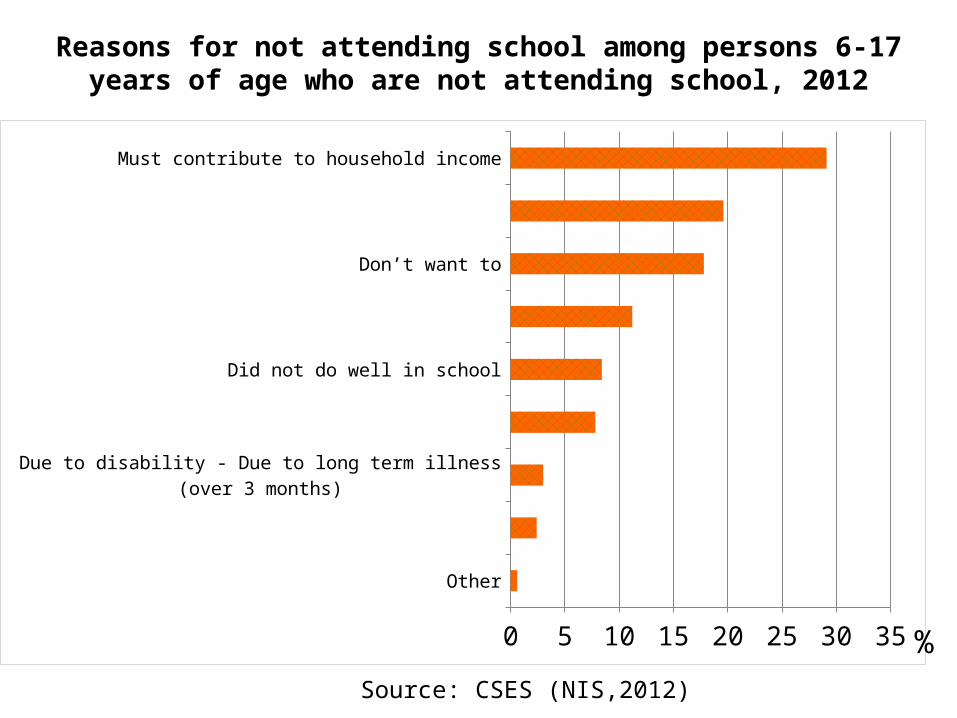
Reasons for not attending school among persons 6-17 years of age who are not attending school, 2012
Other
No suitable school available/school is too far - No teacher/Supplies
Due to disability - Due to long term illness (over 3 months)
Must help with household chores
Did not do well in school
Too poor
Don’t want to
Too young
Must contribute to household income
0 5 10 15 20 25 30 35
Source: CSES (NIS,2012)
%
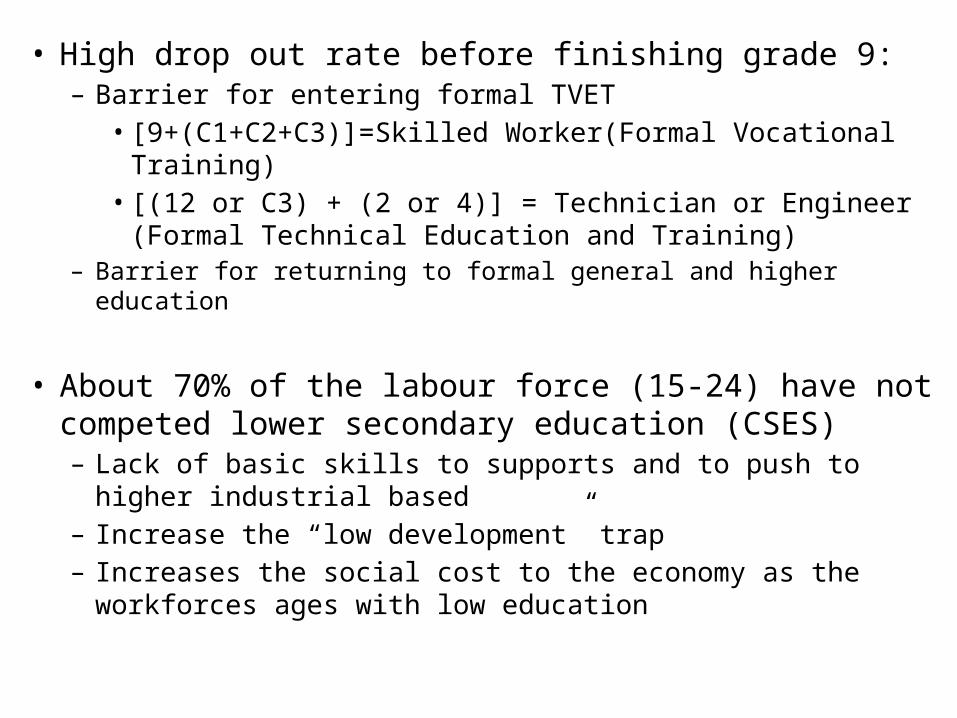
• High drop out rate before finishing grade 9:– Barrier for entering formal TVET• [9+(C1+C2+C3)]=Skilled Worker(Formal Vocational Training)• [(12 or C3) + (2 or 4)] = Technician or Engineer (Formal
Technical Education and Training)– Barrier for returning to formal general and higher education
• About 70% of the labour force (15-24) have not competed lower secondary education (CSES)– Lack of basic skills to supports and to push to higher industrial
based– Increase the “low development” trap– Increases the social cost to the economy as the workforces ages
with low education
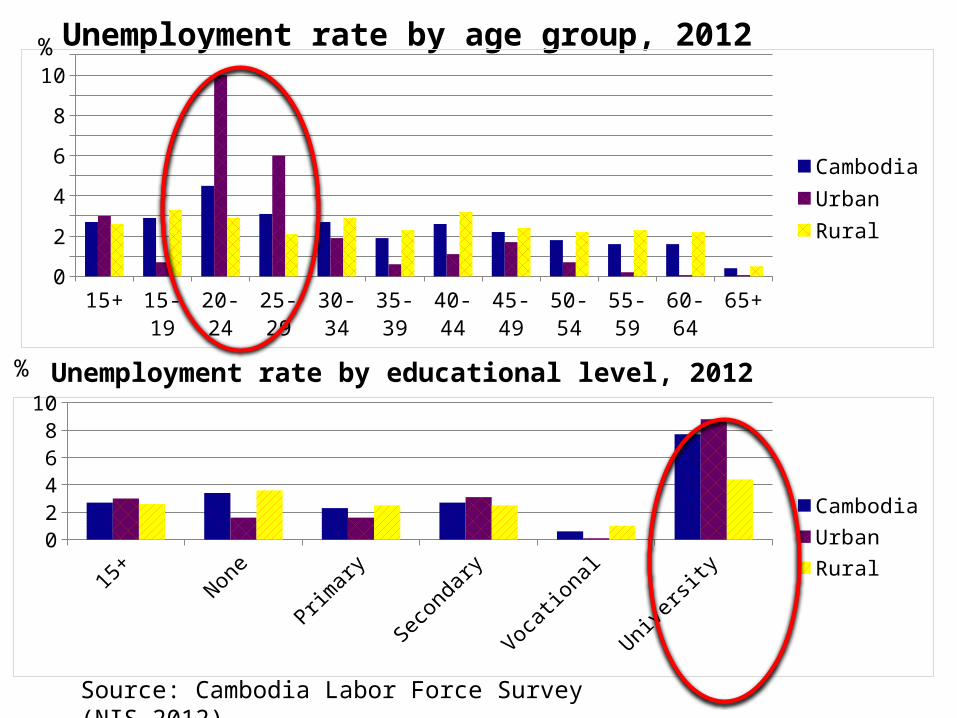
Unemployment rate by age group, 2012
15+ 15-19 20-24 25-29 30-34 35-39 40-44 45-49 50-54 55-59 60-64 65+0123456789
1011
CambodiaUrbanRural
15+ None Primary Secondary Vocational University0123456789
10
CambodiaUrbanRural
Source: Cambodia Labor Force Survey (NIS,2012)
%
% Unemployment rate by educational level, 2012

Employment by sector, 2008-2012
Source: CSES (NIS, 2012)
2008 2009 2010 2011 20120%
10%20%30%40%50%60%70%80%90%
100%
6,2006,4006,6006,8007,0007,2007,4007,6007,8008,000
55.6 57.6 54.2 55.8 51.0
15.8 15.9 16.2 16.9 18.6
28.6 26.5 29.6 27.3 30.4
Agriculture (Primary) Industry (Secondary) Services (Tertiary) Employed population- right axis
‘000
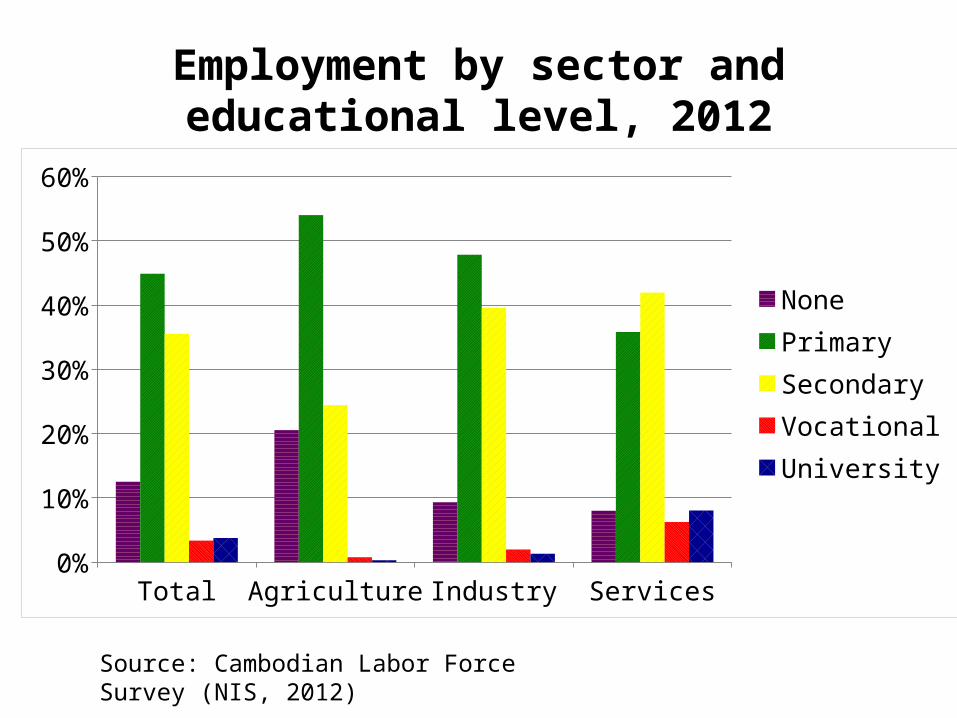
Employment by sector and educational level, 2012
Total Agriculture Industry Services0%
10%
20%
30%
40%
50%
60%
NonePrimarySecondaryVocationalUniversity
Source: Cambodian Labor Force Survey (NIS, 2012)
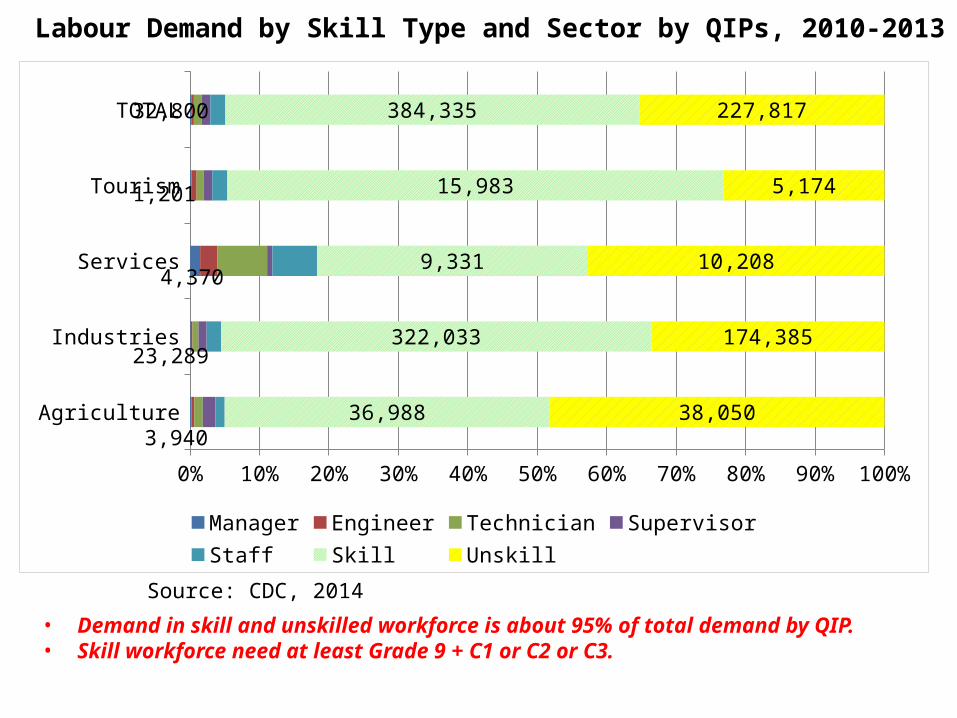
Labour Demand by Skill Type and Sector by QIPs, 2010-2013
Agriculture
Industries
Services
Tourism
TOTAL
0% 10% 20% 30% 40% 50% 60% 70% 80% 90% 100%
36,988
322,033
9,331
15,983
384,335
38,050
174,385
10,208
5,174
227,817
Manager Engineer Technician Supervisor Staff Skill Unskill
32,800
1,201
4,370
23,289
3,940
Source: CDC, 2014
• Demand in skill and unskilled workforce is about 95% of total demand by QIP.• Skill workforce need at least Grade 9 + C1 or C2 or C3.

There are growing recruitment difficulties from employer’s perspective!
Acco
mod
atio
n
Const
ruct
ion
Fina
ncia
l
Food
and
bev
erag
e
Garm
ent a
nd a
ppar
el
Rubbe
r and
pla
stics
Aver
age
0
20
40
60
80
100
Share of Hard-to-fill Vacancies by Sector, 2012
%
Source: Employer Skills Need Survey (NEA, 2012)
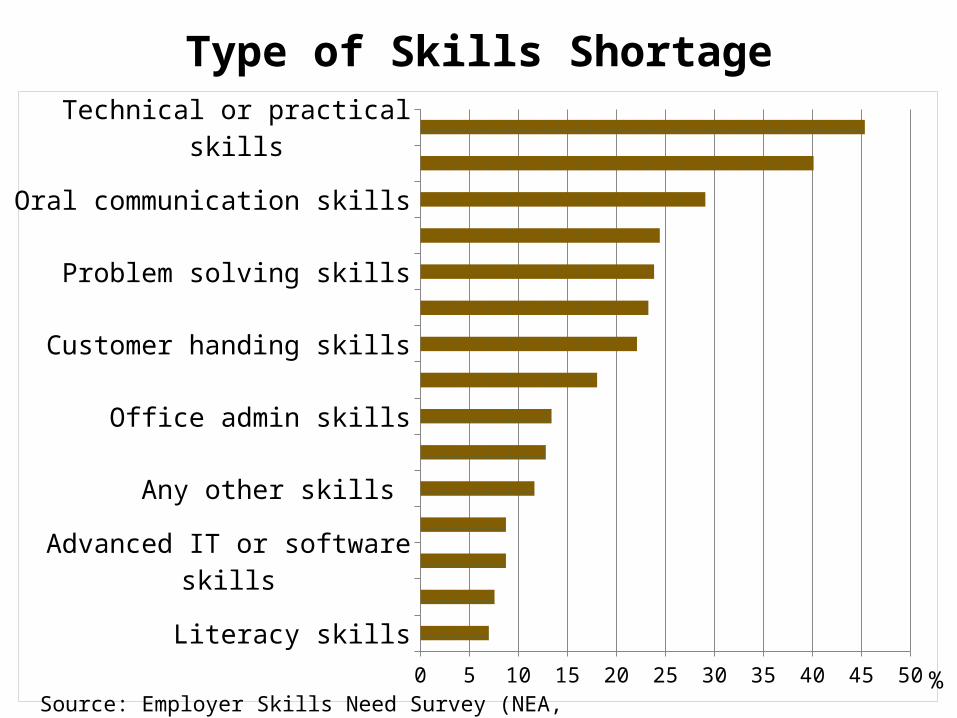
Type of Skills Shortage
Literacy skillsNumeracy skills
Advanced IT or software skillsStrategic Management skills
Any other skills Planning and organization skills
Office admin skillsWritten communication skills
Customer handing skillsTeam working skills
Problem solving skillsBasic computer literacy / using IT
Oral communication skillsForeign language skills
Technical or practical skills
0 5 10 15 20 25 30 35 40 45 50 %Source: Employer Skills Need Survey (NEA, 2012)

2. Policies adapted by RGC

• Skills development and upgrading, and youth employment issues have been placed on the high priority agenda of the government policy platform: – Rectangular Strategy- Phase III 2014-2018, and its
implementation plan, National Strategic Development Plan (NSDP) 2014-2018.
– National Policy on Cambodian Youth Development 2011
– MoYES’s Strategic Development Plan 2014-2018
– MoLVT’s Strategic Development Plan 2014-2018.
– TVET Development Plan of MoLVT issued in 2008 adopted a two-track policy, that is:• to reduce poverty through provisions of basic skills for the rural poor so as
to improve family income;• to support industrial development through the provision of higher level
skills so as to meet current and future labor demand.

• The commitment to achieve 9 year universal education:– Have Introduced and expanded demand-side programs (e.g.
conditional cash transfer, vouchers, fee subsidy and scholarship, food and nutrition supplements) with incentive design to encourage not only school attendance and completion, but also on learning outcomes.
• Given the high drop out, government have introduced the “education for all” framework and Cambodia qualification framework, which could allow every individual to acquire some skills from the formal education as well as to to continue upgrade his/her skills and move to a higher level of education in different pathways.
• The bridging course have been scaling up and made the TVET system more accessible and effective tool for youth skills development and upgrading.
• Strengthening PPP framework, which is play an important role in endorsing the formal and informal training via:– improving workplace learning by: Legally binding (Apprenticeship) and
Informal (Internship)– Engaging the private sector and, specifically, employers’ representatives, in
TVET dialogues
• Industrial Advisory Group (IAGs) have been constituted (construction, mechanics and ICT/business) in order to review and validate the competence standards, and competency based curriculum.
• The Industrial Liaison Units (ILU) has been set up in all Provincial training centers to interact with the private sector.
• Expanding and enhancing the TVET short term program via existing TVET institutions: post harvest program, national fund for poverty, primer minister’s fund program, and special training program…
• Setting up of the National Employment Agency (NEA) in the 2009 was a key moment in getting employment, LMI and career guidance services. The key functions of NEA are to:– deliver information services to job seekers, employees, employers, skill
training providers and the public to allow them to effectively interchange information openly and provide them the opportunities to meet one another.
– provide new graduates, out-of-school youth and the unemployed with labour market information and training information.
– offer job placement, services, career guidance, employment counseling, technical and vocational training counseling, information about occupational health, workplace safety, skills retraining.
– conduct researches and develop labour market information system to be kept pace with the current and future socio-economic development.

3. The Way Forward
• Increasing the productivity of the under educated and unskilled labor force through TVET.
• Improve the educational attainment of new labour market entrants.
• Using PPP to break systematic under investment in education and TVET.
• Building domestic anchor industries to reduces skills gaps and mismatches in the context of economic diversification: Industry policy and education policy.

“In order for the Kingdom of Cambodia to acquire human resources for national development, the RGC had defined a long term vision to mobilize all effort available in the country with the aim to contribute positively to youth development and to provide them with opportunities to develop their potential, to access education, employment, and health services and to participate in decision making, and to contribute to family, community, national, and global development.”
The vision of National Policy on Cambodia Youth Development.
Thank for your attention!