table 3 full-time1 civilian workers: mean and median ... 3 full-time1 civilian workers: mean and...
TRANSCRIPT
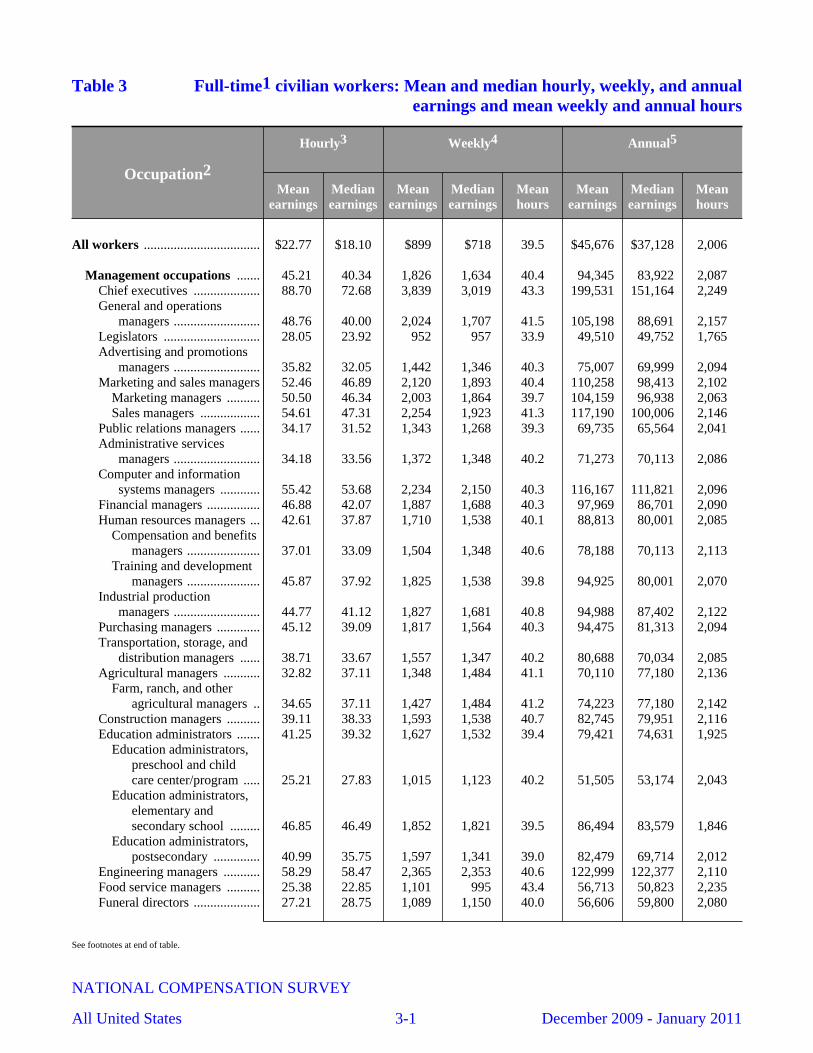
Table 3 Full-time1 civilian workers: Mean and median hourly, weekly, and annualearnings and mean weekly and annual hours
Occupation2
Hourly3 Weekly4 Annual5
Meanearnings
Medianearnings
Meanearnings
Medianearnings
Meanhours
Meanearnings
Medianearnings
Meanhours
All workers ................................... $22.77 $18.10 $899 $718 39.5 $45,676 $37,128 2,006
Management occupations ....... 45.21 40.34 1,826 1,634 40.4 94,345 83,922 2,087Chief executives .................... 88.70 72.68 3,839 3,019 43.3 199,531 151,164 2,249General and operations
managers .......................... 48.76 40.00 2,024 1,707 41.5 105,198 88,691 2,157Legislators ............................. 28.05 23.92 952 957 33.9 49,510 49,752 1,765Advertising and promotions
managers .......................... 35.82 32.05 1,442 1,346 40.3 75,007 69,999 2,094Marketing and sales managers 52.46 46.89 2,120 1,893 40.4 110,258 98,413 2,102
Marketing managers .......... 50.50 46.34 2,003 1,864 39.7 104,159 96,938 2,063Sales managers .................. 54.61 47.31 2,254 1,923 41.3 117,190 100,006 2,146
Public relations managers ...... 34.17 31.52 1,343 1,268 39.3 69,735 65,564 2,041Administrative services
managers .......................... 34.18 33.56 1,372 1,348 40.2 71,273 70,113 2,086Computer and information
systems managers ............ 55.42 53.68 2,234 2,150 40.3 116,167 111,821 2,096Financial managers ................ 46.88 42.07 1,887 1,688 40.3 97,969 86,701 2,090Human resources managers ... 42.61 37.87 1,710 1,538 40.1 88,813 80,001 2,085
Compensation and benefitsmanagers ...................... 37.01 33.09 1,504 1,348 40.6 78,188 70,113 2,113
Training and developmentmanagers ...................... 45.87 37.92 1,825 1,538 39.8 94,925 80,001 2,070
Industrial productionmanagers .......................... 44.77 41.12 1,827 1,681 40.8 94,988 87,402 2,122
Purchasing managers ............. 45.12 39.09 1,817 1,564 40.3 94,475 81,313 2,094Transportation, storage, and
distribution managers ...... 38.71 33.67 1,557 1,347 40.2 80,688 70,034 2,085Agricultural managers ........... 32.82 37.11 1,348 1,484 41.1 70,110 77,180 2,136
Farm, ranch, and otheragricultural managers .. 34.65 37.11 1,427 1,484 41.2 74,223 77,180 2,142
Construction managers .......... 39.11 38.33 1,593 1,538 40.7 82,745 79,951 2,116Education administrators ....... 41.25 39.32 1,627 1,532 39.4 79,421 74,631 1,925
Education administrators,preschool and childcare center/program ..... 25.21 27.83 1,015 1,123 40.2 51,505 53,174 2,043
Education administrators,elementary andsecondary school ......... 46.85 46.49 1,852 1,821 39.5 86,494 83,579 1,846
Education administrators,postsecondary .............. 40.99 35.75 1,597 1,341 39.0 82,479 69,714 2,012
Engineering managers ........... 58.29 58.47 2,365 2,353 40.6 122,999 122,377 2,110Food service managers .......... 25.38 22.85 1,101 995 43.4 56,713 50,823 2,235Funeral directors .................... 27.21 28.75 1,089 1,150 40.0 56,606 59,800 2,080
See footnotes at end of table.
NATIONAL COMPENSATION SURVEY
All United States 3-1 December 2009 - January 2011
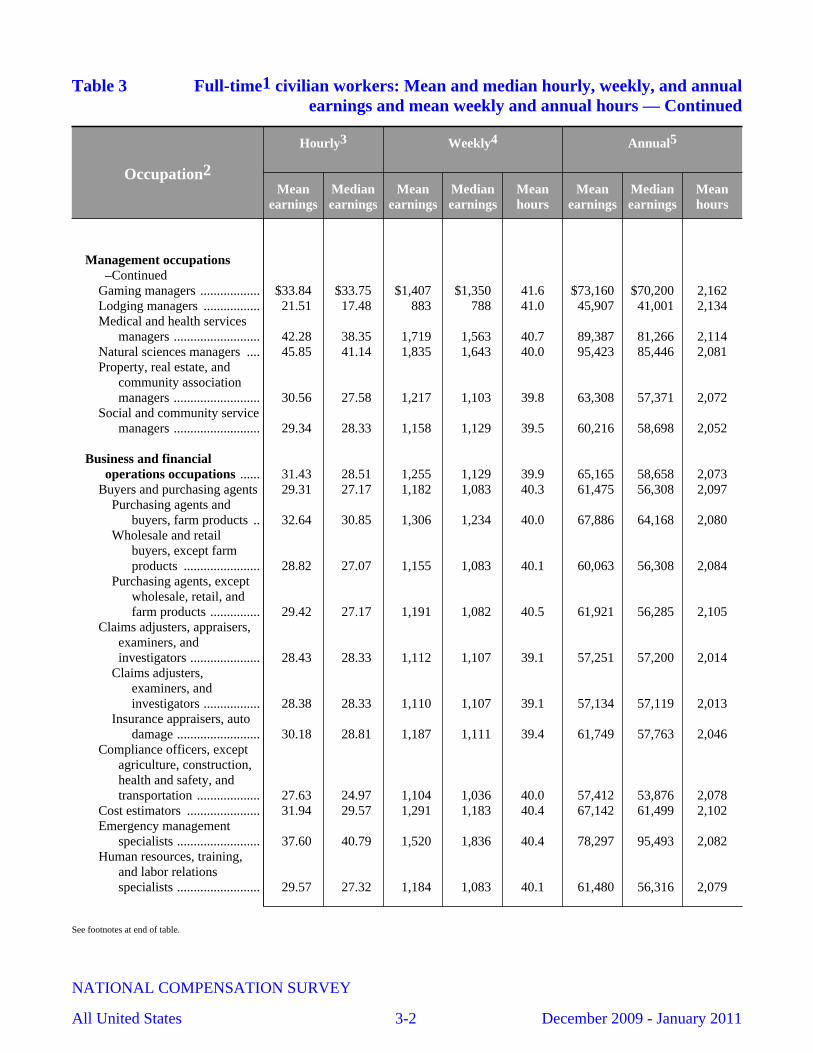
Table 3 Full-time1 civilian workers: Mean and median hourly, weekly, and annualearnings and mean weekly and annual hours — Continued
Occupation2
Hourly3 Weekly4 Annual5
Meanearnings
Medianearnings
Meanearnings
Medianearnings
Meanhours
Meanearnings
Medianearnings
Meanhours
Management occupations–Continued
Gaming managers .................. $33.84 $33.75 $1,407 $1,350 41.6 $73,160 $70,200 2,162Lodging managers ................. 21.51 17.48 883 788 41.0 45,907 41,001 2,134Medical and health services
managers .......................... 42.28 38.35 1,719 1,563 40.7 89,387 81,266 2,114Natural sciences managers .... 45.85 41.14 1,835 1,643 40.0 95,423 85,446 2,081Property, real estate, and
community associationmanagers .......................... 30.56 27.58 1,217 1,103 39.8 63,308 57,371 2,072
Social and community servicemanagers .......................... 29.34 28.33 1,158 1,129 39.5 60,216 58,698 2,052
Business and financialoperations occupations ...... 31.43 28.51 1,255 1,129 39.9 65,165 58,658 2,073
Buyers and purchasing agents 29.31 27.17 1,182 1,083 40.3 61,475 56,308 2,097Purchasing agents and
buyers, farm products .. 32.64 30.85 1,306 1,234 40.0 67,886 64,168 2,080Wholesale and retail
buyers, except farmproducts ....................... 28.82 27.07 1,155 1,083 40.1 60,063 56,308 2,084
Purchasing agents, exceptwholesale, retail, andfarm products ............... 29.42 27.17 1,191 1,082 40.5 61,921 56,285 2,105
Claims adjusters, appraisers,examiners, andinvestigators ..................... 28.43 28.33 1,112 1,107 39.1 57,251 57,200 2,014
Claims adjusters,examiners, andinvestigators ................. 28.38 28.33 1,110 1,107 39.1 57,134 57,119 2,013
Insurance appraisers, autodamage ......................... 30.18 28.81 1,187 1,111 39.4 61,749 57,763 2,046
Compliance officers, exceptagriculture, construction,health and safety, andtransportation ................... 27.63 24.97 1,104 1,036 40.0 57,412 53,876 2,078
Cost estimators ...................... 31.94 29.57 1,291 1,183 40.4 67,142 61,499 2,102Emergency management
specialists ......................... 37.60 40.79 1,520 1,836 40.4 78,297 95,493 2,082Human resources, training,
and labor relationsspecialists ......................... 29.57 27.32 1,184 1,083 40.1 61,480 56,316 2,079
See footnotes at end of table.
NATIONAL COMPENSATION SURVEY
All United States 3-2 December 2009 - January 2011
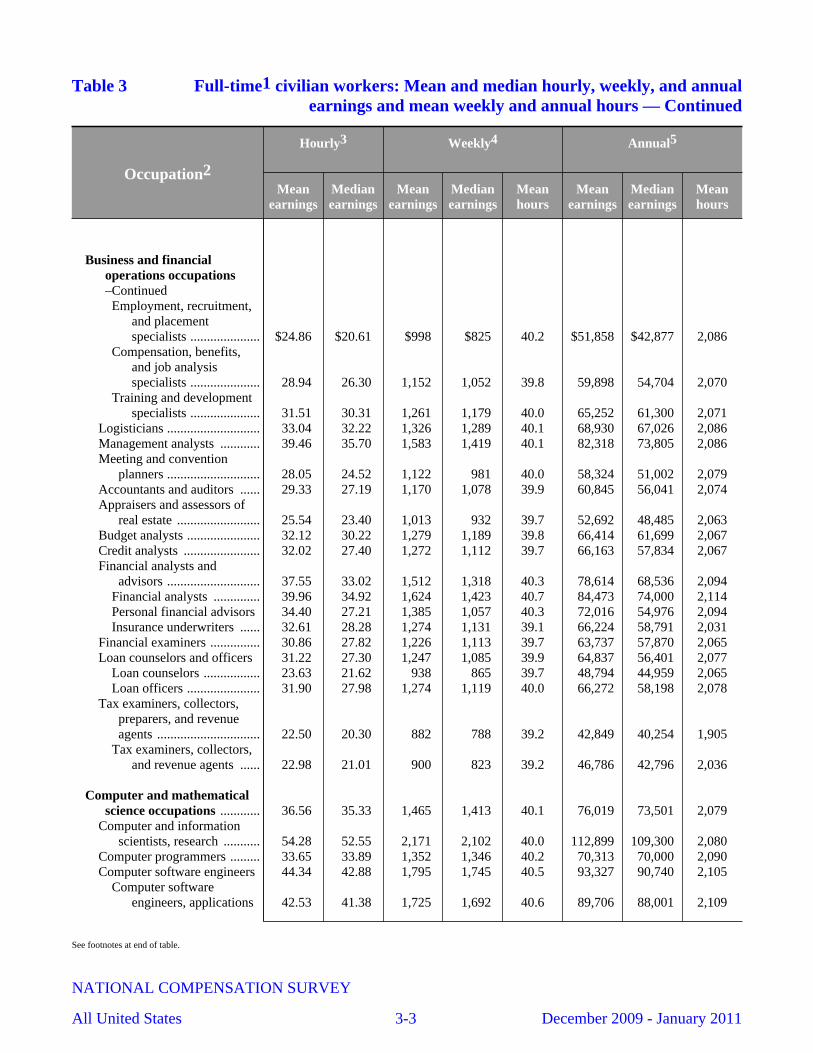
Table 3 Full-time1 civilian workers: Mean and median hourly, weekly, and annualearnings and mean weekly and annual hours — Continued
Occupation2
Hourly3 Weekly4 Annual5
Meanearnings
Medianearnings
Meanearnings
Medianearnings
Meanhours
Meanearnings
Medianearnings
Meanhours
Business and financialoperations occupations–ContinuedEmployment, recruitment,
and placementspecialists ..................... $24.86 $20.61 $998 $825 40.2 $51,858 $42,877 2,086
Compensation, benefits,and job analysisspecialists ..................... 28.94 26.30 1,152 1,052 39.8 59,898 54,704 2,070
Training and developmentspecialists ..................... 31.51 30.31 1,261 1,179 40.0 65,252 61,300 2,071
Logisticians ............................ 33.04 32.22 1,326 1,289 40.1 68,930 67,026 2,086Management analysts ............ 39.46 35.70 1,583 1,419 40.1 82,318 73,805 2,086Meeting and convention
planners ............................ 28.05 24.52 1,122 981 40.0 58,324 51,002 2,079Accountants and auditors ...... 29.33 27.19 1,170 1,078 39.9 60,845 56,041 2,074Appraisers and assessors of
real estate ......................... 25.54 23.40 1,013 932 39.7 52,692 48,485 2,063Budget analysts ...................... 32.12 30.22 1,279 1,189 39.8 66,414 61,699 2,067Credit analysts ....................... 32.02 27.40 1,272 1,112 39.7 66,163 57,834 2,067Financial analysts and
advisors ............................ 37.55 33.02 1,512 1,318 40.3 78,614 68,536 2,094Financial analysts .............. 39.96 34.92 1,624 1,423 40.7 84,473 74,000 2,114Personal financial advisors 34.40 27.21 1,385 1,057 40.3 72,016 54,976 2,094Insurance underwriters ...... 32.61 28.28 1,274 1,131 39.1 66,224 58,791 2,031
Financial examiners ............... 30.86 27.82 1,226 1,113 39.7 63,737 57,870 2,065Loan counselors and officers 31.22 27.30 1,247 1,085 39.9 64,837 56,401 2,077
Loan counselors ................. 23.63 21.62 938 865 39.7 48,794 44,959 2,065Loan officers ...................... 31.90 27.98 1,274 1,119 40.0 66,272 58,198 2,078
Tax examiners, collectors,preparers, and revenueagents ............................... 22.50 20.30 882 788 39.2 42,849 40,254 1,905
Tax examiners, collectors,and revenue agents ...... 22.98 21.01 900 823 39.2 46,786 42,796 2,036
Computer and mathematicalscience occupations ............ 36.56 35.33 1,465 1,413 40.1 76,019 73,501 2,079
Computer and informationscientists, research ........... 54.28 52.55 2,171 2,102 40.0 112,899 109,300 2,080
Computer programmers ......... 33.65 33.89 1,352 1,346 40.2 70,313 70,000 2,090Computer software engineers 44.34 42.88 1,795 1,745 40.5 93,327 90,740 2,105
Computer softwareengineers, applications 42.53 41.38 1,725 1,692 40.6 89,706 88,001 2,109
See footnotes at end of table.
NATIONAL COMPENSATION SURVEY
All United States 3-3 December 2009 - January 2011
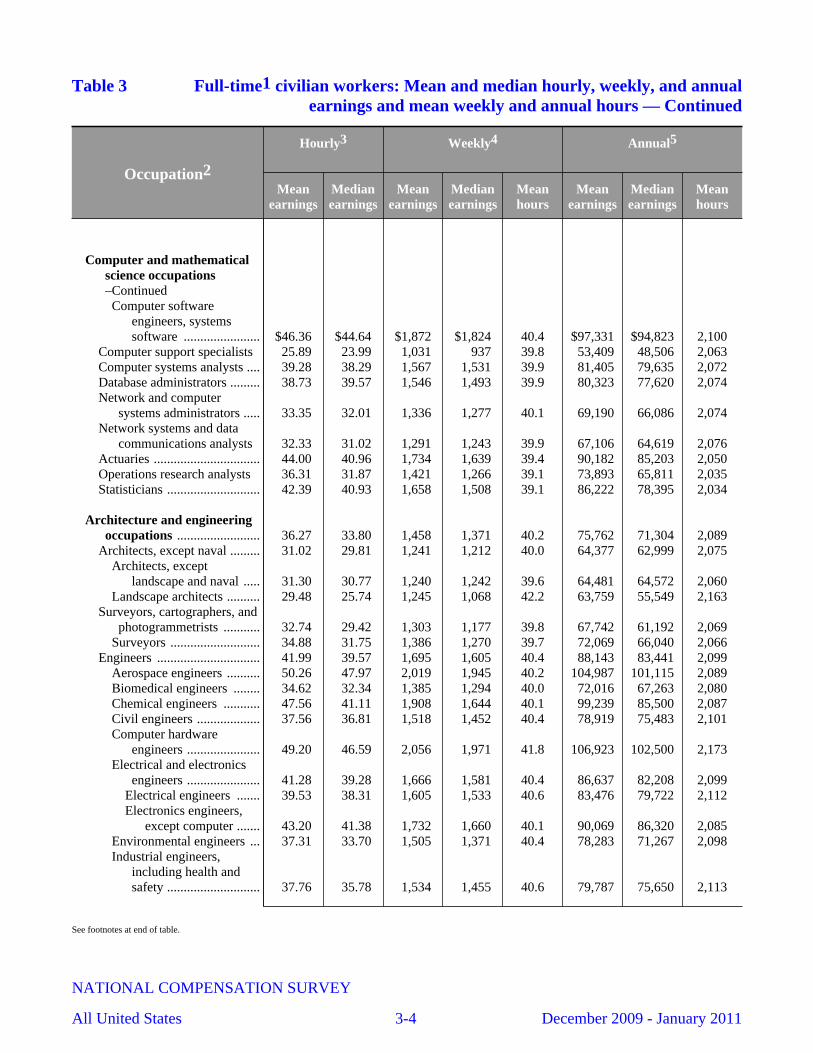
Table 3 Full-time1 civilian workers: Mean and median hourly, weekly, and annualearnings and mean weekly and annual hours — Continued
Occupation2
Hourly3 Weekly4 Annual5
Meanearnings
Medianearnings
Meanearnings
Medianearnings
Meanhours
Meanearnings
Medianearnings
Meanhours
Computer and mathematicalscience occupations–ContinuedComputer software
engineers, systemssoftware ....................... $46.36 $44.64 $1,872 $1,824 40.4 $97,331 $94,823 2,100
Computer support specialists 25.89 23.99 1,031 937 39.8 53,409 48,506 2,063Computer systems analysts .... 39.28 38.29 1,567 1,531 39.9 81,405 79,635 2,072Database administrators ......... 38.73 39.57 1,546 1,493 39.9 80,323 77,620 2,074Network and computer
systems administrators ..... 33.35 32.01 1,336 1,277 40.1 69,190 66,086 2,074Network systems and data
communications analysts 32.33 31.02 1,291 1,243 39.9 67,106 64,619 2,076Actuaries ................................ 44.00 40.96 1,734 1,639 39.4 90,182 85,203 2,050Operations research analysts 36.31 31.87 1,421 1,266 39.1 73,893 65,811 2,035Statisticians ............................ 42.39 40.93 1,658 1,508 39.1 86,222 78,395 2,034
Architecture and engineeringoccupations ......................... 36.27 33.80 1,458 1,371 40.2 75,762 71,304 2,089
Architects, except naval ......... 31.02 29.81 1,241 1,212 40.0 64,377 62,999 2,075Architects, except
landscape and naval ..... 31.30 30.77 1,240 1,242 39.6 64,481 64,572 2,060Landscape architects .......... 29.48 25.74 1,245 1,068 42.2 63,759 55,549 2,163
Surveyors, cartographers, andphotogrammetrists ........... 32.74 29.42 1,303 1,177 39.8 67,742 61,192 2,069
Surveyors ........................... 34.88 31.75 1,386 1,270 39.7 72,069 66,040 2,066Engineers ............................... 41.99 39.57 1,695 1,605 40.4 88,143 83,441 2,099
Aerospace engineers .......... 50.26 47.97 2,019 1,945 40.2 104,987 101,115 2,089Biomedical engineers ........ 34.62 32.34 1,385 1,294 40.0 72,016 67,263 2,080Chemical engineers ........... 47.56 41.11 1,908 1,644 40.1 99,239 85,500 2,087Civil engineers ................... 37.56 36.81 1,518 1,452 40.4 78,919 75,483 2,101Computer hardware
engineers ...................... 49.20 46.59 2,056 1,971 41.8 106,923 102,500 2,173Electrical and electronics
engineers ...................... 41.28 39.28 1,666 1,581 40.4 86,637 82,208 2,099Electrical engineers ....... 39.53 38.31 1,605 1,533 40.6 83,476 79,722 2,112Electronics engineers,
except computer ....... 43.20 41.38 1,732 1,660 40.1 90,069 86,320 2,085Environmental engineers ... 37.31 33.70 1,505 1,371 40.4 78,283 71,267 2,098Industrial engineers,
including health andsafety ............................ 37.76 35.78 1,534 1,455 40.6 79,787 75,650 2,113
See footnotes at end of table.
NATIONAL COMPENSATION SURVEY
All United States 3-4 December 2009 - January 2011

Table 3 Full-time1 civilian workers: Mean and median hourly, weekly, and annualearnings and mean weekly and annual hours — Continued
Occupation2
Hourly3 Weekly4 Annual5
Meanearnings
Medianearnings
Meanearnings
Medianearnings
Meanhours
Meanearnings
Medianearnings
Meanhours
Architecture and engineeringoccupations –Continued
Health and safetyengineers, exceptmining safetyengineers andinspectors ................. $41.86 $36.37 $1,684 $1,455 40.2 $87,557 $75,650 2,092
Industrial engineers ....... 36.51 35.37 1,488 1,458 40.8 77,382 75,833 2,120Materials engineers ............ 43.88 39.57 1,768 1,583 40.3 91,957 82,306 2,096Mechanical engineers ........ 38.67 36.94 1,560 1,496 40.3 81,053 77,719 2,096Mining and geological
engineers, includingmining safety engineers 46.74 39.67 1,870 1,587 40.0 97,267 82,512 2,081
Nuclear engineers .............. 45.62 44.62 1,825 1,785 40.0 94,881 92,801 2,080Petroleum engineers .......... 52.88 51.62 2,131 2,066 40.3 110,794 107,432 2,095
Drafters .................................. 25.89 23.60 1,026 943 39.6 53,367 49,044 2,062Architectural and civil
drafters ......................... 25.87 23.75 1,031 944 39.9 53,611 49,082 2,072Electrical and electronics
drafters ......................... 25.27 26.20 999 995 39.5 51,953 51,750 2,056Mechanical drafters ........... 23.84 23.08 952 923 39.9 49,516 48,000 2,077
Engineering technicians,except drafters ................. 26.19 25.59 1,048 1,022 40.0 54,405 53,040 2,077
Aerospace engineering andoperations technicians 30.34 29.94 1,214 1,198 40.0 63,112 62,284 2,080
Civil engineeringtechnicians ................... 20.19 18.76 806 751 39.9 41,895 39,027 2,075
Electrical and electronicengineering technicians 27.20 26.42 1,088 1,057 40.0 56,552 54,943 2,079
Electro-mechanicaltechnicians ................... 25.74 26.83 1,038 1,079 40.3 53,958 56,120 2,096
Environmental engineeringtechnicians ................... 22.36 19.23 894 769 40.0 46,502 40,000 2,080
Industrial engineeringtechnicians ................... 26.73 26.02 1,073 1,041 40.1 55,781 54,113 2,087
Mechanical engineeringtechnicians ................... 26.78 26.71 1,084 1,068 40.5 56,376 55,561 2,105
Surveying and mappingtechnicians ....................... 22.80 20.20 911 808 40.0 47,272 42,010 2,073
Life, physical, and socialscience occupations ............ 32.10 28.12 1,266 1,102 39.4 64,977 56,992 2,024
Life scientists ......................... 35.44 31.03 1,384 1,238 39.1 71,354 63,586 2,013
See footnotes at end of table.
NATIONAL COMPENSATION SURVEY
All United States 3-5 December 2009 - January 2011
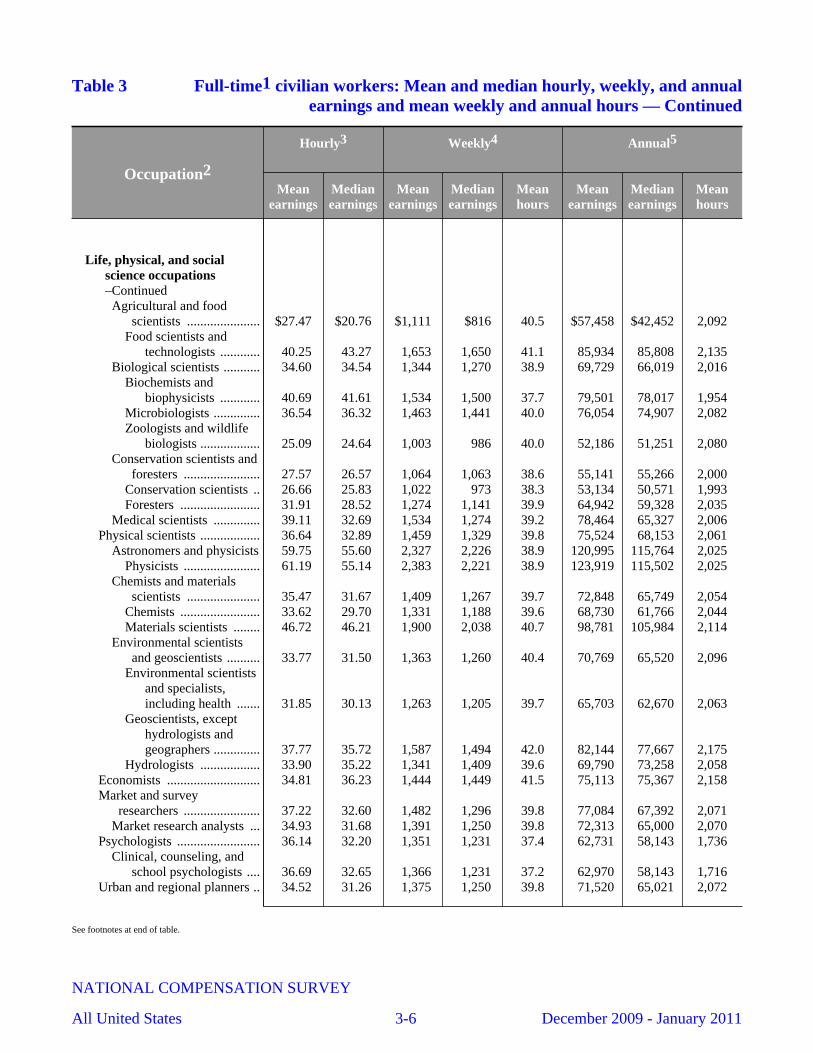
Table 3 Full-time1 civilian workers: Mean and median hourly, weekly, and annualearnings and mean weekly and annual hours — Continued
Occupation2
Hourly3 Weekly4 Annual5
Meanearnings
Medianearnings
Meanearnings
Medianearnings
Meanhours
Meanearnings
Medianearnings
Meanhours
Life, physical, and socialscience occupations–ContinuedAgricultural and food
scientists ...................... $27.47 $20.76 $1,111 $816 40.5 $57,458 $42,452 2,092Food scientists and
technologists ............ 40.25 43.27 1,653 1,650 41.1 85,934 85,808 2,135Biological scientists ........... 34.60 34.54 1,344 1,270 38.9 69,729 66,019 2,016
Biochemists andbiophysicists ............ 40.69 41.61 1,534 1,500 37.7 79,501 78,017 1,954
Microbiologists .............. 36.54 36.32 1,463 1,441 40.0 76,054 74,907 2,082Zoologists and wildlife
biologists .................. 25.09 24.64 1,003 986 40.0 52,186 51,251 2,080Conservation scientists and
foresters ....................... 27.57 26.57 1,064 1,063 38.6 55,141 55,266 2,000Conservation scientists .. 26.66 25.83 1,022 973 38.3 53,134 50,571 1,993Foresters ........................ 31.91 28.52 1,274 1,141 39.9 64,942 59,328 2,035
Medical scientists .............. 39.11 32.69 1,534 1,274 39.2 78,464 65,327 2,006Physical scientists .................. 36.64 32.89 1,459 1,329 39.8 75,524 68,153 2,061
Astronomers and physicists 59.75 55.60 2,327 2,226 38.9 120,995 115,764 2,025Physicists ....................... 61.19 55.14 2,383 2,221 38.9 123,919 115,502 2,025
Chemists and materialsscientists ...................... 35.47 31.67 1,409 1,267 39.7 72,848 65,749 2,054
Chemists ........................ 33.62 29.70 1,331 1,188 39.6 68,730 61,766 2,044Materials scientists ........ 46.72 46.21 1,900 2,038 40.7 98,781 105,984 2,114
Environmental scientistsand geoscientists .......... 33.77 31.50 1,363 1,260 40.4 70,769 65,520 2,096
Environmental scientistsand specialists,including health ....... 31.85 30.13 1,263 1,205 39.7 65,703 62,670 2,063
Geoscientists, excepthydrologists andgeographers .............. 37.77 35.72 1,587 1,494 42.0 82,144 77,667 2,175
Hydrologists .................. 33.90 35.22 1,341 1,409 39.6 69,790 73,258 2,058Economists ............................ 34.81 36.23 1,444 1,449 41.5 75,113 75,367 2,158Market and survey
researchers ....................... 37.22 32.60 1,482 1,296 39.8 77,084 67,392 2,071Market research analysts ... 34.93 31.68 1,391 1,250 39.8 72,313 65,000 2,070
Psychologists ......................... 36.14 32.20 1,351 1,231 37.4 62,731 58,143 1,736Clinical, counseling, and
school psychologists .... 36.69 32.65 1,366 1,231 37.2 62,970 58,143 1,716Urban and regional planners .. 34.52 31.26 1,375 1,250 39.8 71,520 65,021 2,072
See footnotes at end of table.
NATIONAL COMPENSATION SURVEY
All United States 3-6 December 2009 - January 2011
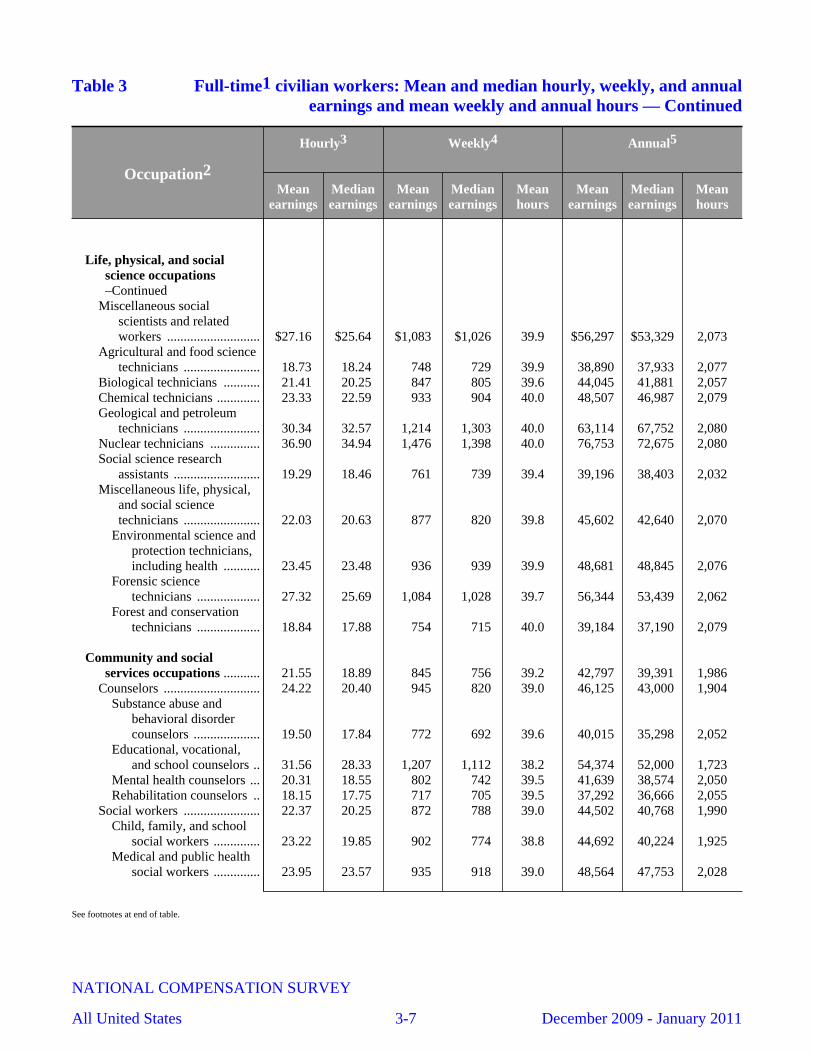
Table 3 Full-time1 civilian workers: Mean and median hourly, weekly, and annualearnings and mean weekly and annual hours — Continued
Occupation2
Hourly3 Weekly4 Annual5
Meanearnings
Medianearnings
Meanearnings
Medianearnings
Meanhours
Meanearnings
Medianearnings
Meanhours
Life, physical, and socialscience occupations–Continued
Miscellaneous socialscientists and relatedworkers ............................ $27.16 $25.64 $1,083 $1,026 39.9 $56,297 $53,329 2,073
Agricultural and food sciencetechnicians ....................... 18.73 18.24 748 729 39.9 38,890 37,933 2,077
Biological technicians ........... 21.41 20.25 847 805 39.6 44,045 41,881 2,057Chemical technicians ............. 23.33 22.59 933 904 40.0 48,507 46,987 2,079Geological and petroleum
technicians ....................... 30.34 32.57 1,214 1,303 40.0 63,114 67,752 2,080Nuclear technicians ............... 36.90 34.94 1,476 1,398 40.0 76,753 72,675 2,080Social science research
assistants .......................... 19.29 18.46 761 739 39.4 39,196 38,403 2,032Miscellaneous life, physical,
and social sciencetechnicians ....................... 22.03 20.63 877 820 39.8 45,602 42,640 2,070
Environmental science andprotection technicians,including health ........... 23.45 23.48 936 939 39.9 48,681 48,845 2,076
Forensic sciencetechnicians ................... 27.32 25.69 1,084 1,028 39.7 56,344 53,439 2,062
Forest and conservationtechnicians ................... 18.84 17.88 754 715 40.0 39,184 37,190 2,079
Community and socialservices occupations ........... 21.55 18.89 845 756 39.2 42,797 39,391 1,986
Counselors ............................. 24.22 20.40 945 820 39.0 46,125 43,000 1,904Substance abuse and
behavioral disordercounselors .................... 19.50 17.84 772 692 39.6 40,015 35,298 2,052
Educational, vocational,and school counselors .. 31.56 28.33 1,207 1,112 38.2 54,374 52,000 1,723
Mental health counselors ... 20.31 18.55 802 742 39.5 41,639 38,574 2,050Rehabilitation counselors .. 18.15 17.75 717 705 39.5 37,292 36,666 2,055
Social workers ....................... 22.37 20.25 872 788 39.0 44,502 40,768 1,990Child, family, and school
social workers .............. 23.22 19.85 902 774 38.8 44,692 40,224 1,925Medical and public health
social workers .............. 23.95 23.57 935 918 39.0 48,564 47,753 2,028
See footnotes at end of table.
NATIONAL COMPENSATION SURVEY
All United States 3-7 December 2009 - January 2011
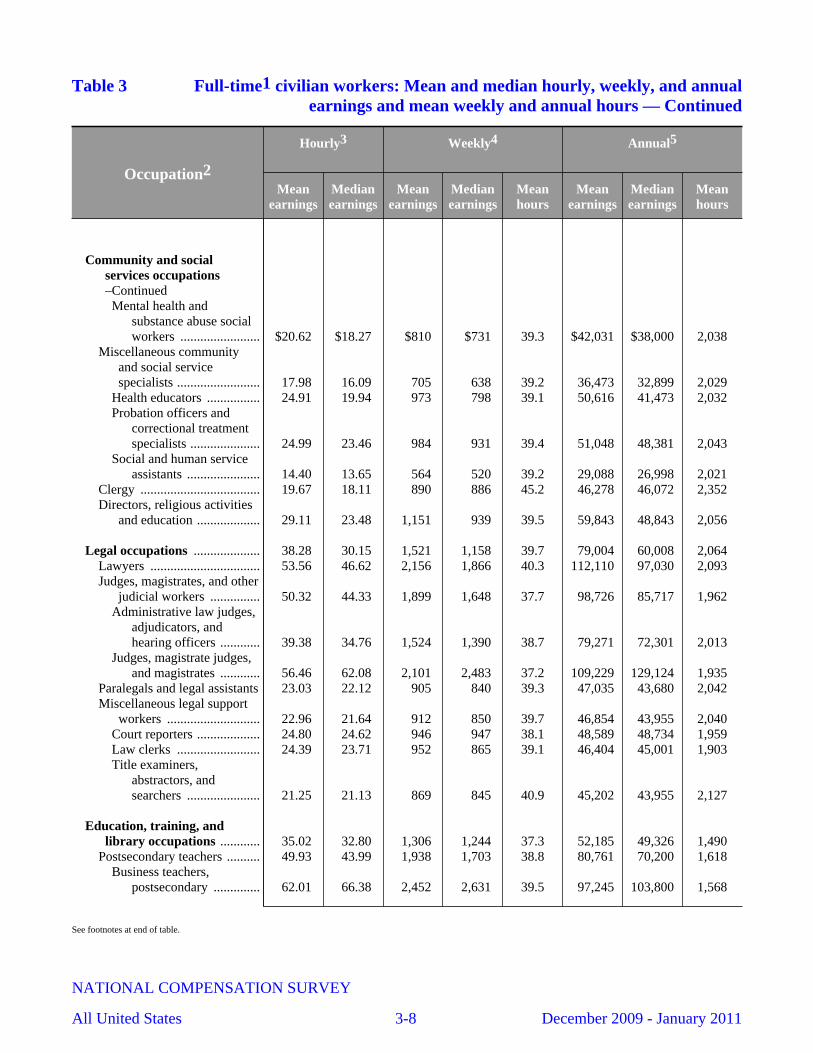
Table 3 Full-time1 civilian workers: Mean and median hourly, weekly, and annualearnings and mean weekly and annual hours — Continued
Occupation2
Hourly3 Weekly4 Annual5
Meanearnings
Medianearnings
Meanearnings
Medianearnings
Meanhours
Meanearnings
Medianearnings
Meanhours
Community and socialservices occupations–ContinuedMental health and
substance abuse socialworkers ........................ $20.62 $18.27 $810 $731 39.3 $42,031 $38,000 2,038
Miscellaneous communityand social servicespecialists ......................... 17.98 16.09 705 638 39.2 36,473 32,899 2,029
Health educators ................ 24.91 19.94 973 798 39.1 50,616 41,473 2,032Probation officers and
correctional treatmentspecialists ..................... 24.99 23.46 984 931 39.4 51,048 48,381 2,043
Social and human serviceassistants ...................... 14.40 13.65 564 520 39.2 29,088 26,998 2,021
Clergy .................................... 19.67 18.11 890 886 45.2 46,278 46,072 2,352Directors, religious activities
and education ................... 29.11 23.48 1,151 939 39.5 59,843 48,843 2,056
Legal occupations .................... 38.28 30.15 1,521 1,158 39.7 79,004 60,008 2,064Lawyers ................................. 53.56 46.62 2,156 1,866 40.3 112,110 97,030 2,093Judges, magistrates, and other
judicial workers ............... 50.32 44.33 1,899 1,648 37.7 98,726 85,717 1,962Administrative law judges,
adjudicators, andhearing officers ............ 39.38 34.76 1,524 1,390 38.7 79,271 72,301 2,013
Judges, magistrate judges,and magistrates ............ 56.46 62.08 2,101 2,483 37.2 109,229 129,124 1,935
Paralegals and legal assistants 23.03 22.12 905 840 39.3 47,035 43,680 2,042Miscellaneous legal support
workers ............................ 22.96 21.64 912 850 39.7 46,854 43,955 2,040Court reporters ................... 24.80 24.62 946 947 38.1 48,589 48,734 1,959Law clerks ......................... 24.39 23.71 952 865 39.1 46,404 45,001 1,903Title examiners,
abstractors, andsearchers ...................... 21.25 21.13 869 845 40.9 45,202 43,955 2,127
Education, training, andlibrary occupations ............ 35.02 32.80 1,306 1,244 37.3 52,185 49,326 1,490
Postsecondary teachers .......... 49.93 43.99 1,938 1,703 38.8 80,761 70,200 1,618Business teachers,
postsecondary .............. 62.01 66.38 2,452 2,631 39.5 97,245 103,800 1,568
See footnotes at end of table.
NATIONAL COMPENSATION SURVEY
All United States 3-8 December 2009 - January 2011
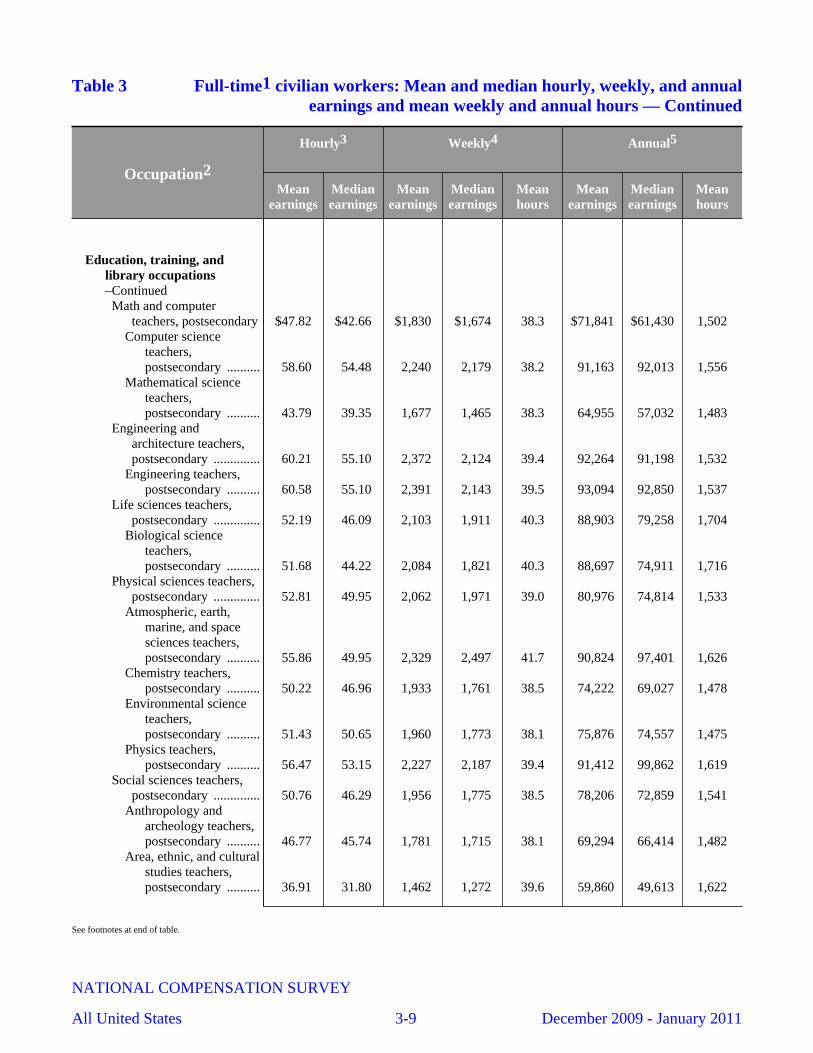
Table 3 Full-time1 civilian workers: Mean and median hourly, weekly, and annualearnings and mean weekly and annual hours — Continued
Occupation2
Hourly3 Weekly4 Annual5
Meanearnings
Medianearnings
Meanearnings
Medianearnings
Meanhours
Meanearnings
Medianearnings
Meanhours
Education, training, andlibrary occupations–ContinuedMath and computer
teachers, postsecondary $47.82 $42.66 $1,830 $1,674 38.3 $71,841 $61,430 1,502Computer science
teachers,postsecondary .......... 58.60 54.48 2,240 2,179 38.2 91,163 92,013 1,556
Mathematical scienceteachers,postsecondary .......... 43.79 39.35 1,677 1,465 38.3 64,955 57,032 1,483
Engineering andarchitecture teachers,postsecondary .............. 60.21 55.10 2,372 2,124 39.4 92,264 91,198 1,532
Engineering teachers,postsecondary .......... 60.58 55.10 2,391 2,143 39.5 93,094 92,850 1,537
Life sciences teachers,postsecondary .............. 52.19 46.09 2,103 1,911 40.3 88,903 79,258 1,704
Biological scienceteachers,postsecondary .......... 51.68 44.22 2,084 1,821 40.3 88,697 74,911 1,716
Physical sciences teachers,postsecondary .............. 52.81 49.95 2,062 1,971 39.0 80,976 74,814 1,533
Atmospheric, earth,marine, and spacesciences teachers,postsecondary .......... 55.86 49.95 2,329 2,497 41.7 90,824 97,401 1,626
Chemistry teachers,postsecondary .......... 50.22 46.96 1,933 1,761 38.5 74,222 69,027 1,478
Environmental scienceteachers,postsecondary .......... 51.43 50.65 1,960 1,773 38.1 75,876 74,557 1,475
Physics teachers,postsecondary .......... 56.47 53.15 2,227 2,187 39.4 91,412 99,862 1,619
Social sciences teachers,postsecondary .............. 50.76 46.29 1,956 1,775 38.5 78,206 72,859 1,541
Anthropology andarcheology teachers,postsecondary .......... 46.77 45.74 1,781 1,715 38.1 69,294 66,414 1,482
Area, ethnic, and culturalstudies teachers,postsecondary .......... 36.91 31.80 1,462 1,272 39.6 59,860 49,613 1,622
See footnotes at end of table.
NATIONAL COMPENSATION SURVEY
All United States 3-9 December 2009 - January 2011
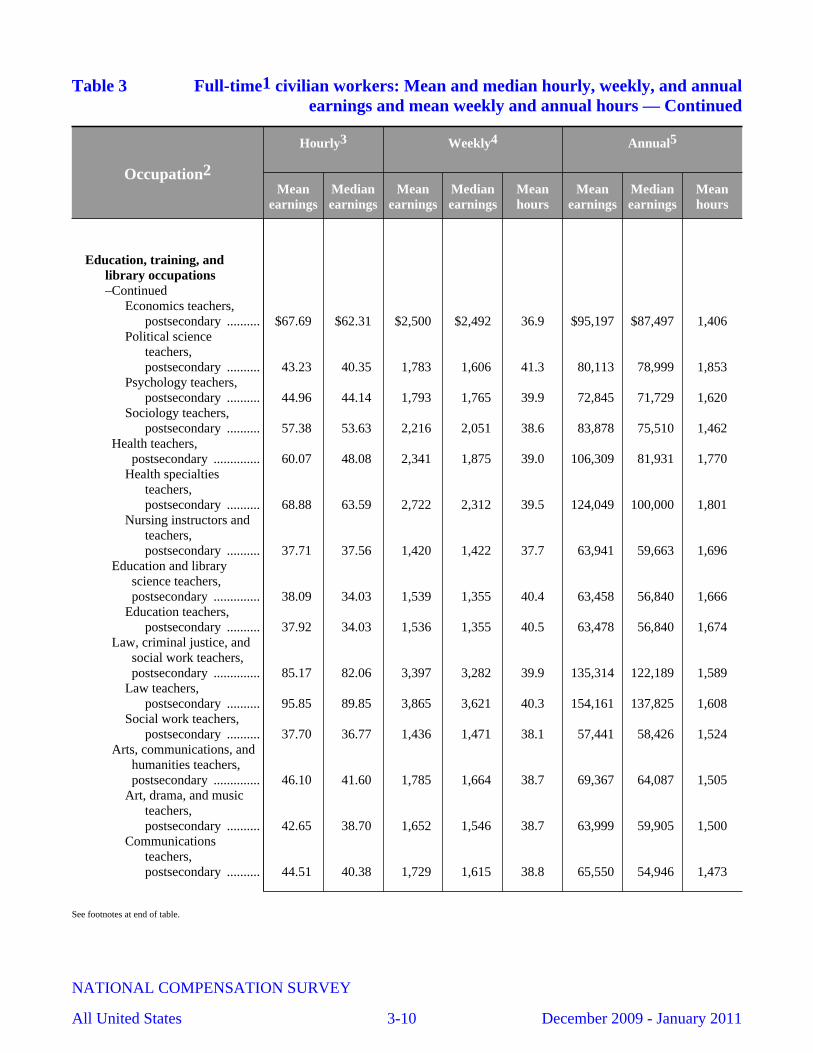
Table 3 Full-time1 civilian workers: Mean and median hourly, weekly, and annualearnings and mean weekly and annual hours — Continued
Occupation2
Hourly3 Weekly4 Annual5
Meanearnings
Medianearnings
Meanearnings
Medianearnings
Meanhours
Meanearnings
Medianearnings
Meanhours
Education, training, andlibrary occupations–Continued
Economics teachers,postsecondary .......... $67.69 $62.31 $2,500 $2,492 36.9 $95,197 $87,497 1,406
Political scienceteachers,postsecondary .......... 43.23 40.35 1,783 1,606 41.3 80,113 78,999 1,853
Psychology teachers,postsecondary .......... 44.96 44.14 1,793 1,765 39.9 72,845 71,729 1,620
Sociology teachers,postsecondary .......... 57.38 53.63 2,216 2,051 38.6 83,878 75,510 1,462
Health teachers,postsecondary .............. 60.07 48.08 2,341 1,875 39.0 106,309 81,931 1,770
Health specialtiesteachers,postsecondary .......... 68.88 63.59 2,722 2,312 39.5 124,049 100,000 1,801
Nursing instructors andteachers,postsecondary .......... 37.71 37.56 1,420 1,422 37.7 63,941 59,663 1,696
Education and libraryscience teachers,postsecondary .............. 38.09 34.03 1,539 1,355 40.4 63,458 56,840 1,666
Education teachers,postsecondary .......... 37.92 34.03 1,536 1,355 40.5 63,478 56,840 1,674
Law, criminal justice, andsocial work teachers,postsecondary .............. 85.17 82.06 3,397 3,282 39.9 135,314 122,189 1,589
Law teachers,postsecondary .......... 95.85 89.85 3,865 3,621 40.3 154,161 137,825 1,608
Social work teachers,postsecondary .......... 37.70 36.77 1,436 1,471 38.1 57,441 58,426 1,524
Arts, communications, andhumanities teachers,postsecondary .............. 46.10 41.60 1,785 1,664 38.7 69,367 64,087 1,505
Art, drama, and musicteachers,postsecondary .......... 42.65 38.70 1,652 1,546 38.7 63,999 59,905 1,500
Communicationsteachers,postsecondary .......... 44.51 40.38 1,729 1,615 38.8 65,550 54,946 1,473
See footnotes at end of table.
NATIONAL COMPENSATION SURVEY
All United States 3-10 December 2009 - January 2011
Table 3 Full-time1 civilian workers: Mean and median hourly, weekly, and annualearnings and mean weekly and annual hours — Continued
Occupation2
Hourly3 Weekly4 Annual5
Meanearnings
Medianearnings
Meanearnings
Medianearnings
Meanhours
Meanearnings
Medianearnings
Meanhours
Education, training, andlibrary occupations–Continued
English language andliterature teachers,postsecondary .......... $45.44 $42.91 $1,734 $1,717 38.2 $67,953 $67,167 1,496
Foreign language andliterature teachers,postsecondary .......... 52.67 52.97 2,071 2,021 39.3 80,024 77,001 1,519
History teachers,postsecondary .......... 50.11 46.91 1,963 1,831 39.2 77,023 73,414 1,537
Philosophy and religionteachers,postsecondary .......... 42.93 38.39 1,653 1,536 38.5 63,971 59,890 1,490
Miscellaneouspostsecondary teachers 39.84 36.23 1,516 1,385 38.1 65,890 60,601 1,654
Recreation and fitnessstudies teachers,postsecondary .......... 36.69 33.38 1,453 1,335 39.6 56,685 50,399 1,545
Vocational educationteachers,postsecondary .......... 29.39 25.29 1,108 989 37.7 52,083 50,251 1,772
Primary, secondary, andspecial education schoolteachers ............................ 37.05 35.11 1,370 1,327 37.0 52,748 50,688 1,424
Preschool and kindergartenteachers ........................ 22.92 16.98 852 685 37.2 37,479 34,754 1,635
Preschool teachers,except specialeducation .................. 17.40 14.00 644 553 37.0 30,494 28,303 1,752
Kindergarten teachers,except specialeducation .................. 35.20 33.54 1,321 1,259 37.5 50,108 47,360 1,423
Elementary and middleschool teachers ............. 38.39 35.96 1,414 1,353 36.8 53,681 51,373 1,398
Elementary schoolteachers, exceptspecial education ..... 38.58 36.21 1,418 1,362 36.8 53,831 51,718 1,395
Middle school teachers,except special andvocational education 37.73 35.38 1,400 1,338 37.1 53,141 50,600 1,409
Secondary school teachers 38.38 35.94 1,430 1,370 37.3 54,320 52,150 1,415
See footnotes at end of table.
NATIONAL COMPENSATION SURVEY
All United States 3-11 December 2009 - January 2011

Table 3 Full-time1 civilian workers: Mean and median hourly, weekly, and annualearnings and mean weekly and annual hours — Continued
Occupation2
Hourly3 Weekly4 Annual5
Meanearnings
Medianearnings
Meanearnings
Medianearnings
Meanhours
Meanearnings
Medianearnings
Meanhours
Education, training, andlibrary occupations–Continued
Secondary schoolteachers, exceptspecial andvocational education $38.51 $35.94 $1,435 $1,374 37.3 $54,374 $52,004 1,412
Vocational educationteachers, secondaryschool ....................... 36.67 35.95 1,357 1,348 37.0 53,595 53,068 1,462
Special education teachers 38.70 35.73 1,427 1,349 36.9 55,198 51,826 1,426Special education
teachers, preschool,kindergarten, andelementary school .... 37.72 35.32 1,392 1,332 36.9 54,405 51,373 1,443
Special educationteachers, middleschool ....................... 38.71 35.73 1,435 1,370 37.1 54,300 51,946 1,403
Special educationteachers, secondaryschool ....................... 40.78 37.09 1,497 1,376 36.7 57,264 52,335 1,404
Other teachers and instructors 32.92 30.34 1,222 1,149 37.1 50,498 46,840 1,534Adult literacy, remedial
education, and GEDteachers and instructors 28.91 23.80 1,044 947 36.1 45,245 39,897 1,565
Self-enrichment educationteachers ........................ 27.10 25.14 1,029 827 38.0 44,940 43,000 1,658
Archivists, curators, andmuseum technicians ......... 28.93 27.80 1,144 1,183 39.5 59,479 61,514 2,056
Archivists ........................... 27.16 23.42 1,085 937 39.9 56,409 48,714 2,077Curators ............................. 31.47 31.04 1,241 1,241 39.4 64,549 64,555 2,051
Librarians ............................... 30.17 27.35 1,156 1,055 38.3 54,878 52,027 1,819Library technicians ................ 17.08 15.72 661 608 38.7 32,545 31,044 1,906Farm and home management
advisors ............................ 21.35 21.04 936 958 43.9 48,695 49,804 2,280Instructional coordinators ...... 34.88 32.62 1,349 1,244 38.7 62,640 58,474 1,796Teacher assistants .................. 13.39 12.55 484 462 36.1 19,597 18,793 1,463
Arts, design, entertainment,sports, and mediaoccupations ......................... 28.56 24.27 1,131 961 39.6 58,498 49,833 2,048
Artists and related workers .... 30.20 26.11 1,216 1,058 40.3 63,228 54,999 2,094Art directors ....................... 35.07 30.49 1,397 1,244 39.8 72,624 64,669 2,071
See footnotes at end of table.
NATIONAL COMPENSATION SURVEY
All United States 3-12 December 2009 - January 2011
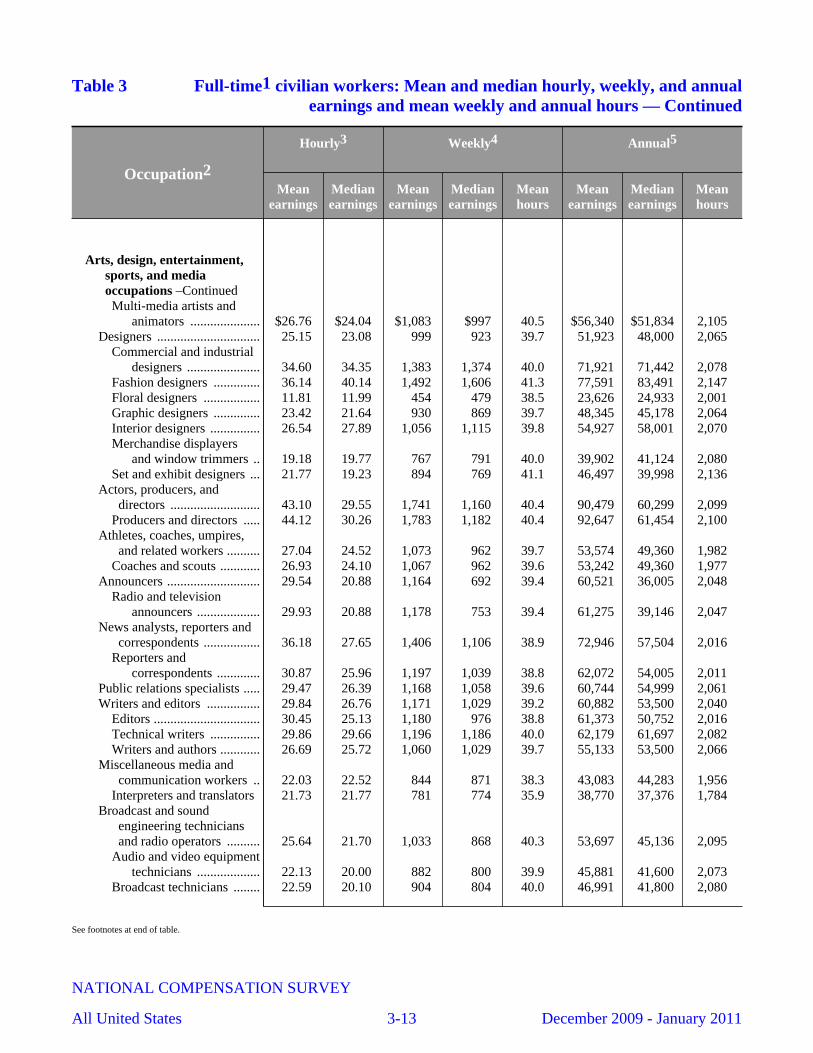
Table 3 Full-time1 civilian workers: Mean and median hourly, weekly, and annualearnings and mean weekly and annual hours — Continued
Occupation2
Hourly3 Weekly4 Annual5
Meanearnings
Medianearnings
Meanearnings
Medianearnings
Meanhours
Meanearnings
Medianearnings
Meanhours
Arts, design, entertainment,sports, and mediaoccupations –ContinuedMulti-media artists and
animators ..................... $26.76 $24.04 $1,083 $997 40.5 $56,340 $51,834 2,105Designers ............................... 25.15 23.08 999 923 39.7 51,923 48,000 2,065
Commercial and industrialdesigners ...................... 34.60 34.35 1,383 1,374 40.0 71,921 71,442 2,078
Fashion designers .............. 36.14 40.14 1,492 1,606 41.3 77,591 83,491 2,147Floral designers ................. 11.81 11.99 454 479 38.5 23,626 24,933 2,001Graphic designers .............. 23.42 21.64 930 869 39.7 48,345 45,178 2,064Interior designers ............... 26.54 27.89 1,056 1,115 39.8 54,927 58,001 2,070Merchandise displayers
and window trimmers .. 19.18 19.77 767 791 40.0 39,902 41,124 2,080Set and exhibit designers ... 21.77 19.23 894 769 41.1 46,497 39,998 2,136
Actors, producers, anddirectors ........................... 43.10 29.55 1,741 1,160 40.4 90,479 60,299 2,099
Producers and directors ..... 44.12 30.26 1,783 1,182 40.4 92,647 61,454 2,100Athletes, coaches, umpires,
and related workers .......... 27.04 24.52 1,073 962 39.7 53,574 49,360 1,982Coaches and scouts ............ 26.93 24.10 1,067 962 39.6 53,242 49,360 1,977
Announcers ............................ 29.54 20.88 1,164 692 39.4 60,521 36,005 2,048Radio and television
announcers ................... 29.93 20.88 1,178 753 39.4 61,275 39,146 2,047News analysts, reporters and
correspondents ................. 36.18 27.65 1,406 1,106 38.9 72,946 57,504 2,016Reporters and
correspondents ............. 30.87 25.96 1,197 1,039 38.8 62,072 54,005 2,011Public relations specialists ..... 29.47 26.39 1,168 1,058 39.6 60,744 54,999 2,061Writers and editors ................ 29.84 26.76 1,171 1,029 39.2 60,882 53,500 2,040
Editors ................................ 30.45 25.13 1,180 976 38.8 61,373 50,752 2,016Technical writers ............... 29.86 29.66 1,196 1,186 40.0 62,179 61,697 2,082Writers and authors ............ 26.69 25.72 1,060 1,029 39.7 55,133 53,500 2,066
Miscellaneous media andcommunication workers .. 22.03 22.52 844 871 38.3 43,083 44,283 1,956
Interpreters and translators 21.73 21.77 781 774 35.9 38,770 37,376 1,784Broadcast and sound
engineering techniciansand radio operators .......... 25.64 21.70 1,033 868 40.3 53,697 45,136 2,095
Audio and video equipmenttechnicians ................... 22.13 20.00 882 800 39.9 45,881 41,600 2,073
Broadcast technicians ........ 22.59 20.10 904 804 40.0 46,991 41,800 2,080
See footnotes at end of table.
NATIONAL COMPENSATION SURVEY
All United States 3-13 December 2009 - January 2011
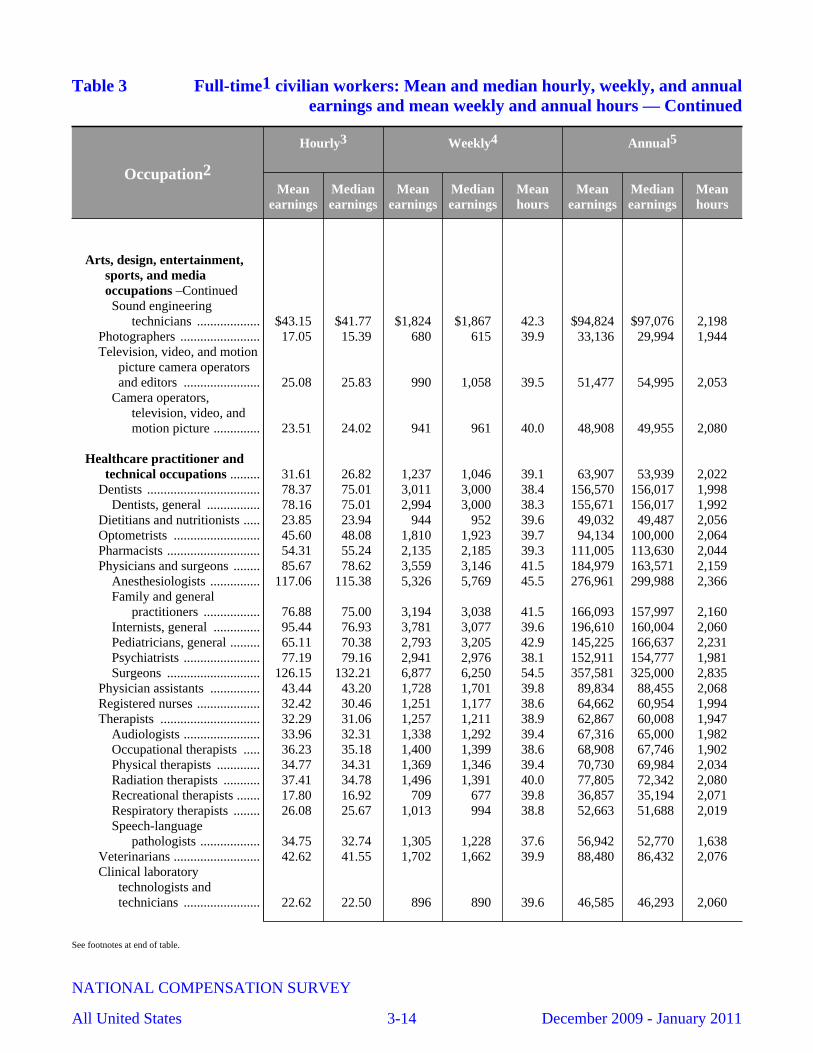
Table 3 Full-time1 civilian workers: Mean and median hourly, weekly, and annualearnings and mean weekly and annual hours — Continued
Occupation2
Hourly3 Weekly4 Annual5
Meanearnings
Medianearnings
Meanearnings
Medianearnings
Meanhours
Meanearnings
Medianearnings
Meanhours
Arts, design, entertainment,sports, and mediaoccupations –ContinuedSound engineering
technicians ................... $43.15 $41.77 $1,824 $1,867 42.3 $94,824 $97,076 2,198Photographers ........................ 17.05 15.39 680 615 39.9 33,136 29,994 1,944Television, video, and motion
picture camera operatorsand editors ....................... 25.08 25.83 990 1,058 39.5 51,477 54,995 2,053
Camera operators,television, video, andmotion picture .............. 23.51 24.02 941 961 40.0 48,908 49,955 2,080
Healthcare practitioner andtechnical occupations ......... 31.61 26.82 1,237 1,046 39.1 63,907 53,939 2,022
Dentists .................................. 78.37 75.01 3,011 3,000 38.4 156,570 156,017 1,998Dentists, general ................ 78.16 75.01 2,994 3,000 38.3 155,671 156,017 1,992
Dietitians and nutritionists ..... 23.85 23.94 944 952 39.6 49,032 49,487 2,056Optometrists .......................... 45.60 48.08 1,810 1,923 39.7 94,134 100,000 2,064Pharmacists ............................ 54.31 55.24 2,135 2,185 39.3 111,005 113,630 2,044Physicians and surgeons ........ 85.67 78.62 3,559 3,146 41.5 184,979 163,571 2,159
Anesthesiologists ............... 117.06 115.38 5,326 5,769 45.5 276,961 299,988 2,366Family and general
practitioners ................. 76.88 75.00 3,194 3,038 41.5 166,093 157,997 2,160Internists, general .............. 95.44 76.93 3,781 3,077 39.6 196,610 160,004 2,060Pediatricians, general ......... 65.11 70.38 2,793 3,205 42.9 145,225 166,637 2,231Psychiatrists ....................... 77.19 79.16 2,941 2,976 38.1 152,911 154,777 1,981Surgeons ............................ 126.15 132.21 6,877 6,250 54.5 357,581 325,000 2,835
Physician assistants ............... 43.44 43.20 1,728 1,701 39.8 89,834 88,455 2,068Registered nurses ................... 32.42 30.46 1,251 1,177 38.6 64,662 60,954 1,994Therapists .............................. 32.29 31.06 1,257 1,211 38.9 62,867 60,008 1,947
Audiologists ....................... 33.96 32.31 1,338 1,292 39.4 67,316 65,000 1,982Occupational therapists ..... 36.23 35.18 1,400 1,399 38.6 68,908 67,746 1,902Physical therapists ............. 34.77 34.31 1,369 1,346 39.4 70,730 69,984 2,034Radiation therapists ........... 37.41 34.78 1,496 1,391 40.0 77,805 72,342 2,080Recreational therapists ....... 17.80 16.92 709 677 39.8 36,857 35,194 2,071Respiratory therapists ........ 26.08 25.67 1,013 994 38.8 52,663 51,688 2,019Speech-language
pathologists .................. 34.75 32.74 1,305 1,228 37.6 56,942 52,770 1,638Veterinarians .......................... 42.62 41.55 1,702 1,662 39.9 88,480 86,432 2,076Clinical laboratory
technologists andtechnicians ....................... 22.62 22.50 896 890 39.6 46,585 46,293 2,060
See footnotes at end of table.
NATIONAL COMPENSATION SURVEY
All United States 3-14 December 2009 - January 2011
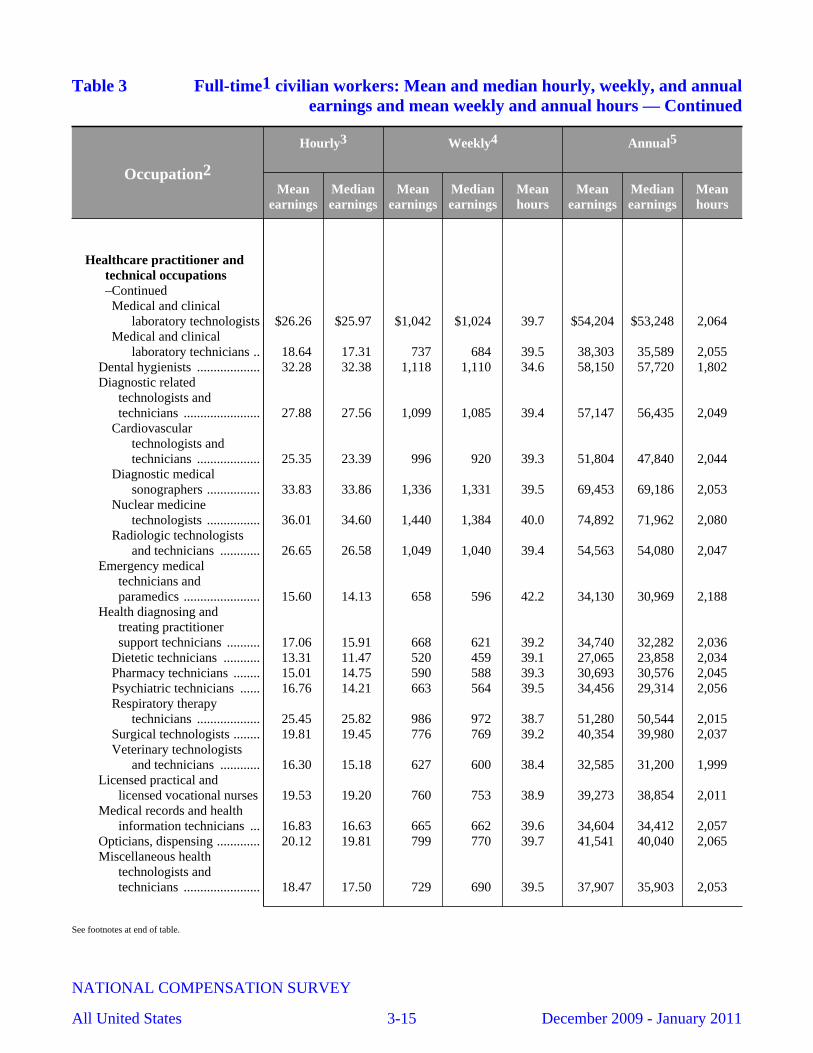
Table 3 Full-time1 civilian workers: Mean and median hourly, weekly, and annualearnings and mean weekly and annual hours — Continued
Occupation2
Hourly3 Weekly4 Annual5
Meanearnings
Medianearnings
Meanearnings
Medianearnings
Meanhours
Meanearnings
Medianearnings
Meanhours
Healthcare practitioner andtechnical occupations–ContinuedMedical and clinical
laboratory technologists $26.26 $25.97 $1,042 $1,024 39.7 $54,204 $53,248 2,064Medical and clinical
laboratory technicians .. 18.64 17.31 737 684 39.5 38,303 35,589 2,055Dental hygienists ................... 32.28 32.38 1,118 1,110 34.6 58,150 57,720 1,802Diagnostic related
technologists andtechnicians ....................... 27.88 27.56 1,099 1,085 39.4 57,147 56,435 2,049
Cardiovasculartechnologists andtechnicians ................... 25.35 23.39 996 920 39.3 51,804 47,840 2,044
Diagnostic medicalsonographers ................ 33.83 33.86 1,336 1,331 39.5 69,453 69,186 2,053
Nuclear medicinetechnologists ................ 36.01 34.60 1,440 1,384 40.0 74,892 71,962 2,080
Radiologic technologistsand technicians ............ 26.65 26.58 1,049 1,040 39.4 54,563 54,080 2,047
Emergency medicaltechnicians andparamedics ....................... 15.60 14.13 658 596 42.2 34,130 30,969 2,188
Health diagnosing andtreating practitionersupport technicians .......... 17.06 15.91 668 621 39.2 34,740 32,282 2,036
Dietetic technicians ........... 13.31 11.47 520 459 39.1 27,065 23,858 2,034Pharmacy technicians ........ 15.01 14.75 590 588 39.3 30,693 30,576 2,045Psychiatric technicians ...... 16.76 14.21 663 564 39.5 34,456 29,314 2,056Respiratory therapy
technicians ................... 25.45 25.82 986 972 38.7 51,280 50,544 2,015Surgical technologists ........ 19.81 19.45 776 769 39.2 40,354 39,980 2,037Veterinary technologists
and technicians ............ 16.30 15.18 627 600 38.4 32,585 31,200 1,999Licensed practical and
licensed vocational nurses 19.53 19.20 760 753 38.9 39,273 38,854 2,011Medical records and health
information technicians ... 16.83 16.63 665 662 39.6 34,604 34,412 2,057Opticians, dispensing ............. 20.12 19.81 799 770 39.7 41,541 40,040 2,065Miscellaneous health
technologists andtechnicians ....................... 18.47 17.50 729 690 39.5 37,907 35,903 2,053
See footnotes at end of table.
NATIONAL COMPENSATION SURVEY
All United States 3-15 December 2009 - January 2011
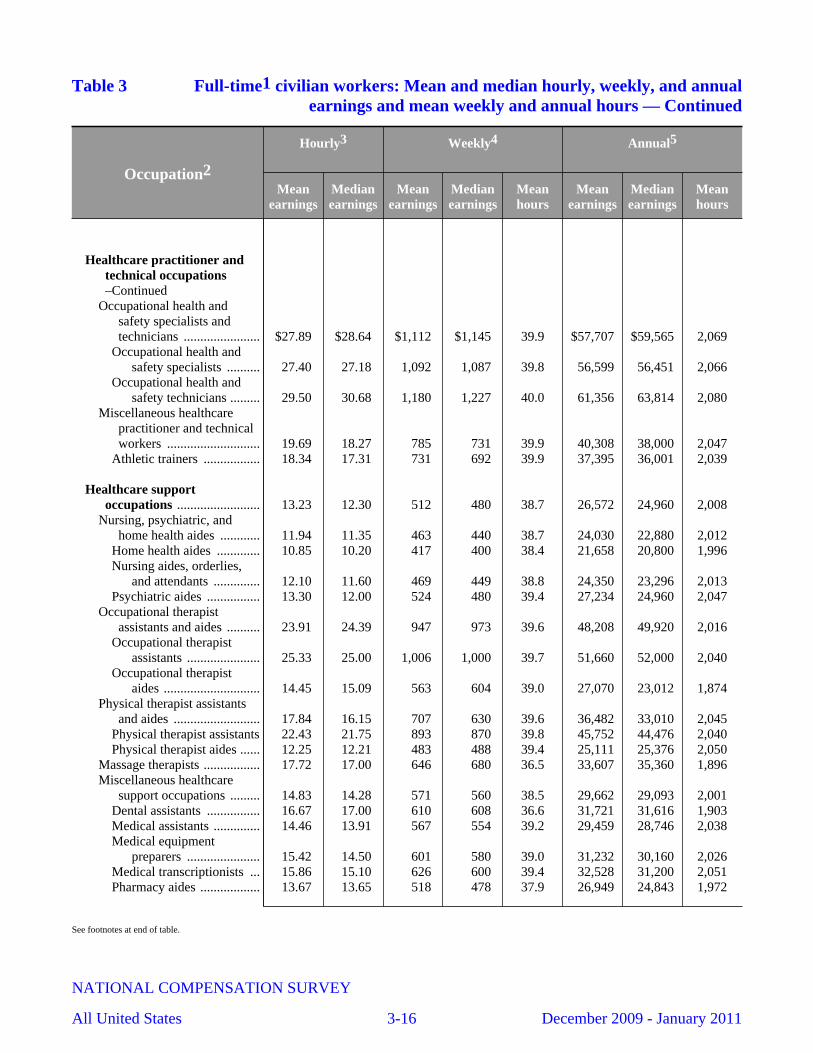
Table 3 Full-time1 civilian workers: Mean and median hourly, weekly, and annualearnings and mean weekly and annual hours — Continued
Occupation2
Hourly3 Weekly4 Annual5
Meanearnings
Medianearnings
Meanearnings
Medianearnings
Meanhours
Meanearnings
Medianearnings
Meanhours
Healthcare practitioner andtechnical occupations–Continued
Occupational health andsafety specialists andtechnicians ....................... $27.89 $28.64 $1,112 $1,145 39.9 $57,707 $59,565 2,069
Occupational health andsafety specialists .......... 27.40 27.18 1,092 1,087 39.8 56,599 56,451 2,066
Occupational health andsafety technicians ......... 29.50 30.68 1,180 1,227 40.0 61,356 63,814 2,080
Miscellaneous healthcarepractitioner and technicalworkers ............................ 19.69 18.27 785 731 39.9 40,308 38,000 2,047
Athletic trainers ................. 18.34 17.31 731 692 39.9 37,395 36,001 2,039
Healthcare supportoccupations ......................... 13.23 12.30 512 480 38.7 26,572 24,960 2,008
Nursing, psychiatric, andhome health aides ............ 11.94 11.35 463 440 38.7 24,030 22,880 2,012
Home health aides ............. 10.85 10.20 417 400 38.4 21,658 20,800 1,996Nursing aides, orderlies,
and attendants .............. 12.10 11.60 469 449 38.8 24,350 23,296 2,013Psychiatric aides ................ 13.30 12.00 524 480 39.4 27,234 24,960 2,047
Occupational therapistassistants and aides .......... 23.91 24.39 947 973 39.6 48,208 49,920 2,016
Occupational therapistassistants ...................... 25.33 25.00 1,006 1,000 39.7 51,660 52,000 2,040
Occupational therapistaides ............................. 14.45 15.09 563 604 39.0 27,070 23,012 1,874
Physical therapist assistantsand aides .......................... 17.84 16.15 707 630 39.6 36,482 33,010 2,045
Physical therapist assistants 22.43 21.75 893 870 39.8 45,752 44,476 2,040Physical therapist aides ...... 12.25 12.21 483 488 39.4 25,111 25,376 2,050
Massage therapists ................. 17.72 17.00 646 680 36.5 33,607 35,360 1,896Miscellaneous healthcare
support occupations ......... 14.83 14.28 571 560 38.5 29,662 29,093 2,001Dental assistants ................ 16.67 17.00 610 608 36.6 31,721 31,616 1,903Medical assistants .............. 14.46 13.91 567 554 39.2 29,459 28,746 2,038Medical equipment
preparers ...................... 15.42 14.50 601 580 39.0 31,232 30,160 2,026Medical transcriptionists ... 15.86 15.10 626 600 39.4 32,528 31,200 2,051Pharmacy aides .................. 13.67 13.65 518 478 37.9 26,949 24,843 1,972
See footnotes at end of table.
NATIONAL COMPENSATION SURVEY
All United States 3-16 December 2009 - January 2011

Table 3 Full-time1 civilian workers: Mean and median hourly, weekly, and annualearnings and mean weekly and annual hours — Continued
Occupation2
Hourly3 Weekly4 Annual5
Meanearnings
Medianearnings
Meanearnings
Medianearnings
Meanhours
Meanearnings
Medianearnings
Meanhours
Healthcare supportoccupations –ContinuedVeterinary assistants and
laboratory animalcaretakers ..................... $12.43 $12.00 $492 $480 39.6 $25,604 $24,960 2,059
Protective service occupations 20.98 18.44 858 755 40.9 44,027 38,775 2,098First-line
supervisors/managers, lawenforcement workers ....... 34.09 33.49 1,367 1,350 40.1 71,075 70,200 2,085
First-linesupervisors/managersof correctional officers 24.61 22.77 989 915 40.2 51,450 47,565 2,091
First-linesupervisors/managersof police and detectives 37.62 36.96 1,507 1,485 40.1 78,371 77,230 2,083
First-linesupervisors/managers offire fighting andprevention workers .......... 28.33 27.28 1,362 1,287 48.1 70,812 66,935 2,500
Fire fighters ........................... 22.05 21.46 1,084 1,048 49.2 56,368 54,471 2,556Fire inspectors ....................... 24.60 24.27 948 871 38.5 49,280 45,311 2,003
Fire inspectors andinvestigators ................. 24.62 24.27 948 871 38.5 49,315 45,311 2,003
Bailiffs, correctional officers,and jailers ......................... 19.17 17.19 767 693 40.0 39,889 36,017 2,081
Bailiffs ............................... 27.19 27.72 1,051 1,050 38.6 54,641 54,600 2,010Correctional officers and
jailers ........................... 18.96 16.99 759 684 40.0 39,487 35,585 2,082Detectives and criminal
investigators ..................... 29.35 28.06 1,178 1,123 40.1 60,878 58,157 2,074Fish and game wardens ......... 25.08 25.55 1,001 1,022 39.9 52,075 53,144 2,077Parking enforcement workers 16.23 14.83 649 593 40.0 33,764 30,855 2,080Police officers ........................ 27.74 26.91 1,111 1,079 40.0 57,691 56,035 2,080
Police and sheriff’s patrolofficers ......................... 27.74 26.91 1,111 1,079 40.0 57,691 56,035 2,080
Animal control workers ......... 14.02 13.02 560 521 40.0 29,124 27,082 2,078Private detectives and
investigators ..................... 17.21 16.93 687 677 39.9 35,587 35,221 2,067Security guards and gaming
surveillance officers ......... 12.33 11.00 487 440 39.5 25,155 22,880 2,041
See footnotes at end of table.
NATIONAL COMPENSATION SURVEY
All United States 3-17 December 2009 - January 2011
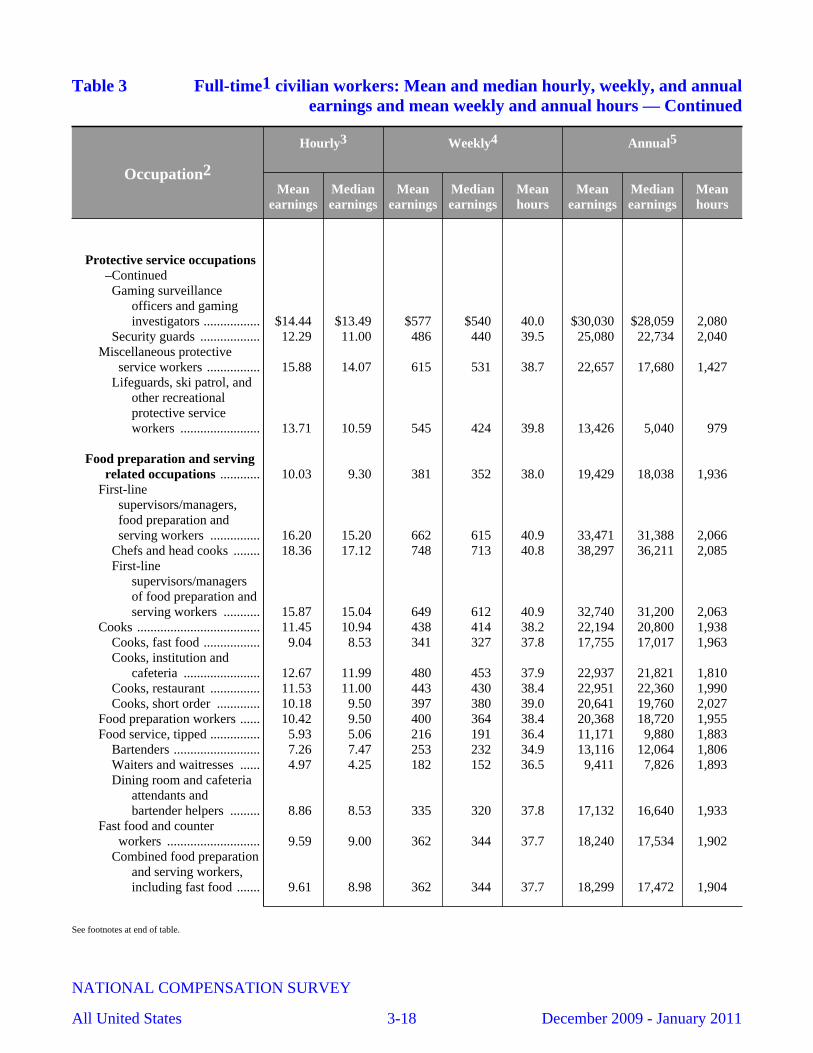
Table 3 Full-time1 civilian workers: Mean and median hourly, weekly, and annualearnings and mean weekly and annual hours — Continued
Occupation2
Hourly3 Weekly4 Annual5
Meanearnings
Medianearnings
Meanearnings
Medianearnings
Meanhours
Meanearnings
Medianearnings
Meanhours
Protective service occupations–ContinuedGaming surveillance
officers and gaminginvestigators ................. $14.44 $13.49 $577 $540 40.0 $30,030 $28,059 2,080
Security guards .................. 12.29 11.00 486 440 39.5 25,080 22,734 2,040Miscellaneous protective
service workers ................ 15.88 14.07 615 531 38.7 22,657 17,680 1,427Lifeguards, ski patrol, and
other recreationalprotective serviceworkers ........................ 13.71 10.59 545 424 39.8 13,426 5,040 979
Food preparation and servingrelated occupations ............ 10.03 9.30 381 352 38.0 19,429 18,038 1,936
First-linesupervisors/managers,food preparation andserving workers ............... 16.20 15.20 662 615 40.9 33,471 31,388 2,066
Chefs and head cooks ........ 18.36 17.12 748 713 40.8 38,297 36,211 2,085First-line
supervisors/managersof food preparation andserving workers ........... 15.87 15.04 649 612 40.9 32,740 31,200 2,063
Cooks ..................................... 11.45 10.94 438 414 38.2 22,194 20,800 1,938Cooks, fast food ................. 9.04 8.53 341 327 37.8 17,755 17,017 1,963Cooks, institution and
cafeteria ....................... 12.67 11.99 480 453 37.9 22,937 21,821 1,810Cooks, restaurant ............... 11.53 11.00 443 430 38.4 22,951 22,360 1,990Cooks, short order ............. 10.18 9.50 397 380 39.0 20,641 19,760 2,027
Food preparation workers ...... 10.42 9.50 400 364 38.4 20,368 18,720 1,955Food service, tipped ............... 5.93 5.06 216 191 36.4 11,171 9,880 1,883
Bartenders .......................... 7.26 7.47 253 232 34.9 13,116 12,064 1,806Waiters and waitresses ...... 4.97 4.25 182 152 36.5 9,411 7,826 1,893Dining room and cafeteria
attendants andbartender helpers ......... 8.86 8.53 335 320 37.8 17,132 16,640 1,933
Fast food and counterworkers ............................ 9.59 9.00 362 344 37.7 18,240 17,534 1,902
Combined food preparationand serving workers,including fast food ....... 9.61 8.98 362 344 37.7 18,299 17,472 1,904
See footnotes at end of table.
NATIONAL COMPENSATION SURVEY
All United States 3-18 December 2009 - January 2011
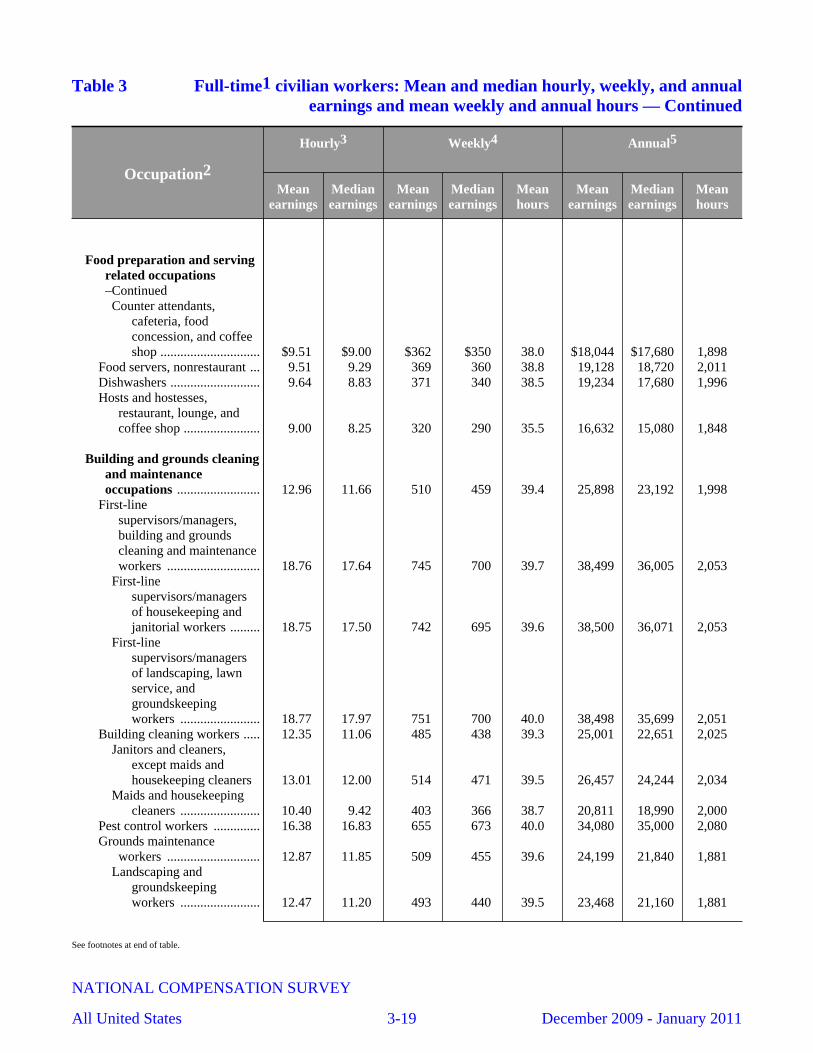
Table 3 Full-time1 civilian workers: Mean and median hourly, weekly, and annualearnings and mean weekly and annual hours — Continued
Occupation2
Hourly3 Weekly4 Annual5
Meanearnings
Medianearnings
Meanearnings
Medianearnings
Meanhours
Meanearnings
Medianearnings
Meanhours
Food preparation and servingrelated occupations–ContinuedCounter attendants,
cafeteria, foodconcession, and coffeeshop .............................. $9.51 $9.00 $362 $350 38.0 $18,044 $17,680 1,898
Food servers, nonrestaurant ... 9.51 9.29 369 360 38.8 19,128 18,720 2,011Dishwashers ........................... 9.64 8.83 371 340 38.5 19,234 17,680 1,996Hosts and hostesses,
restaurant, lounge, andcoffee shop ....................... 9.00 8.25 320 290 35.5 16,632 15,080 1,848
Building and grounds cleaningand maintenanceoccupations ......................... 12.96 11.66 510 459 39.4 25,898 23,192 1,998
First-linesupervisors/managers,building and groundscleaning and maintenanceworkers ............................ 18.76 17.64 745 700 39.7 38,499 36,005 2,053
First-linesupervisors/managersof housekeeping andjanitorial workers ......... 18.75 17.50 742 695 39.6 38,500 36,071 2,053
First-linesupervisors/managersof landscaping, lawnservice, andgroundskeepingworkers ........................ 18.77 17.97 751 700 40.0 38,498 35,699 2,051
Building cleaning workers ..... 12.35 11.06 485 438 39.3 25,001 22,651 2,025Janitors and cleaners,
except maids andhousekeeping cleaners 13.01 12.00 514 471 39.5 26,457 24,244 2,034
Maids and housekeepingcleaners ........................ 10.40 9.42 403 366 38.7 20,811 18,990 2,000
Pest control workers .............. 16.38 16.83 655 673 40.0 34,080 35,000 2,080Grounds maintenance
workers ............................ 12.87 11.85 509 455 39.6 24,199 21,840 1,881Landscaping and
groundskeepingworkers ........................ 12.47 11.20 493 440 39.5 23,468 21,160 1,881
See footnotes at end of table.
NATIONAL COMPENSATION SURVEY
All United States 3-19 December 2009 - January 2011
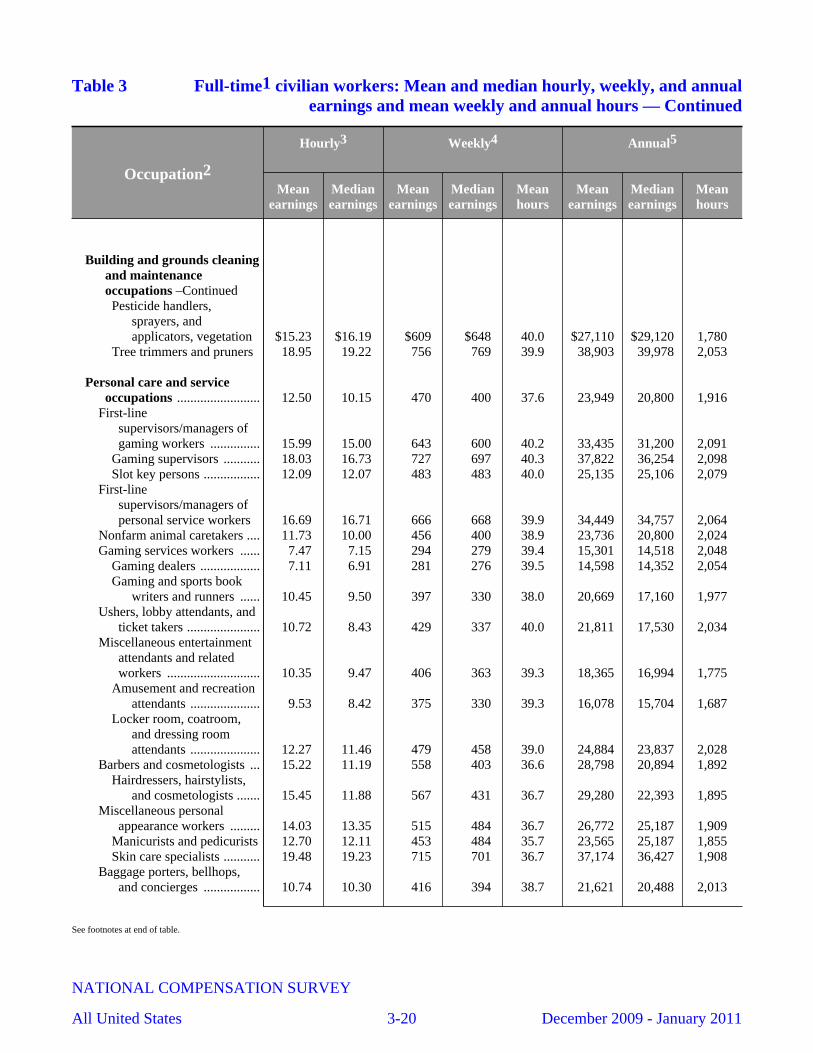
Table 3 Full-time1 civilian workers: Mean and median hourly, weekly, and annualearnings and mean weekly and annual hours — Continued
Occupation2
Hourly3 Weekly4 Annual5
Meanearnings
Medianearnings
Meanearnings
Medianearnings
Meanhours
Meanearnings
Medianearnings
Meanhours
Building and grounds cleaningand maintenanceoccupations –ContinuedPesticide handlers,
sprayers, andapplicators, vegetation $15.23 $16.19 $609 $648 40.0 $27,110 $29,120 1,780
Tree trimmers and pruners 18.95 19.22 756 769 39.9 38,903 39,978 2,053
Personal care and serviceoccupations ......................... 12.50 10.15 470 400 37.6 23,949 20,800 1,916
First-linesupervisors/managers ofgaming workers ............... 15.99 15.00 643 600 40.2 33,435 31,200 2,091
Gaming supervisors ........... 18.03 16.73 727 697 40.3 37,822 36,254 2,098Slot key persons ................. 12.09 12.07 483 483 40.0 25,135 25,106 2,079
First-linesupervisors/managers ofpersonal service workers 16.69 16.71 666 668 39.9 34,449 34,757 2,064
Nonfarm animal caretakers .... 11.73 10.00 456 400 38.9 23,736 20,800 2,024Gaming services workers ...... 7.47 7.15 294 279 39.4 15,301 14,518 2,048
Gaming dealers .................. 7.11 6.91 281 276 39.5 14,598 14,352 2,054Gaming and sports book
writers and runners ...... 10.45 9.50 397 330 38.0 20,669 17,160 1,977Ushers, lobby attendants, and
ticket takers ...................... 10.72 8.43 429 337 40.0 21,811 17,530 2,034Miscellaneous entertainment
attendants and relatedworkers ............................ 10.35 9.47 406 363 39.3 18,365 16,994 1,775
Amusement and recreationattendants ..................... 9.53 8.42 375 330 39.3 16,078 15,704 1,687
Locker room, coatroom,and dressing roomattendants ..................... 12.27 11.46 479 458 39.0 24,884 23,837 2,028
Barbers and cosmetologists ... 15.22 11.19 558 403 36.6 28,798 20,894 1,892Hairdressers, hairstylists,
and cosmetologists ....... 15.45 11.88 567 431 36.7 29,280 22,393 1,895Miscellaneous personal
appearance workers ......... 14.03 13.35 515 484 36.7 26,772 25,187 1,909Manicurists and pedicurists 12.70 12.11 453 484 35.7 23,565 25,187 1,855Skin care specialists ........... 19.48 19.23 715 701 36.7 37,174 36,427 1,908
Baggage porters, bellhops,and concierges ................. 10.74 10.30 416 394 38.7 21,621 20,488 2,013
See footnotes at end of table.
NATIONAL COMPENSATION SURVEY
All United States 3-20 December 2009 - January 2011

Table 3 Full-time1 civilian workers: Mean and median hourly, weekly, and annualearnings and mean weekly and annual hours — Continued
Occupation2
Hourly3 Weekly4 Annual5
Meanearnings
Medianearnings
Meanearnings
Medianearnings
Meanhours
Meanearnings
Medianearnings
Meanhours
Personal care and serviceoccupations –ContinuedBaggage porters and
bellhops ........................ $9.54 $8.60 $366 $340 38.3 $19,031 $17,680 1,994Concierges ......................... 13.28 13.34 525 533 39.5 27,290 27,737 2,055
Tour and travel guides ........... 15.75 17.32 630 693 40.0 26,661 36,026 1,693Tour guides and escorts ..... 14.77 17.32 591 693 40.0 24,206 27,040 1,639
Transportation attendants ...... 31.28 32.30 673 713 21.5 34,504 36,279 1,103Flight attendants ................ 36.99 39.50 725 743 19.6 37,710 38,659 1,019Transportation attendants,
except flight attendantsand baggage porters ..... 11.40 9.67 371 248 32.5 17,598 11,310 1,543
Child care workers ................. 10.05 9.60 392 375 39.0 19,994 19,208 1,989Personal and home care aides 10.38 10.00 411 400 39.6 21,377 20,800 2,059Recreation and fitness
workers ............................ 16.77 15.45 652 585 38.9 31,052 29,900 1,852Fitness trainers and
aerobics instructors ...... 22.95 20.19 871 808 37.9 42,787 37,814 1,864Recreation workers ............ 15.11 13.75 591 543 39.2 27,929 25,688 1,849
Residential advisors ............... 15.93 16.23 620 618 38.9 30,003 27,484 1,883
Sales and related occupations 19.97 14.89 798 590 39.9 41,349 30,599 2,071First-line
supervisors/managers,sales workers ................... 21.13 18.08 866 740 41.0 44,974 38,480 2,128
First-linesupervisors/managersof retail sales workers .. 19.23 17.50 788 711 41.0 40,924 36,972 2,128
First-linesupervisors/managersof non-retail salesworkers ........................ 30.48 23.81 1,247 962 40.9 64,848 49,999 2,128
Retail sales workers ............... 13.07 11.25 518 442 39.6 26,797 22,973 2,050Cashiers, all workers ......... 10.66 10.00 419 392 39.3 21,677 20,363 2,033
Cashiers ......................... 10.58 9.91 416 388 39.3 21,505 20,072 2,033Gaming change persons
and booth cashiers ... 12.75 13.04 499 522 39.1 25,938 27,132 2,034Counter and rental clerks
and parts salespersons .. 14.99 13.78 602 560 40.2 31,317 29,130 2,089Counter and rental clerks 13.25 11.23 527 440 39.8 27,406 22,880 2,068Parts salespersons .......... 15.99 15.75 646 630 40.4 33,604 32,760 2,101
Retail salespersons ............. 14.47 12.06 575 478 39.7 29,722 24,848 2,055Advertising sales agents ........ 22.96 20.20 910 808 39.6 47,305 42,016 2,060
See footnotes at end of table.
NATIONAL COMPENSATION SURVEY
All United States 3-21 December 2009 - January 2011
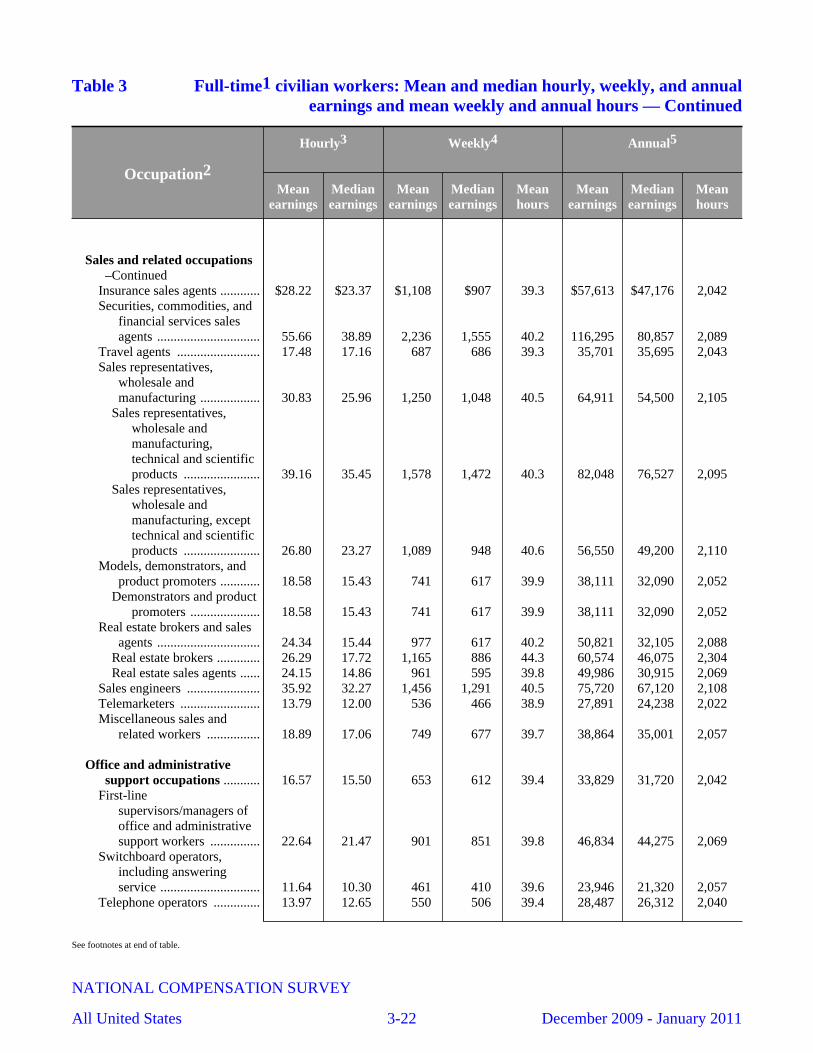
Table 3 Full-time1 civilian workers: Mean and median hourly, weekly, and annualearnings and mean weekly and annual hours — Continued
Occupation2
Hourly3 Weekly4 Annual5
Meanearnings
Medianearnings
Meanearnings
Medianearnings
Meanhours
Meanearnings
Medianearnings
Meanhours
Sales and related occupations–Continued
Insurance sales agents ............ $28.22 $23.37 $1,108 $907 39.3 $57,613 $47,176 2,042Securities, commodities, and
financial services salesagents ............................... 55.66 38.89 2,236 1,555 40.2 116,295 80,857 2,089
Travel agents ......................... 17.48 17.16 687 686 39.3 35,701 35,695 2,043Sales representatives,
wholesale andmanufacturing .................. 30.83 25.96 1,250 1,048 40.5 64,911 54,500 2,105
Sales representatives,wholesale andmanufacturing,technical and scientificproducts ....................... 39.16 35.45 1,578 1,472 40.3 82,048 76,527 2,095
Sales representatives,wholesale andmanufacturing, excepttechnical and scientificproducts ....................... 26.80 23.27 1,089 948 40.6 56,550 49,200 2,110
Models, demonstrators, andproduct promoters ............ 18.58 15.43 741 617 39.9 38,111 32,090 2,052
Demonstrators and productpromoters ..................... 18.58 15.43 741 617 39.9 38,111 32,090 2,052
Real estate brokers and salesagents ............................... 24.34 15.44 977 617 40.2 50,821 32,105 2,088
Real estate brokers ............. 26.29 17.72 1,165 886 44.3 60,574 46,075 2,304Real estate sales agents ...... 24.15 14.86 961 595 39.8 49,986 30,915 2,069
Sales engineers ...................... 35.92 32.27 1,456 1,291 40.5 75,720 67,120 2,108Telemarketers ........................ 13.79 12.00 536 466 38.9 27,891 24,238 2,022Miscellaneous sales and
related workers ................ 18.89 17.06 749 677 39.7 38,864 35,001 2,057
Office and administrativesupport occupations ........... 16.57 15.50 653 612 39.4 33,829 31,720 2,042
First-linesupervisors/managers ofoffice and administrativesupport workers ............... 22.64 21.47 901 851 39.8 46,834 44,275 2,069
Switchboard operators,including answeringservice .............................. 11.64 10.30 461 410 39.6 23,946 21,320 2,057
Telephone operators .............. 13.97 12.65 550 506 39.4 28,487 26,312 2,040
See footnotes at end of table.
NATIONAL COMPENSATION SURVEY
All United States 3-22 December 2009 - January 2011

Table 3 Full-time1 civilian workers: Mean and median hourly, weekly, and annualearnings and mean weekly and annual hours — Continued
Occupation2
Hourly3 Weekly4 Annual5
Meanearnings
Medianearnings
Meanearnings
Medianearnings
Meanhours
Meanearnings
Medianearnings
Meanhours
Office and administrativesupport occupations–Continued
Financial clerks ...................... $16.09 $15.49 $635 $611 39.5 $32,996 $31,753 2,050Bill and account collectors 15.63 14.70 622 583 39.8 32,351 30,306 2,070Billing and posting clerks
and machine operators 16.06 15.75 632 618 39.3 32,861 32,136 2,046Bookkeeping, accounting,
and auditing clerks ....... 17.12 16.50 673 653 39.3 34,929 33,924 2,040Gaming cage workers ........ 11.84 11.00 472 437 39.8 24,519 22,714 2,071Payroll and timekeeping
clerks ............................ 18.85 18.36 749 727 39.7 38,803 37,710 2,059Procurement clerks ............ 17.08 16.61 678 664 39.7 35,263 34,540 2,065Tellers ................................ 12.59 12.00 500 477 39.7 25,983 24,829 2,064
Brokerage clerks .................... 19.26 18.21 765 708 39.7 39,788 36,810 2,066Correspondence clerks ........... 17.53 16.70 699 668 39.9 36,329 34,738 2,073Court, municipal, and license
clerks ................................ 17.41 16.61 677 653 38.9 35,189 33,966 2,021Credit authorizers, checkers,
and clerks ......................... 17.20 16.97 686 679 39.9 35,662 35,285 2,073Customer service
representatives ................. 16.09 15.00 638 596 39.7 33,111 30,913 2,058Eligibility interviewers,
government programs ...... 17.81 17.34 697 680 39.2 36,167 35,320 2,030File clerks .............................. 14.19 14.00 560 551 39.5 29,074 28,631 2,049Hotel, motel, and resort desk
clerks ................................ 10.54 10.00 415 400 39.4 21,540 20,800 2,044Interviewers, except
eligibility and loan ........... 14.29 13.70 561 542 39.2 29,050 28,080 2,033Library assistants, clerical ..... 14.77 13.97 555 539 37.6 26,351 25,428 1,784Loan interviewers and clerks 16.75 16.20 670 647 40.0 34,859 33,634 2,081New accounts clerks .............. 14.90 14.42 593 577 39.8 30,838 30,000 2,070Order clerks ........................... 15.14 14.21 601 566 39.7 31,173 29,378 2,058Human resources assistants,
except payroll andtimekeeping ..................... 18.32 18.44 726 731 39.6 37,696 38,000 2,058
Receptionists and informationclerks ................................ 13.60 13.00 532 510 39.1 27,622 26,520 2,030
Reservation andtransportation ticketagents and travel clerks ... 17.17 18.00 683 720 39.8 35,508 37,440 2,068
Cargo and freight agents ........ 20.36 18.41 821 742 40.3 42,702 38,605 2,097Couriers and messengers ....... 11.36 11.00 447 430 39.4 23,255 22,360 2,047
See footnotes at end of table.
NATIONAL COMPENSATION SURVEY
All United States 3-23 December 2009 - January 2011

Table 3 Full-time1 civilian workers: Mean and median hourly, weekly, and annualearnings and mean weekly and annual hours — Continued
Occupation2
Hourly3 Weekly4 Annual5
Meanearnings
Medianearnings
Meanearnings
Medianearnings
Meanhours
Meanearnings
Medianearnings
Meanhours
Office and administrativesupport occupations–Continued
Dispatchers ............................ $18.20 $16.53 $733 $661 40.3 $38,055 $34,258 2,091Police, fire, and ambulance
dispatchers ................... 17.94 16.63 718 665 40.0 37,359 34,586 2,082Dispatchers, except police,
fire, and ambulance ..... 18.32 16.44 740 659 40.4 38,375 33,800 2,095Meter readers, utilities ........... 18.73 19.09 746 760 39.8 38,802 39,541 2,071Production, planning, and
expediting clerks .............. 20.01 19.15 797 766 39.8 41,470 39,811 2,072Shipping, receiving, and
traffic clerks ..................... 13.59 12.70 541 506 39.8 28,142 26,312 2,071Stock clerks and order fillers 13.05 12.53 516 496 39.5 26,815 25,790 2,054Weighers, measurers,
checkers, and samplers,recordkeeping .................. 14.49 13.93 578 551 39.9 29,760 28,579 2,054
Secretaries and administrativeassistants .......................... 19.60 18.41 768 721 39.2 39,584 37,440 2,020
Executive secretaries andadministrativeassistants ...................... 22.07 21.43 868 839 39.3 45,085 43,495 2,043
Legal secretaries ................ 22.44 21.35 872 852 38.9 45,362 44,289 2,021Medical secretaries ............ 16.06 15.17 626 604 39.0 32,534 31,429 2,026Secretaries, except legal,
medical, and executive 17.07 16.35 669 650 39.2 33,919 33,259 1,987Computer operators ............... 16.65 14.97 661 599 39.7 34,383 31,129 2,065Data entry and information
processing workers .......... 14.73 14.25 577 564 39.1 29,822 29,120 2,025Data entry keyers ............... 13.85 13.30 542 527 39.1 28,038 27,412 2,025Word processors and
typists ........................... 16.75 16.30 656 648 39.2 33,895 33,618 2,024Desktop publishers ................ 18.71 18.71 722 745 38.6 37,556 38,750 2,007Insurance claims and policy
processing clerks ............. 17.20 16.71 676 649 39.3 35,144 33,735 2,043Mail clerks and mail machine
operators, except postalservice .............................. 12.84 12.65 506 497 39.4 26,296 25,848 2,049
Office clerks, general ............. 15.40 14.63 603 577 39.2 30,970 30,000 2,011Office machine operators,
except computer ............... 13.18 13.00 520 520 39.4 27,019 27,040 2,050Proofreaders and copy
markers ............................ 18.84 21.11 743 844 39.4 38,611 43,909 2,049
See footnotes at end of table.
NATIONAL COMPENSATION SURVEY
All United States 3-24 December 2009 - January 2011

Table 3 Full-time1 civilian workers: Mean and median hourly, weekly, and annualearnings and mean weekly and annual hours — Continued
Occupation2
Hourly3 Weekly4 Annual5
Meanearnings
Medianearnings
Meanearnings
Medianearnings
Meanhours
Meanearnings
Medianearnings
Meanhours
Office and administrativesupport occupations–Continued
Statistical assistants ............... $19.08 $19.67 $747 $746 39.1 $38,819 $38,786 2,035
Farming, fishing, and forestryoccupations ......................... 14.61 13.60 549 510 37.6 27,145 25,418 1,858
First-linesupervisors/managers offarming, fishing, andforestry workers ............... 20.91 21.65 847 866 40.5 44,025 45,032 2,106
Graders and sorters,agricultural products ........ 9.75 8.75 384 326 39.4 19,664 16,640 2,016
Miscellaneous agriculturalworkers ............................ 12.38 12.22 431 420 34.8 20,705 20,800 1,673
Farmworkers and laborers,crop, nursery, andgreenhouse ................... 11.65 10.47 367 340 31.5 16,779 14,400 1,440
Farmworkers, farm andranch animals ............... 14.89 16.37 590 655 39.6 30,705 34,041 2,062
Logging workers .................... 18.61 18.65 744 746 40.0 38,701 38,782 2,080
Construction and extractionoccupations ......................... 21.29 19.00 846 748 39.8 43,283 38,324 2,033
First-linesupervisors/managers ofconstruction trades andextraction workers ........... 29.51 28.00 1,188 1,120 40.3 61,280 57,793 2,077
Boilermakers .......................... 23.34 23.35 934 934 40.0 48,555 48,568 2,080Brickmasons, blockmasons,
and stonemasons .............. 24.03 25.50 952 955 39.6 46,353 46,721 1,929Brickmasons and
blockmasons ................ 24.88 25.59 985 1,024 39.6 47,645 49,132 1,915Carpenters .............................. 22.56 20.27 896 809 39.7 45,725 42,072 2,027Carpet, floor, and tile
installers and finishers ..... 19.04 19.00 744 713 39.1 38,694 37,050 2,032Carpet installers ................. 21.70 20.00 860 800 39.6 44,712 41,600 2,061Tile and marble setters ....... 18.78 17.07 731 683 38.9 38,031 35,499 2,025
Cement masons, concretefinishers, and terrazzoworkers ............................ 20.87 19.39 806 718 38.6 40,755 36,400 1,953
Cement masons andconcrete finishers ......... 20.87 19.39 806 718 38.6 40,755 36,400 1,953
See footnotes at end of table.
NATIONAL COMPENSATION SURVEY
All United States 3-25 December 2009 - January 2011
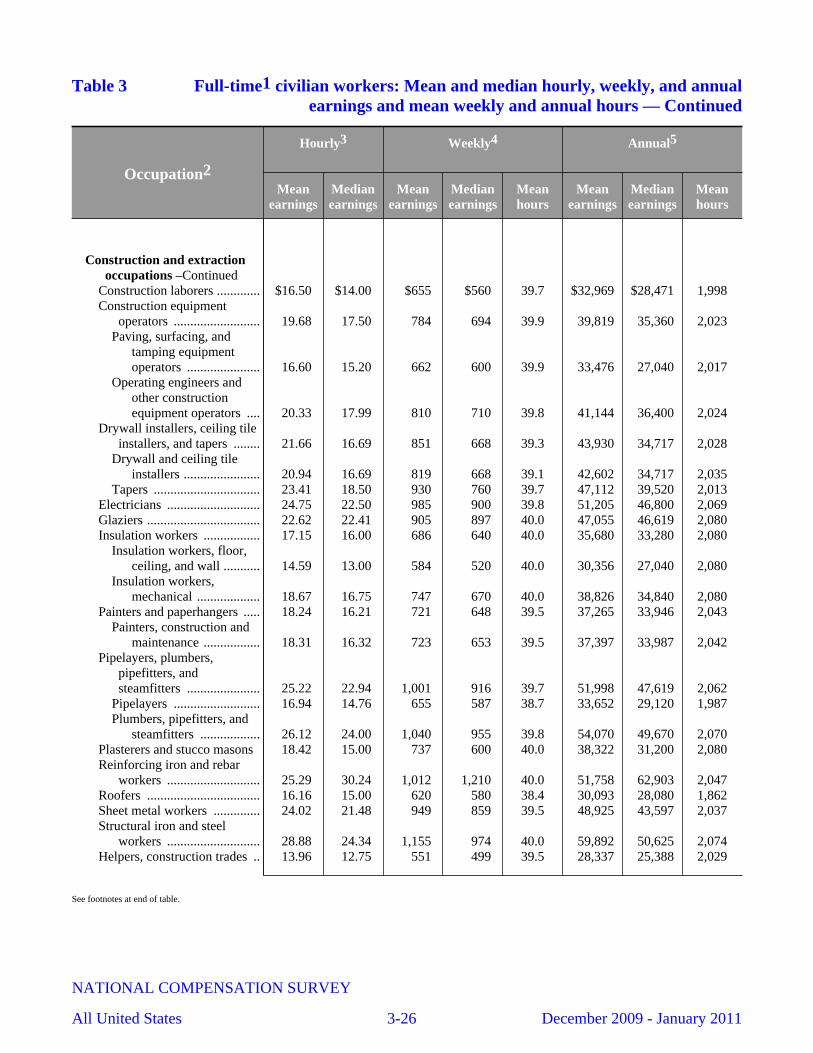
Table 3 Full-time1 civilian workers: Mean and median hourly, weekly, and annualearnings and mean weekly and annual hours — Continued
Occupation2
Hourly3 Weekly4 Annual5
Meanearnings
Medianearnings
Meanearnings
Medianearnings
Meanhours
Meanearnings
Medianearnings
Meanhours
Construction and extractionoccupations –Continued
Construction laborers ............. $16.50 $14.00 $655 $560 39.7 $32,969 $28,471 1,998Construction equipment
operators .......................... 19.68 17.50 784 694 39.9 39,819 35,360 2,023Paving, surfacing, and
tamping equipmentoperators ...................... 16.60 15.20 662 600 39.9 33,476 27,040 2,017
Operating engineers andother constructionequipment operators .... 20.33 17.99 810 710 39.8 41,144 36,400 2,024
Drywall installers, ceiling tileinstallers, and tapers ........ 21.66 16.69 851 668 39.3 43,930 34,717 2,028
Drywall and ceiling tileinstallers ....................... 20.94 16.69 819 668 39.1 42,602 34,717 2,035
Tapers ................................ 23.41 18.50 930 760 39.7 47,112 39,520 2,013Electricians ............................ 24.75 22.50 985 900 39.8 51,205 46,800 2,069Glaziers .................................. 22.62 22.41 905 897 40.0 47,055 46,619 2,080Insulation workers ................. 17.15 16.00 686 640 40.0 35,680 33,280 2,080
Insulation workers, floor,ceiling, and wall ........... 14.59 13.00 584 520 40.0 30,356 27,040 2,080
Insulation workers,mechanical ................... 18.67 16.75 747 670 40.0 38,826 34,840 2,080
Painters and paperhangers ..... 18.24 16.21 721 648 39.5 37,265 33,946 2,043Painters, construction and
maintenance ................. 18.31 16.32 723 653 39.5 37,397 33,987 2,042Pipelayers, plumbers,
pipefitters, andsteamfitters ...................... 25.22 22.94 1,001 916 39.7 51,998 47,619 2,062
Pipelayers .......................... 16.94 14.76 655 587 38.7 33,652 29,120 1,987Plumbers, pipefitters, and
steamfitters .................. 26.12 24.00 1,040 955 39.8 54,070 49,670 2,070Plasterers and stucco masons 18.42 15.00 737 600 40.0 38,322 31,200 2,080Reinforcing iron and rebar
workers ............................ 25.29 30.24 1,012 1,210 40.0 51,758 62,903 2,047Roofers .................................. 16.16 15.00 620 580 38.4 30,093 28,080 1,862Sheet metal workers .............. 24.02 21.48 949 859 39.5 48,925 43,597 2,037Structural iron and steel
workers ............................ 28.88 24.34 1,155 974 40.0 59,892 50,625 2,074Helpers, construction trades .. 13.96 12.75 551 499 39.5 28,337 25,388 2,029
See footnotes at end of table.
NATIONAL COMPENSATION SURVEY
All United States 3-26 December 2009 - January 2011
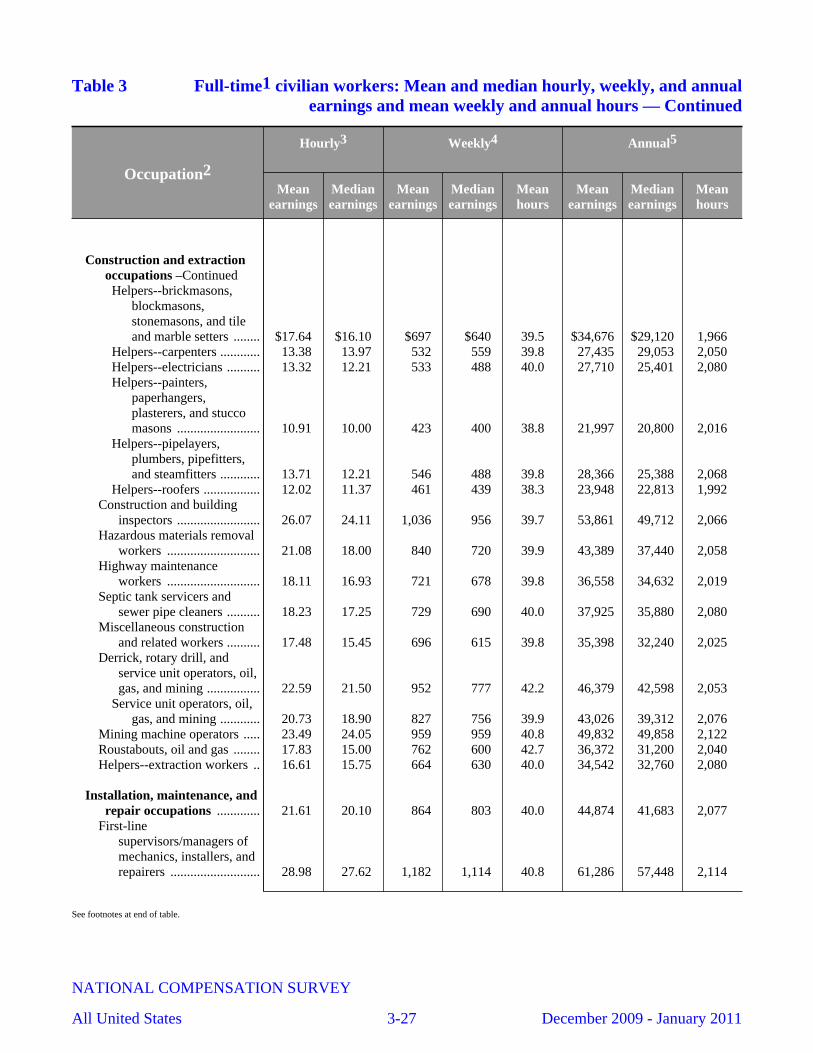
Table 3 Full-time1 civilian workers: Mean and median hourly, weekly, and annualearnings and mean weekly and annual hours — Continued
Occupation2
Hourly3 Weekly4 Annual5
Meanearnings
Medianearnings
Meanearnings
Medianearnings
Meanhours
Meanearnings
Medianearnings
Meanhours
Construction and extractionoccupations –ContinuedHelpers--brickmasons,
blockmasons,stonemasons, and tileand marble setters ........ $17.64 $16.10 $697 $640 39.5 $34,676 $29,120 1,966
Helpers--carpenters ............ 13.38 13.97 532 559 39.8 27,435 29,053 2,050Helpers--electricians .......... 13.32 12.21 533 488 40.0 27,710 25,401 2,080Helpers--painters,
paperhangers,plasterers, and stuccomasons ......................... 10.91 10.00 423 400 38.8 21,997 20,800 2,016
Helpers--pipelayers,plumbers, pipefitters,and steamfitters ............ 13.71 12.21 546 488 39.8 28,366 25,388 2,068
Helpers--roofers ................. 12.02 11.37 461 439 38.3 23,948 22,813 1,992Construction and building
inspectors ......................... 26.07 24.11 1,036 956 39.7 53,861 49,712 2,066Hazardous materials removal
workers ............................ 21.08 18.00 840 720 39.9 43,389 37,440 2,058Highway maintenance
workers ............................ 18.11 16.93 721 678 39.8 36,558 34,632 2,019Septic tank servicers and
sewer pipe cleaners .......... 18.23 17.25 729 690 40.0 37,925 35,880 2,080Miscellaneous construction
and related workers .......... 17.48 15.45 696 615 39.8 35,398 32,240 2,025Derrick, rotary drill, and
service unit operators, oil,gas, and mining ................ 22.59 21.50 952 777 42.2 46,379 42,598 2,053
Service unit operators, oil,gas, and mining ............ 20.73 18.90 827 756 39.9 43,026 39,312 2,076
Mining machine operators ..... 23.49 24.05 959 959 40.8 49,832 49,858 2,122Roustabouts, oil and gas ........ 17.83 15.00 762 600 42.7 36,372 31,200 2,040Helpers--extraction workers .. 16.61 15.75 664 630 40.0 34,542 32,760 2,080
Installation, maintenance, andrepair occupations ............. 21.61 20.10 864 803 40.0 44,874 41,683 2,077
First-linesupervisors/managers ofmechanics, installers, andrepairers ........................... 28.98 27.62 1,182 1,114 40.8 61,286 57,448 2,114
See footnotes at end of table.
NATIONAL COMPENSATION SURVEY
All United States 3-27 December 2009 - January 2011
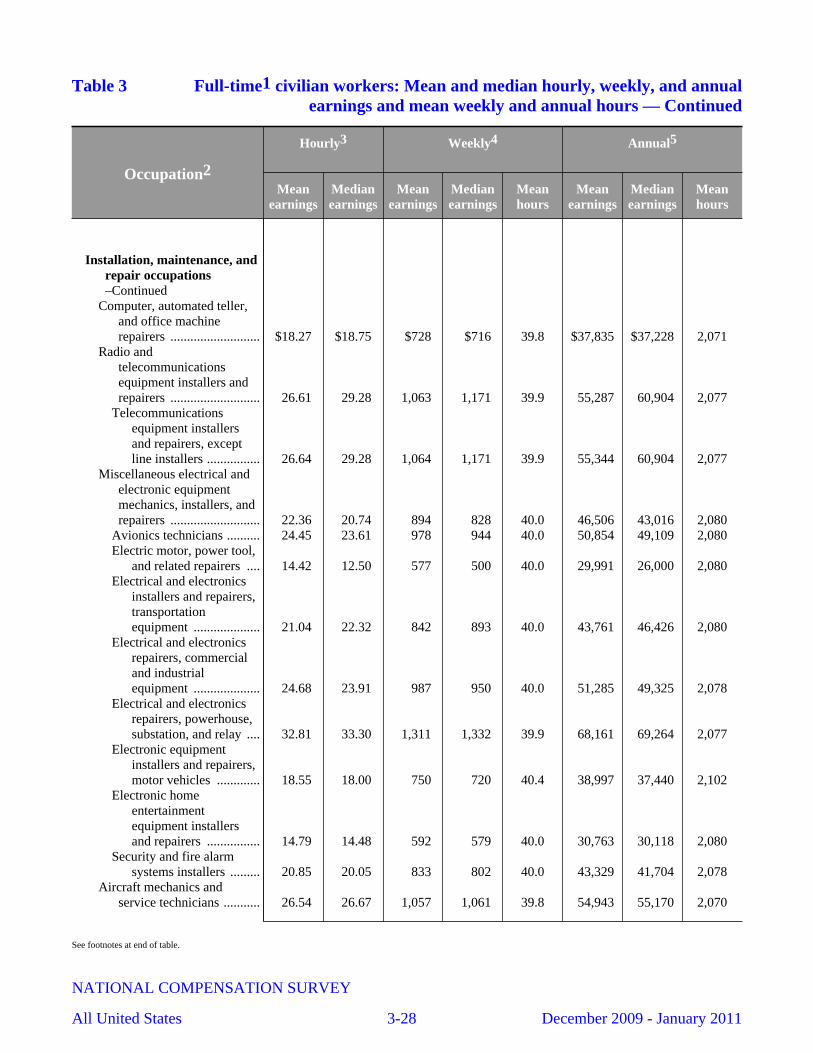
Table 3 Full-time1 civilian workers: Mean and median hourly, weekly, and annualearnings and mean weekly and annual hours — Continued
Occupation2
Hourly3 Weekly4 Annual5
Meanearnings
Medianearnings
Meanearnings
Medianearnings
Meanhours
Meanearnings
Medianearnings
Meanhours
Installation, maintenance, andrepair occupations–Continued
Computer, automated teller,and office machinerepairers ........................... $18.27 $18.75 $728 $716 39.8 $37,835 $37,228 2,071
Radio andtelecommunicationsequipment installers andrepairers ........................... 26.61 29.28 1,063 1,171 39.9 55,287 60,904 2,077
Telecommunicationsequipment installersand repairers, exceptline installers ................ 26.64 29.28 1,064 1,171 39.9 55,344 60,904 2,077
Miscellaneous electrical andelectronic equipmentmechanics, installers, andrepairers ........................... 22.36 20.74 894 828 40.0 46,506 43,016 2,080
Avionics technicians .......... 24.45 23.61 978 944 40.0 50,854 49,109 2,080Electric motor, power tool,
and related repairers .... 14.42 12.50 577 500 40.0 29,991 26,000 2,080Electrical and electronics
installers and repairers,transportationequipment .................... 21.04 22.32 842 893 40.0 43,761 46,426 2,080
Electrical and electronicsrepairers, commercialand industrialequipment .................... 24.68 23.91 987 950 40.0 51,285 49,325 2,078
Electrical and electronicsrepairers, powerhouse,substation, and relay .... 32.81 33.30 1,311 1,332 39.9 68,161 69,264 2,077
Electronic equipmentinstallers and repairers,motor vehicles ............. 18.55 18.00 750 720 40.4 38,997 37,440 2,102
Electronic homeentertainmentequipment installersand repairers ................ 14.79 14.48 592 579 40.0 30,763 30,118 2,080
Security and fire alarmsystems installers ......... 20.85 20.05 833 802 40.0 43,329 41,704 2,078
Aircraft mechanics andservice technicians ........... 26.54 26.67 1,057 1,061 39.8 54,943 55,170 2,070
See footnotes at end of table.
NATIONAL COMPENSATION SURVEY
All United States 3-28 December 2009 - January 2011
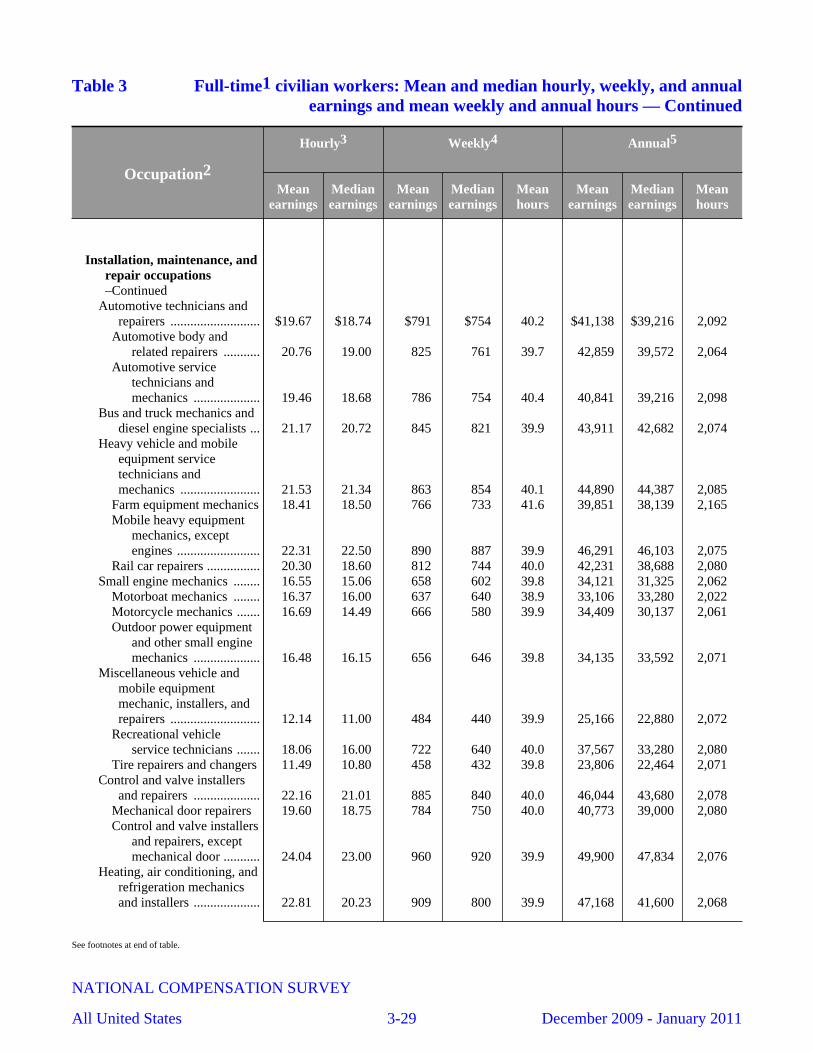
Table 3 Full-time1 civilian workers: Mean and median hourly, weekly, and annualearnings and mean weekly and annual hours — Continued
Occupation2
Hourly3 Weekly4 Annual5
Meanearnings
Medianearnings
Meanearnings
Medianearnings
Meanhours
Meanearnings
Medianearnings
Meanhours
Installation, maintenance, andrepair occupations–Continued
Automotive technicians andrepairers ........................... $19.67 $18.74 $791 $754 40.2 $41,138 $39,216 2,092
Automotive body andrelated repairers ........... 20.76 19.00 825 761 39.7 42,859 39,572 2,064
Automotive servicetechnicians andmechanics .................... 19.46 18.68 786 754 40.4 40,841 39,216 2,098
Bus and truck mechanics anddiesel engine specialists ... 21.17 20.72 845 821 39.9 43,911 42,682 2,074
Heavy vehicle and mobileequipment servicetechnicians andmechanics ........................ 21.53 21.34 863 854 40.1 44,890 44,387 2,085
Farm equipment mechanics 18.41 18.50 766 733 41.6 39,851 38,139 2,165Mobile heavy equipment
mechanics, exceptengines ......................... 22.31 22.50 890 887 39.9 46,291 46,103 2,075
Rail car repairers ................ 20.30 18.60 812 744 40.0 42,231 38,688 2,080Small engine mechanics ........ 16.55 15.06 658 602 39.8 34,121 31,325 2,062
Motorboat mechanics ........ 16.37 16.00 637 640 38.9 33,106 33,280 2,022Motorcycle mechanics ....... 16.69 14.49 666 580 39.9 34,409 30,137 2,061Outdoor power equipment
and other small enginemechanics .................... 16.48 16.15 656 646 39.8 34,135 33,592 2,071
Miscellaneous vehicle andmobile equipmentmechanic, installers, andrepairers ........................... 12.14 11.00 484 440 39.9 25,166 22,880 2,072
Recreational vehicleservice technicians ....... 18.06 16.00 722 640 40.0 37,567 33,280 2,080
Tire repairers and changers 11.49 10.80 458 432 39.8 23,806 22,464 2,071Control and valve installers
and repairers .................... 22.16 21.01 885 840 40.0 46,044 43,680 2,078Mechanical door repairers 19.60 18.75 784 750 40.0 40,773 39,000 2,080Control and valve installers
and repairers, exceptmechanical door ........... 24.04 23.00 960 920 39.9 49,900 47,834 2,076
Heating, air conditioning, andrefrigeration mechanicsand installers .................... 22.81 20.23 909 800 39.9 47,168 41,600 2,068
See footnotes at end of table.
NATIONAL COMPENSATION SURVEY
All United States 3-29 December 2009 - January 2011
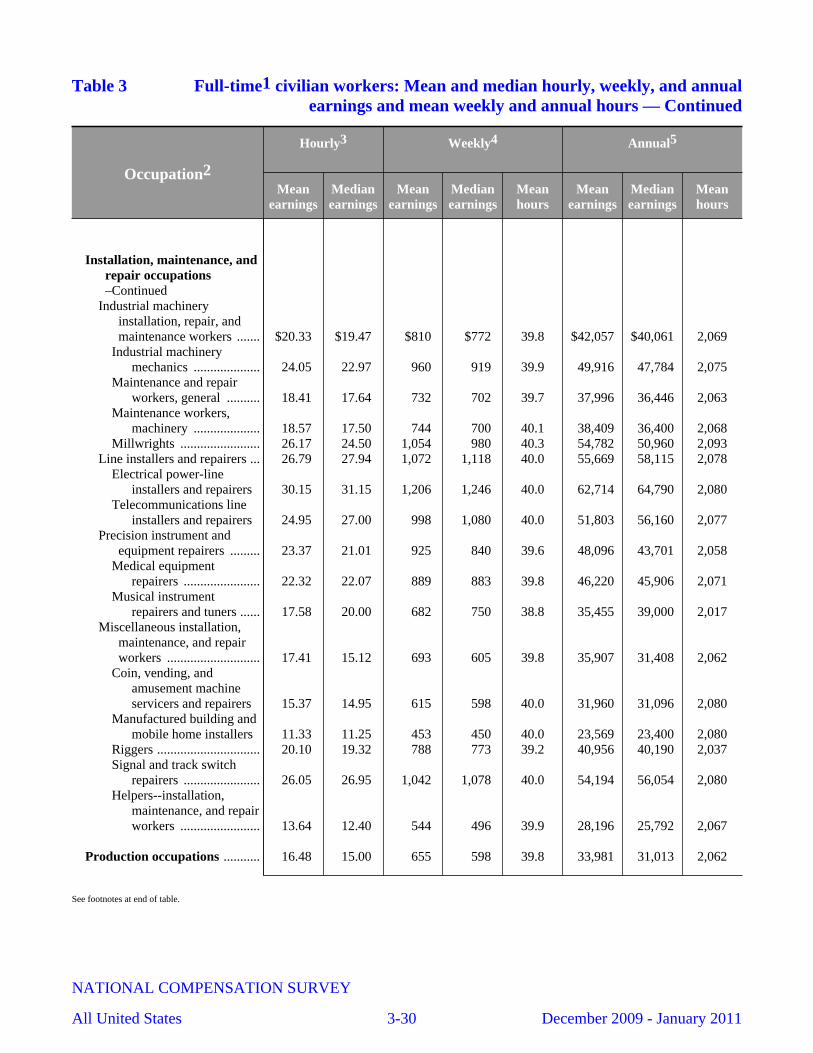
Table 3 Full-time1 civilian workers: Mean and median hourly, weekly, and annualearnings and mean weekly and annual hours — Continued
Occupation2
Hourly3 Weekly4 Annual5
Meanearnings
Medianearnings
Meanearnings
Medianearnings
Meanhours
Meanearnings
Medianearnings
Meanhours
Installation, maintenance, andrepair occupations–Continued
Industrial machineryinstallation, repair, andmaintenance workers ....... $20.33 $19.47 $810 $772 39.8 $42,057 $40,061 2,069
Industrial machinerymechanics .................... 24.05 22.97 960 919 39.9 49,916 47,784 2,075
Maintenance and repairworkers, general .......... 18.41 17.64 732 702 39.7 37,996 36,446 2,063
Maintenance workers,machinery .................... 18.57 17.50 744 700 40.1 38,409 36,400 2,068
Millwrights ........................ 26.17 24.50 1,054 980 40.3 54,782 50,960 2,093Line installers and repairers ... 26.79 27.94 1,072 1,118 40.0 55,669 58,115 2,078
Electrical power-lineinstallers and repairers 30.15 31.15 1,206 1,246 40.0 62,714 64,790 2,080
Telecommunications lineinstallers and repairers 24.95 27.00 998 1,080 40.0 51,803 56,160 2,077
Precision instrument andequipment repairers ......... 23.37 21.01 925 840 39.6 48,096 43,701 2,058
Medical equipmentrepairers ....................... 22.32 22.07 889 883 39.8 46,220 45,906 2,071
Musical instrumentrepairers and tuners ...... 17.58 20.00 682 750 38.8 35,455 39,000 2,017
Miscellaneous installation,maintenance, and repairworkers ............................ 17.41 15.12 693 605 39.8 35,907 31,408 2,062
Coin, vending, andamusement machineservicers and repairers 15.37 14.95 615 598 40.0 31,960 31,096 2,080
Manufactured building andmobile home installers 11.33 11.25 453 450 40.0 23,569 23,400 2,080
Riggers ............................... 20.10 19.32 788 773 39.2 40,956 40,190 2,037Signal and track switch
repairers ....................... 26.05 26.95 1,042 1,078 40.0 54,194 56,054 2,080Helpers--installation,
maintenance, and repairworkers ........................ 13.64 12.40 544 496 39.9 28,196 25,792 2,067
Production occupations ........... 16.48 15.00 655 598 39.8 33,981 31,013 2,062
See footnotes at end of table.
NATIONAL COMPENSATION SURVEY
All United States 3-30 December 2009 - January 2011
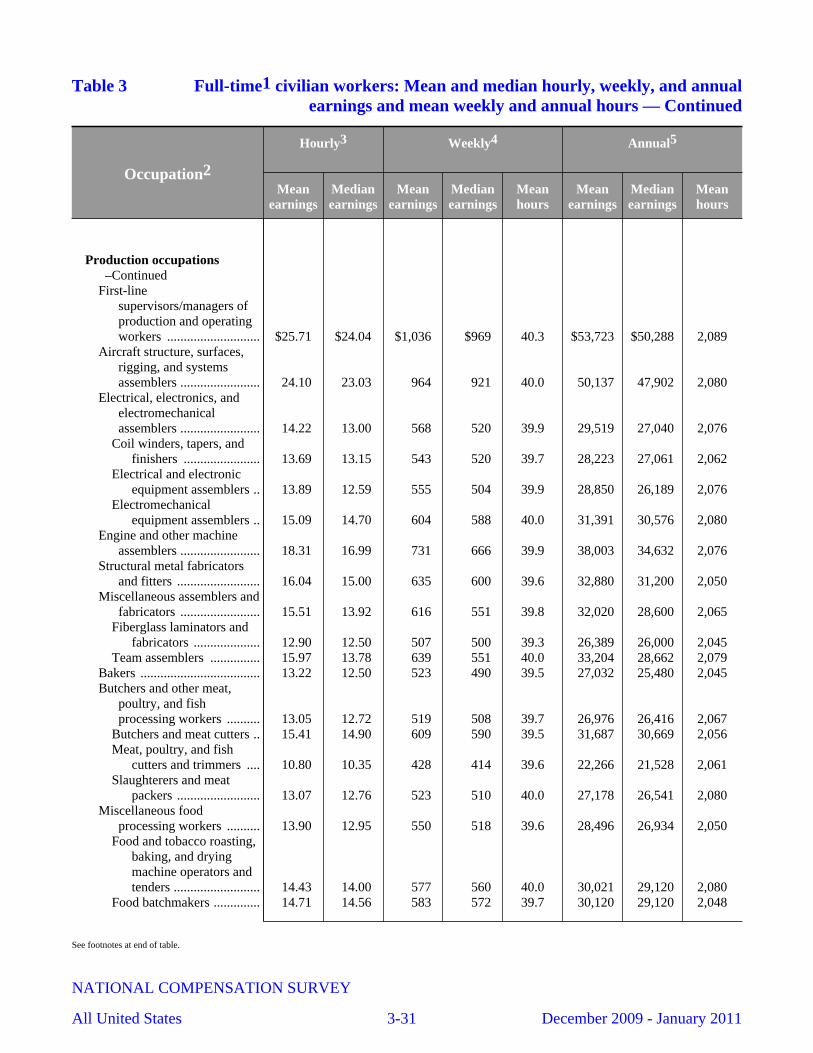
Table 3 Full-time1 civilian workers: Mean and median hourly, weekly, and annualearnings and mean weekly and annual hours — Continued
Occupation2
Hourly3 Weekly4 Annual5
Meanearnings
Medianearnings
Meanearnings
Medianearnings
Meanhours
Meanearnings
Medianearnings
Meanhours
Production occupations–Continued
First-linesupervisors/managers ofproduction and operatingworkers ............................ $25.71 $24.04 $1,036 $969 40.3 $53,723 $50,288 2,089
Aircraft structure, surfaces,rigging, and systemsassemblers ........................ 24.10 23.03 964 921 40.0 50,137 47,902 2,080
Electrical, electronics, andelectromechanicalassemblers ........................ 14.22 13.00 568 520 39.9 29,519 27,040 2,076
Coil winders, tapers, andfinishers ....................... 13.69 13.15 543 520 39.7 28,223 27,061 2,062
Electrical and electronicequipment assemblers .. 13.89 12.59 555 504 39.9 28,850 26,189 2,076
Electromechanicalequipment assemblers .. 15.09 14.70 604 588 40.0 31,391 30,576 2,080
Engine and other machineassemblers ........................ 18.31 16.99 731 666 39.9 38,003 34,632 2,076
Structural metal fabricatorsand fitters ......................... 16.04 15.00 635 600 39.6 32,880 31,200 2,050
Miscellaneous assemblers andfabricators ........................ 15.51 13.92 616 551 39.8 32,020 28,600 2,065
Fiberglass laminators andfabricators .................... 12.90 12.50 507 500 39.3 26,389 26,000 2,045
Team assemblers ............... 15.97 13.78 639 551 40.0 33,204 28,662 2,079Bakers .................................... 13.22 12.50 523 490 39.5 27,032 25,480 2,045Butchers and other meat,
poultry, and fishprocessing workers .......... 13.05 12.72 519 508 39.7 26,976 26,416 2,067
Butchers and meat cutters .. 15.41 14.90 609 590 39.5 31,687 30,669 2,056Meat, poultry, and fish
cutters and trimmers .... 10.80 10.35 428 414 39.6 22,266 21,528 2,061Slaughterers and meat
packers ......................... 13.07 12.76 523 510 40.0 27,178 26,541 2,080Miscellaneous food
processing workers .......... 13.90 12.95 550 518 39.6 28,496 26,934 2,050Food and tobacco roasting,
baking, and dryingmachine operators andtenders .......................... 14.43 14.00 577 560 40.0 30,021 29,120 2,080
Food batchmakers .............. 14.71 14.56 583 572 39.7 30,120 29,120 2,048
See footnotes at end of table.
NATIONAL COMPENSATION SURVEY
All United States 3-31 December 2009 - January 2011
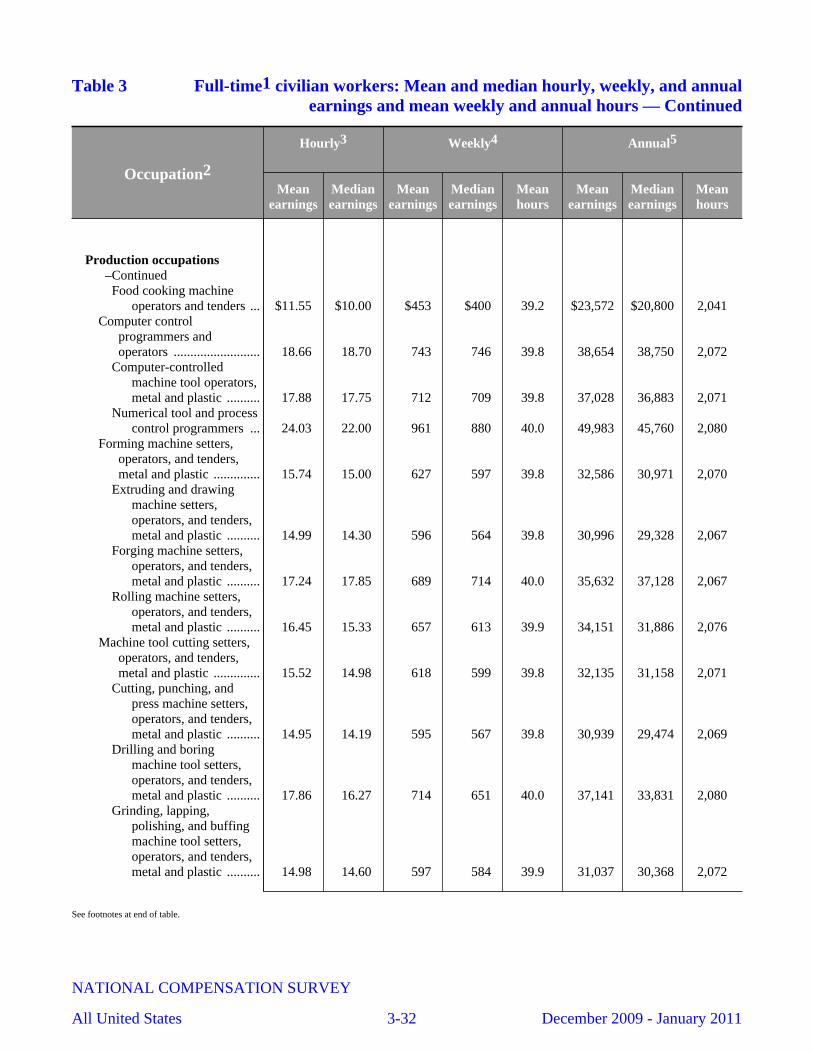
Table 3 Full-time1 civilian workers: Mean and median hourly, weekly, and annualearnings and mean weekly and annual hours — Continued
Occupation2
Hourly3 Weekly4 Annual5
Meanearnings
Medianearnings
Meanearnings
Medianearnings
Meanhours
Meanearnings
Medianearnings
Meanhours
Production occupations–ContinuedFood cooking machine
operators and tenders ... $11.55 $10.00 $453 $400 39.2 $23,572 $20,800 2,041Computer control
programmers andoperators .......................... 18.66 18.70 743 746 39.8 38,654 38,750 2,072
Computer-controlledmachine tool operators,metal and plastic .......... 17.88 17.75 712 709 39.8 37,028 36,883 2,071
Numerical tool and processcontrol programmers ... 24.03 22.00 961 880 40.0 49,983 45,760 2,080
Forming machine setters,operators, and tenders,metal and plastic .............. 15.74 15.00 627 597 39.8 32,586 30,971 2,070
Extruding and drawingmachine setters,operators, and tenders,metal and plastic .......... 14.99 14.30 596 564 39.8 30,996 29,328 2,067
Forging machine setters,operators, and tenders,metal and plastic .......... 17.24 17.85 689 714 40.0 35,632 37,128 2,067
Rolling machine setters,operators, and tenders,metal and plastic .......... 16.45 15.33 657 613 39.9 34,151 31,886 2,076
Machine tool cutting setters,operators, and tenders,metal and plastic .............. 15.52 14.98 618 599 39.8 32,135 31,158 2,071
Cutting, punching, andpress machine setters,operators, and tenders,metal and plastic .......... 14.95 14.19 595 567 39.8 30,939 29,474 2,069
Drilling and boringmachine tool setters,operators, and tenders,metal and plastic .......... 17.86 16.27 714 651 40.0 37,141 33,831 2,080
Grinding, lapping,polishing, and buffingmachine tool setters,operators, and tenders,metal and plastic .......... 14.98 14.60 597 584 39.9 31,037 30,368 2,072
See footnotes at end of table.
NATIONAL COMPENSATION SURVEY
All United States 3-32 December 2009 - January 2011

Table 3 Full-time1 civilian workers: Mean and median hourly, weekly, and annualearnings and mean weekly and annual hours — Continued
Occupation2
Hourly3 Weekly4 Annual5
Meanearnings
Medianearnings
Meanearnings
Medianearnings
Meanhours
Meanearnings
Medianearnings
Meanhours
Production occupations–ContinuedLathe and turning machine
tool setters, operators,and tenders, metal andplastic ........................... $17.12 $18.00 $682 $720 39.9 $35,490 $37,440 2,073
Milling and planingmachine setters,operators, and tenders,metal and plastic .......... 17.59 18.54 704 742 40.0 36,589 38,563 2,080
Machinists .............................. 22.15 20.81 884 832 39.9 45,943 43,285 2,074Metal furnace and kiln
operators and tenders ....... 17.15 18.15 685 716 39.9 35,590 37,240 2,076Metal-refining furnace
operators and tenders ... 16.77 15.50 670 620 39.9 34,797 32,240 2,075Pourers and casters, metal 17.76 18.15 709 726 39.9 36,889 37,752 2,077
Model makers andpatternmakers, metal andplastic ............................... 23.33 23.19 933 928 40.0 48,486 48,235 2,079
Model makers, metal andplastic ........................... 24.90 23.77 996 951 40.0 51,786 49,442 2,080
Patternmakers, metal andplastic ........................... 20.21 16.50 809 660 40.0 41,962 34,320 2,076
Molders and moldingmachine setters,operators, and tenders,metal and plastic .............. 13.61 12.83 543 512 39.9 28,210 26,458 2,073
Foundry mold andcoremakers ................... 15.24 16.68 610 667 40.0 31,707 34,694 2,080
Molding, coremaking, andcasting machine setters,operators, and tenders,metal and plastic .......... 13.43 12.50 535 500 39.9 27,828 25,917 2,073
Multiple machine tool setters,operators, and tenders,metal and plastic .............. 16.16 14.82 646 588 39.9 33,559 30,576 2,077
Tool and die makers .............. 24.82 24.65 990 980 39.9 51,478 50,960 2,074Welding, soldering, and
brazing workers ............... 17.73 17.00 707 675 39.9 36,737 35,110 2,072Welders, cutters, solderers,
and brazers ................... 17.89 17.00 714 680 39.9 37,105 35,360 2,074
See footnotes at end of table.
NATIONAL COMPENSATION SURVEY
All United States 3-33 December 2009 - January 2011

Table 3 Full-time1 civilian workers: Mean and median hourly, weekly, and annualearnings and mean weekly and annual hours — Continued
Occupation2
Hourly3 Weekly4 Annual5
Meanearnings
Medianearnings
Meanearnings
Medianearnings
Meanhours
Meanearnings
Medianearnings
Meanhours
Production occupations–ContinuedWelding, soldering, and
brazing machinesetters, operators, andtenders .......................... $17.10 $17.00 $680 $672 39.8 $35,343 $34,923 2,067
Miscellaneous metalworkersand plastic workers .......... 15.48 15.00 617 600 39.9 32,099 31,200 2,073
Heat treating equipmentsetters, operators, andtenders, metal andplastic ........................... 15.38 15.28 614 611 40.0 31,949 31,780 2,077
Lay-out workers, metal andplastic ........................... 18.14 16.00 726 640 40.0 37,694 33,280 2,078
Plating and coatingmachine setters,operators, and tenders,metal and plastic .......... 17.14 15.66 685 626 40.0 35,644 32,573 2,080
Tool grinders, filers, andsharpeners .................... 16.29 17.00 649 680 39.9 33,774 35,360 2,073
Bookbinders and binderyworkers ............................ 14.39 13.76 557 540 38.7 28,973 28,059 2,014
Bindery workers ................ 14.39 13.76 557 540 38.7 28,973 28,059 2,014Printers ................................... 17.70 17.03 702 681 39.6 36,463 35,416 2,060
Job printers ........................ 17.59 19.00 704 760 40.0 36,590 39,520 2,080Prepress technicians and
workers ........................ 20.30 20.30 800 776 39.4 41,592 40,359 2,049Printing machine operators 17.02 16.00 675 640 39.7 35,089 33,280 2,061
Laundry and dry-cleaningworkers ............................ 10.78 10.02 421 400 39.0 21,878 20,800 2,029
Pressers, textile, garment, andrelated materials ............... 9.24 8.75 358 346 38.7 18,604 17,984 2,013
Sewing machine operators ..... 11.85 11.00 471 440 39.7 24,403 22,880 2,060Tailors, dressmakers, and
sewers .............................. 15.71 12.14 579 510 36.9 30,127 26,517 1,918Tailors, dressmakers, and
custom sewers .............. 15.45 12.14 568 450 36.7 29,515 23,400 1,910Textile machine setters,
operators, and tenders ...... 12.03 11.00 477 435 39.7 24,803 22,630 2,062Textile bleaching and
dyeing machineoperators and tenders ... 10.21 9.00 396 326 38.8 20,592 16,952 2,016
See footnotes at end of table.
NATIONAL COMPENSATION SURVEY
All United States 3-34 December 2009 - January 2011
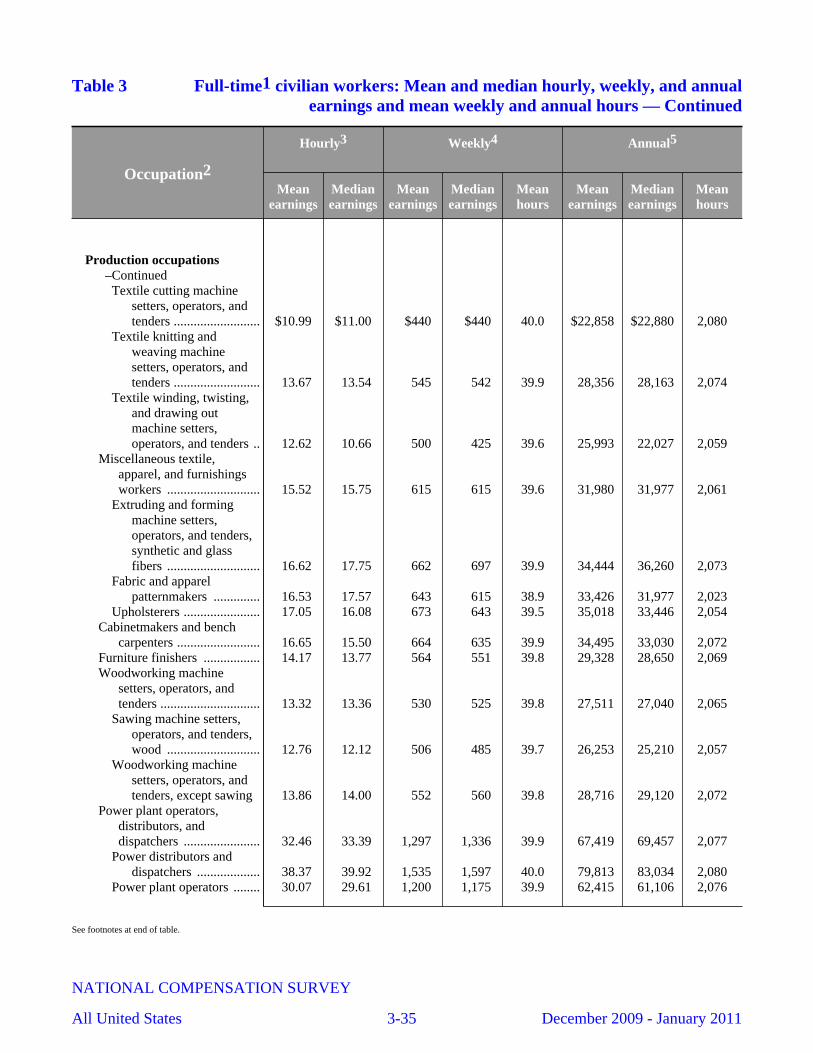
Table 3 Full-time1 civilian workers: Mean and median hourly, weekly, and annualearnings and mean weekly and annual hours — Continued
Occupation2
Hourly3 Weekly4 Annual5
Meanearnings
Medianearnings
Meanearnings
Medianearnings
Meanhours
Meanearnings
Medianearnings
Meanhours
Production occupations–ContinuedTextile cutting machine
setters, operators, andtenders .......................... $10.99 $11.00 $440 $440 40.0 $22,858 $22,880 2,080
Textile knitting andweaving machinesetters, operators, andtenders .......................... 13.67 13.54 545 542 39.9 28,356 28,163 2,074
Textile winding, twisting,and drawing outmachine setters,operators, and tenders .. 12.62 10.66 500 425 39.6 25,993 22,027 2,059
Miscellaneous textile,apparel, and furnishingsworkers ............................ 15.52 15.75 615 615 39.6 31,980 31,977 2,061
Extruding and formingmachine setters,operators, and tenders,synthetic and glassfibers ............................ 16.62 17.75 662 697 39.9 34,444 36,260 2,073
Fabric and apparelpatternmakers .............. 16.53 17.57 643 615 38.9 33,426 31,977 2,023
Upholsterers ....................... 17.05 16.08 673 643 39.5 35,018 33,446 2,054Cabinetmakers and bench
carpenters ......................... 16.65 15.50 664 635 39.9 34,495 33,030 2,072Furniture finishers ................. 14.17 13.77 564 551 39.8 29,328 28,650 2,069Woodworking machine
setters, operators, andtenders .............................. 13.32 13.36 530 525 39.8 27,511 27,040 2,065
Sawing machine setters,operators, and tenders,wood ............................ 12.76 12.12 506 485 39.7 26,253 25,210 2,057
Woodworking machinesetters, operators, andtenders, except sawing 13.86 14.00 552 560 39.8 28,716 29,120 2,072
Power plant operators,distributors, anddispatchers ....................... 32.46 33.39 1,297 1,336 39.9 67,419 69,457 2,077
Power distributors anddispatchers ................... 38.37 39.92 1,535 1,597 40.0 79,813 83,034 2,080
Power plant operators ........ 30.07 29.61 1,200 1,175 39.9 62,415 61,106 2,076
See footnotes at end of table.
NATIONAL COMPENSATION SURVEY
All United States 3-35 December 2009 - January 2011
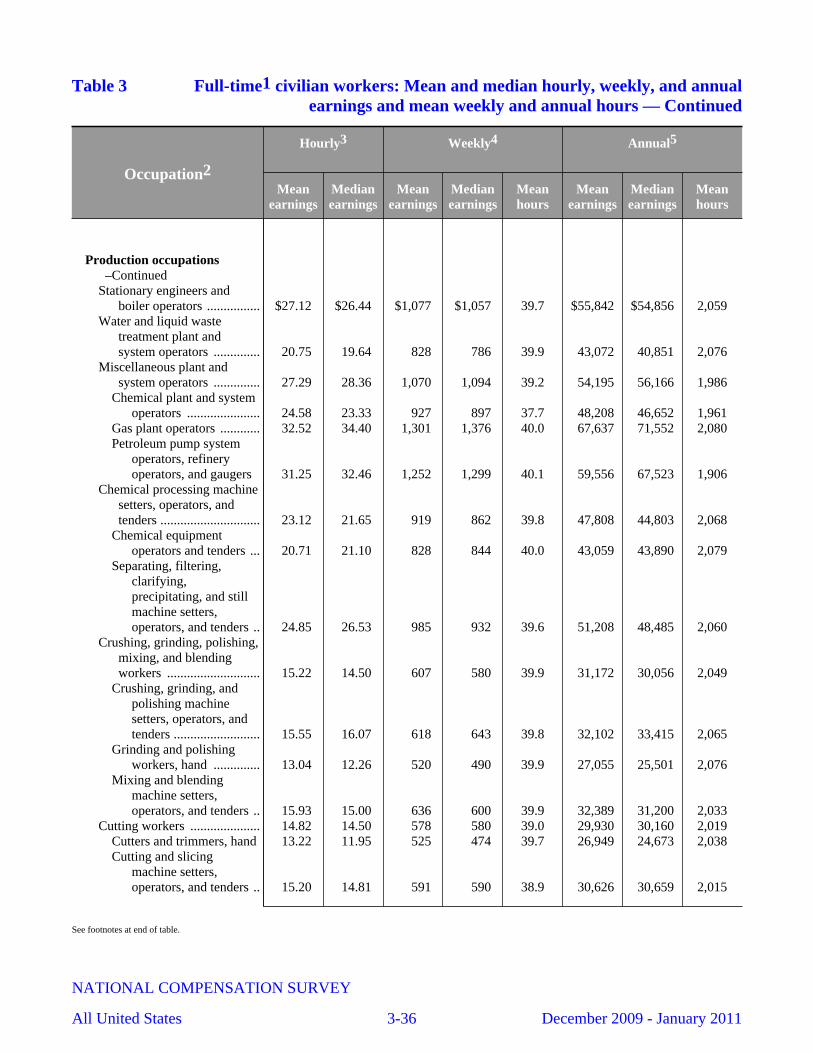
Table 3 Full-time1 civilian workers: Mean and median hourly, weekly, and annualearnings and mean weekly and annual hours — Continued
Occupation2
Hourly3 Weekly4 Annual5
Meanearnings
Medianearnings
Meanearnings
Medianearnings
Meanhours
Meanearnings
Medianearnings
Meanhours
Production occupations–Continued
Stationary engineers andboiler operators ................ $27.12 $26.44 $1,077 $1,057 39.7 $55,842 $54,856 2,059
Water and liquid wastetreatment plant andsystem operators .............. 20.75 19.64 828 786 39.9 43,072 40,851 2,076
Miscellaneous plant andsystem operators .............. 27.29 28.36 1,070 1,094 39.2 54,195 56,166 1,986
Chemical plant and systemoperators ...................... 24.58 23.33 927 897 37.7 48,208 46,652 1,961
Gas plant operators ............ 32.52 34.40 1,301 1,376 40.0 67,637 71,552 2,080Petroleum pump system
operators, refineryoperators, and gaugers 31.25 32.46 1,252 1,299 40.1 59,556 67,523 1,906
Chemical processing machinesetters, operators, andtenders .............................. 23.12 21.65 919 862 39.8 47,808 44,803 2,068
Chemical equipmentoperators and tenders ... 20.71 21.10 828 844 40.0 43,059 43,890 2,079
Separating, filtering,clarifying,precipitating, and stillmachine setters,operators, and tenders .. 24.85 26.53 985 932 39.6 51,208 48,485 2,060
Crushing, grinding, polishing,mixing, and blendingworkers ............................ 15.22 14.50 607 580 39.9 31,172 30,056 2,049
Crushing, grinding, andpolishing machinesetters, operators, andtenders .......................... 15.55 16.07 618 643 39.8 32,102 33,415 2,065
Grinding and polishingworkers, hand .............. 13.04 12.26 520 490 39.9 27,055 25,501 2,076
Mixing and blendingmachine setters,operators, and tenders .. 15.93 15.00 636 600 39.9 32,389 31,200 2,033
Cutting workers ..................... 14.82 14.50 578 580 39.0 29,930 30,160 2,019Cutters and trimmers, hand 13.22 11.95 525 474 39.7 26,949 24,673 2,038Cutting and slicing
machine setters,operators, and tenders .. 15.20 14.81 591 590 38.9 30,626 30,659 2,015
See footnotes at end of table.
NATIONAL COMPENSATION SURVEY
All United States 3-36 December 2009 - January 2011

Table 3 Full-time1 civilian workers: Mean and median hourly, weekly, and annualearnings and mean weekly and annual hours — Continued
Occupation2
Hourly3 Weekly4 Annual5
Meanearnings
Medianearnings
Meanearnings
Medianearnings
Meanhours
Meanearnings
Medianearnings
Meanhours
Production occupations–Continued
Extruding, forming, pressing,and compacting machinesetters, operators, andtenders .............................. $14.28 $13.20 $566 $525 39.6 $29,194 $27,456 2,044
Furnace, kiln, oven, drier, andkettle operators andtenders .............................. 16.98 15.97 679 639 40.0 35,318 33,218 2,080
Inspectors, testers, sorters,samplers, and weighers .... 17.19 16.16 687 642 40.0 35,600 33,363 2,071
Jewelers and precious stoneand metal workers ............ 19.04 18.00 761 720 40.0 39,597 37,440 2,080
Medical, dental, andophthalmic laboratorytechnicians ....................... 16.94 15.50 677 620 40.0 35,171 32,240 2,077
Dental laboratorytechnicians ................... 17.98 17.00 718 680 39.9 37,353 35,360 2,077
Ophthalmic laboratorytechnicians ................... 13.01 13.00 520 520 40.0 26,990 27,040 2,075
Packaging and fillingmachine operators andtenders .............................. 14.67 14.00 585 560 39.9 30,333 29,078 2,068
Painting workers .................... 16.84 15.39 664 610 39.4 34,522 31,741 2,050Coating, painting, and
spraying machinesetters, operators, andtenders .......................... 14.82 15.06 586 602 39.5 30,464 31,325 2,055
Painters, transportationequipment .................... 21.64 19.15 857 781 39.6 44,580 40,604 2,060
Painting, coating, anddecorating workers ...... 12.24 11.61 469 430 38.4 24,403 22,360 1,994
Photographic process workersand processing machineoperators .......................... 14.49 13.14 540 492 37.2 28,064 25,605 1,937
Photographic processworkers ........................ 15.66 12.00 537 360 34.3 27,920 18,720 1,782
Photographic processingmachine operators ........ 14.01 14.48 541 556 38.6 28,131 28,891 2,008
Semiconductor processors ..... 18.29 18.24 731 730 40.0 38,034 37,948 2,080Miscellaneous production
workers ............................ 13.98 12.45 555 496 39.7 28,600 25,792 2,046
See footnotes at end of table.
NATIONAL COMPENSATION SURVEY
All United States 3-37 December 2009 - January 2011
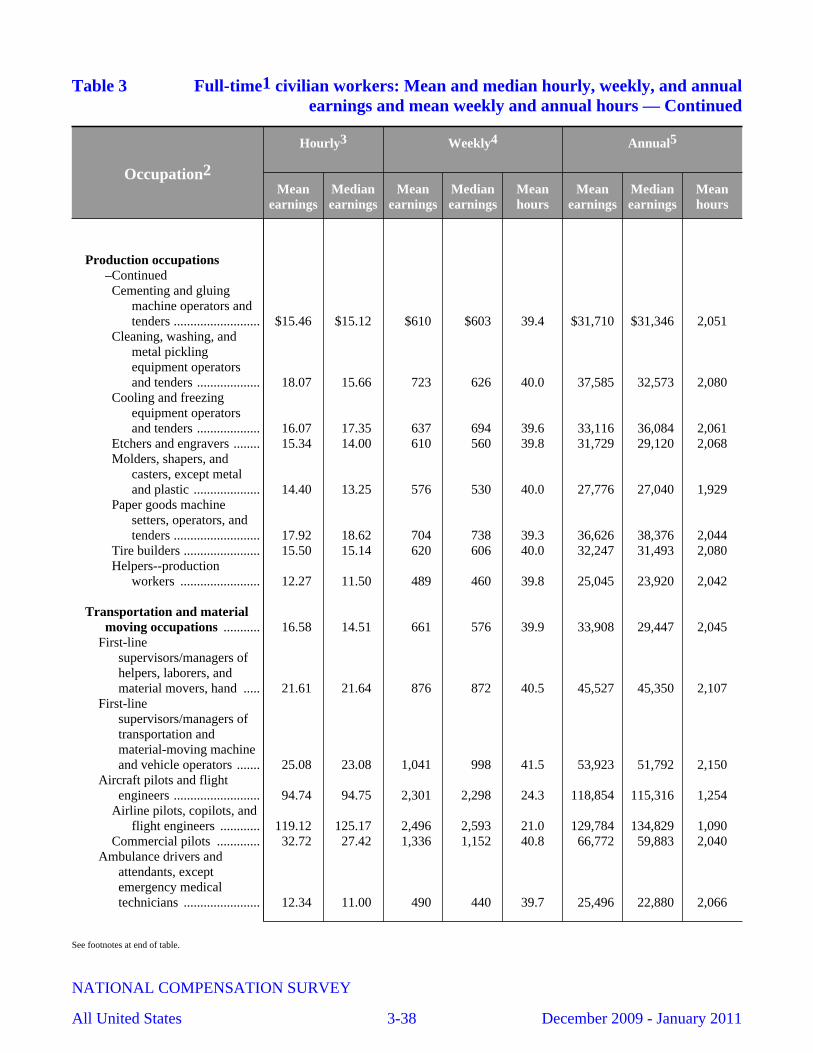
Table 3 Full-time1 civilian workers: Mean and median hourly, weekly, and annualearnings and mean weekly and annual hours — Continued
Occupation2
Hourly3 Weekly4 Annual5
Meanearnings
Medianearnings
Meanearnings
Medianearnings
Meanhours
Meanearnings
Medianearnings
Meanhours
Production occupations–ContinuedCementing and gluing
machine operators andtenders .......................... $15.46 $15.12 $610 $603 39.4 $31,710 $31,346 2,051
Cleaning, washing, andmetal picklingequipment operatorsand tenders ................... 18.07 15.66 723 626 40.0 37,585 32,573 2,080
Cooling and freezingequipment operatorsand tenders ................... 16.07 17.35 637 694 39.6 33,116 36,084 2,061
Etchers and engravers ........ 15.34 14.00 610 560 39.8 31,729 29,120 2,068Molders, shapers, and
casters, except metaland plastic .................... 14.40 13.25 576 530 40.0 27,776 27,040 1,929
Paper goods machinesetters, operators, andtenders .......................... 17.92 18.62 704 738 39.3 36,626 38,376 2,044
Tire builders ....................... 15.50 15.14 620 606 40.0 32,247 31,493 2,080Helpers--production
workers ........................ 12.27 11.50 489 460 39.8 25,045 23,920 2,042
Transportation and materialmoving occupations ........... 16.58 14.51 661 576 39.9 33,908 29,447 2,045
First-linesupervisors/managers ofhelpers, laborers, andmaterial movers, hand ..... 21.61 21.64 876 872 40.5 45,527 45,350 2,107
First-linesupervisors/managers oftransportation andmaterial-moving machineand vehicle operators ....... 25.08 23.08 1,041 998 41.5 53,923 51,792 2,150
Aircraft pilots and flightengineers .......................... 94.74 94.75 2,301 2,298 24.3 118,854 115,316 1,254
Airline pilots, copilots, andflight engineers ............ 119.12 125.17 2,496 2,593 21.0 129,784 134,829 1,090
Commercial pilots ............. 32.72 27.42 1,336 1,152 40.8 66,772 59,883 2,040Ambulance drivers and
attendants, exceptemergency medicaltechnicians ....................... 12.34 11.00 490 440 39.7 25,496 22,880 2,066
See footnotes at end of table.
NATIONAL COMPENSATION SURVEY
All United States 3-38 December 2009 - January 2011
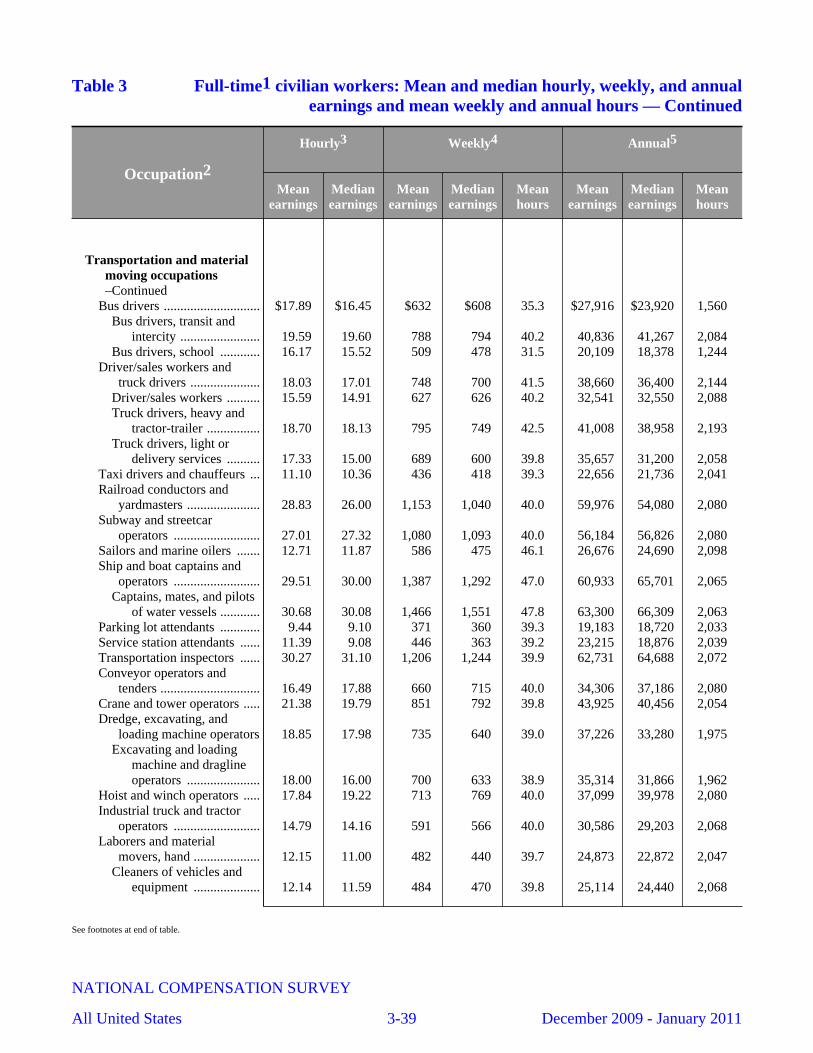
Table 3 Full-time1 civilian workers: Mean and median hourly, weekly, and annualearnings and mean weekly and annual hours — Continued
Occupation2
Hourly3 Weekly4 Annual5
Meanearnings
Medianearnings
Meanearnings
Medianearnings
Meanhours
Meanearnings
Medianearnings
Meanhours
Transportation and materialmoving occupations–Continued
Bus drivers ............................. $17.89 $16.45 $632 $608 35.3 $27,916 $23,920 1,560Bus drivers, transit and
intercity ........................ 19.59 19.60 788 794 40.2 40,836 41,267 2,084Bus drivers, school ............ 16.17 15.52 509 478 31.5 20,109 18,378 1,244
Driver/sales workers andtruck drivers ..................... 18.03 17.01 748 700 41.5 38,660 36,400 2,144
Driver/sales workers .......... 15.59 14.91 627 626 40.2 32,541 32,550 2,088Truck drivers, heavy and
tractor-trailer ................ 18.70 18.13 795 749 42.5 41,008 38,958 2,193Truck drivers, light or
delivery services .......... 17.33 15.00 689 600 39.8 35,657 31,200 2,058Taxi drivers and chauffeurs ... 11.10 10.36 436 418 39.3 22,656 21,736 2,041Railroad conductors and
yardmasters ...................... 28.83 26.00 1,153 1,040 40.0 59,976 54,080 2,080Subway and streetcar
operators .......................... 27.01 27.32 1,080 1,093 40.0 56,184 56,826 2,080Sailors and marine oilers ....... 12.71 11.87 586 475 46.1 26,676 24,690 2,098Ship and boat captains and
operators .......................... 29.51 30.00 1,387 1,292 47.0 60,933 65,701 2,065Captains, mates, and pilots
of water vessels ............ 30.68 30.08 1,466 1,551 47.8 63,300 66,309 2,063Parking lot attendants ............ 9.44 9.10 371 360 39.3 19,183 18,720 2,033Service station attendants ...... 11.39 9.08 446 363 39.2 23,215 18,876 2,039Transportation inspectors ...... 30.27 31.10 1,206 1,244 39.9 62,731 64,688 2,072Conveyor operators and
tenders .............................. 16.49 17.88 660 715 40.0 34,306 37,186 2,080Crane and tower operators ..... 21.38 19.79 851 792 39.8 43,925 40,456 2,054Dredge, excavating, and
loading machine operators 18.85 17.98 735 640 39.0 37,226 33,280 1,975Excavating and loading
machine and draglineoperators ...................... 18.00 16.00 700 633 38.9 35,314 31,866 1,962
Hoist and winch operators ..... 17.84 19.22 713 769 40.0 37,099 39,978 2,080Industrial truck and tractor
operators .......................... 14.79 14.16 591 566 40.0 30,586 29,203 2,068Laborers and material
movers, hand .................... 12.15 11.00 482 440 39.7 24,873 22,872 2,047Cleaners of vehicles and
equipment .................... 12.14 11.59 484 470 39.8 25,114 24,440 2,068
See footnotes at end of table.
NATIONAL COMPENSATION SURVEY
All United States 3-39 December 2009 - January 2011
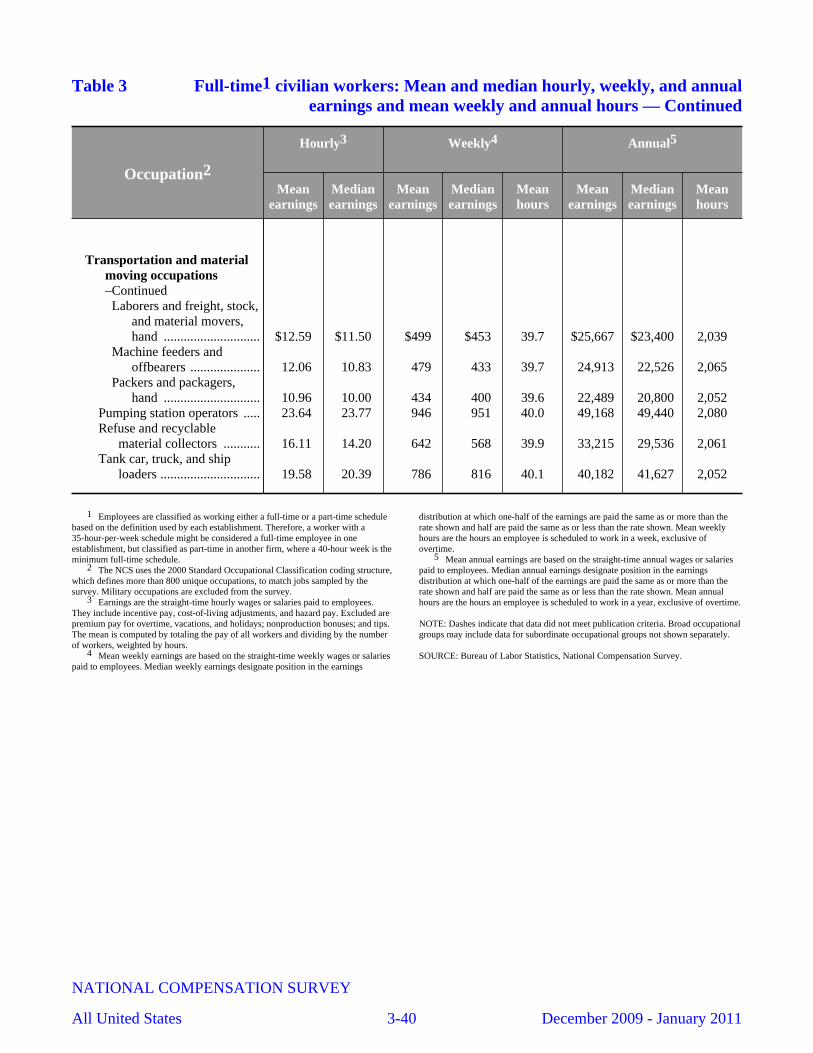
Table 3 Full-time1 civilian workers: Mean and median hourly, weekly, and annualearnings and mean weekly and annual hours — Continued
Occupation2
Hourly3 Weekly4 Annual5
Meanearnings
Medianearnings
Meanearnings
Medianearnings
Meanhours
Meanearnings
Medianearnings
Meanhours
Transportation and materialmoving occupations–ContinuedLaborers and freight, stock,
and material movers,hand ............................. $12.59 $11.50 $499 $453 39.7 $25,667 $23,400 2,039
Machine feeders andoffbearers ..................... 12.06 10.83 479 433 39.7 24,913 22,526 2,065
Packers and packagers,hand ............................. 10.96 10.00 434 400 39.6 22,489 20,800 2,052
Pumping station operators ..... 23.64 23.77 946 951 40.0 49,168 49,440 2,080Refuse and recyclable
material collectors ........... 16.11 14.20 642 568 39.9 33,215 29,536 2,061Tank car, truck, and ship
loaders .............................. 19.58 20.39 786 816 40.1 40,182 41,627 2,052
1 Employees are classified as working either a full-time or a part-time schedulebased on the definition used by each establishment. Therefore, a worker with a35-hour-per-week schedule might be considered a full-time employee in oneestablishment, but classified as part-time in another firm, where a 40-hour week is theminimum full-time schedule.
2 The NCS uses the 2000 Standard Occupational Classification coding structure,which defines more than 800 unique occupations, to match jobs sampled by thesurvey. Military occupations are excluded from the survey.
3 Earnings are the straight-time hourly wages or salaries paid to employees.They include incentive pay, cost-of-living adjustments, and hazard pay. Excluded arepremium pay for overtime, vacations, and holidays; nonproduction bonuses; and tips.The mean is computed by totaling the pay of all workers and dividing by the numberof workers, weighted by hours.
4 Mean weekly earnings are based on the straight-time weekly wages or salariespaid to employees. Median weekly earnings designate position in the earnings
distribution at which one-half of the earnings are paid the same as or more than therate shown and half are paid the same as or less than the rate shown. Mean weeklyhours are the hours an employee is scheduled to work in a week, exclusive ofovertime.
5 Mean annual earnings are based on the straight-time annual wages or salariespaid to employees. Median annual earnings designate position in the earningsdistribution at which one-half of the earnings are paid the same as or more than therate shown and half are paid the same as or less than the rate shown. Mean annualhours are the hours an employee is scheduled to work in a year, exclusive of overtime.
NOTE: Dashes indicate that data did not meet publication criteria. Broad occupationalgroups may include data for subordinate occupational groups not shown separately.
SOURCE: Bureau of Labor Statistics, National Compensation Survey.
NATIONAL COMPENSATION SURVEY
All United States 3-40 December 2009 - January 2011