systemic evaluation - saide of education - systemic... · this historic report on systemic...
TRANSCRIPT

Systemic Evaluation
Foundation Phase
Mainstream
National Report
Chief Directorate: Quality AssuranceDepartment of Education
Pretoria

ii
FOREWORD BY THE MINISTER
This report on the Systemic Evaluation at the Foundation Phase level, a first of its kind, marks yetanother historic milestone in the transformation of our education system. The report gives a snapshotof the gains made and the challenges that still remain in consolidating a democratic system that pro-vides good quality education.
Besides heavy investment into education, we have put in place democratic laws that redress thelegacy of the racially-discriminating education of yesterday and create a conducive climate forcontinuous improvement. We now have laws that enable all children to access free, compulsory andinclusive primary education.
To ensure success within the system, we have evolved a curriculum that places assessment of clearly-enunciated outcomes at the heart of the learning process, thereby making assessment learner-friendlyand success-oriented rather than judgemental. We have established norms, such as teacher:learnerratios, to ensure an equitable spread of human and material resources. By devolving school gover-nance to local communities, we have rekindled a sense of pride and ownership and thus increasedresponsibility and accountability among role-players.
Evaluating the impact of all these initiatives presented a huge challenge. Part of the challenge wasselecting - from a myriad of possibilities, and taking into account the understandable diversity ofinterests in education - acceptable criteria and indicators against which the performance of the systemcould be measured. In this regard, the inimitable accomplishment of the various stakeholders in nego-tiating a credible set of indicators is commended. These indicators emanate from the transformationalgoals of access, equity, quality and redress. They have been meticulously employed to qualify theinputs, processes outputs and outcomes of the system as well as the context in which teaching andlearning occur.
The report accounts for the national resource inputs into the education system. The findings providevaluable baseline data to benchmark the performance of the system at the Foundation Phase. Thiskind of insight increases public confidence in the system. The report also points to critical areas ofimprovement. In conjunction with data generated from the Whole-School Evaluation processes, thereport will provide a holistic picture of our education.
I wish to thank all those who facilitated this study, and who participated in making it a success.
Professor Kader Asmal, MPMinister of Education
Systemic Evaluation 2003 - Foundation Phase

iii
STATEMENT BY THE DIRECTOR-GENERAL
It is heartening to observe that one of the noble missions we set out to accomplish, namely, takingstock of our education system at the end of the Foundation Phase has, in due season, borne thedesired fruit. The scene was set in 1998 when we - through wide consultation, intensive collaborationand cordial consensus - successfully identified a set of indicators of quality education that wereconsidered appropriate in measuring the performance of our education system. That process led tothe development and subsequent piloting of the evaluation instruments in 2000. The main SystemicEvaluation study at the Foundation Phase was conducted during 2001/2. This report is, therefore, aculmination of years of dedication and hard work by various role-players. May their kind increase!
We now stand at the threshold of a new phase in the transformation of the system, that of having ourown South African frame of reference against which we shall be able to track our progression towardsthe national goals of access, equity, quality and redress.
I call upon all South Africans to receive this report for what it is, firstly, a bill of health of our educationsystem and, secondly, a benchmark cut to indicate where we should be leveling our intervention strate-gies for improvement. As such, the report points out strengths and areas that need further develop-ment in the system. It is hoped that the report will generate illuminating debates at various levels andthat the debates will crystallize in definite actions that seek to sharpen the effectiveness of the educa-tion system in schools. Guided by the findings and the recommendations in this report, let us marshalall the resources at our disposal, both human and material, to make good where we appear to havefallen short and excel where we have been strong.
Mr Thami MselekuDirector-General
Systemic Evaluation 2003 - Foundation Phase

Systemic Evaluation 2003 - Foundation Phase iv
TABLE OF CONTENTS
Page
FOREWORD BY THE MINISTER ii
STATEMENT BY THE DIRECTOR-GENERAL iiii
GLOSSARY OF ACRONYMS vii
EXECUTIVE SUMMARY viii
Introduction viiiIndicators viiiMethodology viiiFindings on Learner Performance viiiFactors Affecting Learner Performance ixConclusion x
CHAPTER 1: BACKGROUND 1
1.1 Introduction 11.2 The South African Education Context 11.3 The Legislative Imperatives for Systemic Evaluation 21.4 What is Systemic Evaluation? 21.5 Objectives of Systemic Evaluation 21.6 Focus of the Report 3
CHAPTER 2: THE SYSTEMIC EVALUATION FRAMEWORK 5
2.1 Systemic Evaluation within Quality Assurance 52.2 The Use of Indicators and What They Intend to Measure 52.3 Policy Principles 62.4 The Transformation Goals of Education 6
CHAPTER 3: CONDUCT OF THE STUDY 7
3.1 Introduction 73.2 Co-operation between the Department of Education
and Service Providers 73.3 Instrument Development 73.4 Data Collection 93.5 Data Coding and Scoring 93.6 Data Entry and Cleaning 103.7 Data Analysis and Reporting 103.8 Limitations of the Study 11
v
CHAPTER 4: TRANSFORMATION GOAL: ACCESS 13
4.1 Introduction 134.2 Findings: Access Indicators 134.3 Findings: Learner Performance 224.4 Pccess Indicators Influencing Learner Performance 224.5 Discussion and Interpretation of Findings 234.6 Policy Suggestions 264.7 Conclusion 26
CHAPTER 5: TRANSFORMATION GOAL: EQUITY 27
5.1 Introduction 275.2 Findings: Equity Indicators 275.3 Findings: Learner Performance 325.4 Equity Indicators Influencing Learner Performance 325.5 Discussion and Analysis of Findings 335.6 Policy Suggestions 365.7 Conclusion 37
CHAPTER 6: TRANSFORMATION GOAL: QUALITY 39
6.1 Introduction 396.2 Findings: Quality Indicators 396.3 Findings: Learner Performance 516.4 Quality Indicators Influencing Learner Performance 516.5 Discussion and Analysis of Findings 526.6 Policy Suggestions 556.7 Conclusion 55
CHAPTER 7: LEARNER ASSESSMENT 57
7.1 Introduction 577.2 Reliability of Assessment Instruments 577.2 Learner Performance 577.3 Learner Scores by Province 617.4 Learner Performance by Gender 617.5 Learner Performance by Item Format 627.6 Literacy Scores by Reading and Writing 637.7 Language of Instruction and Home Language 647.9 Conclusion 66
CHAPTER 8: CONCLUSION 69
Systemic Evaluation 2003 - Foundation Phase

Systemic Evaluation 2003 - Foundation Phase vi
REFERENCES 71
APPENDICES (COMPILED AS A SEPERATE VOLUME)
ERRATA
Page 103.7.1 Conditions of teaching and learning Delete entire sentence:Where applicable, a theoretical mean was also calculated to serve as a basis for comparison.
Page 11 – First paragraphAdd the following before the last sentence That is, only those scores for which we are 95% certain that there was a “real, non random” effectare reported.

vii
GLOSSARY OF ACRONYMS USED IN THIS REPORT
ABET Adult Basic Education and TrainingC2005 Curriculum 2005CEPD Centre for Education Policy Development, Evaluation and ManagementDoE Department of EducationELSEN Education of Learners with Special NeedsFRQ Free-Response QuestionsHSRC Human Sciences Research CouncilINSET In-Service TrainingLSEN Learners with Special Education NeedsMCQ Multiple-Choice QuestionsNQF National Qualifications FrameworkOBE Outcomes-Based Education RIEP Research Institute for Education PlanningSGB School Governing BodySRN School Register of Needs
Systemic Evaluation 2003 - Foundation Phase

Systemic Evaluation 2003 - Foundation Phase viii
EXECUTIVE SUMMARY
Introduction
This historic report on Systemic Evaluation at Foundation Phase (Grade 3 level) lays out an importantand useful systemic baseline to reflect subsequent progress made by the education system inachieving the transformation goals in respect of access, redress, equity and quality.
The report provides a snapshot of the gains made and the challenges that remain in ensuring thatlearners meet national standards in reading, listening, writing, numeracy and life skills. In addition toreporting on learner performance, the report examines the context in which learners experiencelearning and teaching, and attempts to link the academic performance of learners to their learningcontext. In so doing, Systemic Evaluation aspires to promote and ensure accountability and thus gainthe confidence of the public in education.
The end goal of Systemic Evaluation is to improve education delivery and its outcomes. It is the aimof the Department of Education that all stakeholders will interrogate the information provided by thestudy for this purpose.
Indicators
The indicators used in this baseline study have been identified by the Department of Education througha major process of research, and consultation with a wide range of stakeholders. The indicators dealwith the measurable features of the education system and thus provide an indication of its health. TheDepartment has adopted 26 indicators for this purpose.
Methodology
The Systemic Evaluation study has been led by the Quality Assurance Chief Directorate of theDepartment of Education. Technical support was provided by the Human Sciences Research Council(HSRC), the Research Institute for Education Planning (RIEP) and the Centre for Education PolicyDevelopment, Evaluation and Management (CEPD). The provincial departments of education playeda key role in designing the instruments that were used in the study, as well as in the collection andscoring of the data. Comments on the instruments and the study were invited from a number ofinternational sources, and these were used to improve the methodology.
The study involved a random sample of 5% (nearly 54 000 learners) of the Grade 3 learners in thecountry. The sample included all districts/regions in each province and was stratified to includelearners from urban, rural and farm schools.
Findings on Learner Performance
The national average scores achieved by typical Grade 3 learners in the South African educationsystem were as follows:
• Life Skills - 54%;

ix
• Literacy - 54% (with 68% in Listening Comprehension and 39% in Reading Comprehension andWriting); and
• Numeracy - 30%.
The results indicate that learners experience the greatest difficulty in Numeracy. While theperformance of learners in Literacy is significantly higher, it must be noted that this is due primarily tothe higher scores obtained in Listening Comprehension as opposed to the Reading and Writingaspects of Literacy.
The study found that the performance of learners was similar across all the provinces in all of the threeLearning Programmes assessed, and that the average score for girls was slightly higher than that ofboys in all three Learning Programmes assessed. Moreover, the scores obtained for the MultipleChoice Questions were significantly higher than those obtained for the Free Response Questions. Thisresult indicates that learners performed better on tasks that required them to identify and select a cor-rect response than on tasks that required them to produce their own response. The language in whichlearners undertook the tests also had a significant effect on their performance. Learners whoundertook tests in their home language obtained significantly higher scores across all LearningProgrammes than their counterparts who undertook their assessment tasks in a second or third lan-guage. This was particularly stark in Gauteng, where a significant number of learners wrote tests intheir second language.
Factors Affecting Learner Performance
This report examined the factors that affected the academic performance of learners through the lensof access, equity and quality indicators.
According to the results of a regression analysis, access indicators accounted for 20% of the variationin learner scores. Of all the access indicators used in the study, the resources at home indicator hadthe strongest positive influence on learner scores, followed by ease of access to school, number ofyears taken to complete a phase, utilisation of resource centres at school, early childhooddevelopment, pass rates and the education level of parents. An important aspect of the findings is thatgrade repetition did not improve learner scores, but did the opposite. This implies that repeating agrade does not necessarily help learners to improve their performance.
In general, equity indicators accounted for approximately 9% of the differences in learner performance.Of the equity indicators, discipline, safety and learning atmosphere had the largest positive influenceon learner scores followed by private contributions and utilisation of funds, and functioning of SGBs.
The safety and security aspects that were reported to have had a negative influence on the learningenvironment at schools included the availability and condition of the following: school patrol, securityguard/service, alarm system, fire extinguisher, first aid box and boundary wall/fence.An important finding is that the fees levied by schools differ markedly across schools and provinces.The majority of schools in the country charge fees of R100 or less per annum; a significant minority ofschools levy fees of more than R1000 per annum.
Quality indicators that had a significant influence on learner scores explained 22% of the differencesin learner performance. The facilities indicator had the strongest influence on learner scores followed
Systemic Evaluation 2003 - Foundation Phase

Systemic Evaluation 2003 - Foundation Phase x
by satisfaction rate of stakeholders, learning and teaching materials, teaching practices (learnerresponses), attendance rates, contact time and time on task, assessment of learners and feedbackprocedures, teaching practices (educator responses), and school management and leadership.
The indicators that had a negative influence on learner scores included repetition and dropout rates,INSET and SGB training, and record keeping.
Conclusion
The major findings are that there is a strong correlation between learner scores and the quality of thefacilities available at schools. The same is true of learning and teaching materials - learners in schoolsthat had greater learning and teaching materials obtained higher scores. There was also a correlationbetween learner scores and attendance rates, contact time and time on task.
From the results reported in this section, it is unclear why critical indicators that are known to influencelearner performance - for example, assessment of learners and homework - did not display an influ-ence on learner scores. It is vital that specific reasons for these findings be determined in follow-upstudies.

Chapter 1
1
BACKGROUND
1.1 Introduction
The demise of apartheid in 1994 brought with it the urgent need to overhaul an education system thathad been designed to exclude the majority from access to quality public education. One of the maintransformation goals of the immediate post-apartheid government was to ensure that all children,irrespective of their race, class, gender, religion and/or other characteristics, had access to basiceducation that was of good quality. This was to be achieved through, among other things, theapplication of appropriate redress policies. There is a growing recognition, however, of the need toexamine whether interventions by the Department of Education (DoE) have been successful inensuring that the transformation goals of education are met.
The South African National Qualifications Framework (NQF), which sets the broader context foreducation transformation in the post-apartheid era, makes it quite evident that there is a need tomeasure educational outcomes against predetermined standards. These standards are provided in thenew curriculum framework which, in addition to stating the expected outcomes of education generally,lays down the minimum standards required from the teaching and learning process at the end of eachgrade. This reflects a shift from the traditional focus on inputs to a concern for the processes andoutcomes of schooling.
1.2 The South African Education Context
The process of transforming education in South Africa has taken root visibly at all levels of the system.Part of the evidence for this lies in the establishment of democratically-elected local structures for thegovernance of schools, a major break from the repressive, centralised-control approach of the past. Toensure that there is order and discipline in public schools, the South African Schools Act of 1996 setsout guidelines for school governing bodies (SGBs) to consider when adopting a code of conduct forlearners. Parents, educators and learners are expected to facilitate a constructive teaching andlearning atmosphere in a safe environment.
The introduction of outcomes-based education (OBE), and a curriculum that is responsive to the needsof the learners as well as the goals of the country, ought not only make school offerings appealing tolearners and parents, but it also affords learners wide opportunities to access various competencies.The Department of Education has identified school effectiveness and educator professionalism as twinfactors whose improvement will play a key role in strengthening delivery capacity and improvinglearning outcomes. The Department has devoted significant resources to encouraging these factorsand to induce a stimulating culture of teaching and learning.
The transformation process has not been without challenges. The School Register of Needs (SRN)2000 Survey (DoE, 2001b) reported that in many parts of the country the system was still haunted bythe legacy of disparities - large classes, inadequate or no resources, and a large number of schoolsthat were accessible only by footpath. There are perceptions that the cadre of teachers who arealready in the system are encountering challenges in shifting to the new OBE approach to teaching
Systemic Evaluation 2003 - Foundation Phase

Systemic Evaluation 2003 - Foundation Phase 2
and learning. The survey also reported a decline in the numberof schools that had buildings inexcellent and good condition and an increase in the number of schools that had weak and very weakbuildings.
The South African government is faced with the challenge of not only transforming a segregated andauthoritarian system, but also of setting in place enabling mechanisms to introduce and sustaincontinuous improvement in the post-apartheid education system. Furthermore, it is imperative thatcontinual evaluations be conducted to track progression and to ensure that resources are appropriatelymarshalled to increase systemic efficiency. The legislative mandates for such evaluations arepresented below.
1.3 The Legislative Imperatives for Systemic Evaluation
Current education legislation in South Africa mandates the Minister of Education to evaluate andmonitor the standards of education provision, delivery and performance. For example, Section 8(1) ofthe National Education Policy Act of 1996 makes provision for the Minister of Education to “directstandards of education provision, delivery and performance throughout the Republic...”. According tothe Act, this monitoring and evaluation is to be carried out with a view to assessing progress incompliance with the provisions of the Constitution of the Republic of South Africa and nationaleducation policy.
In addition, Section 48 of the Assessment Policy for General Education and Training (DoE,1998)makes provision for Systemic Evaluation to be conducted on a nationally representative sample oflearners and learning sites in order to evaluate all aspects of the school system and LearningProgrammes. The Assessment Policy emphasises that the main objective of Systemic Evaluation is toassess the effectiveness of the entire system and the extent to which the vision and the goals of theeducation transformation process are being achieved by it.
In presenting its brief for Systemic Evaluation, the Department also draws on its Consultative PaperNo. 1 on Special Education, which emphasises the importance of quality assurance for the Educationof Learners with Special Education Needs (ELSEN). The discussion paper requires the educationsystem to be monitored and evaluated so as to determine the extent to which the full range of diverseneeds of the special learner population are being acknowledged and accommodated.
1.4 What Is Systemic Evaluation?
Systemic Evaluation is the assessment of the extent to which the education system achieves setsocial, economic and transformational goals. It does this by measuring learner performance as well asthe context in which learners experience learning and teaching. The Assessment Policy requires thatSystemic Evaluation be conducted in three grades of the education system, namely Grades 3, 6 and 9.
1.5 Objectives of Systemic Evaluation
According to the Department of Education (2001a):
the main purpose of Systemic Evaluation is to benchmark performance and track the progressmade towards the achievement of the transformational goals of the education system in respect to
3
access, redress, equity and quality. In so doing, Systemic Evaluation aspires to promote and ensureaccountability and thus gain the confidence of the public in education.
The objectives of Systemic Evaluation are to:
• determine the context in which learning and teaching is taking place;• obtain information on learner achievement;• identify factors that affect learner achievement; and• make conclusions about appropriate education interventions (DoE, 2002).
The learner achievement component of Systemic Evaluation seeks to establish trends with respect toacquisition of key knowledge, skills, values and attitudes by learners at different points in the system.The contextual component is set to provide insight into the environment in which teaching and learningtake place and to establish the performance of the education system with respect to the principles ofaccess, redress, equity and quality.
1.6 Focus of the Report
The primary focus of this report is to:
• serve as a baseline for future Systemic Evaluation studies, and • make appropriate recommendations regarding national education policy implementation.
This report is based on a framework stipulated by the Department of Education (DoE, 2002) in orderto focus on the transformation principles of access, equity, redress and quality as noted in the firstWhite Paper on Education and Training (DoE, 1995). The findings are presented in the followingchapters, according to the given framework:
• background - Chapter 1;• Systemic Evaluation framework - Chapter 2;• conduct of study - Chapter 3;• findings and recommendations as they pertain to transformational goals:
• access - Chapter 4,• equity - Chapter 5, • quality indicators - Chapter 6, and• assessment - Chapter 7;
• conclusion - Chapter 8.
Systemic Evaluation 2003 - Foundation Phase

Systemic Evaluation 2003 - Foundation Phase 4

Chapter 2
5
THE SYSTEMIC EVALUATION FRAMEWORK
2.1 Systemic Evaluation within Quality Assurance
The establishment of a single, non-racial Department of Education post-1994 has paralleled a need forthe development of appropriate and adequate quality assurance systems in education to ensure theachievement of transformation goals. The Department of Education has instituted a number of suchquality assurance systems and measures, among which the system of learner assessment and thepolicy on Whole-School Evaluation are key instruments. While learner assessment evaluatesindividual achievements for progression and certification purposes, and Whole-School Evaluationassesses conditions of teaching and learning in particular schools, Systemic Evaluation evaluates theperformance of the entire education system (DoE, 2001a). One of the key aims of Whole-SchoolEvaluation is to evaluate the effectiveness of a school in terms of the national goals, using nationalcriteria, the end purpose of which is school improvement (DoE, 2000). Systemic Evaluation, on theother hand, monitors whether learners are meeting national standards, especially in reading, listening,writing, numeracy and life skills at the Foundation Phase, and at key transitional stages in the learningladder, namely Intermediate Phase and Senior Phase.
2.2 The Use of Indicators and What They Intend to Measure
Education indicators are statistics designed to provide information about the condition, stability,functioning or performance of an education system or any part or sub-system thereof. Implicit in thisdefinition is the notion that indicators deal with the measurable features of an education system.Education indicators show the nature, functioning, efficiency or outcomes of the quantifiable facets ofan education system at a national, provincial, regional, school or classroom level, and can thus givean indication of the health, quality and potential problems of the education system as measuredagainst set standards.
As early as 1998, the Department of Education started a process of identifying and selectingappropriate indicators which could be used to measure the condition of the South African educationsystem. Through broad consultation with various role-players, a set of 26 indicators of qualityeducation was agreed upon and adopted. These have been classified into:
• context indicators, providing information on the socio-economic context of learners;• input indicators, providing information on the resources and infrastructure of the system;• process indicators, providing information on aspects related to the teaching and learning process;
and • output indicators, providing information on the outcomes of the system, one of which is learner
performance.
The findings of this report, as well as their interpretation, are analysed in terms of the 26 indicators. Itis important to note that these indicators were selected on the basis of their perceived relevance andsignificance at a particular point during the transformation process. It needs to be borne in mind that,as the transformation process advances over time, some indicators may assume greater pre-
Systemic Evaluation 2003 - Foundation Phase

Systemic Evaluation 2003 - Foundation Phase 6
eminence while others may diminish in significance. It will be logical, therefore, to accept thatsubsequent reports may assume a different focus in terms of the indicators used.
2.3 Policy Principles
Systemic Evaluation is guided by the following principles:
• integration with other quality assurance initiatives;• practicality of the design of the programme;• collaboration between the provincial and national departments of education;• capacity-building for Systemic Evaluation and self-evaluation;• gathering and using information to improve education provision and delivery; and• ensuring inclusivity through the active participation of learners with special education needs.
2.4 The Transformation Goals of Education
The research questions for Systemic Evaluation are based on the transformation goals of education -access, equity, redress and quality. Chapter 4 of the White Paper on Education and Training (DoE,1995) defines the principles of access, equity, redress and quality as interrelated.
The White Paper describes the principle of access as one of the objectives that the education andtraining system should work towards. It requires of the system to “increasingly open access toeducation and training of good quality, to all children, youth and adults and to provide means forlearners to move easily from one learning context to another”. According to the White Paper, thesystem must offer learners “an increasing range of learning possibilities, offering greater flexibility inchoosing what, where, when, how and at what pace they learn”.
The education system is also required by the White Paper to redress educational inequities among thesections of the people that have “suffered particular disadvantages or were especially vulnerable,including street children and out of school youth, the disabled and the citizens with special educationalneeds, illiterate women, rural communities, squatter communities and communities damaged byviolence”.
The White Paper defines equity in relation to the distribution of resources, human rights, providingequal opportunities and gender. In particular, the White Paper requires the system to allocateresources according to the principle of equity so that the same quality of learning opportunities isafforded to all. It also provides for respect of the rights of learners and teachers, for fair training andadvancement in the education service, including an affirmative action policy in order to ensure aneffective cadre of leadership which is broadly representative of the population.

Chapter 3
7
CONDUCT OF THE STUDY
3.1 Introduction
Preparations for the study began in 1998 with the Education Quality Indicators Project of theDepartment of Education’s Quality Assurance Directorate. Following this, in 2000, a pilot study wasundertaken to test the appropriateness, relevance and readability of the questions in the contextualquestionnaires, and the appropriateness, validity and reliability of the questions in the assessmentinstruments.
The pilot phase of the Systemic Evaluation Programme comprised three phases:
• The preparatory phase covered contractual and conceptual activities necessary to lay the basis forthe implementation of the study.
• The instrument development phase involved the articulation of the conceptualisation of theprogramme into data capturing instruments and other facilitative material necessary for carrying outthe pilot.
• The international benchmarking phase involved solicitation of input from foreign countries that haveexpertise in this area or have run similar programmes.
The pilot phase, therefore, served to test the instruments developed through the processes outlinedabove and to test the implementation processes with the objective of preparing for the main study. Oneof the most important aspects of the pilot phase of the project was that of testing the accuracy andappropriateness of the translation of instruments. Instruments were developed initially in English, andthen translated into the ten other official languages of the country. Great care was taken to ensure thatno particular language group was either advantaged or disadvantaged in the learner assessment tasksas a result of translation.
3.2 Co-operation between the Department of Education and ServiceProviders
As a quality assurance initiative, Systemic Evaluation for mainstream schools is being implementedunder the leadership of the national Department of Education’s Chief Directorate: Quality Assurance,in partnership with the provincial education departments and a consortium of service providersmanaged by the Centre for Education Policy Development, Evaluation and Management (CEPD).Other consortium partners include the Human Sciences Research Council (HSRC) and the Universityof the Free State’s Research Institute for Educational Planning (RIEP).
3.3 Instrument Development
The processes for instrument development were conducted under the auspices of the Department ofEducation, with consortium members providing technical assistance where required.
Systemic Evaluation 2003 - Foundation Phase

Systemic Evaluation 2003 - Foundation Phase 8
3.3.1 Contextual instruments
The constructs that were used in the contextual instruments were based on the 26 education qualityindicators that were adopted by the Department of Education. These indicators - developed from thecontext, input, process and output models of schooling - were placed against the educationtransformation goals of access, redress, equity and quality in a matrix format as noted in theFramework for Systemic Evaluation (DoE, 2001a). The matrix thus offers a clear perspective on theplace of the different indicators within a dual framework.
3.3.2 Assessment instruments
The assessment instruments were based on frameworks drafted by members of the consortiumtogether with the Department of Education and provincial Foundation Phase specialists for the threeLearning Programmes covered by this study - Literacy (which comprised two instruments, ListeningComprehension and Reading and Writing), Numeracy and Life Skills. These frameworks were givento the project’s stakeholders for their comments and approval prior to use.
Assessment tasks for the instruments were developed by Foundation Phase specialists, with membersof the consortium acting as facilitators. However, the primary responsibility for the Life Skills tasks wastaken by the Department, since members of the consortium did not have the capacity to undertake thistask. All items developed were edited and formated into three sets of instruments for Literacy(Reading, Writing, Listening Comprehension), and one each for Numeracy and Life Skills.
3.3.3 National and international input
Before being finalised, all instruments were circulated among the various stakeholders involved in theproject as well as international specialists for their comments. Valuable comments were received fromProfessor Alison Wolf of the International Centre for Assessment Research at the University of London,and from Dr Greg Brooks (Foundation for Education Research in the United Kingdom). Commentswere also received from Dr Parson (USA), Dr Nadia Temple (Canada), and from the various provincialdepartments of education. All comments were considered and changes were made where appropriate.
3.3.4 Translation of instruments
The translation processes were undertaken by national and provincial officials of the educationdepartments. The translated instruments were piloted in 77 schools across seven provinces. Theinformation obtained from the pilot analysis was used to select items for the final instrument.
3.3.5 Finalisation of instruments for the main study
The process of selecting items for the main study was carried out at a workshop held in Pretoria from19-23 February 2001. Participants in this workshop included Foundation Phase specialists for alleleven official languages from the national and provincial education departments as well asrepresentatives of the consortium (HSRC researchers and a CEPD representative).
Researchers from the HSRC facilitated the Numeracy and Literacy item selection sessions only. ADepartment official facilitated the Life Skills session; an HSRC researcher attended the session to give

9
input on technical matters related to item characteristics and their interpretation. Results from theanalysis of the pilot data on the difficulty and discrimination values as well as the gender and languagebias of the questions were used to select items for the main study. For each Learning Programme, anassessment instrument was developed using the most suitable questions from the two forms appliedin the pilot study.
3.3.6 Sampling
A sample of 5% of all the Grade 3 learners from all districts/regions in the country was included in thesurvey, as reflected in Table 3.1. The schools were categorised according to the administration unit,that is the region in some provinces or districts in other provinces. Five percent (5%) of the totalnumber of Grade 3 learners was calculated in each of the districts/regions. A maximum of 40 learnersper school was included in the sample. The number of schools to cover the sampled learners wasrandomly chosen from an alphabetic list of schools having at least 30 learners each. The total numberof learners from the sampled schools made up at least 5% of the Grade 3 learners.
3.4 Data Collection
Departmental officials from each province were trained at six venues to conduct the survey. The datacollection took place over a period of two days in each school, between 10 September and 9 October2001. The collected data on the assessment tasks was sent to the Department of Education for scoringand coding; the contextual questionnaires were sent to RIEP during November 2001.
3.5 Data Coding and Scoring
Scoring of the assessment tasks was undertaken in November 2001 by district officials representingall official language groups. Technical assistance for the training of scorers and moderators wasprovided by the HSRC. In addition, HSRC researchers as well as moderators appointed by theDepartment for the different language groups moderated approximately 5% of the instruments scored.
Systemic Evaluation 2003 - Foundation Phase

Systemic Evaluation 2003 - Foundation Phase 10
3.6 Data Entry and Cleaning
In order to reduce entry errors, the data entry of the contextual questionnaires was done on a preparedtemplate, which limited the entries to those responses appropriate to each question.
For the assessment tasks, data was captured, verified and cleaned according to a pre-specified formatwith the assistance of consortium members. The cleaning and verification process was conducted toensure that data did not contain any errors.
3.7 Data Analysis and Reporting
The purpose of the analysis was to report on: the conditions of learning and teaching at schools, theperformance of learners and the factors influencing learner performance.
3.7.1 Conditions of learning and teaching
The 26 indicators, as outlined in the Framework for Systemic Evaluation (DoE, 2001a), were used asthe basis for reporting on the conditions of learning and teaching in the sample schools. For eachindicator a national and provincial average score was calculated. Where applicable, a theoretical meanwas also calculated to serve as a basis for comparison. The findings for each indicator are presentedby bar graphs and tables and reported in Chapters 4 to 6, as defined by the transformation goals ofaccess, equity and quality.
3.7.2 Learner performance scores
The analysis conducted on the learner performance scores consisted of two stages:
• scores were converted to percentages; and• means, standard deviations and standard errors were computed.
In most cases, the results are reported by province and presented through graphs, while additionaldetails (such as sample sizes and standard deviations) are provided in the Appendix. In addition, afrequency distribution of learner scores by each of the fours areas assessed - ListeningComprehension, Literacy, Life Skills and Numeracy - is also presented.
3.7.3 Indicators influencing learner performance
Indicators that displayed a significant influence on learner performance were identified by applyingseparate regression analyses on the various access, equity and quality indicators. For this analysis,learner performance was represented by a total score that was obtained by averaging each learner’sLife Skills, Listening Comprehension, Literacy and Numeracy scores.
The analysis was conducted at the learner level and thus information obtained from educators orprincipals applies to each of the learners in his/her class or school. For example, since every educatoris associated with more than one learner, for any analysis that required linking educators and learners,the same response from each educator applied to each of his/her learners.

11
The strengths of the significant indicators are reported using standardised regression coefficients. Foreach of the three chapters (access, equity and quality), only those indicators that displayed asignificant influence on learner scores are reported, from the most influential to the least. In addition,the R-square value that indicates the percentage of variation in learner scores accounted for by theindicators used in the analysis is reported.
3.7.4 Finalisation of this report
This report was finalised over a number of meetings and workshops involving members of theconsortium and staff from the Department of Education’s Quality Assurance Directorate. The finalformat used for the presentation of the findings was specified by the Department of Education (2002).
3.8 Limitations of the Study
This report only presents an overview of general trends within the education system in the FoundationPhase, and thus provides no more than an indication of “areas of concern” or areas “in need of furtherattention”. For specific and detailed information, additional analysis as well as further investigation andresearch will certainly be required.
The results of the data analysis were significantly influenced by the number and definition of indicatorsused, the specific questions, the format applied to measure these indicators, and the classification ofindicators into access, equity and quality indicators. Different definitions and/or classifications of thedata could provide different results.
While inconsistencies and/or shortcomings were detected in the list of indicators as stipulated in theSystemic Evaluation Framework during the analysis of the data, this document was still used as theframework within which the analysis was conducted. For future studies, this framework should berevised and updated.
The analysis is based on self-reported data obtained from learners, educators, parents, schoolprincipals and district officials. This information was not verified by any observations and thus shouldbe considered cautiously. This is especially applicable if one is attempting to identify causal links.
The instruments were not administered in a number of schools in Eastern Cape and KwaZulu-Nataldue to bad weather which made access to the schools impossible. As a result, the percentage oflearners who completed the questionnaire was below 5% (as noted in Table 3.1 above).
Some of the questionnaires, as well as questions within questionnaires, were not completed correctlyand thus could not be used in the analysis.2 For example, in Eastern Cape, KwaZulu-Natal andMpumalanga, a number of principal questionnaires could not be linked to a school, because therespondents did not complete the required information on the cover page.
Since the heads of the districts/regions were selected to complete the district questionnaire (ratherthan Learning Area specialists), their responses were mainly aimed at matters relating to theprincipals. Thus these questionnaires could not provide much information relating to educators.
Systemic Evaluation 2003 - Foundation Phase

Systemic Evaluation 2003 - Foundation Phase 12
Incorrect and missing data on the cover pages of the instruments caused delays in the data capturingand cleaning process as it was difficult and time-consuming to rectify incorrect or missing data on thecover pages. Tracking sheets designed to assist in this process were not (correctly) completed by alladministrators of the instruments. The data cleaning also took much longer than planned because itwas difficult to follow up incorrect identification numbers without names on the cover pages. The dateof birth that was to be used instead of names was in many cases missing or incorrect.

Chapter 4
13
TRANSFORMATION GOAL: ACCESS
4.1 Introduction
The purpose of this chapter is to report on the findings relating to the transformation goal of access inthe education system. Access to education refers to the opportunity for learners to attend school andthe ability to mediate educational offerings in a meaningful way. This is affected by various factors,including availability of resources at home and at school, the educational level of parents, progressionpolicy, and learner-educator ratios.
According to the White Paper on Education and Training (DoE, 1995), access is one of the objectivesthat the education and training system should work towards. It requires of the system to “increasinglyopen access to education and training of good quality, to all children, youth and adults and to providemeans for learners to move from one learning context to another” (DoE, 1995:21). The White Paperstates that the system must offer learners an “increasing range of learning possibilities, offering greaterflexibility in choosing what, where, when, how and at what pace they learn” (DoE, 1995:21).
In this chapter, the findings on the access-related indicators are presented, followed by an overview oflearner performance scores, aggregated by province. Next, the findings relating to the analysis ofaccess indicators influencing learner performance are noted, followed by a discussion and analysis ofthese findings. The chapter concludes with some policy recommendations and a discussion on the wayforward.
4.2 Findings: Access Indicators
In this section, findings on the following access-related indicators, as defined in the SystemicEvaluation Framework (DoE, 2001a), are presented:
• parents’ level of education;• resources at home;• the nutrition of the learners;• early childhood development; • learner:educator ratios;• utilisation of resource centres by learners; • repetition rate;• number of years to complete phase; and• pass rates.At the request of the Department of Education, two additional indicators were developed:
• language of learning and teaching; and• accessibility of school.
Systemic Evaluation 2003 - Foundation Phase

Systemic Evaluation 2003 - Foundation Phase 14
4.2.1 Parents’ level of education
The education level of the learner’s parents is an important factor that may affect performance, sinceeducated parents are more likely to provide support to the learner at home. Parents were asked toindicate their highest education level - lower than Grade 7, Grade 7 to Grade 9, Grade 12, training afterGrade 12. The average level of education of parents was calculated by using this scale. The resultsare displayed in Figure 4.1
Figure 4.1 Level of Parents’ Education, by Province
The national average of 9,6 indicates that the average level of education of parents lies between Grade9 and Grade 10. Gauteng parents have the highest level of education, while Eastern Cape parents hadthe lowest level.
More than a quarter of the responding parents indicated that they had an education level lower thanGrade 7. According to the Household Survey of October 2000 carried out by Statistics South Africa,15% of adults in South Africa could neither read nor write. This has major implications for the natureand type of support that learners can expect from parents regarding their schoolwork.
4.2.2 Availability of resources at home
The national indicator for the availability of resources at home is 30,9%, meaning that approximately31% of households in the survey had items like television, radio, phones, computers, books andmagazines that were indicated in the questionnaires of the learners and parents. The different itemswere not weighted in calculating the average availability.
The availability and reading of newspapers or magazines was low (23%) among learners. Only 30%of the parents and 21% of the learners indicated that they purchased newspapers and magazines. Theavailability of books was also very low, as 53% of the parents indicated that they had less than 10books at home. Many learners had access to radio (67,2%), television (57,1%) and a telephone(45,9%).

15
Figure 4.2 Availability of Resources at Home, by Province
4.2.3 Nutrition of the learners
The indicator for the nutrition of learners has been developed to determine the food available tolearners. They were asked to respond to the following questions:
• Do you usually have a meal before coming to school?• Do you bring anything to eat with you to school?• Do you have a feeding scheme at your school?• Do you have a meal after school?
The average number of meals per learner per day was calculated and is displayed in Figure 4.3. Thenational average of 2,8 meals per learner per day indicated that learners had, on average, almost 3meals per day. Learners in Free State had on average just over two meals per day.
Figure 4.3 Indicator for Nutrition of Learners, by Province
Learners were also asked to indicate the number of meals they had per day. A breakdown of thenumber of meals that each Grade 3 learner had per day is given in Table 4.1. Most learners (76,8%)indicated that they had at least one meal a day.
Systemic Evaluation 2003 - Foundation Phase

Systemic Evaluation 2003 - Foundation Phase 16
4.2.4 Early childhood development
The development of a child in the years before entering school is very important as it may influencethe child’s ability and performance in school. This indicator is based on learner responses regardingattendance of pre-primary classes.
Figure 4.4 Attendance at Grade R or Pre-Primary Classes, by Province
As reflected in Figure 4.4, attending Grade R or a pre-primary class before entering Grade 1 has anindicator score of 57,9%, which means that almost 58% of the learners in the sample had some kindof preparation for school before they entered Grade 1. In the provinces, this figure ranged from 70,2%in Western Cape to 40,8% in Limpopo (formerly Northern Province). Attendance rates at pre-schoolfacilities are relatively low. An improvement of this indicator can prepare the learners for Grade 1 andalso improve the pass rate at this level.
4.2.5 Learner:classroom ratio
The indicator for learner:educator ratios and learner:classroom ratios was calculated by using theaverage number of learners per classroom reported by the principal and the number of learners asreported by educators. At Grade 3 level, the learner:classroom and learner:educator ratios are almostthe same. It could not be determined whether or not educators were teaching more than one grade inthe same classroom (multi-grade classroom).
Figure 4.5 lists the learner:educator ratio by province. The three education departments with the mostlearners - Eastern Cape, KwaZulu-Natal and Limpopo - had ratios greater than 40 while Free Stateand Gauteng had the lowest ratios. The aggregation of these figures does not reflect the actualsituation as far as the extremes are concerned.

17
Figure 4.5 Learner:Classroom Ratio in the Foundation Phase, by Province
According to the publication Education and Manpower 2000 (Strauss et al.,2001), KwaZulu-Natal andLimpopo had the highest primary school learner:educator ratio during 2000. This is reflected in Figure4.5 where these two provinces have the least favourable indicators.
The learner:educator ratio on aggregate might show an ideal situation, but an analysis of the datashows that there were some schools and classrooms where overcrowding was experienced.Educators indicated that 11,3% of them were teaching classes with more than 50 learners, while anadditional 21,9% were teaching classes with 40 to 50 learners. Only 22,4% of educators were teachingless than 30 learners per class.
A high classroom ratio may be caused by a shortage of classrooms. Other possible reasons for thisovercrowding will be considered when discussing the repetition rate. Both educators (57%) andprincipals (68%) indicated that large classes affected learning achievement.
4.2.6 Utilisation of resource centres by learners
The utilisation of libraries and resource centres was determined in terms of the number of visits of eachlearner to libraries during the year. The national indicator for the utilisation of resource centres wasvery low (3,4 visits per learner per year), due mainly to the non-availability of libraries and books.Nationally, only 27,4% of the learner respondents indicated than they had a library. Just over half(54,4%) of the educators indicated that they had books available in their classrooms. Limpopo andEastern Cape showed the lowest index due to the low availability of libraries (6,9% and 11,6%respectively), while 71% of the responding schools in Western Cape indicated that they had libraries.
Figure 4.6 Utilisation of Resource Centres/Libraries, by ProvinceSystemic Evaluation 2003 - Foundation Phase

Systemic Evaluation 2003 - Foundation Phase 18
4.2.7 Repetition rate
The average repetition rate for Grade 3 nationally indicates that 10,9% of the learners did not progressto the next grade. Figure 4.7 indicates that repetition rates were below the average in five provinces,of which the lowest were Gauteng (5,8%) and Western Cape (6,5%). They were above average in fourprovinces, of which the highest were Limpopo (17%) and Mpumalanga (18,5%). A high repetition ratemight result in overcrowding of schools and thus prevent access to these schools for other learners.
Figure 4.7 Repetition Rate at Grade 3 Level, by Province
4.2.8 Average number of years to complete phase
Departmental policy stipulates a learner may not be retained in a phase for more than one additionalyear. This indicator reflects the average time taken by the Grade 3 learners to complete Grades 1 and2 as reported by learners. The results are indicated in Figure 4.8. The national average of 2,3 indicatesthat, on average, learners took slightly more than 2 years to complete Grades 1 and 2. Given thatlearners still had to complete Grade 3, this finding indicates that the average time taken by learners tocomplete the Foundation Phase across all provinces was 3,4 years.
Figure 4.8 Number of Years to Complete Grade 1 and Grade 2, by Province

19
Principals were also asked to indicate, from records of learner performance, progression trends (passrates) in the Foundation Phase. Their information was then used to determine the provincial averagenumber of years taken by learners to complete the Foundation Phase (see Table 4.2).
The repetition rate, the number of years to complete a phase and the pass rates are intertwined. Thehighest average number of years to complete the Foundation Phase is 3,5 years. Extending the timeto complete the Foundation Phase can lead to overcrowded classes and prevent new learners fromgaining access to school. The extra 0,4 years (beyond the normal three years) that the learners tookto complete the Foundation Phase means that 40% of learners - that is, on average 13,3% of thelearners per year per grade - repeated a grade in this phase. This prolonged period means an extra13,3% of learners in each grade if the time to complete the Foundation Phase is 3,4 years. Apart frompreventing access by new learners to school, this is also a waste of financial resources.
4.2.9 Pass rates
Table 4.3 reflects the pass rates in the Foundation Phase, as given by the principals. It shows that thenational average pass rate is 83%; in other words, approximately 17% of all learners in the FoundationPhase in South Africa did not proceed to the next grade.
The average pass rate for the Foundation Phase was 83,3%. The pass rates in the Foundation Phasefor the provinces varied from 78 to 91%, as indicated in Figure 4.9. Comparing the results shown inTable 4.3 and Figure 4.9, there is a good correlation between the provincial Foundation Phase passrates and the Grade 3 pass rates.
Systemic Evaluation 2003 - Foundation Phase

Systemic Evaluation 2003 - Foundation Phase 20
Figure 4.9 Pass Rates in the Foundation Phase, by Province
Because a number of learners are repeating grades, there will be a decrease in the number of learnersin the next grade. Table 4.4 indicates the flow of learners from Grade 1 in 1999 to Grade 3 in 2001.The national flow through rate - that is, the number of learners in Grade 3 expressed as a percentageof the learners in Grade 1- is 81,8%. This means that 18% of learners who were enrolled in Grade 1did not reach Grade 3 after three years. This phenomenon needs more research, because itcontradicts the national policy of free and compulsory education until Grade 9. The National repeaterrate to calculate the survival rate is not known. Only two provinces, Limpopo and North West, had aflow through rate above 100%. This might be because of the high repetition rate in Limpopo or becauseof inflow from other provinces, and needs more research.
4.2.10 Language of learning and teaching at school
Two additional indicators to those listed in the Systemic Evaluation Framework were also created atthe request of the Department of Education. First, an indicator for the language of learning and teach-ing was constructed. The purpose of this indicator was to determine whether the home language of thelearner was the same as the language of learning and teaching used at the school attended by thelearner. In Figure 4.10 scores are reported as percentages and thus range from 0 to 100.

21
Figure 4.10 Language of Learning and Teaching
Country-wide, approximately 76% of the learners indicated that their language of learning and teachingwas the same at their home language. This implies, however, that nearly one-quarter of learnesreceived instruction in their second or third language. This situation was particularly “bad” inMpumalanga (54%) and Gauteng (33%).
4.2.11 Access to schools
Access to schools is presented in two ways. Principals indicated the average distance the majority oflearners and educators lived from the school (see Table 4.5), and learners indicated how long it tookthem to reach school from their homes (see Table 4.6).
In all the provinces, principals indicated that the majority of learners stayed within three kilometers ofthe school. According to Table 4.6 most of the learners were staying a reasonable distance from theschool. Learners indicated that, on average, the schools could be reached within half an hour.However, approximately 20% of the learners indicated that it took up to an hour to reach school.
Systemic Evaluation 2003 - Foundation Phase

Systemic Evaluation 2003 - Foundation Phase 22
Approximately 52% of the learners in Western Cape and Gauteng, the most urbanised provinces,indicated that they walked to school. The other most popular forms of transport to school were bus,train and car. In the rest of the provinces, more than 80% of the learners indicated that they walked toschool.
4.3 Findings: Learner Performance
An overview of the findings indicates the following national average scores obtained by learners:
• Life Skills - 54%;• Literacy - 54%:
• Listening Comprehension - 68%,• Reading and Writing - 39%; and
• Numeracy - 30%.
As indicated in Figure 4.11, the average performance of learners was consistent across all theprovinces in all the Learning Programmes assessed. In addition, the difference in mean scores acrossthe provinces in these Learning Programmes was small. This indicates that the scores obtained bylearners within the different provinces were similar.
Figure 4.11 Learner Scores, by Learning Programme and Province
4.4 Access Indicators Influencing Learner Performance
In this section, the influence of access indicators on learner performance is examined using regressionanalysis. The coefficients calculated denote the relative strength of each indicator’s influence on thetotal score of each learner. The coefficients and R-square value of the significant indicators arereported in Table 4.7. A general overview of the results indicates the following:
• Only nine access indicators (as noted by the values reported) had a significant influence on learnerscores.
• These indicators can only explain 20% of the variation in learner scores - that is, as noted by theR-square value. Thus, at least 80% of the “explanation” for why (and how) learner scores areachieved lies in other factors that are not addressed by these indicators.
• The resources at home had the strongest positive influence on learner scores followed by ease ofaccess to school, number of years taken to complete a phase, utilisation of resource centre atschool, early childhood development, pass rates and education level of parents.

23
In the next section, a detailed discussion on the significant indicators is provided. It must be noted thatthe the nature of the influence of these indicators on learner performance and possible reasons for howthey manifest themselves in practice is difficult to determine without additional information or research,especially since this can differ between the various provinces, districts, schools and classrooms.
4.5 Discussion and Interpretation of Findings
In this section, the findings on indicators that relate to access are discussed. These findings areinterpreted with a view to establishing baseline information regarding the transformation goal ofaccess.
4.5.1 Availability of resources at home
It is indicated that resources at home had a significant influence on learners’ scores. The Departmentof Education cannot be judged too harshly, since so much of achievement seems to be explained byfactors in the home. The actual education of children has to be seen as part of the whole process ofdevelopment and cannot be expected to be solved by the education system alone. On the other hand,however, it does suggest that important positive measures have to be taken to overcome thediasadvantages faced by some, e.g. via compensatory interventions or funding of various types.
4.5.2 Availability and utilisation of resource centres at school
Project 7 (School Infrastructure) of Programme 2 (School Effectiveness and Educator Professionalism)of the Implementation Plan for Tirisano (DoE, 1999) commits itself to ensuring that all schools meetthe minimum physical and infrastructural requirements necessary to establish and support a conducivelearning and teaching environment. Although the average national indicator for facilities was 5,35, thissurvey revealed that seven provinces fell below the theoretical mean. The fact that only 27% of thesurveyed schools had libraries or resource centres suggests that learners have limited access toinformation to enrich their learning experiences. The situation is exacerbated by the finding thatlearners who attend schools that lack resources invariably also come from homes that are similarlydisadvantaged.
Systemic Evaluation 2003 - Foundation Phase

Systemic Evaluation 2003 - Foundation Phase 24
Besides limited availability, it was observed that when resources were available they were under-utilised (28,2% utilisation). Curriculum 2005 (C2005) encourages learners to use resources outside ofthe classroom and to take responsibility for their own learning. The C2005 form of pedagogy cannotbe promoted effectively without access to and efficacious utilisation of adequate facilities andresources.
For educators, the non-availability of staff rooms (only 51% of schools had staff rooms) makes itdifficult to prepare lessons and hold planning and review meetings. In addition, the inadequacy ofcommunication facilities such as telephones and faxes isolates schools from possible sources ofassistance, and causes undue delays in sending to and receiving information from district andprovincial offices. This further limits educators’ resourcefulness to the detriment of the learners.
The finding that the facilities available at a school had a significant influence on the assessment scoresof learners further highlights the importance of addressing the shortage of resources in order to makelearning accessible and to improve its quality. A similar finding was noted for learning and teachingmaterials (see Chapter 6). In essence, it is important that the plan for dealing with infrastructuralbacklogs in schools (as stated in the strategic objective of Project 7 of Tirisano), is developed andimplemented as soon as possible.
Learners who have greater access to resources in the home, as well as those who have access toresources at school, tend to perform better than learners who do not. Given that South Africa has oneof the highest Gino-coefficient values in the world, it is not surprising to note that a significant majorityof learners fall into the category that have limited resources in the home.
The national indicator for the utilisation of resource centres was very low (28,2%), due mainly to thenon-availability of libraries and books. Nationally, only 27,4% of the learner respondents indicated thanthey had a library. Just over half of educators (54,4%) indicated that they had books available in theirclassrooms. Limpopo and Eastern Cape showed the lowest indicator, due to the low availability oflibraries (6,9 and 11,6% respectively), while 71% of the responding schools in Western Cape indicatedthat they had libraries
4.5.3 Parents’ level of education
The high correlation between parental levels of education and the assessment scores of the learnerssuggests the need to improve the education levels of parents in instances where such levels arepresently low. The current education policies of the national Department of Education are veryfavourable towards this end. For example, Programme 3 of the Implementation Plan for Tirisanosuggests a commitment by the Department to reduce the levels of illiteracy in the country by increasingprovision for Adult Basic Education and Training (ABET). The philosophy of the Department thatschools should be the centres of their communities is also supportive of this commitment. However, itis evident that the challenges of illiteracy and ABET remain great. These are, in essence, challengesof policy implementation, and it is crucial that this matter be brought to the forefront of the agenda ofall the provincial departments of education. Schools, too, should be encouraged to take their owninitiatives to facilitate the provision of ABET and literacy classes on their premises.

25
According to the Household Survey of October 2000 carried out by Statistics South Africa, 15% ofadults in South Africa could neither read nor write. This has major implications for the nature and typeof support that learners can expect from parents regarding their schoolwork.
4.5.4 Repetition rate and average number of years to complete phase
The findings of this study demonstrate that grade repetition is associated with lower learner scores,but that repetition is not really the cause of low scores. Low scores and repetition of learners areinfluenced by other factors. The current Departmental policy on learner progression discourages a highrepetition rate, by allowing learners to repeat a grade only once in each phase. This is in line with thefindings of this study. Despite this, the repetition rate still appears to be too high. It is proposed, there-fore, that the Department maintain its current policy on learner progression and ensures that its imple-mentation is monitored closely. Cognisance needs to be taken of the “popular” viewpoint of both par-ents and educators, who believe that a learner who has “failed” in a grade should not be allowed toproceed to the next grade as it reduces standards. It is important that this issue be researched andinvestigated further to ensure that the current policy is indeed correct. In the meanwhile, learner-pacededucation in schools should be encouraged. This could be done through strategies such as the intro-duction of remedial teaching and remedial classes.
4.5.5 Early childhood development
The existing policy of the Department of Education to make Grade R accessible to all learners isindicative of the Departments’ recognition of the value of Grade R in the life of the learner. Given thehigh correlation demonstrated in this study between access to pre-schooling and learner performance,it is imperative that departments of education keep to the promise of Grade R provisioning bymonitoring its implementation closely.
The proposal by the Department of Education to amend its existing policy on the admission age oflearners is also of importance. In terms of current policy, learners are admitted to Grade 1 in the yearthat they turn seven. The new policy proposes that a learner may be admitted to Grade 1 if she or heturns six by 30 June in the year of admission. The proposed policy appears to favour those learnerswho do not have access to pre-school, as it means that they will have access to some form ofeducation in the most formative years of their lives. Close monitoring by the Department of thisproposed shift in policy is crucial, as it is likely to have an impact on learner enrollment and repetitionrate if implemented.
4.5.6 Pass rates
The pass rate is an outcome of the education system. As such, it is influenced by a number of inputsand processes. One aspect that influences the pass rate is the educator in the classroom who is inconstant contact with the learner. It is the responsibility of the educator to ensure that good teachingpractices prevail, but it is the responsibility of the Department of Education to ensure that educatorsreceive adequate training and support.
Another aspect that influences the pass rate is the school management team who must managelearning activities. Here, the responsibility rests with the principal and the rest of the school
Systemic Evaluation 2003 - Foundation Phase

Systemic Evaluation 2003 - Foundation Phase 26
management team. If they manage learning activities well, the pass rate should improve. Other factorsdiscussed in the previous as well as the next chapter also influence the pass rate.
4.6 Policy Suggestions
• Government must build on its policy framework for school libraries, and develop a schoollibrary/resource centre policy to ensure that all schools have equal access to resources.
• Government must implement the plan for dealing with infrastructural backlogs in schools (as statedin the strategic objective of Project 7 of Tirisano) as soon as possible.
• Provincial departments of education must be encouraged to promote ABET classes, especially forthe illiterate members of their communities.
• Government should maintain its current policy on learner progression, but ensure that itsimplementation is closely monitored. Learners should not repeat a grade more than once perphase.
4.7 Conclusion
This chapter gave an analysis of the findings pertaining to the transformation goal of access at theFoundation Phase. It looked at the findings on the access-related indicators, as defined in theSystemic Evaluation Framework (DoE, 2001a). It also presented an overview of learner performancescores, aggregated by province.
The major findings were that the number of years taken to complete a phase had the strongest positiveinfluence on learner scores - that is, the fewer the years taken, the higher the scores - followed byresources at home, school facilities, access to school, early childhood development and educationlevel of parents.
Several aspects have been highlighted which can be applied to improve the education system. Thepresent curriculum policy, Curriculum 2005, leans strongly towards a learner-centred and learner-paced pedagogical approach. It attempts to make learning relevant to the everyday lives of learnersand hence encourages the use of resources from the home in the teaching and learning process.While this is not a problem in principle, the shortage of resources in learners’ homes makes it difficultto fulfil this requirement. The shortage of resources in the home is compounded by the shortage ofresources at school, especially the lack of resource centres from which learners can access materials.
Aspects discussed in this chapter that might improve learner performance and access to qualityeducation are the following:
• the provision of facilities at schools;• the improvement of existing school facilities; and• in-service training of educators and principals, especially in OBE.
The following chapter focuses on the findings relating to the transformation goal of equity at the Grade3 level.

Chapter 5
27
TRANSFORMATION GOAL: EQUITY
5.1 Introduction
This chapter reports on the findings relating to the transformation goal of equity. Chapter 4, Section 8of the White Paper on Education and Training (DoE, 1995) notes that “the state’s resources must bedeployed according to the principle of equity, so that they are used to provide essentially the samequality of learning opportunities for all citizens”. The White Paper does not limit the notion of equity tothe provision of equal opportunities only, but suggests the need for an “affirmative action policy” thatwould address this country’s legacy of inequality. Hence it emphasises the need for an effectiveleadership which is broadly representative of the population it serves. The transformation goal of equi-ty, therefore, requires the system to ensure an equitable distribution of resources, as well as the activeadvancement of previously disadvantaged groups such as women.
In this chapter, the findings on the equity-related indicators as defined in the Systemic EvaluationFramework (DoE, 2001a) are presented, followed by an overview of learner performance scoresaggregated by province. The influence of the significant equity indicators on learner performance arethen noted, followed by analysis and discussion of the findings. The chapter concludes with somepolicy recommendations and a discussion on the way forward.
5.2 Findings: Equity Indicators
The findings on the following equity indicators are reported in this section:
• private contributions and utilisation of funds;• assistance from the Department;• educator qualifications;• functioning of SGBs; and• discipline, safety and learning atmosphere.
5.2.1 Private contributions and utilisation of funds
The financial situation of a school - that is, payment of school fees and the utilisation andadministration thereof - is crucial for the existence of a school and its positive financial situation. Thisindicator is constructed using:
• the proportion of parents paying school fees;• whether the fees are used to the benefit of the learners; and • whether the fees are administered properly.
Ninety percent (90%) of the schools indicated that school fees constituted their main income, and 50%of the schools reported that they received government grants for funding their school activities.
Systemic Evaluation 2003 - Foundation Phase
Systemic Evaluation 2003 - Foundation Phase 28
Although 87,9% of parents indicated that they were paying school fees, principals responded that, onaverage, they only received school fees from 59,3% of the parents. Parents agreed that the schoolfees were used to the benefit of the children. In more than 90% of cases, the school or SGB:
• maintained a bank account;• had annual income and expenditure statements;• had audited or examined financial statements; and• presented an annual budget to the parents.
Table 5.1 indicates that the average indicator for private contributions and utilisation thereof did notdiffer very much across the provinces. Although the utilisation of the parents’ contributions was at ahigh level, the rate at which parents were paying school fees influenced the indicator.
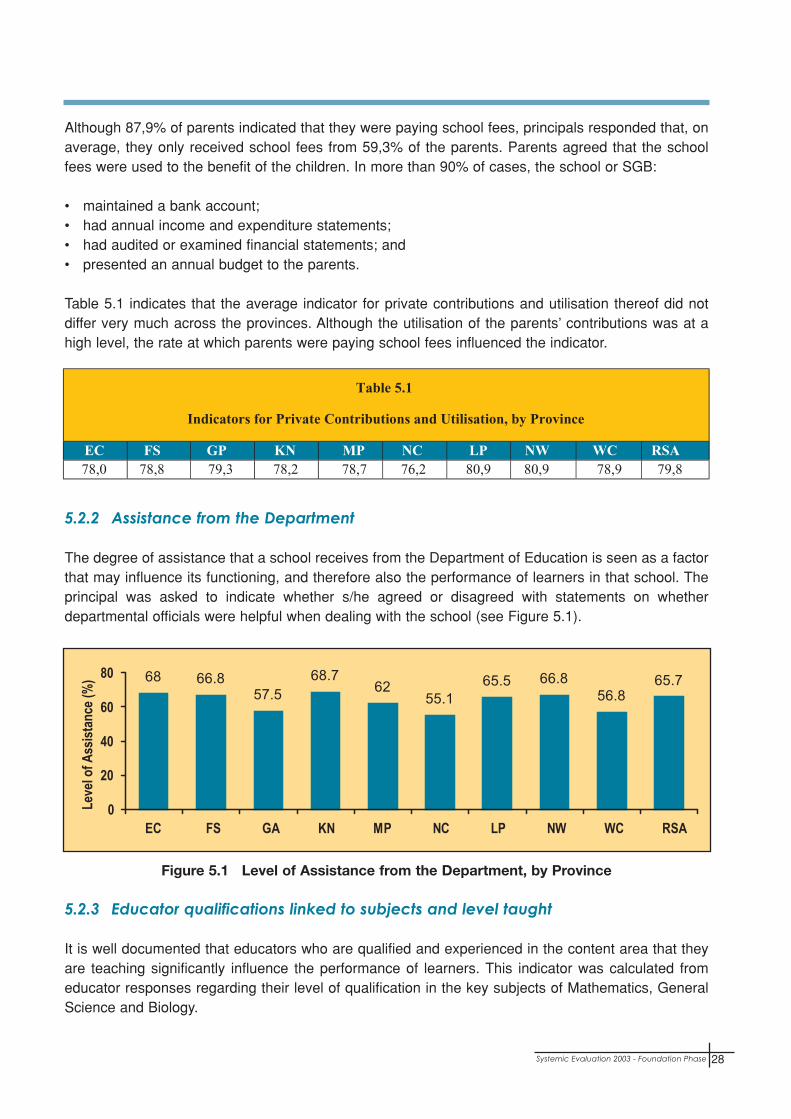
5.2.2 Assistance from the Department
The degree of assistance that a school receives from the Department of Education is seen as a factorthat may influence its functioning, and therefore also the performance of learners in that school. Theprincipal was asked to indicate whether s/he agreed or disagreed with statements on whetherdepartmental officials were helpful when dealing with the school (see Figure 5.1).
Figure 5.1 Level of Assistance from the Department, by Province
5.2.3 Educator qualifications linked to subjects and level taught
It is well documented that educators who are qualified and experienced in the content area that theyare teaching significantly influence the performance of learners. This indicator was calculated fromeducator responses regarding their level of qualification in the key subjects of Mathematics, GeneralScience and Biology.
68 66.857.5
68.762
55.165.5 66.8
56.865.7
0
20
40
60
80
EC FS GA KN MP NC LP NW WC RSA
Leve
l of A
ssis
tanc
e (%
)

29
Just over 50% of the educators indicated that they had been teaching Grade 3 for five years, while aquarter of them had been teaching between six and 10 years. A quarter of the educators indicated thatthey had a Teachers Certificate (two years of training), while 60% had a Teachers Diploma.
Figure 5.2 Educator Qualifications in Mathematics, Science and Biology,by Province
Figure 5.2 shows the qualifications of educators in terms of grades. The national qualification ofeducators in Mathematics is 10,5 - that is, on average, educators had a qualification higher than Grade10 but lower than Grade 11. The Figure also shows that Gauteng, KwaZulu-Natal and Limpopo hadvalues greater than the national average in Mathematics. Approximately 25% of the educators involvedin the survey had a qualification in Mathematics at or lower than Grade 9, as did 35% in Science.Biology seemed to be the subject in which the highest qualifications had been obtained, while only40% of the educators indicated that they had either Grade 11 or 12 Mathematics.
Principals indicated that 89% of the Grade 3 educators were qualified. Table 5.2 shows the qualifica-tions of primary school educators.
5.2.4 Functioning of the SGB
The indicator for the functioning of the school governing body is determined by the responses of theprincipals and educators on the effective functioning of the SGB in terms of constituting, regular meet-ings and contribution to effective functioning of the school.
Systemic Evaluation 2003 - Foundation Phase

Systemic Evaluation 2003 - Foundation Phase 30
Figure 5.3 Level of Functioning of SGB, by Province
The functioning of SGBs seems to be at a reasonable level, as the national indicator is 79,3%. Thefunctioning of the SGBs at schools in the different provinces shows little variation. Provincial indicatorsrange from 73,1% in Free State to a high of 83,4% in Gauteng. Overall, educators considered that theSGB contributed to the effective functioning of the school, as they rated it at a level of 79,8%.
SGB’s were involved in the following activities:
• maintaining a bank account;• preparing an annual income and expenditure statement;• ensuring financial statements are audited and examining financial statements; and• presenting an annual report to the parents.
When schools obtain Section 21 status, the SGBs receive additional responsibilities. If they are to fulfilthese responsibilities, it is essential that members of the SGB receive in-service training.
5.2.5 Discipline, safety and learning atmosphere
This indicator consists of two major parts - discipline, and safety and security at schools. It is necessaryto create a disciplined and safe learning environment at school to give the learners the opportunity toaccess learning and to provide a safe environment for educators to perform their tasks (DoE, 2000).Only 64,6% of the principals and 77,7% of the educators indicated that they felt safe at school. Factorsthat play a role in determining a good learning atmosphere include the availability of safety fences andgood discipline.

31
Figure 5.4: Level of Discipline and Safety, by Province
The national indicator for discipline, safety and learning atmosphere is calculated at 60,6%. Athoughdiscipline at schools (one aspect of the indicator) was rated at a level of 86,7%, safety and security atschools was at a very low level due to the poor condition or lack of fences and the non-availability ofschool patrols, fire extinguishers and first aid expertise and equipment. (See Figure 5.4.)
According to principals, the most important factors that negatively influenced discipline were thefollowing:
• arriving late at school;• absenteeism of learners; and • absenteeism of educators.
The rating of discipline, safety and learning atmosphere was at a level of 60,6%. In all the provinces,maintaining good discipline (one aspect of the indicator) was rated above 80%, but the lack of safetyand security matters lowered the final indicator. Safety and security aspects that had a negativeinfluence on the indicator included the availability and condition of the following:
• school patrol (13,9%);• security guard/service (18,5%);• alarm system (23,9%);• fire extinguisher (27,6%);• first aid box (37,2%); and• boundary wall/fence (54,4%).
The scale for the above-mentioned factors ranges from not available (0%), poor (33,3%), fair (66,7%)to good (100%) implying, inter alia, that boundary walls and fences that were available were mostly ofa poor to fair condition.
Systemic Evaluation 2003 - Foundation Phase

Systemic Evaluation 2003 - Foundation Phase 32
5.3 Findings: Learner Performance
An overview of the findings indicates the following national average scores obtained by learners:
• Life Skills - 54%;• Literacy - 54%:
• Listening Comprehension - 68%,• Reading and Writing - 39%;
• Numeracy - 30%.
As indicated in Figure 5.5, the average performance of learners was consistent across all theprovinces in all the Learning Programmes assessed. In addition, the difference in mean scores acrossthe provinces in these Learning Programmes was small. This indicates that the scores obtained bylearners within the different provinces were similar.
Figure 5.5 Learner Scores, by Learning Programme and Province
5.4 Equity indicators influencing learner performance
In this section, the influence of the equity indicators on the performance of the learners is examinedusing regression analysis. The coefficients calculated denote the relative strength of each indicator’sinfluence on the total score of each learner. The coefficients and R-square values of the significantindicators are reported in Table 5.3.
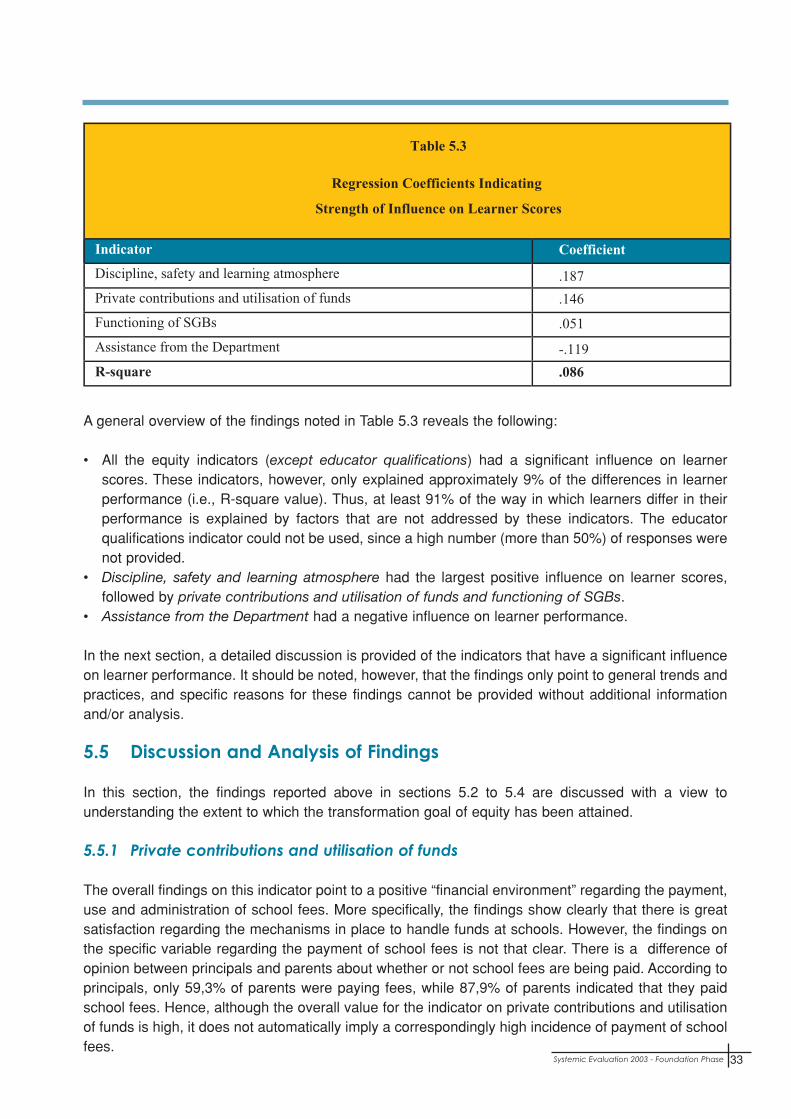
33
A general overview of the findings noted in Table 5.3 reveals the following:
• All the equity indicators (except educator qualifications) had a significant influence on learnerscores. These indicators, however, only explained approximately 9% of the differences in learnerperformance (i.e., R-square value). Thus, at least 91% of the way in which learners differ in theirperformance is explained by factors that are not addressed by these indicators. The educatorqualifications indicator could not be used, since a high number (more than 50%) of responses werenot provided.
• Discipline, safety and learning atmosphere had the largest positive influence on learner scores,followed by private contributions and utilisation of funds and functioning of SGBs.
• Assistance from the Department had a negative influence on learner performance.
In the next section, a detailed discussion is provided of the indicators that have a significant influenceon learner performance. It should be noted, however, that the findings only point to general trends andpractices, and specific reasons for these findings cannot be provided without additional informationand/or analysis.
5.5 Discussion and Analysis of Findings
In this section, the findings reported above in sections 5.2 to 5.4 are discussed with a view tounderstanding the extent to which the transformation goal of equity has been attained.
5.5.1 Private contributions and utilisation of funds
The overall findings on this indicator point to a positive “financial environment” regarding the payment,use and administration of school fees. More specifically, the findings show clearly that there is greatsatisfaction regarding the mechanisms in place to handle funds at schools. However, the findings onthe specific variable regarding the payment of school fees is not that clear. There is a difference ofopinion between principals and parents about whether or not school fees are being paid. According toprincipals, only 59,3% of parents were paying fees, while 87,9% of parents indicated that they paidschool fees. Hence, although the overall value for the indicator on private contributions and utilisationof funds is high, it does not automatically imply a correspondingly high incidence of payment of schoolfees.
Systemic Evaluation 2003 - Foundation Phase
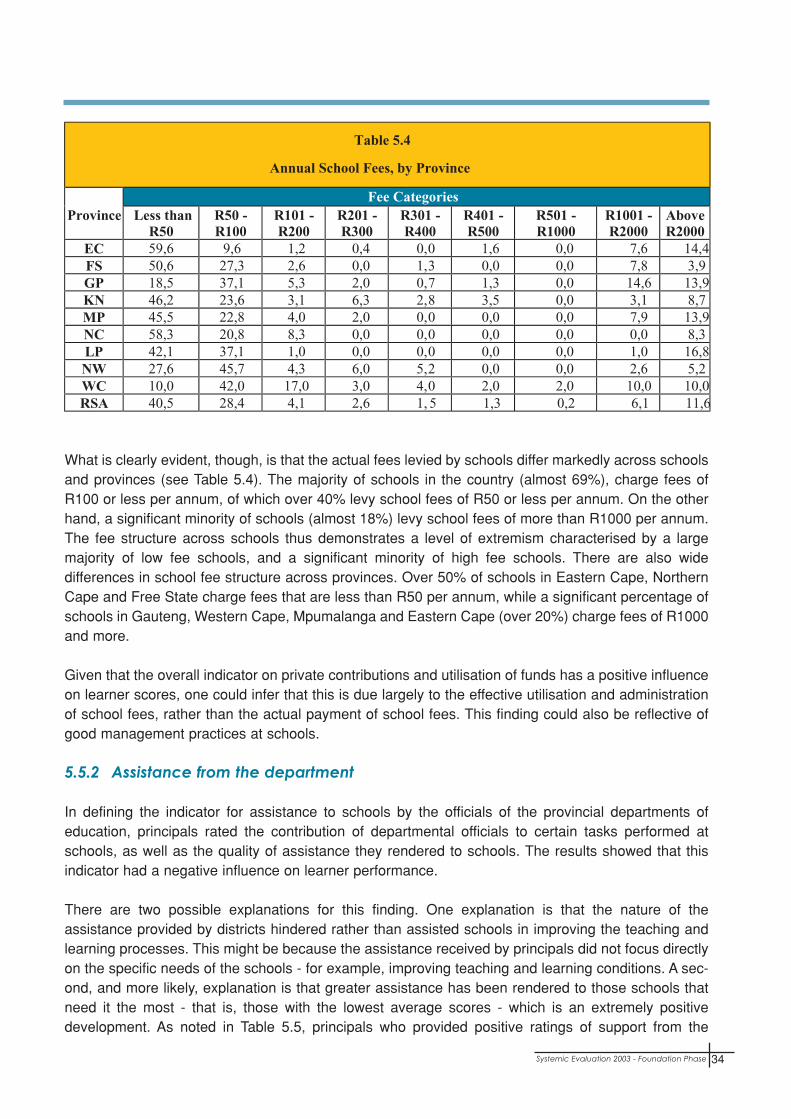
Systemic Evaluation 2003 - Foundation Phase 34
What is clearly evident, though, is that the actual fees levied by schools differ markedly across schoolsand provinces (see Table 5.4). The majority of schools in the country (almost 69%), charge fees ofR100 or less per annum, of which over 40% levy school fees of R50 or less per annum. On the otherhand, a significant minority of schools (almost 18%) levy school fees of more than R1000 per annum.The fee structure across schools thus demonstrates a level of extremism characterised by a largemajority of low fee schools, and a significant minority of high fee schools. There are also widedifferences in school fee structure across provinces. Over 50% of schools in Eastern Cape, NorthernCape and Free State charge fees that are less than R50 per annum, while a significant percentage ofschools in Gauteng, Western Cape, Mpumalanga and Eastern Cape (over 20%) charge fees of R1000and more.
Given that the overall indicator on private contributions and utilisation of funds has a positive influenceon learner scores, one could infer that this is due largely to the effective utilisation and administrationof school fees, rather than the actual payment of school fees. This finding could also be reflective ofgood management practices at schools.
5.5.2 Assistance from the department
In defining the indicator for assistance to schools by the officials of the provincial departments ofeducation, principals rated the contribution of departmental officials to certain tasks performed atschools, as well as the quality of assistance they rendered to schools. The results showed that thisindicator had a negative influence on learner performance.
There are two possible explanations for this finding. One explanation is that the nature of theassistance provided by districts hindered rather than assisted schools in improving the teaching andlearning processes. This might be because the assistance received by principals did not focus directlyon the specific needs of the schools - for example, improving teaching and learning conditions. A sec-ond, and more likely, explanation is that greater assistance has been rendered to those schools thatneed it the most - that is, those with the lowest average scores - which is an extremely positivedevelopment. As noted in Table 5.5, principals who provided positive ratings of support from the

35
Department were from schools where learners obtained the lowest mean scores - that is, in the bottomquartile.
5.5.3 Educator qualifications linked to subjects and level taught
While the exact influence of educator qualification levels on learner performance could not beascertained due to the large number of missing responses, from the results that were received, it isclear that a large number of Mathematics and Science educators are un-qualified or under-qualified(see Table 5.2, above). To counteract this inequity, the Department of Education must provideeducators with opportunities to improve their qualifications. For example, the Department could makebursaries available for further study, focusing on the key areas of Mathematics and Science.
5.5.4 Discipline, safety and learning atmosphere
The national indicator for discipline, safety and learning atmosphere depicts a generally safe anddisciplined learning environment. However, principals did note that the most important factors thatinfluenced discipline negatively were the following:
• arriving late at school;• absenteeism of learners; and• absenteeism of educators.
Table 5.6 shows the attendance rate of learners as reported by the principals and educators, as wellas the attendance rate of educators as reported by principals. It is clear that an unacceptably high rate(about 15%) of the learners are absent from school on any given school day.
In addition, the safety and security aspects that were reported to have had a negative influence on thelearning environment at schools included the availability and condition of the following: school patrol,security guard/service, alarm system, fire extinguisher, first aid box and boundary wall/fence.
Systemic Evaluation 2003 - Foundation Phase

Systemic Evaluation 2003 - Foundation Phase 36
5.6 Policy suggestions
5.6.1 Private contributions and the utilisation of school funds
It is proposed that the formula for the allocation of funds to schools in terms of the National Norms andStandards for School Funding, be revisited. The formula needs to take into account the funds receivedby schools through private contributions by incorporating this as a factor in the determination of thesocio-economic status of the school community.
5.6.2 Assistance from the department
It is proposed that there be an investigation into the nature of support provided by districts to schools.Such an investigation needs to clarify whether the nature of the support provided by districts is directedeffectively towards improved teaching and learning in schools, and whether district support isstrategically focused on “poor-performing schools”.
5.6.3 Educator qualifications linked to subjects
Teacher qualifications in Mathematics and Physical Science need to be upgraded. The tremendousimprovement in the qualifications of teachers over the past few years is acknowledged; however, thereneeds to be a shift in the way in which the notion of teacher qualifications is conceptualised. Thereshould be a shift in emphasis from the upgrading of the whole qualifications of educators (although thisremains important to some extent), to the upgrading of educators in specific subject disciplines. Thisis particularly important for Foundation Phase educators, where historically there has been lessemphasis on promoting knowledge in specific subject disciplines. Appropriate certificationmechanisms and incentives need to be developed to encourage teachers to upgrade themselves inspecific subject disciplines.

37
5.6.4 Discipline, safety and learning atmosphere
Strategies to reduce the rate of learner abseteeism need to be developed at all levels of the system -school, district, province and national. The development of such strategies should, however, be contextspecific and based on an understanding of the reasons behind high levels of learner absenteeism.
The safety of educators and learners should be promoted by ensuring that schools are in a position toorganise and provide services and facilities such as school patrols, security guards, alarm systems,fire extinguishers, first-aid supplies, and fences.
5.7 Conclusion
This chapter has presented an analysis of the findings related to the transformation goal of equity atthe Grade 3 level. The chapter looked at the findings on the equity-related indicators, as defined in theSystemic Evaluation Framework (DoE, 2001a). It also presented an overview of learner performancescores, aggregated by province.
The results indicate that equity across schools has not been reached on issues such as educatorqualifications, private contributions (school fees), learner absenteeism and school safety. Theattainment of the transformation goal of equity in the schooling system is thus dependent uponappropriate interventions in the areas of school financing, the upgrading of educator qualifications inspecific subjects, learner attendance, and the provision of a safe teaching and learning environmentfor educators and learners.
Systemic Evaluation 2003 - Foundation Phase

Systemic Evaluation 2003 - Foundation Phase 38

Chapter 6
39
TRANSFORMATION GOAL: QUALITY
6.1 Introduction
The purpose of this chapter is to report on the findings regarding the transformation goal of quality.Provision of basic education for all includes not only securing formal attendance at school but alsoensuring that sufficient and quality material and human resources are made available to schools (DoE,2000). In assessing the quality of the education system, it is important to look at, among others, schoolmanagement and leadership, the assessment of learners, feedback procedures and homework. Inaddition, the satisfaction rates of the stakeholders - principals, educators, learners and parents - alsogive an indication of the quality of education the learners are receiving.
In this chapter, the findings on the quality-related indicators are presented, followed by an overview oflearner performance scores, aggregated by province. The influence of the significant quality indicatorson learner performance are then noted, followed by analysis and discussion of the findings. Thechapter concludes with some policy recommendations and a discussion on the way forward.
6.2 Findings: Quality Indicators
In this section the findings on the following quality-related indicators, as defined in the SystemicEvaluation Framework (DoE, 2001a) are reported:
• school facilities;• satisfaction rates of stakeholders;• attendance rates, contact time, time on task;• learning and teaching materials;• teaching practices;• INSET and SGB training;• record keeping;• educator morale and attitude;• school management and leadership;• assessment of learners and feedback procedures; and• homework.
6.2.1 School facilities
The factors that were taken into account when calculating the indicator on facilities at school includedthe availability of:
• additional teaching space;• school grounds and sport facilities;• services to the school; and • equipment used in the school.
Systemic Evaluation 2003 - Foundation Phase

Systemic Evaluation 2003 - Foundation Phase 40
Figure 6. 1 Availability of Facilities at Schools, by Province
The consolidated national indicator for facilities was calculated at 52,6%. This means that, on average,schools had just over half the ideal level of facilities available. As noted in Figure 6.1, four provincesfall below the national average.
When the findings of the survey are aggregated, the availability of the following aspects determine theindicator to a large extent:
• libraries (27%);• fax facilities (33%);• sport fields (38%);• availability of staff rooms (51%);• availability of playgrounds (53%);• general condition of schools (56%);• telephone service (56%); and• offices for principals (66%).
6.2.2 Satisfaction rates of stakeholders
The satisfaction rate of stakeholders was compiled from more than 70 statements put to principals,educators, learners and parents. The responses of the different stakeholders ranged from 75,4% to78,8%. The range varies from “strongly disagree” (0%), “disagree” (33%), “agree” (67%) to “stronglyagree” (100%). As shown in Table 6.1, all provinces’ ratings are above 70%. All responses above66,7% can be regarded as “strongly agree”.

41
Statements that were rated below 66,7% by the principals were:
• Parents are involved in school activities.• I feel safe in the school.• Learners complete the homework.• Parents attend meetings at the school regularly.
Educators rated the following statements below 66,7%:
• Parents are involved in school activities.• Learners complete their homework.• Parents attend meetings at the school regularly.• Our learners do well in school.
Both principals and educators rated parental involvement as one of the main factors influencing learnerachievement at school. Principals rated this aspect at 76% (a great deal) and educators at the level of60% (quite a lot).
Learners rated only one statement below 66,7%, namely, “my school give prizes or awards to learnerswho do well in their studies”. Parents also had only one rating below 66,7%, namely, “the childparticipates in sport or other cultural activities”.
Seventeen percent (17%) of the principals and 25% of the educators suggested that they wouldchange to another career if they had the opportunity. The satisfaction rates indicate that theconsequences of this situation might be the following:
• low pass rates;• learners not doing the homework;• learners not doing well in school;• good quality education not provided to learners.
6.2.3 Attendance rates, contact time, time on task
This indicator displayed a high positive influence on learner scores. Learners at those schools thatindicated higher attendance rates for educators and learners as well as greater contact time obtainedhigher scores.
From Table 6.2, it is clear that almost 15% of the learners were not attending classes regularly.
Systemic Evaluation 2003 - Foundation Phase

Systemic Evaluation 2003 - Foundation Phase 42
In the time on task category - that is, what is happening in the classroom (rated nationally at a level of75,3%) - learners revealed that in more than 88% of cases:
• the educators were in the classes;• the educators did work in the classes; and• the learners did not to go home early.
Only 33,7% of the learners indicated that lessons started on time.
Table 6.3 indicates some of the activities that educators indicated they performed during formal teach-ing periods.
It is clear that some teachers were busy with activities other than those normally performed duringteaching periods, namely:
• extra-curricular activities (30%);• meetings with school principals and other teachers (26%);• studying for self-development (8%); and• leaving learners unattended (3%).
Apart from time lost during teaching periods, time is also lost due to other factors. Table 6.4 gives anindication of the average number of days lost due to certain activities during the year. The averagenumber of days lost means that for every school in the survey, these were the number of days on whichno teaching took place.
Tea
chin
g in

43
From this table, it is clear that the following are responsible for most of the days lost:
• illness among staff members;• of teaching and learning materials;• cultural activities; and• late registration.
When calculated as part of the number of school days per year (average 200), almost 5% of teachingtime was lost in this way.
6.2.4 Learning and teaching materials
The learning and teaching materials indicator displayed a significant influence on learner scores.Learners in those schools that indicated having greater learning and teaching materials obtainedhigher scores. Information from the survey used to calculate the learning and teaching materialsindicator includes:
• materials needed in the classrooms;• materials needed for the learning programmes;• issuing of work books for Literacy, Numeracy and Life Skills; and• ordering of materials.
Gauteng and Northern Cape had the highest indicators for learning and teaching materials (Figure6.2). The ordering of materials seemed to be a problem; approximately 79% of the respondentsindicated that they had ordered learning support materials but only one-third had received the material.The indicator for ordering materials did not deviate much across the provinces from the nationalaverage. The figure for receiving the ordered material ranged from 5,1% in Eastern Cape to 47,1% inWestern Cape.
Systemic Evaluation 2003 - Foundation Phase

Systemic Evaluation 2003 - Foundation Phase 44
Figure 6. 2 Availability of Learning and Teaching Materials, by Province
The availability of learning support materials for Grade 3 learners ranged from 34% in Mpumalanga toa high of 65,5% in Western Cape and Gauteng, with a national average of 51,4%.
Educators indicated that the shortage of learning and teaching materials had an influence on teachingand learning (a level of 51%). Principals rated the influence even higher, at a level of 72%. The scaleof this response ranges from “not at all” (0%), “a little” (33%), “quite a lot” (67%) to “a great deal”(100%).
6.2.5 Teaching practices
In calculating the indicator for teaching practices, the following classroom activities were consideredas essential for outcomes-based instruction:
• storytelling and rhyming;• transferring knowledge and skills to everyday life situations;• developing writing skills;• discussing and solving problems in pairs or groups;• encouraging independent problem solving;• using learning support materials such as newspapers, magazines and so on for activities like
interpreting graphs;• developing logical reasoning skills;• developing basic skills like counting and measuring, using practical equipment;• teaching learners to plan, organise and manage themselves;• developing learners’ self-esteem and confidence; and• teaching learners to be sensitive to each other’s languages, cultures and religions.
Educators and learners had to indicate, on a given scale, the frequency with which the activities listedabove occurred in their classrooms. The scale of the indicator ranged from 0% for “never” to 100% for“every day”. The results are summarised in Figure 6.3.
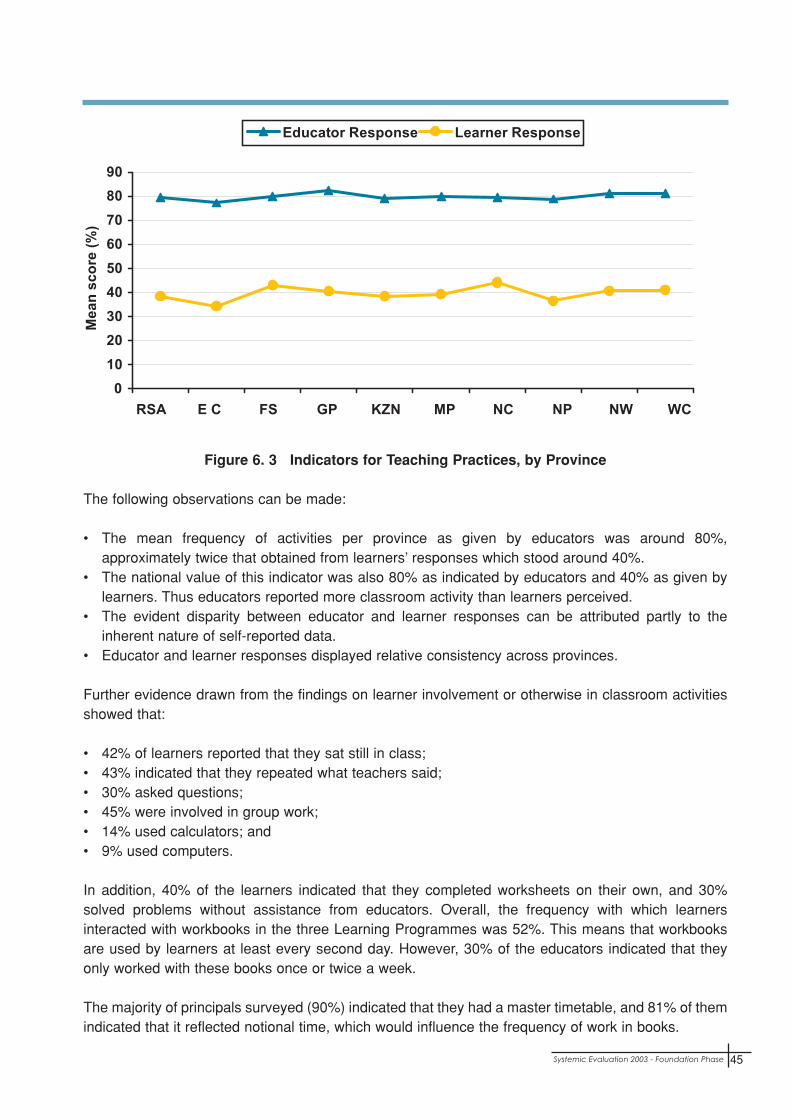
45
Figure 6. 3 Indicators for Teaching Practices, by Province
The following observations can be made:
• The mean frequency of activities per province as given by educators was around 80%,approximately twice that obtained from learners’ responses which stood around 40%.
• The national value of this indicator was also 80% as indicated by educators and 40% as given bylearners. Thus educators reported more classroom activity than learners perceived.
• The evident disparity between educator and learner responses can be attributed partly to theinherent nature of self-reported data.
• Educator and learner responses displayed relative consistency across provinces.
Further evidence drawn from the findings on learner involvement or otherwise in classroom activitiesshowed that:
• 42% of learners reported that they sat still in class;• 43% indicated that they repeated what teachers said;• 30% asked questions;• 45% were involved in group work;• 14% used calculators; and• 9% used computers.
In addition, 40% of the learners indicated that they completed worksheets on their own, and 30%solved problems without assistance from educators. Overall, the frequency with which learnersinteracted with workbooks in the three Learning Programmes was 52%. This means that workbooksare used by learners at least every second day. However, 30% of the educators indicated that theyonly worked with these books once or twice a week.
The majority of principals surveyed (90%) indicated that they had a master timetable, and 81% of themindicated that it reflected notional time, which would influence the frequency of work in books.
Systemic Evaluation 2003 - Foundation Phase

Systemic Evaluation 2003 - Foundation Phase 46
Experiential learning - for example, field trips and project work - was used by 52% of educators.
6.2.6 INSET and SGB training
The provision of in-service training (INSET) for educators and school governing bodies is one way toensure that they have access to the latest developments and policies relating to education andgovernance of schools. Educators can benefit from in-service training in implementing the policy onCurriculum 2005. Through INSET, SGB members can better understand policies being implementedat their schools.
The national indicator for INSET and SGB training as a whole was 68,2%, implying that on average68% of the respondents attended INSET. Approximately 76% of the principals indicated that SGBsreceived training, while 70,6% of principals considered the training they received as very useful. It isworth noting that less than 50% of the principals indicated that they attended in-service trainingcourses in school management and administration before they became principals.
On average, 68% of educators indicated that they attended INSET programmes on OBE. The averageduration of the INSET courses attended by the educators before and during 2001 is noted in Table 6.5.Across all the provinces, the average number of days of training received before 2001 can becalculated as equivalent to between 3 and 8 full days of training, which seemed to be insufficient toimplement a totally new approach to teaching.
The majority of educators evaluated their INSET programmes as useful (60,2%). In-service trainingprogrammes presented by fellow educators and outside agencies were regarded as less successfulthan those presented by departmental officials. Also, nearly two-thirds of educators (62,6%) did not feelfully confident to implement OBE in classes, and rated the integration of the LearningAreas/Programmes and the development of learning material relatively higher.
The low level of confidence in implementing OBE can be a result of:
• not all the educators attending in-service training programmes;• school-based training (by teachers and principals) being rated lower than training by departmental
officials; and• the length of the in-service training courses (see Figure 6.4 for the percentage of educators
attending INSET courses of varying duration).

47
Figure 6. 4 Duration of In-Service Training
In addition to those findings, it is worth noting that 68% of respondents attended in-service trainingcourses. The attendance rates in the provinces ranged from 50 to 80%. Table 6.6 indicates thepercentage of educators who received credits after attending INSET courses.
While most of the in-service training courses are structured in such a way that educators attendingthese courses will be able to teach according to the prescribed curriculum, very few educators receivedany credit for their attendance.
6.2.7 Record keeping
The indicator for record keeping had a small but negative influence on learner performance. At “lower-performing schools”, any additional time spent on record keeping seemed to have had a negativeeffect on learner performance, although this issue needs to be further investigated. This indicator takesthe following responsibilities of the principal into consideration:
• keeping registers for teachers’ attendance and leave;• keeping registers for learner attendance;• maintaining an assets (stock) register;• maintaining an inventory of textbooks/learning materials;• maintaining a correspondence file system;• maintaining a file of circulars;• keeping written minutes of staff meetings; and
Systemic Evaluation 2003 - Foundation Phase

Systemic Evaluation 2003 - Foundation Phase 48
• keeping progress records of learners’ performance.
The following are the educator’s record keeping responsibilities:
• maintaining an attendance register for learners;• preparing lessons/learning programme plans;• keeping records of learners’ performance;• keeping records of continuous evaluation;• sending signed reports sent home to parents; • maintaining learners’ portfolios;• maintaining learners’ profiles; and• keeping Foundation Phase curriculum policy documents.
Record keeping was rated at a level well above 90% nationally and in the provinces (see Table 6.7).Items that were rated below 90% but above 80% were the maintenance of learners’ portfolios andlearners’ profiles (two essential aspects in OBE), as well as the keeping of a correspondence file sys-tem.
6.2.8 Educator morale and attitude towards school
It is well documented in the different research findings that educator morale and attitude can have asignificant impact on how learners perform. This indicator was based on:
• the principals and educators who would change to another career if they had the opportunity; and • whether other stakeholders appreciated the work of educators.
Surprisingly, the results indicate that there was a negative correlation between educator morale andattitudes towards school and learner scores. Thus, learners performed worse in schools whereeducator morale was higher and attitudes were more positive. This phenomenon needs furtherresearch.
As noted in Figure 6.5, between 15% and 30% of educators across all provinces were unhappy withtheir jobs. Approximately 20% of principals and 26% of educators would change to another career ifthey had the opportunity.
Educators and principals differed on the influence of low educator morale on learning achievement.Educators rated it at an average of 35% while principals rated it at 59%. Principals might have judgedthe influence more objectively, as they were evaluating it from outside the teaching process. The scale

49
of this response ranges from “not at all” (0%), a “little” (33%), “quite a lot” (67%) to “a great deal”(100%).
Educators indicated that their lack of teaching skills only has a small influence on learner achievement(28%), while principals rated the level of influence of un-qualified and under-qualified educators onlearner achievement at a much higher rate of 43% (a “little bit” to a “a great deal”).
Figure 6.5 Rating of Educator Morale and Attitude to School, by Province
6.2.9 School management and leadership
This indicator looks into organisational aspects such as:
• the policies of the school;• management by the principal; and• the role of the school management team.
Nationally, the indicator was 80,3% and there is not much deviation from this average in the provinces(see Table 6.8).
A policy aspect that was not well implemented by the stakeholders was around HIV/AIDS. Nationally,42% of principals indicated that they had a school policy on HIV/AIDS. The existence of an HIV/AIDSpolicy in schools varied from 26% to 56% across the provinces.
Aspects that principals rated lower than the average were responses to:
• Does the school conduct appraisals of teachers? (56,8%)• Does the school have the National Assessment Policy document? (63,2%)
Systemic Evaluation 2003 - Foundation Phase

Systemic Evaluation 2003 - Foundation Phase 50
• Does the school have a Provincial Assessment Policy document? (60,9%)• Does the school have a school development plan? (75,8%)
The evaluation of principals by educators varied in the provinces from 68,9% to 79,6%, with a nationalaverage of 77,6%.
Educators evaluated the following managerial aspects of principals below the average:
• displaying adequate competence as a manager (76,4%);• involving teachers in decision-making (74,4%);• successful staff development (76,1%);• monitoring teacher performance (75,7%); and• dealing with non-performing staff (68,6%).
Principals evaluated the success of their in-service training in management at 75% and in financialmanagement at 67,6%.
6.2.10 Assessment of learners and feedback procedures
The scale on which assessment and feedback procedures were calculated ranges from 100%(equivalent to “daily actions”) to 0% (equivalent to “never”). The national average of 52,4% means thatassessment and feedback took place during 52 out 100 days, or every second day on average. Thelowest indicator appeared in Northern Cape and Western Cape, and the highest in Eastern Cape. SeeTable 6.9.
6.2.11 Homework
The indicator for homework was calculated in the same way as for the assessment and feedback pro-cedures. According to Table 6.10, the frequency of assigning homework was 47,2% - that is, 47 out of100 days or almost every second day. The frequency in provinces did not deviate much. Feedback andthe correcting of homework took place less regularly, on average “every third day” (33%).

51
6.3 Findings: Learner Performance
An overview of the findings indicates the following national average scores obtained by learners:
• Life Skills - 54%;• Literacy - 54%:
• Listening Comprehension - 68%,• Reading and Writing - 39%;
• Numeracy - 30%.
As indicated in Figure 6.6, the average performance of learners was consistent across all theprovinces in all the Learning Programmes assessed. In addition, the difference in mean scores acrossthe provinces in these Learning Programmes was small. This indicates that the scores obtained bylearners within the different provinces were similar.
Figure 6.6 Learner Scores, by Learning Programme and Province
6.4 Quality Indicators Influencing Learner Performance
In this section, the influence of the quality indicators on the performance of the learners is examinedby using regression analysis. Only the coefficients of the significant indicators and the R-square valueare reported in Table 6.11.
A general overview of the results indicates the following:
• The quality indicators that displayed a significant influence on learner scores only explained 22% ofthe differences in learner performance. This implies that at least 78% of the variation in learnerscores can be attributed to factors other than those considered in this analysis.
• The facilities indicator had the strongest influence on learner scores, followed by satisfaction rateof stakeholders, learning and teaching materials, teaching practices (learner responses), atten-
Systemic Evaluation 2003 - Foundation Phase

Systemic Evaluation 2003 - Foundation Phase 52
dance rates, contact time and time on task, assessment of learners and feedback procedures,teaching practices (educator responses), and school management and leadership.
• The indicators that displayed a negative influence on learner scores are: • repetition and dropout rates, • INSET and SGB training, and• record keeping.
In the next section, a detailed discussion on the significant indicators is provided. It should be noted,however, that the findings only point to specific trends and practices, and specific reasons for thesefindings cannot be provided without additional information and/or analysis.
6.5 Discussion and Analysis of Findings
In this section, the findings on indicators that related to quality are discussed. These findings areinterpreted with a view to establishing baseline information on the quality of education provision.
6.5.1 Facilities
Project 7 (School Infrastructure) of Programme 2 (School Effectiveness and Educator Professionalism)of the Implementation Plan for Tirisano (DoE, 1999) commits itself to ensuring that all schools meetthe minimum physical and infrastructural requirements necessary to establish and support a conducivelearning and teaching environment. Principals of 39% of the schools surveyed reported that theirschools were either not suitable for teaching or needed structural repairs. Classrooms that are notsuitable for education will hamper the quality of education. Educators indicated that 11,3% of themwere teaching classes with more than 50 learners, while an additional 21,9% were teaching classeswith 40 to 50 learners. Quality education, especially outcomes-based education with its emphasis ongroup work and the use of additional resources, cannot take place in overcrowded classrooms. TheDepartment of Education must prioritise the provision of sufficient teaching space to ensure that qualityeducation can take place in all of South Africa’s schools. Before undertaking a classroom building

53
programme, the Department should perform a needs analysis to determine the available teachingspace in neighbouring schools. It might be more cost-effective in the interim to transport learners toschools where teaching space is under-utilised.
6.5.2 Learning and teaching materials
The availability of learning support materials can have an influence on the quality of education thatlearners receive. The findings of this Systemic Evaluation at the Grade 3 level were that learners inthose schools with more learning and teaching materials obtained higher scores than those in schoolswith fewer materials. An alarming finding was the low percentage of ordered material that had beendelivered to schools. The Department of Education must ensure that ordered materials are availableat every school from the beginning of the school year to prevent learning time being wasted.
6.5.3 Teaching practices
Teaching methods are dialectically related to classroom organisation and practices in that they have apotential to influence equitable creation of a conducive environment for learning.
It is clear that practices related to outcomes-based education were not fully implemented in Grade 3classes.
In general, learners’ responses consistently suggested that learner involvement in classroom activitieswas low.
6.5.4 Attendance rates, contact time, time on task
Quality education cannot take place when the learners and educators are not present every day. Theschool management team must take responsibility for ensuring that learners and educators arepresent at all times. There must also be communication with parents regarding the absenteeism oftheir children. According to the South African Schools Act of 1996, it is the responsibility of the parentsto see that their children attend school regularly, and it is compulsory for all learners between 7 and15 years of age to attend school.
The indication that only one-third of the educators started their lessons on time is a matter of concern.The fact that many educators were not using teaching periods for teaching purposes is also reason forconcern, as it undermines the education process. The principals and the school management teammust institute a code of conduct to ensure that learners and educators perform their tasks to the bestof their ability. Principals must also undertake to deal with educators who do not perform their duties.
The number of days lost for teaching purposes can be decreased by ensuring that:
• teaching and learning materials are delivered on time;• extracurricular and cultural activities are performed after normal school hours only; and• professional development and meetings take place after school hours only.
Systemic Evaluation 2003 - Foundation Phase

Systemic Evaluation 2003 - Foundation Phase 54
6.5.5 Assessment of learners and feedback procedures
Feedback to learners on their homework assignments took place on average every third day. This isdespite the fact that feedback to learners, especially for remediation purposes, forms an integral partof the learning process. Report-back to learners on their progress is pertinently mentioned in theassessment policy documents. Thus, feedback to remedy problems and to encourage learners shouldbe given at more regular intervals.
With regard to assessment, although the national average indicates that these actions took placeevery second day on aggregate, there were cases where educators reported that assessment tookplace once a week or once a month. In outcomes-based education, where continuous assessment ispropagated, it is essential that assessment of all aspects should take place regularly. It is alsonecessary to give clear feedback to learners and to remedy problems that might occur. Assessmentmust be implemented according to the policy documents so that it is more uniform. Principals andLearning Area managers (Learning Area facilitators) must see that these policies are beingimplemented.
6.5.6 Repetition and dropout rates, age by grade
The policy on the admission age of learners to school should be implemented in such a way thatlearners are tested to make sure that they are school-ready. According to the South African SchoolsAct, it is compulsory for children to attend school between the ages of 7 and 15 years, and it is theresponsibility of the parents to see that this is done. The principal and the SGB of the school mustcommunicate this responsibility to the parents. When there are dropouts among learners younger than15 years, the principal must remind the parents of their responsibility.
6.5.7 INSET and SGB training, and school management and leadership
It must become the policy of the Department of Education to award an acknowledged teacher trainingqualification to educators who have attended in-service training courses. Bursaries must be madeavailable to enable un-qualified and under-qualified educators to attend in-service training. This mightenhance the quality of their teaching.
All in-service training courses should be accredited by a recognised institution. This will have thefollowing benefits:
• the quality can be assured;• the educators should have mastered the content before gaining credits; and• in-service training courses can be structured according to need.
Strong school management and leadership are crucial to the smooth running of a school. It isessential, therefore, that the school management team is able to function at a high level. Principalsrated the success of their in-service training in management at 75% and in financial management at67,6%. Rather than waiting until principals are already in their leadership posts to provide them withtraining, they should be trained before they take up their posts.

55
According to educators, almost 69% of principals did not deal with non-performing educators. Thiscould be a sign that principals have not received sufficient managerial training. They must, amongother things, be taught to conduct staff development and to deal with educators who are not performingadequately.
6.5.8 Record keeping
Learner portfolios and profiles do not only form an essential part of OBE, but also reflect the progressthat the learner has made during the year. They are an indication of the quality of the education thatthe learner has received. Teachers must be urged to maintain portfolios and profiles. As stated in theAssessment Policy in the General Education and Training Band, cumulative evidence of learnerachievement must be recorded and these records should accompany all learners throughout theirlearning paths.
6.6 Policy Suggestions
• Government must develop a plan for dealing with the infrastructural backlogs in schools, andensuring that the backlog is eradicated as a matter of urgency.
• Government must hire additional educators to lower the educator:learner ratios at schools wherethey are above the norm.
• Government must ensure that learning and teaching materials are delivered to schools on time,before the start of the school year.
• Government must provide in-service training courses through accredited institutions to un-qualifiedand under-qualified teachers, and ensure that teachers receive credit for these courses. Educatorswho have attended in-service training courses and gained a higher qualification must be awardedan acknowledged teacher training qualification.
6.7 Conclusion
This chapter gave an analysis of the findings on the transformation goal of quality at the Grade 3 level.The chapter looked at the findings on the quality-related indicators, as defined in the SystemicEvaluation Framework (DoE, 2001a). It also presented an overview of learner performance scores,aggregated by province.
The major findings were that there is a strong correlation between learner scores and the quality of thefacilities available at schools. The same holds true for learning and teaching materials - learners inthose schools that had more learning and teaching materials obtained higher scores. There was alsoa correlation between attendance rates, contact time and time on task, and learner scores.
From the results reported in this chapter, it is still unclear why critical indicators that are known toinfluence learner performance - for example, assessment of learners and homework - did not displaygreater influence on learner scores. It is vital that specific reasons for these findings be determined infollow-up studies.
Several aspects have been highlighted which can be applied to improve the education system. Thepass rates of learners and the satisfaction of stakeholders might be seen as ultimate indicators of thequality of education, but they are only the result of all the actions in the input and process phase of
Systemic Evaluation 2003 - Foundation Phase

Systemic Evaluation 2003 - Foundation Phase 56
education. Aspects discussed in this chapter that might improve pass rates, and thus also thesatisfaction of stakeholders, include:
• the timely provision of learning and teaching materials;• the improvement of facilities at school;• the effective use of time on task;• further training of educators; and• in-service training of educators and principals.
The following chapter focuses on learner assessment.

Chapter 7
57
LEARNER ASSESSMENT
7.1 Introduction
The results reported in this chapter were obtained from a sample of approximately 52 000 Grade 3learners selected from all provinces and districts. Results are reported for each of the three LearningProgrammes assessed:
• Literacy, which comprises two instruments - Listening Comprehension, and Reading and Writing;• Numeracy; and • Life Skills.
Results are aggregated by province, gender, item format and, for the Literacy tasks, by reading andwriting.
The mean scores were calculated on data weighted according to the sample size for each school,district and province.
7.2 Reliability of Assessment Instruments
Reliability coefficients (in this case, alpha coefficients) were calculated to determine the reliability ofthe instruments used for assessing learner performance. The alpha coefficient was used as it is widelyaccepted as a fundamental index of reliability.
As noted in Table 7.1, the alpha coefficients for all the instruments were acceptable, indicating that theresults obtained can be regarded as highly reliable.
Additional analysis was conducted on each item used in this study. The results indicated that all itemsapplied were acceptable and thus no items were excluded from the analysis.
7.3 Learner Performance
The national average scores obtained by learners are presented in Figure 7.1. In general, learnersobtained the lowest scores for Numeracy (national mean of 30%) and 54% for both Life Skills and
Systemic Evaluation 2003 - Foundation Phase

Systemic Evaluation 2003 - Foundation Phase 58
Literacy. However, for Literacy, learners were assessed for both Reading and Writing and ListeningComprehension, with the national scores averaging 39% and 68% for each of these areas respectively.
Figure 7.1 National Average Scores, by Learning Programme
The distribution of learner scores for each Learning Programme is presented in Figures 7.2 to 7.6.Literacy scores are presented for both areas assessed.
As can be seen in Figure 7.2, the distribution of Life Skills scores presents a relatively equitable dis-tribution as large numbers of learners obtained scores between 30% and 90%. Figure 7.3 presents adistribution similar to that of a normal curve, indicating that most learners obtained scores between40% and 70% for Literacy. In contrast, the distribution of Numeracy scores (Figure 7.4) are skewed tothe left, as most of the learners scored below 40%. For Listening Comprehension the scores areskewed to the right, indicating that the majority of learners scored 60% or higher.

59
Figure 7.2 Distribution of Life Skills Scores
Figure 7.3 Distribution of Literacy Scores
Systemic Evaluation 2003 - Foundation Phase

Systemic Evaluation 2003 - Foundation Phase 60
Figure 7.4 Distribution of Numeracy Scores
Figure 7.5 Distribution of Literacy (Listening Comprehension) Scores

61
Figure 7.6 Distributions of Literacy (Reading and Writing) Scores
7.4 Learner Scores by Province
As indicated in Figure 7.7 the pattern of performance of learners was consistent across all theprovinces in all three Learning Programmes assessed. In addition, the variation in mean scores acrossthe different provinces was small, indicating that in most cases the average scores across theprovinces for each Learning Programme were similar.
7.5 Learner Performance by Gender
The average scores for girls were slightly higher than that of boys in all three Learning Programmesassessed (see Figure 7.8). The pattern of performance, however, is similar to that noted in Figure 7.7for both boys and girls - that is, the lowest scores were obtained for Numeracy and similar scores forLife Skills and Literacy.
Systemic Evaluation 2003 - Foundation Phase

Systemic Evaluation 2003 - Foundation Phase 62
Figure 7.7 Learner Scores, by Learning Area and Province
Figure 7.8 Leaner Scores, by Gender
7.6 Learner Performance by Item Format
Additional analyses were conducted to compare the performance of learners on the multiple-choicequestions (MCQ) and free-response questions (FRQ) for Numeracy and Literacy tasks. As noted inFigure 7.9, scores obtained for the MCQ were significantly higher than those obtained for the FRQ.This result indicates that learners performed better on tasks that required them to identify and selecta correct response than on tasks that required them to produce their own response.
)

63
Figure 7.9 Learner Scores, by Item Format
7.7 Literacy Scores by Reading and Writing
Additional analyses conducted on the Literacy scores revealed that across all provinces learnersobtained significantly higher scores on the reading tasks than on the writing tasks (see Figure 7.10).Except for KwaZulu-Natal, the mean scores for all provinces were below 50% for the reading tasks andbelow 35% for the writing tasks. These results support the findings noted in section 7.5, as learnersseem to have greater difficulty in producing their own (written) responses.
Figure 7.10 Reading and Writing Scores, by Province
Systemic Evaluation 2003 - Foundation Phase

Systemic Evaluation 2003 - Foundation Phase 64
7.8 Language of Instruction and Home Language
The assessment instruments were administered to learners in the language of learning and teachingused at the school. The data indicates that the majority of learners (75%) did in fact respond to theassessment tasks in their home language. However, as shown in Figure 7.11, there were largevariations between provinces. For example, in Gauteng learners who took the instrument in their homelanguage were in the minority - approximately one-third. In other words, about 64% of the learnersresponded to the assessment tasks in their second or third language. The corresponding figure was13% for Eastern Cape, 26% for the Free State, 17% for KwaZulu-Natal, 46% for Mpumalanga, 8% forNorthern Cape, 17% for Limpopo, 22% for North West, and 10% for Western Cape. This could beattributed to the movement of learners to English-medium schools, the selection of English as amedium of instruction and, to some extent, the increasing enrolment of learners from outside theborders of South Africa.
Figure 7.11 Language of Assessment Tasks versus Home Language of Learners
Analysis of the effect of home language on learner scores revealed that learners who took theinstruments in their home language obtained significantly higher scores across all learning areas thantheir colleagues who had to respond to the assessment tasks in their second or third language (seeFigure 7.12).

65
Figure 7.12 Language of Learning and Home Language, by Learning Area
This pattern was similar across all provinces for the different Learning Areas and item formats, exceptfor Mpumalanga where the Numeracy scores of second-language learners were higher. The meanpercentage difference in scores at the national level varied across the different Learning Programmes,with the greatest difference noted for Listening Comprehension (7,68%), followed by Life Skills (6,2%),Literacy (5,24%) and Numeracy (2,18%). These differences also varied between the provinces (seeFigures 7.13 and 7.14).
Figure 7.13 Listening and Literacy Scores, by Language of Learning and Home Language
Systemic Evaluation 2003 - Foundation Phase

Systemic Evaluation 2003 - Foundation Phase 66
Figure 7.14 Numeracy and Life Skills Scores, by Language of Learning and Home Language
It is worth noting that large differences in scores across the different Learning Programmes weredetected in Gauteng. The score differences between the home and second language learnersaveraged approximately 18% in favour of the home language learners. This difference is extremelyhigh and suggests a need for further investigation.
7.9 Conclusion
The analysis of the learner performance results depicts a typical Grade 3 learner in the South Africaneducation system experiencing the greatest difficulty in Numeracy, with average levels of performanceof 30%. The performance of learners in Life Skills and Literacy was significantly higher (54%).However, the relatively high Literacy Scores are due primarily to the higher scores obtained by themajority of learners in Listening Comprehension (68%) as opposed to the Reading and Writing section(39%).
There were minimum differences in scores between boys and girls, although the performance of bothboys and girls followed the same the pattern of performance for each Learning Programme. Of greatconcern, though, is the extremely poor performance of learners on questions that required constructedresponses.
Two critical issues highlighted by these findings are:
• The poor numeracy and literacy skills of learners within the system point to the need for urgentintervention to address this situation. Two factors that must be addressed in any interventionprogram relate to:• the limited ability of learners to produce their own responses, and • improving access of learners to learning and teaching interactions conducted in their first/home
languages.
67
• While the average scores across provinces are similar for the different Learning Programmes(Figure 7.7), the distribution of scores noted in Figures 7.2 to 7.6 as well as the differences inperformance due to language highlights the complex nature of the education system and thuspoints to the need to further unpack the differences manifested within and between schools, districtsand provinces.
Systemic Evaluation 2003 - Foundation Phase

Systemic Evaluation 2003 - Foundation Phase 68

Chapter 8
69
CONCLUSION
In this final chapter, a conclusive overview of the findings of this report are given. There are a numberof different ways in which schools can be effective. Teachers at effective schools expect and ensurehigh standards of work and behaviour. Teachers are expected to be responsive to learners, and try toinclude them in the life of the school. This pressure and support make an effective school.
This study on the Systemic Evaluation of the education system raises doubts about the effectivenessof the education system in producing required outcomes - in other words, learner performance. Thepoor performance of learners, particularly in Numeracy and Literacy, is cause for concern. The studyhas attempted to understand how various contextual factors have influenced the performance oflearners, and these findings can be drawn upon to determine the nature of interventions that arerequired of the system. However, many questions regarding the factors that influence learnerperformance remain unanswered and require further investigation.
At the level of policy, much progress has been made in defining the transformation goals of access,equity and quality. The school admissions policy and the National Norms and Standards for SchoolFunding are two examples of this endeavour. However, in practice there are a number of factors thatprevent the education system from realising its transformation goals of access, equity and quality.During the next surveys the progress in achieving these goals will be measured.
Despite the many good policies of the Department of Education to promote and encourage greateraccess to education, many learners have been denied access to quality education as a result of theirhome environment which cannot provide resources such as reading materials. In addition, the lack ofaccess to pre-school by learners at a crucial stage of their cognitive development is a major factoraffecting the performance of learners in their schooling years. The absence of resource centres inmany schools also denies learners access to suitable learning opportunities.
The goal of achieving equity in schools, too, has not been attained. The wide disparity in the fees leviedby schools indicates that schools have inequitable access to private contributions. There is a cleardistinction between “poor” and “rich” schools when comparing their school fees. Although the policy onthe norms and standards for the funding of schools is designed to reduce this inequity, this study hasnot been able to demonstrate the extent to which it has been effective as an instrument of redress.
This study has attempted to understand the quality of education available to Grade 3 learners in anumber of ways, one of which was the measurement of learner performance. There are, however, anumber of other indicators of quality education, one of which is the quality of teaching in theclassrooms. According to the findings of this study, the indicator for teaching practices of educatorsrevealed that outcomes-based education is not being fully implemented in the classrooms. Althougheducators have received in-service training on OBE, many do not feel confident enough to implementit.
Another factor influencing the quality of education is the educator:learner ratio. Although the averageeducator:learner ratio was calculated at below 1:40, there are still many schools and classrooms thatare overcrowded, which prevents access to schools by learners and can create conditions not
Systemic Evaluation 2003 - Foundation Phase

Systemic Evaluation 2003 - Foundation Phase 70
conducive to learning and the implementation of C2005. Both principals and educators agreed thatlarge classes had a negative influence on learner achievement, and that overcrowded classrooms didnot contribute positively towards the full implementation of OBE.
The effective use of contact time and time on task was also a problem. The majority of educatorssurveyed did not use their contact time effectively, with lessons not starting on time and educatorsperforming activities other than teaching. Time was also lost due to late registration, the non-availabilityof learning and teaching materials, and illness among staff members.
The achievement of quality in education has also been hampered by factors such as unsafe conditionsat school, the high level of absenteeism of learners and educators, and the poor attitude and moraleof some of the teachers.
To ensure access to quality education, learning support materials must be made available to learners.Access to in-service training by all educators should be prioritised, so that teaching practices can beimproved. Provincial departments of education should focus on monitoring school performance andthe implementation of OBE.
This report should be viewed as a baseline study for quality assurance purposes. The progress madeby the Department of Education in achieving the transformation goals of access, equity and quality willonly be seen in the next surveys.

71
Department of Education (DoE). 1998. Consultative Paper No. 1 on Special Education.
Department of Education (DoE). 1995. White Paper on Education and Training. NoticeNo.196 of 1995.
Department of Education (DoE).2001. Assessment Policy for General Education andTraining. Pretoria: DoE.
Department of Education (DoE). 1999. Implementation Plan for Tirisano - January 2000 to
December 2004. Pretoria: DoE.
Department of Education (DoE). 2000. National Policy on Whole School Evaluation.Pretoria: DoE.
Department of Education (DoE). 2001a. Framework for Systemic Evaluation (Final).Pretoria: DoE.
Department of Education (DoE). 2001b. School Register of Needs 2000. Pretoria: DoE.
Department of Education (DoE) 2002. Responses and Suggestions - Draft SystemicEvaluation Report. 10 August.
Republic of South Africa (RSA). 1996a. National Education Policy Act. Number 27 of 1996.
Republic of South Africa (RSA). 1996b. South African Schools Act. Number 84 of 1996.
Straus et al. 2001. Education and Manpower 2000. Bloemfontein: University of the FreeState.
Systemic Evaluation 2003 - Foundation Phase
Reference

Systemic Evaluation 2003 - Foundation Phase 72