system analyzer trace analyzer statistics & logic...
TRANSCRIPT
Texas Instruments Confidential, NDA Required
TI Analyzer SuiteSystem Analyzer
Trace Analyzer
Statistics & Logic Analyzer
Simulator Profiler
Imtaz AliDecember, 2011
Texas Instruments Confidential, NDA Required
Analyzer Suite A collection of system analysis and visualization tools leveraging multiple technologies
to provide powerful debug and optimization solutions for multi-core application
Bring multiple technologies together to maximize visibility into different levels of the system
PC and CPU Event Trace (hardware instrumentation)
Common Platform (CP) Tracer to count bus events (hardware instrumentation)
Unified Instrumentation (UIA) (software instrumentation)
Simulator Instrumentation
LTTng Instrumentation (software instrumentation)
Data from different technologies and cores correlated to a common timeline for a more complete system solution
Choice of data transports allow adopting to different usage scenarios including remote access
JTAG (run and stop mode)
Ethernet
STM (System Trace Module)
UART
2
Texas Instruments Confidential, NDA Required
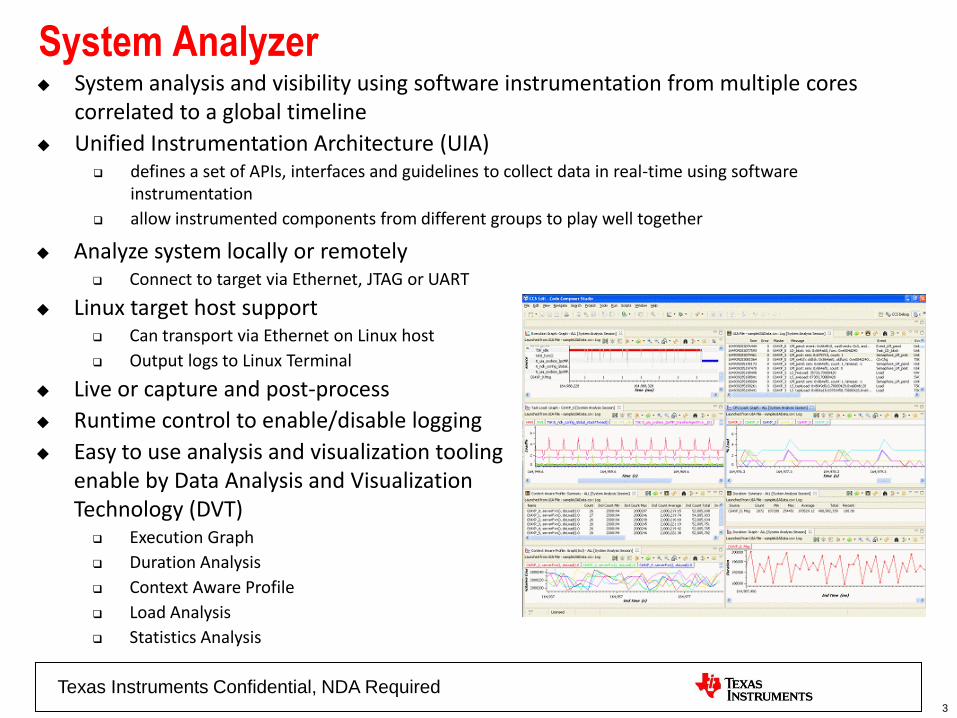
System Analyzer
3
System analysis and visibility using software instrumentation from multiple cores correlated to a global timeline
Unified Instrumentation Architecture (UIA) defines a set of APIs, interfaces and guidelines to collect data in real-time using software
instrumentation
allow instrumented components from different groups to play well together
Analyze system locally or remotely Connect to target via Ethernet, JTAG or UART
Linux target host support Can transport via Ethernet on Linux host
Output logs to Linux Terminal
Live or capture and post-process
Runtime control to enable/disable logging
Easy to use analysis and visualization tooling enable by Data Analysis and Visualization Technology (DVT) Execution Graph
Duration Analysis
Context Aware Profile
Load Analysis
Statistics Analysis
Texas Instruments Confidential, NDA Required
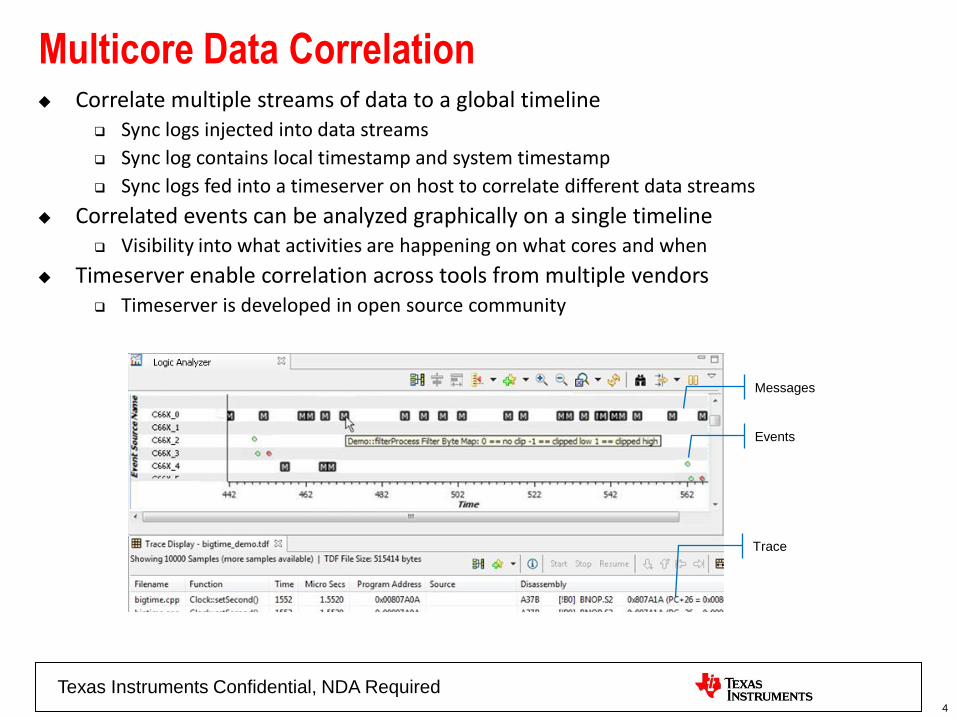
Multicore Data Correlation
4
Correlate multiple streams of data to a global timeline Sync logs injected into data streams
Sync log contains local timestamp and system timestamp
Sync logs fed into a timeserver on host to correlate different data streams
Correlated events can be analyzed graphically on a single timeline Visibility into what activities are happening on what cores and when
Timeserver enable correlation across tools from multiple vendors Timeserver is developed in open source community
Messages
Events
Trace
Texas Instruments Confidential, NDA Required
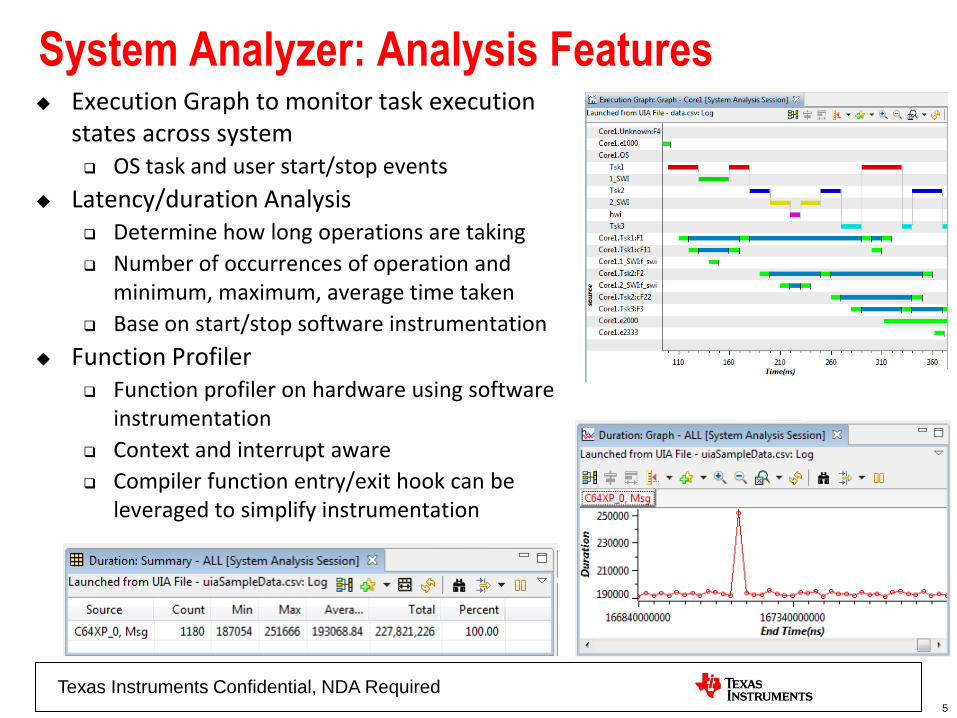
System Analyzer: Analysis Features
5
Execution Graph to monitor task execution states across system OS task and user start/stop events
Latency/duration Analysis Determine how long operations are taking
Number of occurrences of operation and minimum, maximum, average time taken
Base on start/stop software instrumentation
Function Profiler Function profiler on hardware using software
instrumentation
Context and interrupt aware
Compiler function entry/exit hook can be leveraged to simplify instrumentation
Texas Instruments Confidential, NDA Required
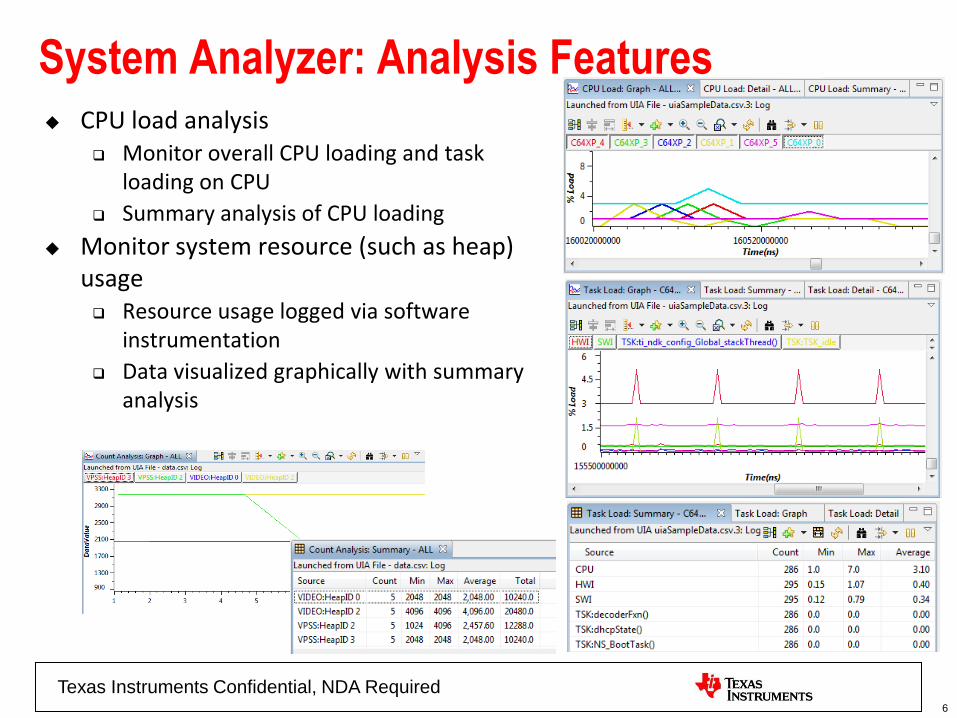
System Analyzer: Analysis Features
6
CPU load analysis Monitor overall CPU loading and task
loading on CPU
Summary analysis of CPU loading
Monitor system resource (such as heap) usage Resource usage logged via software
instrumentation
Data visualized graphically with summary analysis
Texas Instruments Confidential, NDA Required
System Analyzer: Instrumentation Package Unified Instrumentation Architecture (UIA) target package for
instrumentation
Provide target-side APIs, transports, interfaces and guidelines that enable instrumentation that is portable and flexible
Built on RTSC (open source) technology
DSP/BIOS instrumented out-of-the-box
Guidelines on how to instrument other RTOSes
UIA Portability and Flexibility
ISA independent - reusable across wide range of TI single-core and multi-core devices
O/S independent - not tied to specific operating system
Transport independent - no source code change to switch transport
Platform independent - host-side tooling works on both Windows and Linux
Texas Instruments Confidential, NDA Required
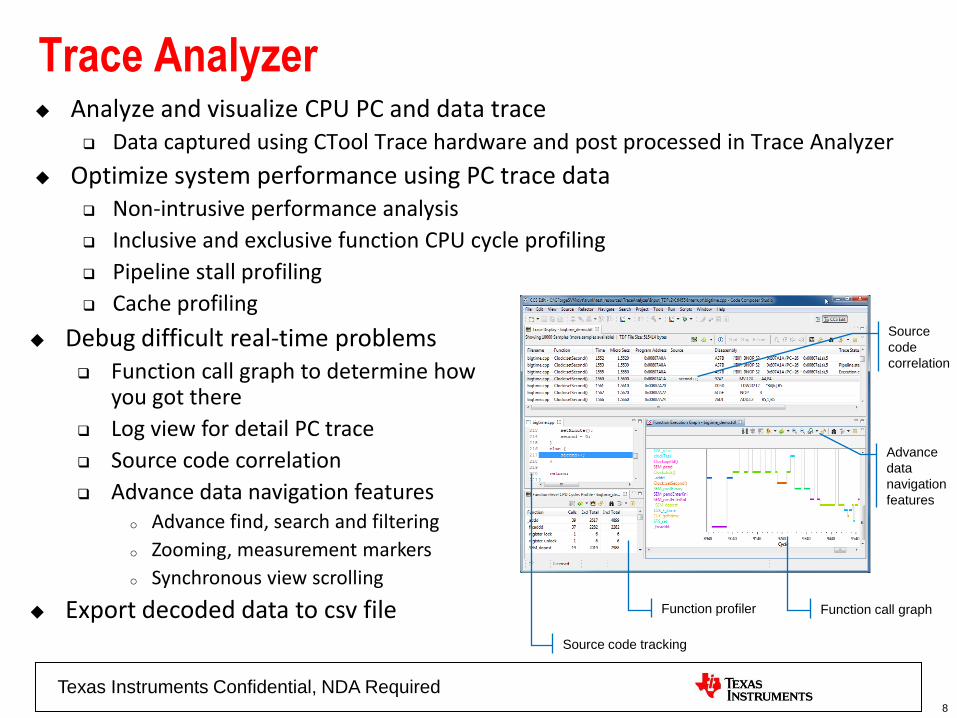
Trace Analyzer Analyze and visualize CPU PC and data trace
Data captured using CTool Trace hardware and post processed in Trace Analyzer
Optimize system performance using PC trace data Non-intrusive performance analysis
Inclusive and exclusive function CPU cycle profiling
Pipeline stall profiling
Cache profiling
8
Debug difficult real-time problems Function call graph to determine how
you got there
Log view for detail PC trace
Source code correlation
Advance data navigation featureso Advance find, search and filtering
o Zooming, measurement markers
o Synchronous view scrolling
Export decoded data to csv file Function profiler Function call graph
Source code tracking
Source
code
correlation
Advance
data
navigation
features
Texas Instruments Confidential, NDA Required
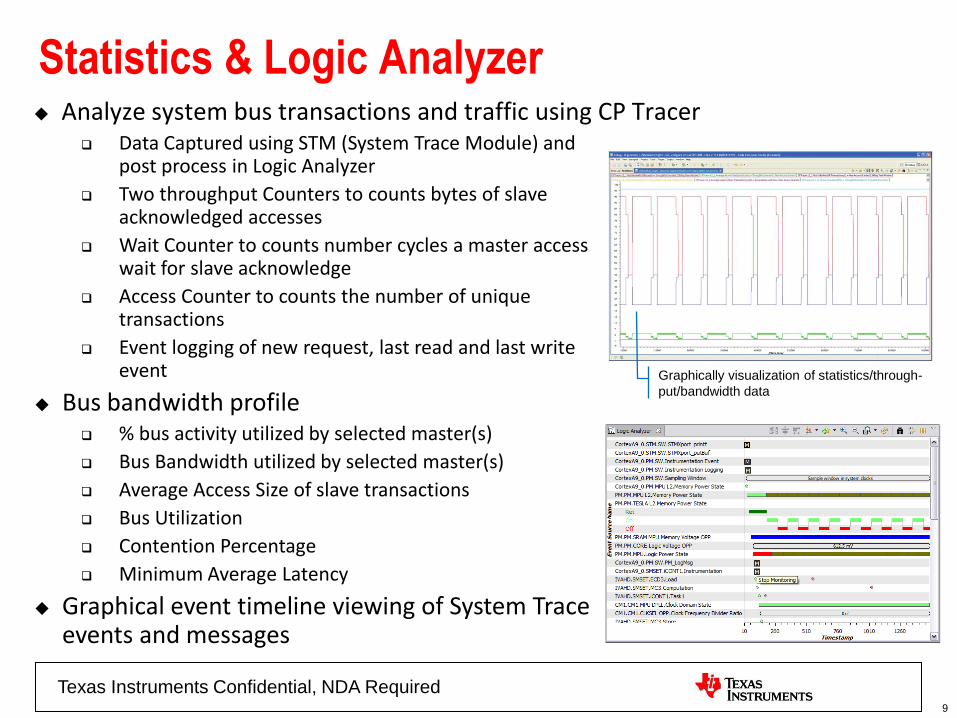
Statistics & Logic Analyzer Analyze system bus transactions and traffic using CP Tracer
9
Data Captured using STM (System Trace Module) and post process in Logic Analyzer
Two throughput Counters to counts bytes of slave acknowledged accesses
Wait Counter to counts number cycles a master access wait for slave acknowledge
Access Counter to counts the number of unique transactions
Event logging of new request, last read and last write event
Bus bandwidth profile % bus activity utilized by selected master(s)
Bus Bandwidth utilized by selected master(s)
Average Access Size of slave transactions
Bus Utilization
Contention Percentage
Minimum Average Latency
Graphical event timeline viewing of System Trace events and messages
Graphically visualization of statistics/through-
put/bandwidth data
Texas Instruments Confidential, NDA Required
Simulator Profiler Leverage the simulator profiler for situations where
Hardware is not available or
Analysis solution available on hardware does not satisfy the required use case
Function Profiler using simulator PC discontinuity trace
10
Count number of times functions are called
Calculate total inclusive and exclusive cycles spend in function
Inject OS context switch information for context and interrupt awareness
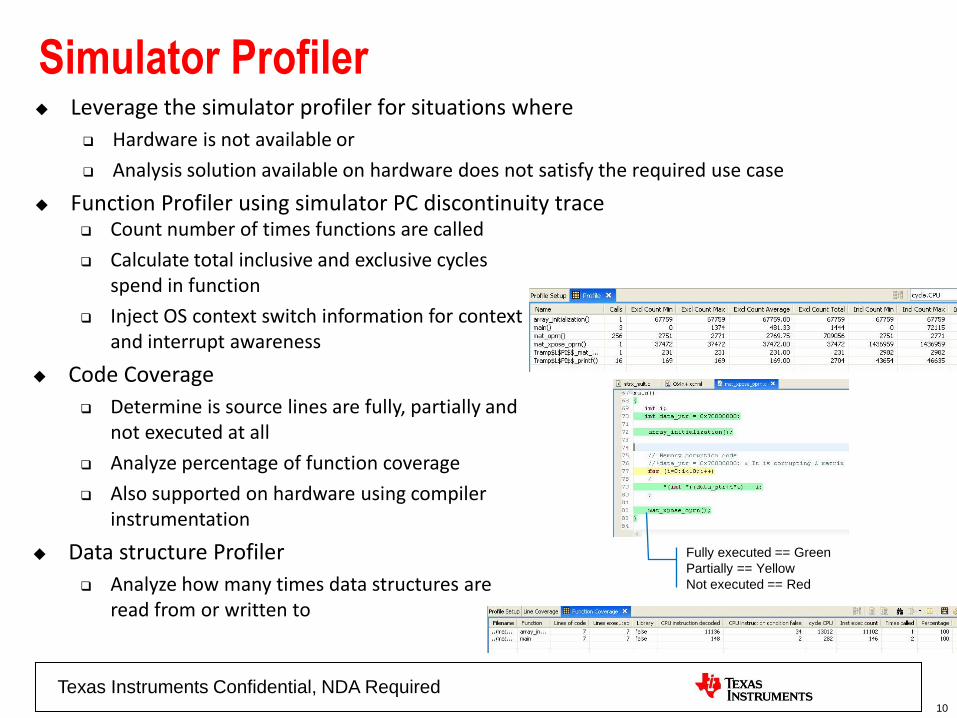
Code Coverage
Determine is source lines are fully, partially and not executed at all
Analyze percentage of function coverage
Also supported on hardware using compiler instrumentation
Data structure Profiler
Analyze how many times data structures are read from or written to
Fully executed == Green
Partially == Yellow
Not executed == Red
Texas Instruments Confidential, NDA Required
Analyzer Suite 1.1 – 2Q’11 Accessibility of CPU Trace and CP Trace data
Leverage ETB to eliminate need for expensive emulator
Drain ETB to system memory to virtually extend ETB buffer size
Transport ETB data via UIA transport to allow for non-JTag support
Bring different technologies together for a more complete solution
Pull LTTng data into Analyzer Suite for inclusion in analysis
Correlate UIA, LTTng, CPU Trace and STM data to a common timeline
Extend multi-core use cases
Multi-core concurrency analysis to determine if cores are well utilized in parallel
Task lock/wait analysis to determine how much time is spent blocked or waiting other tasks or resources
Usability
Add Compare feature to determine changes across multiple runs
Texas Instruments Confidential, NDA Required
Analyzer Suite 1.2 – 3Q’11 Primarily focus will be on simplifying uses cases (especially hardware
instrumentation based use cases)
Introduce the Analysis Suite Dashboard
Single place to access all use cases (hardware and software instrumentation based)
Integrated configuration, control and feedback. This is currently buried in different places such as Trace Control and UBM
Improve user feedback
Summary view for all analysis
Additional use cases in dashboard leveraging hardware instrumentation
Memory access analysis
Hotspot analysis
Code Coverage
Function Call Graph
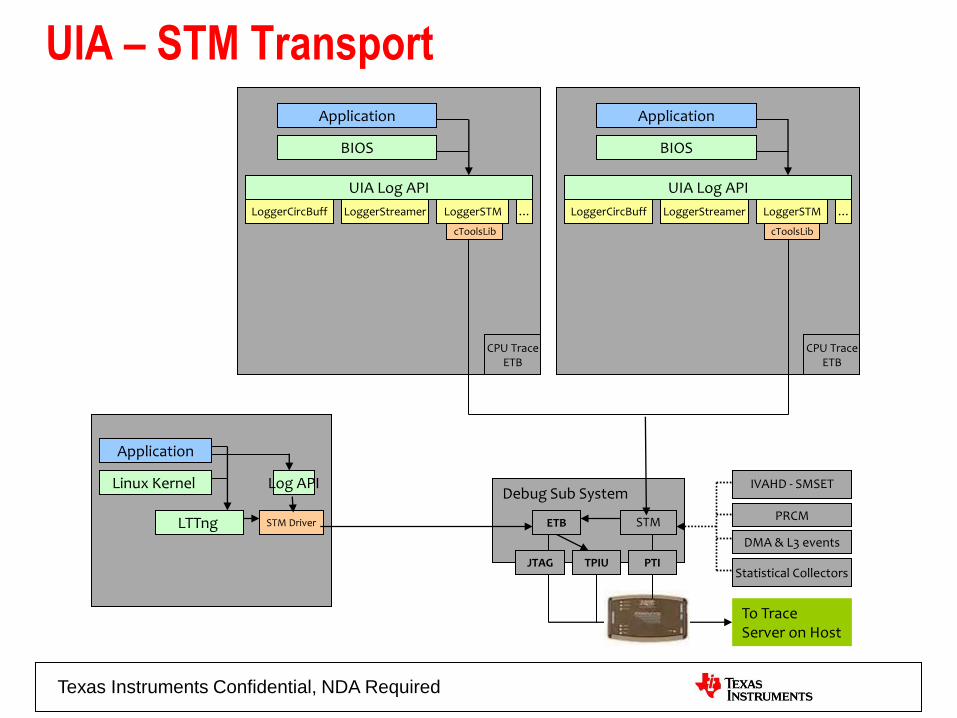
Add STM Transport to UIA
Texas Instruments Confidential, NDA Required
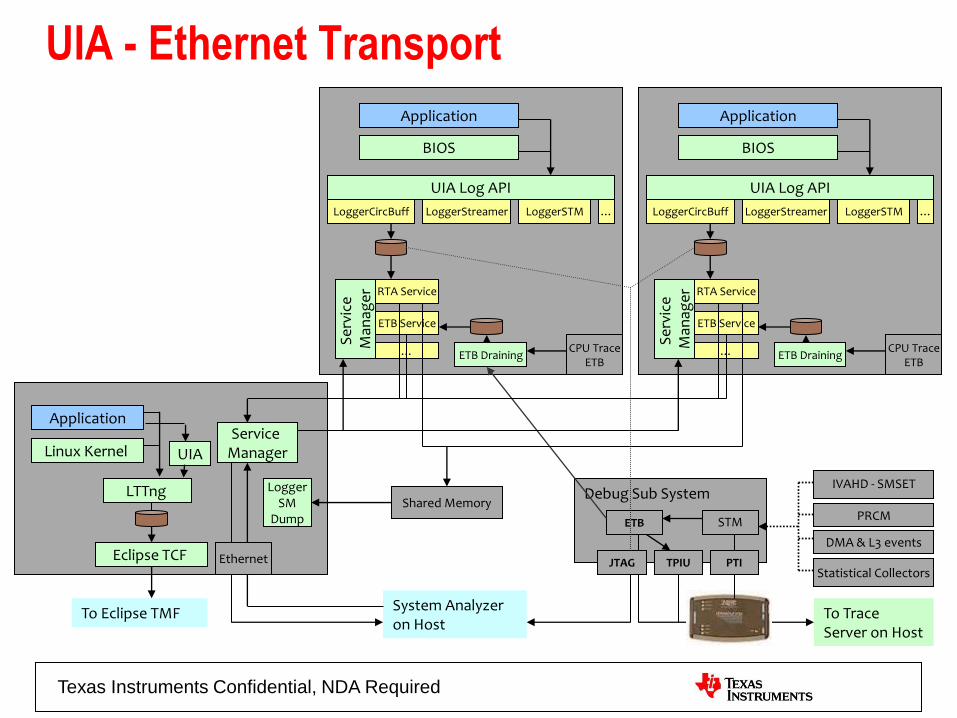
UIA - Ethernet Transport
Application
BIOS
UIA Log API
LoggerSTMLoggerCircBuff LoggerStreamer …
IVAHD - SMSET
Statistical Collectors
PRCM
DMA & L3 events
Debug Sub System
STM
To Trace Server on Host
TPIU
RTA Service
ETB Service
Se
rvic
e
Man
age
r
…
Shared Memory
Application
BIOS
UIA Log API
LoggerSTMLoggerCircBuff LoggerStreamer …
RTA Service
ETB Service
Se
rvic
e
Man
age
r…
JTAG
ETB
System Analyzer on Host
ETB Draining
PTI
CPU TraceETB
ETB DrainingCPU Trace
ETB
Application
Linux Kernel Service
Manager
Ethernet
LTTng
Eclipse TCF
To Eclipse TMF
LoggerSM
Dump
UIA
Texas Instruments Confidential, NDA Required
UIA – STM Transport
Application
BIOS
UIA Log API
LoggerSTMLoggerCircBuff LoggerStreamer …
IVAHD - SMSET
Statistical Collectors
PRCM
DMA & L3 events
Debug Sub System
STM
To Trace Server on Host
TPIU
Application
BIOS
UIA Log API
LoggerSTMLoggerCircBuff LoggerStreamer …
JTAG
ETB
PTI
CPU TraceETB
CPU TraceETB
Application
Linux Kernel
LTTng
cToolsLibcToolsLib
STM Driver
Log API
Texas Instruments Confidential, NDA Required
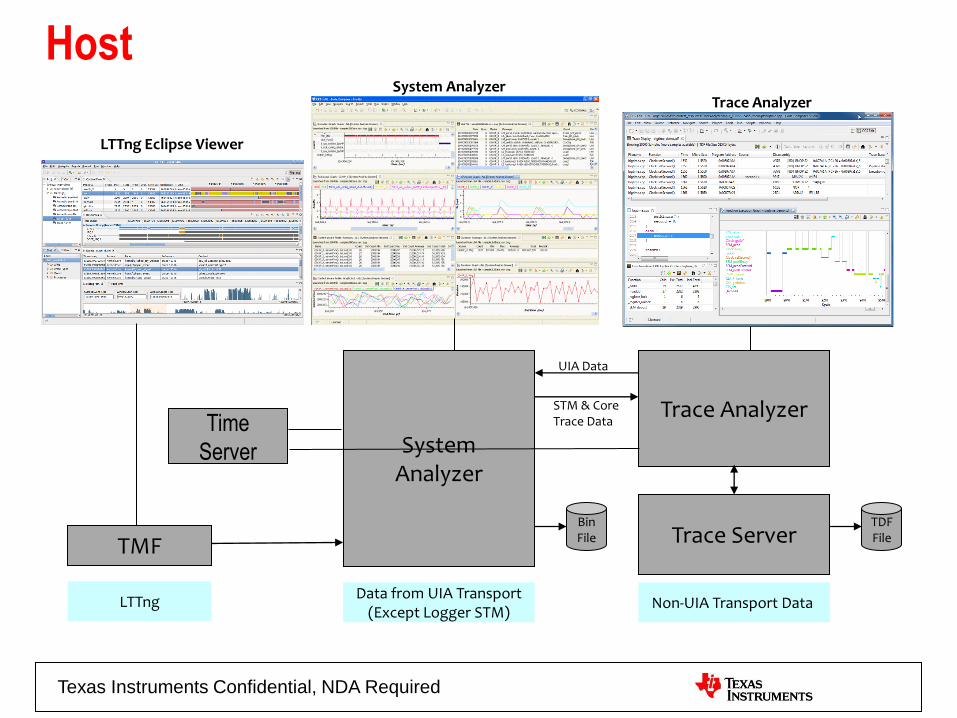
Host
SystemAnalyzer
Trace ServerTMF
LTTngData from UIA Transport
(Except Logger STM)Non-UIA Transport Data
Trace Analyzer
TDFFile
UIA Data
STM & CoreTrace Data
LTTng Eclipse Viewer
BinFile
System AnalyzerTrace Analyzer
Time
Server