synthesis, performance, and modeling of immobilized nano-sized magnetite layer for phosphate removal
TRANSCRIPT

Journal of Colloid and Interface Science 357 (2011) 440–446
Contents lists available at ScienceDirect
Journal of Colloid and Interface Science
www.elsevier .com/locate / jc is
Synthesis, performance, and modeling of immobilized nano-sized magnetitelayer for phosphate removal
Adva Zach-Maor, Raphael Semiat, Hilla Shemer ⇑Rabin Desalination Laboratory, Grand Water Research Institute, Department of Chemical Engineering, Technion, Haifa 32000, Israel
a r t i c l e i n f o
Article history:Received 19 August 2010Accepted 6 January 2011Available online 12 January 2011
Keywords:Iron oxideAdsorptionGranular activated carbonIsothermMössbauer spectroscopy
0021-9797/$ - see front matter � 2011 Elsevier Inc. Adoi:10.1016/j.jcis.2011.01.021
⇑ Corresponding author. Fax: +972 4 8292850.E-mail address: [email protected] (H. Sheme
a b s t r a c t
A homogeneous layer of nano-sized magnetite particles (<4 nm) was synthesized by impregnation ofmodified granular activated carbon (GAC) with ferric chloride, for effective removal of phosphate. A pro-posed mechanism for the modification and formation of magnetite onto the GAC is specified. BET resultsshowed a significant increase in the surface area of the matrix following iron loading, implying that a por-ous nanomagnetite layer was formed. Batch adsorption experiments revealed high efficiency of phos-phate removal, by the newly developed adsorbent, attaining maximum adsorption capacity of 435 mgPO4/g Fe (corresponding to 1.1 mol PO4/mol Fe3O4). It was concluded that initially phosphate wasadsorbed by the active sites on the magnetite surface, and then it diffused into the interior pores ofthe nanomagnetite layer. It was demonstrated that the latter is the rate-determining step for the process.Innovative correlation of the diffusion mechanism with the unique adsorption properties of the synthe-sized adsorbent is presented.
� 2011 Elsevier Inc. All rights reserved.
1. Introduction unattractive options for wastewater treatment. Phosphate adsorp-
Phosphates are used in many consumer products and industrialprocesses that involve particles of a colloidal nature, such as fertil-izers, detergents, pigment formulation, water treatment, and min-eral processing [1]. The presence of trace amounts of phosphate(even less than 1 lg/L) in treated wastewater from municipalitiesand industries is often accountable for eutrophication (i.e., excessof nutrients and associated effects such as rapid growth of blue-green algae and hyacinth-like plants), which leads to short- andlong-term environmental and aesthetic problems in lakes, coastalareas, and other confined water bodies [2]. Therefore, the amountof phosphorus compounds in domestic and industrial dischargesmust be controlled using either chemical or biological techniques.
The common forms of phosphorus found in aqueous solutionsinclude orthophosphates, polyphosphates, and organic phosphates.Municipal wastewater may contain from 4 to 15 mg/L phosphorusas PO3�
4 . However, industrial wastewater (such as detergent manu-facturing and metal coating processes) may contain phosphate lev-els well in excess of 10 mg/L [3].
In wastewater treatment technology, various techniques havebeen used for phosphate removal including chemical and biologi-cal methods. Chemicals such as lime, alum, and ferric chlorideare common coagulants used for phosphate removal. Yet, theircost and sludge production make these chemical treatments
ll rights reserved.
r).
tion by metal (hydro)oxides, mainly iron oxides, was shown to bean effective method for removing phosphorus from wastewater[4–6]. However, metal salt (Al(III), Fe(III)) addition can achieve only80–95% of total phosphorus removal. Therefore, effluent concen-tration of 1 mg/L total phosphorus can be met with metal saltaddition and efficient clarification, but in order to reduce effluentconcentration to 0.5 mg/L (allowing discharge into surface water)total phosphorus, filtration of the secondary effluent will mostlikely be essential [7].
Adsorption is one technique often used to remove contaminantsfrom pollutant waters. Theoretically, its efficiency may be en-hanced by extending the adsorbent surface area. Hence, by reduc-ing iron particles size (i.e., increasing their surface area) enhancedadsorption is to be expected. However, small sized nanoparticlesmay not be separated from aqueous solutions by gravitational sed-imentation. Consequently, immobilizing the nanoadsorbents ontosupporting matrix may enable efficient usage of the nanoparticles.
Surface-modified adsorbents became more prominent in recentyears. Several researchers studied the effect of various processparameters on removal of arsenic species by iron-impregnatedgranular activated carbon [7–13]. It was established that the chem-ical behavior of AsO4 is similar to that of PO4 [14]. Both of theseoxy-anions are specifically adsorbed on soil minerals, mainly onvariable charge minerals (Al, Fe, and Mn oxides). Therefore, varyingprocesses, which were originally designed for arsenic removal indrinking water, were adopted for phosphate removal with greatsuccess, including adsorption onto activated alumina [1] and gran-ular ferric hydroxide (GFH) [15].
A. Zach-Maor et al. / Journal of Colloid and Interface Science 357 (2011) 440–446 441
Combining activated carbon as a support and iron oxide nano-particles as an active phase makes it possible to take advantageof both the enhanced retention of pollutants in the porous carbonand the control of particle size made possible by confining the ironoxide particles in the pores of the support [16].
The objective of this study was to develop and characterize anano-iron oxide-impregnated granular activated carbon (nFe-GAC) for effective removal of phosphate from aqueous solutions.
2. Experimental
2.1. Materials
Charcoal activated granulated carbon (pure), particle size 0.5–1.6 mm, was supplied by Riedel de Haën (Germany). Ferric chloride(FeCl3�6H2O) and anhydrous dipotassium phosphate (K2HPO4)were purchased from Merck (Germany), and KMnO4 from Fruta-rom (Israel). All chemicals were used as received and all solutionswere prepared with deionized (DI) water.
2.2. Synthesis of nFe-GAC
Charcoal granular activated carbon (GAC) was used as a supportfor the iron nanoparticles. GAC was pretreated with KMnO4, driedovernight at 100 �C, and then brought in contact with aqueous fer-ric chloride solution. Specifically 7.5 g of dried thoroughly washedGAC was mixed for 30 min at 200 rpm and 25 �C with 0.5 M KMnO4
solution in a glass Erlenmeyer flask. The mixing was followed byrepeated rinsing of the GAC with DI water until no purple colorwas observed. Treated GAC was dried overnight at 100 �C and thenmixed with FeCl3�6H2O solution (10 g/L (0.18 M) of total iron) for2 h at 200 rpm and 25 �C. After which, it was washed with DI waterin order to remove residual iron. Following the washing, the GACwas dried overnight at 100 �C. The iron capacity onto the GACwas calculated by the equation
qiron ¼VðC0 � CtÞ
M; ð1Þ
where qiron is the adsorbed iron (mg/g); V is the volume of the ironsolution (L); C0 and Ct are the iron initial and final concentrations,respectively (mg/L); M is the mass of GAC (g).
The iron concentration was measured using ContraAA� 700flame atomic absorbance (Analytik Jena, Germany) calibrated withiron standard solution (Merck, Germany).
2.3. Characterization of nFe-GAC
Images of synthesized nFe-GAC were obtained by using a high-resolution scanning electron microscope (HR-SEM) (Zeiss UltraPlus), with SE (AKA E-T) and In-lens energy selective backscattereddetectors. Mössbauer spectroscopy was used to identify and char-acterize iron oxides formed on the pretreated GAC. 57Fe Mössbauerspectra were recorded at both 90 K and room temperature (RT)using conventional nuclear spectroscopic instrumentation. 57Coin a rhodium matrix was used as a Mössbauer source. Isomer shiftswere measured relative to a-Fe. Surface area was obtained on aMonosorb surface analyzer (Quantchrome, USA) using 0.03 g ofsample.
2.3.1. Boehm titrationThe surface functional groups were determined according to the
method of Boehm [17]. The amount of 1.2 g of carbon was added to40 mL of 0.05 M of the following solutions: NaOH, Na2CO3,NaHCO3, and HCl, in polypropylene centrifuge tubes. The tubeswere sealed and mixed in a water bath for 24 h at 200 rpm and25 �C. Then, 20 mL of 0.05 M HCl was added to 10 mL aliquot from
the NaOH and NaHCO3 solutions. Thirty milliliters was added to10 mL of Na2CO3 solution. The excess of acid was titrated using0.05 M NaOH. Each titration was carried out three times with eachof the samples and each carbon (virgin and pretreated) was testedin triplicates as well. The amounts of the acidic groups was calcu-lated according to
nCSF mmolð Þ ¼ nHCl
nB½B�VB þ ½NaOH�VNaOH � ½HCl�VHClð ÞVB
Va; ð2Þ
where nCSF is moles of carbon surface functionalities; nHClnB
is the mo-lar ratio of acid to base in order to account for monoprotic vs. dip-rotic reaction bases; [B] and VB are the concentration and volume ofthe reaction base mixed with the carbon; Va is the volume of the ali-quot taken from VB; [HCl] and VHCl are the concentration and vol-ume of the acid added to the aliquot taken from the original sample.
The quantities of the acid surface groups (i.e., phenolic, lactonic,and carboxylic) were calculated through the difference in the cal-culated amount of surface functionality reacted (nCSF). NaOH reactswith all acid surface groups. Na2CO3 reacts with carboxyl and lac-tonic groups and NaHCO3 reacts only with carboxylic groups. Thenumber of basic surface groups was calculated from the amountof HCl having reacted with the carbon.
2.3.2. pHpZC
The point of zero charge, at which the pH of the carbon surfacehas a net neutral charge, was determined using the pH drift meth-od. The pH of a series of 40 mL 0.01 M NaCl solutions were adjusted(pH 2–11) using either NaOH or HCl, while purging CO2 with N2.0.12 g of carbon was added to the NaCl solutions in polypropylenecentrifuge tubes and capped immediately. The tubes were mixed ina water bath for 48 h at 200 rpm and 25 �C. The final pH (pHF) wasmeasured in each of the tubes after 48 h and plotted vs. the initialpH (pHI). The pHPZC was determined graphically at the intersectionof pHF and the line, pHF = �pHI.
2.4. Phosphate adsorption characterization
2.4.1. Mechanism and kinetics studyAn amount of 0.7 g nFe-GAC was added to a 50-mL
polypropylene centrifuge tube containing 35 mL of phosphatesolution at concentrations of 250, 500, and 1000 mg/L. Sampleswere shaken in a water bath for up to 13 days, at 25 �C. At regularintervals an aliquot of supernatant was sampled and phosphateconcentration was measured by a HACH DR2800 spectrophotome-ter using method 8048 (detection limit of 0.01 mg/L PO4) withPhosVer 3 reagent powder pillows.
Each experiment was repeated in duplicates and the mean val-ues are reported. Control experiments were conducted at the sameprocedure described above using pretreated carbon (i.e., withoutimpregnation of iron).
It is important to note that the phosphate concentrations stud-ied are well above those found in polluted water. This is due to theextremely high adsorption capacity of the synthesized nFe-GAC,which allowed accurate evaluation of the adsorption kinetics onlyby using high phosphate concentrations.
2.4.2. IsothermsAdsorption isotherms were obtained by adding various
amounts of nFe-GAC (5–40 g/L) to 35 mL of 500 mg/L phosphatesolution. After 24 h of mixing at pH of 6.3 (which is the pH of phos-phate in DI water) and 25 �C, the solution was collected and ana-lyzed for phosphate content.
2.4.3. Reversibility of phosphate adsorptionAfter adsorption of phosphate solution at different concentra-
tions of 250, 500, 1000 mg/L onto 20 g/L nFe-GAC for 24 h, the

442 A. Zach-Maor et al. / Journal of Colloid and Interface Science 357 (2011) 440–446
phosphate-loaded adsorbent was separated and washed with DIwater to remove residual phosphate solution. After which it wasmixed with 50 mL of DI (pH 5–6) for 24 h at 25 �C. Then the aque-ous solution was analyzed for phosphate content.
3. Results and discussion
3.1. Characterization of nFe-GAC
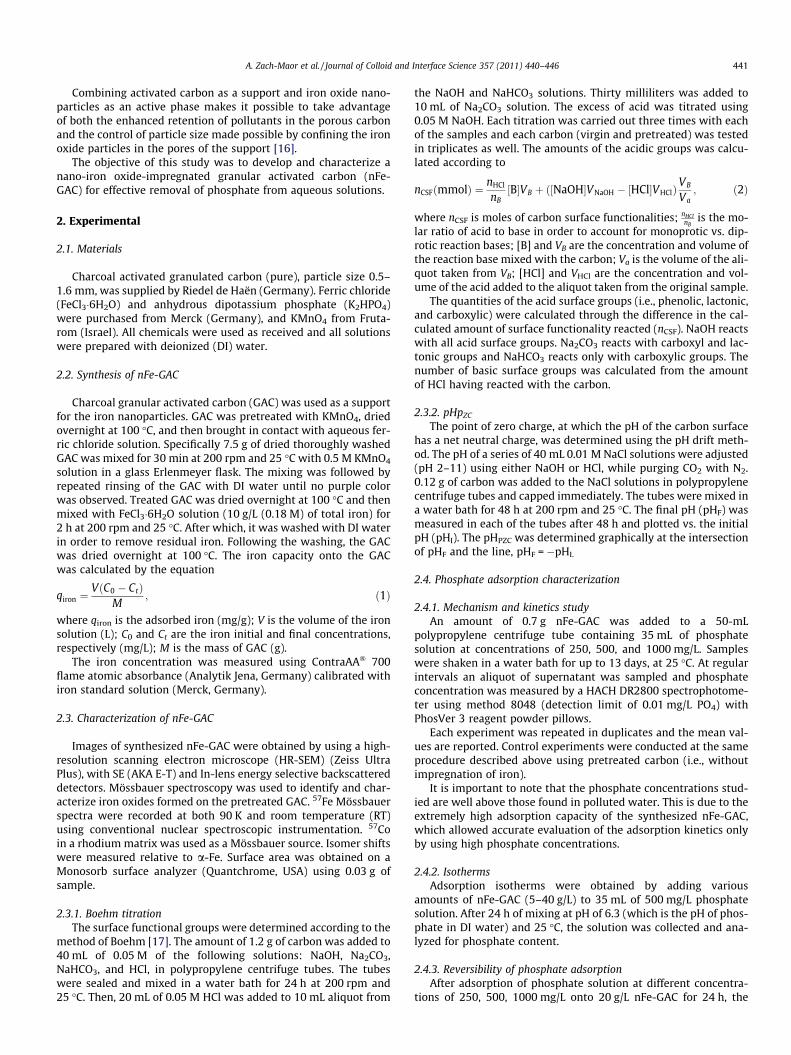
Charcoal granular activated carbon was oxidized chemically byKMnO4 and then impregnated with iron, resulting in iron capacityof 33.9 ± 3.6 mg iron/g GAC (average value based on 20 repeti-tions). HR-SEM micrograph of the synthesized nFe-GAC is shownin Fig. 1A. Surface area topography is quite shallow and GAC por-ous nature was exchanged with a sponge-like texture that coversthe whole grain. GAC grain appears to be completely covered withiron. It is hard to distinguish between the iron particles probablydue to their very small size or their adherence pattern in layers.Mössbauer spectra of the nFe-GAC, Fig. 1B, indicated that the dom-inating oxide population is of magnetite. The sample was almost100% paramagnetic at RT and 61% at 86 K (Table 1), suggesting verysmall iron oxide particles. When comparing the results toPolikarpov et al. [18] it seems that the impregnated particles havean average size significantly below 4 nm.
Table 2 represents the quantity of functional groups and the pHat point of zero charge of virgin and pretreated carbons. Followingthe pretreatment the GAC became more basic as indicated by theincrease in the pHPZC from 7.4 to 9.2 (Fig. 2). Higher numbers ofphenolic surface groups were formed following pretreatment andmore conspicuously the basic groups were augmented by 6-fold.A proposed mechanism for formation of magnetite onto KMnO4
preoxidized GAC is given by the following reactions:
AC� þ Fe3þ ! ACþ Fe2þ; ð3Þ
2Fe2þ þMnO2ðsÞ þ 2H2O ! 2FeOOHðsÞ þMn2þ þ 2Hþ; ð4Þ
2FeOOHðsÞ þ Fe2þ ! Fe3O4ðsÞ þ 2Hþ: ð5Þ
During the pretreatment in alkaline media, KMnO4 is reducedby the activated carbon to insoluble MnO2 which impregnatesthe sorbent surface [19]. Ferric iron is reduced to ferrous iron bythe negatively charged pretreated carbon (pHPZC = 9.2) which actsas an electron donor (Eq. (3)). The reaction of the manganesedioxide with ferrous ions (Eq. (4)) results in ferric (hydr)oxideprecipitate [20] which under alkaline conditions (pH > 8) and atroom temperature further react to form magnetite [21] (Eq. (5)).
Fig. 1. HR-SEM images (A) and Mössbauer sp
The impregnation of the nanomagnetite particles onto the GACwas found to be irreversible in phosphate aqueous solution at pHof 6.3 (i.e., no leaching of iron was detected). BET results showedreduction in GAC surface area following pretreatment, from 1454to 866 m2/g, and an increase of 20% in its surface area followingiron loading (from 866 to 1024 m2/g). While magnetite itself isnonporous, iron oxides layers were reported to be porous [21].The results described above imply that a homogeneous porousoxide layer consisting of very small magnetite nanoparticles wasformed on the pretreated GAC surface.
3.2. Phosphate adsorption by the magnetite nanoparticles
Generally, as seen in Fig. 3, the kinetics of phosphate adsorptionby nFe-GAC included two steps: a fast initial sorption followed by amuch slower adsorption process. With no pH adjustment resultingin pH 6.3, approximately 50% and 70% of phosphate were removed(from initial concentration of 500 mg/L) within the first 1 and 3 h,respectively. The rapid adsorption was followed by a slower sorp-tion which continued for more than 10 days, in which an additional15% of phosphate was removed. Phosphate sorption onto iron oxi-des is usually characterized by a two-step differential adsorptionrates, which last hours and even days [21], as evident from theexperimental data shown in Fig. 3. Since the slow adsorption stagelasted days, with a relatively minor additional phosphate removal,it was decided to conduct further kinetics experiments up to300 min.
In order to truly evaluate the role of magnetite nanoparticles inthe adsorption of phosphate, KMnO4-pretreated GAC (i.e., withoutiron loading) was tested for phosphate removal. Results indicatedthat the pretreated GAC was inert to the adsorption process (datanot shown). Therefore, the amount of phosphate adsorbed ontothe nFe-GAC was calculated using Eq. (1), where qphosphate is the ad-sorbed phosphate (mg PO4/g Fe); C0 and Ct are the phosphate initialand final concentrations, respectively (mg/L); M is the mass of theiron adsorbent – nFe (g).
3.3. Effect of adsorbent dosage
The amount of phosphate adsorbed onto the nFe-GAC at varyinginitial concentrations of phosphate is presented in Fig. 4. Theadsorption of PO4 onto nFe-GAC increased with time up to60 min and then slower adsorption was observed. The fast adsorp-tion duration was independent of the initial phosphate concentra-tion. However, the total amount of adsorbed phosphate increasedfrom 256 to 579 mg PO4/g Fe with augmentation of the initialphosphate concentration from 250 to 1000 mg/L, respectively. This
ectra at 86 K and RT (B) of the nFe-GAC.

Table 157Fe Mössbauer parameters at different temperatures, calculated for nFe-GAC.
Site (subspectrum) Temp. (K) Int.a (%) ISb (mm/s) ec (mm/s) Heff (kOe) Component
1 86 30 0.53 �0.16 4402 7 0.28 �0 2543 61 0.47 0.39 0 Fe3O4
4 2 1.25 1.43 01 297 100 0.36 0.35 0 Fe3O4
a Int., relative abundance (spectral area).b IS, isomer shift relative to a-iron metal at RT.c e = 1=4e2qQ ½(3cos(h)2 � 1)/2, where h is the angle between the hyperfine field Heff and the major axis of the electric field gradient. The quadrupole splitting of the
doublets is ½e2qQ. Errors are for Int. ±2%, for IS ±0.03 mm/s, for e ±0.03 mm/s, and for Heff ±5 kOe.
Table 2Amount of surface functional groups (mmol/g) and point of zero charge of virgin and pretreated carbons.
GAC type Carboxylic Lactonic Phenolic Basic Acid pHPZC
Virgin 0 0.16 ± 0.029 0.18 ± 0.059 0.26 ± 0.023 0.35 ± 0.012 7.4Pretreated 0 0.04 ± 0.006 0.48 ± 0.023 1.54 ± 0.029 0.52 ± 0.018 9.2
0
2
4
6
8
10
12
14
0 1 2 3 4 5 6 7 8 9 10 11 12
Fina
l pH
Initial pH
VirginPre-treatedIron loaded
Fig. 2. pH drift method to determine the point of zero charge (pHPZC).
0.0
0.2
0.4
0.6
0.8
1.0
0 50 100 150 200 250 300
C/C
0
Time (min)
0.1
0.2
0.3
1 3 5 7 9 11 13Time (day)
Fig. 3. Phosphate adsorption by the nFe-GAC with time at pH 6.3, [PO4]0 = 500 mg/L, and 25 �C. The inset shows the adsorption on a day scale.
0
100
200
300
400
500
600
0 40 80 120 160 200
q t(m
g PO
4/g F
e)
Time (min)
Fig. 4. Effect of contact time on the adsorption of PO4 onto nFe-GAC at variousinitial concentrations of phosphate (�) 250, (j) 500, (N) 1000 mg/L; pH 6.3 and25 �C.
02468
1012141618
0 200 400 600 800 1000
Phos
phat
e de
sorp
tion
(%)
Initial PO4 concentration (mg/L)
Fig. 5. Percentage of phosphate desorption by DI water as function of the initial PO4
concentration.
A. Zach-Maor et al. / Journal of Colloid and Interface Science 357 (2011) 440–446 443
is probably due to a decrease in the adsorption rate with the in-crease in the initial phosphate concentration. This latter observa-tion is quite straightforward due to the increase in driving forcefor mass transfer [22]. The lines in Fig. 4 are smooth and continu-ous, suggesting the possibility of monolayer adsorption of phos-phate onto the nFe-GAC surface [23].
3.4. Reversibility of phosphate adsorption
Phosphate adsorption onto iron oxides is regarded to be partlyirreversible [21]. Reversibility of phosphate adsorption, in DI water
(pH 5–6), was examined following adsorption at varying initialphosphate concentrations. A linear correlation was found betweenthe initial phosphate concentration and the percentage of the des-orbed phosphate (Fig. 5), with a maximum of 16.5% desorptionafter 24 h. Based on the adsorption analysis, which indicated twodistinct stages of adsorption (i.e., fast and slow adsorption), it couldbe postulated that phosphate ions which diffused into the porous

0
0.1
0.2
0.3
0.4
0.5
0.6
0.7
0.8
t/qt (
min
g F
e/m
g PO
4)
Time (min)
A
0
100
200
300
400
500
600
0 40 80 120 160 200
0 2 4 6 8 10 12 14
q t(m
g PO
4/g F
e)
t0.5 (min)
I
IIB
Fig. 6. Pseudo-second (A) and intraparticle diffusion (B) kinetic models foradsorption of PO4 by nFe-GAC at different initial concentrations of phosphate (�)250, (j) 500, (N) 1000 mg/L, pH 6.3 and 25 �C.
444 A. Zach-Maor et al. / Journal of Colloid and Interface Science 357 (2011) 440–446
nanomagnetite layer were strongly bounded; hence, its adsorptioncould be regarded as irreversible for 24 h. However, phosphate ionswhich were adhered only onto the nFe-GAC surface could be re-moved and their concentration was a direct result of the soluteconcentration with which it came in contact.
3.5. Adsorption kinetics
The experimental data were fitted with the linearized form ofthree kinetic models; pseudo first order, Eq. (6) [1], pseudo-second-order, Eq. (7) [22], and Elovich Eq. (8) [24], as follows
logðqe � qtÞ ¼ log qe �k1
2:303t; ð6Þ
tqt¼ 1
k2q2eþ 1
qet; ð7Þ
qt ¼1b
lnðabÞ þ 1b
ln t; ð8Þ
where k1 (1/min) and k2 (mg/g min) are the first-order and second-order rate constants of adsorption, respectively; qe (mg/g) is theequilibrium adsorption capacity; qt (mg/g) is the adsorption at timet (min); a is the initial adsorption rate (mg/g min); b is the adsorp-tion constant (g/mg). All the kinetics parameters were determinedfrom the slopes and the intercepts of respective plots and are sum-marized in Table 3.
Adsorption of phosphate onto the nFe-GAC was best describedby the pseudo-second-order model, as shown in Fig. 6A (r2 � 1.0)for all three initial phosphate concentrations tested. These resultscorrespond well with recently published data concerning thekinetics of phosphate adsorption onto metal oxide adsorbents inaqueous solutions, reporting the highest correlations for the pseu-do-second-order model [1,3,25,26]. However, the absolute adsorp-tion capacities, obtained in this research, are much higher.
3.6. Adsorption mechanism
Intraparticle diffusion/transport process is often regarded as therate-limiting step in most adsorption processes. The intraparticlediffusion varies with square root of time as shown in Eq. (9) [3]
qt ¼ Kintt0:5; ð9Þ
where qt is the amount adsorbed at time t (mg/g), t is the time(min), and Kint is the intraparticle diffusion rate constant (mg/g min0.5). A plot of qt vs. t0.5 showed two separate regions with dif-ferent slopes (Fig. 6B). Region I of the plot reflects film diffusion (D1)while region II, which illustrates a less steep slope, stands for thediffusion within the adsorbent (D2). Kint presented in Table 4 wascalculated from the slope of region II.
Assuming magnetite nanoparticles to be sphere of radius ‘a’ andthe diffusion follows Fick’s law, for short times the relationship be-tween weight uptake and time is given by Eq. (10) [23]
qt
qe¼ 6
D1
pa2
� �0:5
� t0:5: ð10Þ
Table 3Kinetics models parameters for the adsorption of phosphate to nFe-GAC (te = 210 min).
C0 (mg/L) qe (mg/g) Pseudo first order Pseudo-second-order
q1 (mg/g) k1 (1/min) � 10�2 r2 q2 (mg/g) k2 (g/mg m
250 256.1 223.8 1.08 0.873 277.8 0.207500 400.6 333.2 0.83 0.966 434.8 0.096
1000 578.8 477.4 0.57 0.825 588.2 0.196
D1 is calculated from the slope of the plot qt/qe vs. t0.5 as shownin Fig. 7A. For longer times, the relation between weight uptakeand diffusion equation is given by Eq. (11)
ln 1� qt
qe
� �¼ ln
6p2 �
D2p2
a2 t� �
: ð11Þ
D2 is calculated from the slope of the plot of ln(1 � qt/qe) vs. t asshown in Fig. 7B. The large negative exponential value for both D1
((3.3–3.9) � 10�17 cm2/s) and D2 ((2.0–2.3) � 10�16 cm2/s) did notvary with the augmentation of the initial concentration. However,D1 values are an order of magnitude smaller than D2 values, indi-cating that the phosphate adsorption onto the magnetite nanopar-ticles layer is governed by diffusion within the nanometric porousstructure [22,23,27,28]. Hence, the mechanism for removal ofphosphate by adsorption onto magnetite nanoparticles (i.e., adsor-bent) may be assumed to involve four different consecutive steps:(1) migration of phosphate ions from bulk of the solution to thesurface of the adsorbent; (2) diffusion of phosphate ions throughthe boundary layer to the surface of the adsorbent; (3) adsorptionof phosphate at an active site on the magnetite surface; (4)intraparticle diffusion of phosphate into the interior pores of themagnetite layer, which was found to be the rate-limiting step.
Elovich Intraparticle diffusion
in) � 10�3 r2 a (mg/g min) b (g/mg) r2 kint (mg/g min0.5) r2
0.999 63.4 0.023 0.957 7.8 0.9520.998 64.9 0.014 0.979 18.1 0.9770.996 176.0 0.010 0.974 19.0 0.829

Table 4Isotherm constants for adsorption of phosphate onto nFe-GAC.
Langmuir Fraundlich Sips
qm (mg/g) b (L/mg) r2 n k2 (mg/g) r2 K (mg/L) b r2
476.2 0.053 0.999 10.75 0.748 0.919 0.762 0.837 0.892
0.00.10.20.30.40.50.60.70.80.91.0
0 5 10 15 20
q t/q
e
t0.5 (min)
-2.5
-2.0
-1.5
-1.0
-0.5
0.0
0 50 100 150 200 250 300
ln(1
-qt/q
e)
t (min)
B
A
Fig. 7. Determination of diffusion coefficients D1 (A) and D2 (B) at different initialconcentrations of phosphate (�) 250, (j) 500, (N) 1000 mg/L, pH 6.3 and 25 �C.
0
100
200
300
400
500
0 100 200 300 400 500 600
q e(m
g PO
4/g F
e)
Ce (mg/L)
Experimental
Langmuir
Experimental
Langmuir
Fig. 8. Langmuir adsorption isotherm of phosphate by nFe-GAC pH 6.3, 25 �C,[PO4]0 = 500 mg/L, nFe-GAC concentrations ranging from 5 to 40 g/L. Operatinglines for initial phosphate concentrations of (j) 250, (N) 500 mg/L.
A. Zach-Maor et al. / Journal of Colloid and Interface Science 357 (2011) 440–446 445
3.7. Adsorption isotherms
The relationship between adsorbed ion concentration and itsconcentration in the solution at equilibrium is described byisotherm models, and the Langmuir, Fraundlich, and Langmuir–Freundlich (Sips) are the most widely referred models [8,22,29–31]. The calculated constants for these three models are reportedin Table 4.
Inspection of the regression coefficients proved that the correla-tion of Langmuir model, shown in Fig. 8, was stronger with respectto both Freunlich and Sips. The Langmuir isotherm model is repre-sentative of monolayer adsorption occurring on an energeticallyuniform surface on which the adsorbed molecules are notinteractive. Thus, equilibrium is attained once the monolayer iscompletely saturated [22,27]. For equilibrium phosphate concen-trations above 250 mg/L a maximum adsorbed capacity of435 mg/g Fe was reached (corresponding to 1.1 mol PO4/molFe3O4). Therefore, a linear increase at high phosphate concentra-tion was not observed, suggesting that a phosphate monolayerwas adsorbed onto the magnetite layer surface. The same adsorp-tion pattern on suspended magnetite nanoparticles in aqueoussolutions was found and characterized by Dadou et al. [32].
Fig. 8 also shows the operating line which was generated from theslop of the solution volume vs. the adsorbent mass (Eq. (1)). Theequilibrium adsorption capacity (qcal = 433 mg/g) was obtainedfrom the intersection of the extended operating line with the Lang-muir isotherm boundary. The results showed excellent agreement
with the equilibrium adsorption capacity (q2 = 435 mg/g) calculatedby the pseudo-second-order model (Table 3). This phosphateadsorption capacity was found to be much higher (by at least two or-ders of magnitude) than the adsorption capacities of other adsor-bents used for phosphate removal ranging from 8.2 to 65 mg/g[3,15].
4. Conclusions
Oxidation pretreatment of charcoal granular activated carbon,using potassium permanganate, resulted in a porous magnetitenanoparticle (<4 nm) layer covering completely the GAC grains.The iron impregnation was found to be irreversible with averagecapacity of 33.9 ± 3.6 mg Fe/g GAC. Phosphate was adsorbed onlyonto the magnetite nanoparticles as the pretreated GAC was foundinert to the process.
Batch adsorption experiments revealed high efficiency of phos-phate removal, by the newly developed nanoadsorbent, attainingmaximum adsorption capacity of 435 mg PO4/g Fe (correspondingto 1.1 mol PO4/mol Fe3O4). This adsorption capacity of the nFe-GACwas found to be much higher than the efficiency of other phos-phate adsorbents. Reversibility of the phosphate adsorption wasevident, exhibiting a linear increase, up to 16.5%, with the augmen-tation of the phosphate initial concentration. Phosphate adsorptionkinetics followed two steps: initially PO4 was adsorbed by the ac-tive sites on the magnetite surface, and then it diffused into theinterior pores of the nanomagnetite layer. The latter was foundto be the rate-determining step of the process. The relationship be-tween kinetics and isotherms parameters was quantitatively eval-uated, indicating that pseudo-second-order kinetics and Langmuirisotherm model best described the phosphate adsorption onto thenFe-GAC. Excellent agreement was found between the intraparticlediffusion model and the characterized properties of synthesizednFe-GAC.
Acknowledgment
The authors thank Prof. Israel Nowik from the Racah Institute ofPhysics, The Hebrew University, for his kind professional help inconducting the Mössbauer spectroscopy and analyzing the results.

446 A. Zach-Maor et al. / Journal of Colloid and Interface Science 357 (2011) 440–446
References
[1] M. Özacar, J. Hazard. Mater. 137 (2006) 218.[2] E. Oguz, A. Gurses, M. Yalcin, Water Air Soil Pollut. 148 (2003) 279.[3] Y. Mezenner, A. Bensmaili, Chem. Eng. J. 147 (2009) 87.[4] J. Antelo, M. Avena, S. Fiol, R. Lopez, F. Arce, J. Colloid Interface Sci. 285 (2005)
476.[5] R. Chitrakar, S. Tezuka, A. Sonoda, K. Sakanek, K. Ooi, T. Hirotsu, J. Colloid
Interface Sci. 298 (2006) 602.[6] L. Zeng, X. Li, J. Liu, Water Res. 38 (2004) 1318.[7] K. Fytianos, E. Voudrias, N. Raikos, Environ. Pollut. 101 (1998) 123.[8] Z. Gu, J. Fang, B. Deng, Environ. Sci. Technol. 39 (2005) 3833.[9] W. Chen, R. Parette, J. Zou, F.S. Cannon, B.A. Dempsey, Water Res. 41 (2007)
1851.[10] P. Mondal, C.B. Majumder, B. Mohanty, J. Hazard. Mater. 150 (2008) 695.[11] P. Mondal, B. Mohanty, C.B. Majumder, N. Bhandari, AIChE J. 55 (2009) 1860.[12] R.L. Vaughan, B.E. Reed, Water Res. 39 (2005) 1005.[13] R. Goel, S.K. Kapoor, K. Misra, R.K. Sarma, Indian J. Chem. Technol. 11 (2004)
518.[14] A. Violante, M. Pigna, Soil Sci. Soc. Am. J. 66 (2002) 1788.[15] M. Ernst, A. Sperlich, X. Zheng, Y. Gan, J. Hu, X. Zhao, J. Wang, M. Jekel,
Desalination 202 (2007) 293.[16] C. Xu, A.S. Teja, Appl. Catal. A 348 (2008) 251.
[17] S.L. Goertzen, K.D. Theriault, A.M. Oickle, A.C. Tarasuk H.A. Andreas, Carbon 48(2010) 1252.
[18] M.A. Polikarpov, V.M. Cherepanov, M.A. Chuev, S.Y. Shishkov, S.S. Yakimov, in:International Conference on the Applications of the Mossbauer Effect, Vienna,2009, p. 45.
[19] E. Okoniewska, J. Lach, M. Kacprzak, E. Neczaj, Desalination 223 (2008) 256.[20] K.D. Hristovski, P.K. Westerhoff, T. Möller, P. Sylvester, Chem. Eng. J. 146
(2009) 237.[21] R.M. Cornell, U. Schwertmann, The Iron Oxides: Structure, Properties,
Reactions, Occurrences and Uses, Wiley VCH, New York, 2003.[22] Y.A. Adyin, N.D. Aksoy, Chem. Eng. J. 151 (2009) 188.[23] T. Karthikeyan, S. Rajgopal, L.R. Miranda, J. Hazard. Mater. 124 (2005) 192.[24] F.C. Wu, R.L. Tseng, R.S. Juang, Chem. Eng. J. 150 (2009) 366.[25] S. Yao, J. Li, Z. Shi, Ads. Sci. Technol. 27 (2009) 603.[26] Q.Y. Yue, W.Y. Wang, B.Y. Gao, X.J. Zhang, Q. Li, Water Environ. Res. 82 (2010)
374.[27] T.S. Singh, K.K. Pant, Sep. Purif. Technol. 36 (2004) 139.[28] H. Zhu, Y. Jia, X.W.H. Wang, J. Hazard. Mater. 172 (2009) 1591.[29] K. Hristovski, P. Westerhoff, T. Möller, P. Sylvester, W. Condit, H. Mash, J.
Hazard. Mater. 152 (2008) 397.[30] T.S. Anirudhan, P.G. Radhakrishnan, Desalination 249 (2009) 1298.[31] S.P. Dubey, K. Gopal, J. Hazard. Mater. 145 (2007) 465.[32] T.J. Dadou, S. Begin-Colin, J.M. Grenèche, F. Thomas, A. Derory, P. Bernhardt, P.
Legaré, G. Pourroy, Chem. Mater. 19 (2007) 4494.