synthesis of novel yttrium-doped graphene oxide nanocomposite for dye removal
TRANSCRIPT
This is an Accepted Manuscript which has been through the Royal Society of Chemistry peer review process and has been accepted for publication
Accepted Manuscripts are published online shortly after acceptance before technical editing formatting and proof reading Using this free service authors can make their results available to the community in citable form before we publish the edited article We will replace this Accepted Manuscript with the edited and formatted Advance Article as soon as it is available
You can find more information about Accepted Manuscripts in the Information for Authors
Please note that technical editing may introduce minor changes to the text andor graphics which may alter content The journalrsquos standard Terms amp Conditions and the Ethical guidelines still apply In no event shall the Royal Society of Chemistry be held responsible for any errors or omissions in this Accepted Manuscript or any consequences arising from the use of any information it contains
Accepted Manuscript
Journal of Materials Chemistry A
wwwrscorgmaterialsA
View Article OnlineView Journal
This article can be cited before page numbers have been issued to do this please use Y ZHANG S
Yuan Y Zhao H Wang and C He J Mater Chem A 2014 DOI 101039C4TA01057D
Graphical abstract
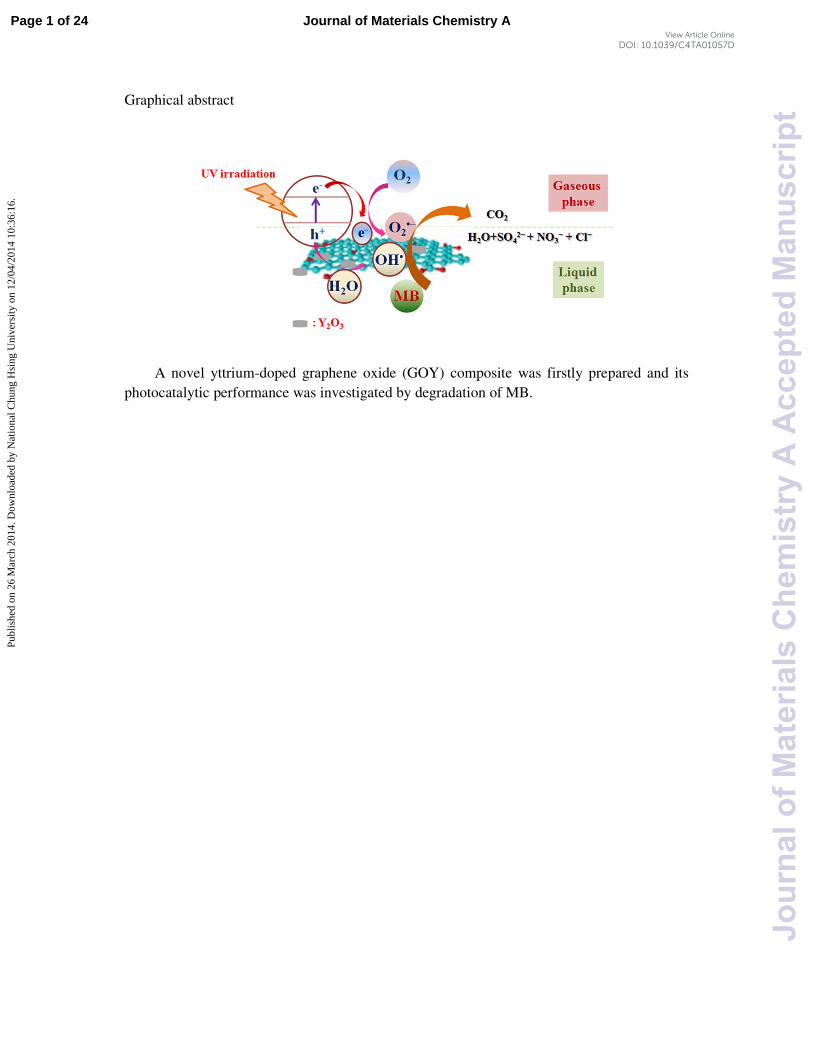
A novel yttrium-doped graphene oxide (GOY) composite was firstly prepared and its
photocatalytic performance was investigated by degradation of MB
Page 1 of 24 Journal of Materials Chemistry A
Jour
nalo
fMat
eria
lsC
hem
istr
yA
Acc
epte
dM
anus
crip
t
Publ
ishe
d on
26
Mar
ch 2
014
Dow
nloa
ded
by N
atio
nal C
hung
Hsi
ng U
nive
rsity
on
120
420
14 1
036
16
View Article OnlineDOI 101039C4TA01057D
1
Synthesis of novel Yttrium-doped graphene oxide nanocomposite 1
for dye removal 2
Ya Zhang1
Saisai Yuan2 Yanhua Zhao
1 Honggui Wang
1 Chenda He
1 3
1 Jiangsu Key Laboratory of Environmental Material and Engineering School of Environmental Science 4
and Engineering Yangzhou University Yangzhou 225127 PR China 5
2 School of Chemistry and Chemical Engineering Yangzhou University Yangzhou 225009 PR China 6
7
ABSTRACT 8
A novel yttrium-doped graphene oxide (GOY) composite was prepared by hydrothermal 9
method The morphology results showed that the graphene oxide (GO) can successfully 10
composite with yttrium and the as-prepared GOY had a nanoflake structure From the 11
photoelectrochemical analysis and photoluminescence (PL) spectra the primary role of GO 12
in Y2O3 was confirmed as an electron conductor enhancing the photocurrent density As 13
expected the as-obtained GOY composites had better photocatalytic performance on 14
decomposition of methylene blue molecules than bare GO and Y2O3 The 5 GOY (10 mg) 15
could degrade MB (25 ppm) thoroughly (~100 ) within 10 min which was quite 16
comparable with the commercial TiO2 P25 under UV irradiation A possible 17
mechanism of photocatalysis was also been presented 18
19
Keywords Yttrium-doped graphene oxide Methylene blue Ultraviolet light Photocatalyst 20
21
1 Introduction 22
Nowadays the growing population has led to the increasing contamination of surface 23
and ground water Organic dyes used in textile and food industries are one of the important 24
sources of the environmental contaminations due to their non-biodegradability and high 25
toxicity to aquatic creatures and carcinogenic effects on humans12
Semiconductor 26
photocatalysis has been extensively studied as a viable water treatment method34
27
Photocatalyst which accelerates light-driven chemical reactions has been paid a great 28
Corresponding author Tel +86-514-87979528 E-mail address zhangyayzueducn (Y Zhang) hcdyzueducn (CD
He)
Page 2 of 24Journal of Materials Chemistry A
Jour
nalo
fMat
eria
lsC
hem
istr
yA
Acc
epte
dM
anus
crip
t
Publ
ishe
d on
26
Mar
ch 2
014
Dow
nloa
ded
by N
atio
nal C
hung
Hsi
ng U
nive
rsity
on
120
420
14 1
036
16
View Article OnlineDOI 101039C4TA01057D
2
attention due to fascinating properties such as quantum confinement and enhanced reactivity5 1
Up to date diverse photocatalytic materials have been introduced including TiO2 ZnO 2
Fe3O4 SnO2 and BiVO43 6-10
Graphene oxide (GO) a two-dimensional sheet of sp2
3
hybridized carbon composing of only carbon oxygen and hydrogen has a high specific 4
surface area and tunable electronic structure11ndash13
Due to its extraordinary physical properties 5
high chemical and thermal stability graphene has been receiving recent attention as a support 6
for catalysts13-15
Recently a TiO2 nanorod-decorated graphene sheets has been prepared by 7
Jang and coworkers14
This nanocomposite had highly efficient photocatalytic activities under 8
visible-light irradiation Wang et al has reported a high-performance and recyclable 9
visible-light photocatalysis cobalt ferrite and graphene composite15
The spontaneous 10
exfoliated GO as an auxiliary co-catalyst has been reported that it can remarkably enhanced 11
the photocatalytic hydrogen production of TiO216
Although graphene has shown potential 12
applications in water treatment as a photocatalyst further optimization or modification of the 13
GO structure is still necessary for enhancing its photocatalytic activity 14
Impurity doping with proper oxidation state is useful for red shifting the absorption edge 15
as well as reducing the rate of electron-hole pairrsquos recombination which improves the 16
photocatalytic activity of a photocatalyst41718
It is reported that yttrium doping in TiO2 gives 17
improved photocatalytic response attributed to the visible light absorption electron-hole 18
pairrsquos separation higher interfacial charge transfer lower crystallite size and high specific 19
surface area419-21
This property enhances the performance of Y-based catalysts used in 20
wastewater treatment 21
In this work a novel yttrium-doped GO (GOY) was firstly synthesized via hydrothermal 22
method with different GO doping concentration The as-synthesized samples were 23
characterized by XRD FT-IR FESEM HRTEM and XPS The corresponding photocatalytic 24
activity was evaluated by measuring the photocatalytic degradation of methylene blue (MB) 25
and methlene orange (MO) degradation under UV irradiation A possible 26
mechanism of photocatalysis was also been presented based on the results of 27
photoelectrochemical analysis and PL spectra 28
29
30
Page 3 of 24 Journal of Materials Chemistry A
Jour
nalo
fMat
eria
lsC
hem
istr
yA
Acc
epte
dM
anus
crip
t
Publ
ishe
d on
26
Mar
ch 2
014
Dow
nloa
ded
by N
atio
nal C
hung
Hsi
ng U
nive
rsity
on
120
420
14 1
036
16
View Article OnlineDOI 101039C4TA01057D
3
2 Experimental 1
Yttrium (III) nitrate hexahydrate (Y(NO3)3middot6H2O) polyvinylpyrrolidone ((C6H9NO)n) 2
ethanol graphite NaCl H2SO4 H2O2 P2O5 and K2S2O7 were purchased from Sinopharm 3
Chemical Reagent Company TiO2 P25 was obtained from Evonik Industries All the reagents 4
were of analytical grade and used as received without further treatment All solutions were 5
prepared with DI water 6
21 Preparation of Y2O3 and GO Y2O3 composite catalysts 7
GO was prepared via a modified Hummer method as reported previously22
In a typical 8
synthesis procedure 0776 g Yttrium (III) nitrate hexahydrate (Y(NO3)3middot6H2O) 0223g 9
polyvinylpyrrolidone ((C6H9NO)n) and certain amounts of GO were dissolved in a 7 mL DI 10
water and 33 mL ethanol Then the solution dissolved under magnetic stirring The obtained 11
transparent solution was transferred into a 50 mL polytetrafluoroethylene (PTFE) 12
(Teflon)-lined steel autoclaves and heated at 180 oC for 16 h After cooling to ambient 13
temperature the precipitate was centrifuged washed several times with ethanol and dried at 14
60 oC in an oven As a control experiment Y2O3 nanoparticles were prepared under the same 15
conditions without adding GO The Y-doped GO composite containing 5 10 20 and 50 mg 16
GO are denoted as 5 GOY 10 GOY 20 GOY and 50 GOY respectively 17
22 Characterization 18
The X-ray diffraction (XRD) patterns were obtained by a Bruker D8 advance X-ray 19
diffractometer using monochromatic Cu Kα radiation (λ = 15406 Aring) with an accelerating 20
voltage of 40 kV and current of 40 mA The 2θ range used in the measurement was from 10 21
to 70 The FT-IR spectra of the samples were measured on a Cary 610670 microscope 22
(Varian US) with scanning from 4000 to 400 cm-1
by using KBr pellets under ambient 23
temperature Thermogravimetric analysis (TGA) was performed with a PE Pyris-1 instrument 24
at a heating rate of 10 oC min
-1 under N2 atmosphere Field emission scanning electron 25
microscopy (FESEM) was examined on a field-emission scanning electron microanalyzer 26
(Hitachi S-4800 Japan) Energy dispersive X-ray spectroscopy (EDX) was performed on a 27
XL-30ESEM scanning electron microscopy High-resolution transmission electron 28
microscopy (HRTEM) was recorded on a Tecnai G2 F30 S-TWIN transmission electron 29
microscopes X-ray photoelectron spectroscopy (XPS) measurements were carried out with 30
Page 4 of 24Journal of Materials Chemistry A
Jour
nalo
fMat
eria
lsC
hem
istr
yA
Acc
epte
dM
anus
crip
t
Publ
ishe
d on
26
Mar
ch 2
014
Dow
nloa
ded
by N
atio
nal C
hung
Hsi
ng U
nive
rsity
on
120
420
14 1
036
16
View Article OnlineDOI 101039C4TA01057D
4
an ESCALAB 250 photoelectron spectrometer using Al Kα radiation (Thermo-VG Scientific 1
US) The photoluminescence (PL) spectra were measured with a JY HRD double grating 2
monochromator at room temperature 3
23 Degradation of methylene blue (MB) and methylene orange (MO) 4
Photocatalysis experiments were carried out in a BL-GHX-V photochemical reactor 5
(Shanghai Bilon Instrument Co Ltd) The UV source (λ lt 420 nm) was provided by a 500 W 6
high-pressure mercury lamp Reactor and UV source were surrounded by a circulating water 7
jacket to maintain constant temperature UV irradiation photocatalytic activities of GO Y2O3 8
and GOY composite were evaluated through the degradation of MB and MO 9
A stock solution of MB (or MO) at 1000 ppm was prepared using DI water In a typical 10
run 005 g of photocatalyst was dispersed in a 20 mL MB (or MO) (25 ppm) Then the 11
suspension was stirred for 30 min in the dark to ensure adsorptiondesorption equilibrium 12
before light illumination At each specific sampling time aqueous sample was withdrawn by 13
a 5 mL syringe and filtered immediately by a 022 μm filter film to remove the catalyst 14
particles before analysis All experiments were repeated at least two times and averages were 15
reported The concentration of MB (or MO) was then determined by measuring the 16
absorbance at λmax 600 nm via UV-vis spectrophotometer To determine the catalytic 17
recycling properties the catalyst was separated after reaction for 30 min and washed 18
thoroughly with ultrapure water and ethanol followed by drying at 60 oC for 12 h in vacuum 19
oven Finally the catalyst was separated by magnet and redispersed in a new reaction system 20
for subsequent catalytic experiments under the same reaction conditions The reduction ratio 21
of MB (or MO) was calculated using the following expression 22
Degradation ratio of MB = times100 23
where A0 and At were the absorbance intensities when illuminated for 0 (that is just after the 24
dark adsorption) and t min respectively 25
24 Photoelectrochemical Measurements 26
All photoelectrochemical characteristics were performed in the electrolytic cell 27
consisted of a GO Y2O3 or GOY composites (2 mg mL-1 100 μL) coated FTO glass working 28
electrode (2cm2cm) a platinum wire counter electrode and a saturated calomel reference 29
Page 5 of 24 Journal of Materials Chemistry A
Jour
nalo
fMat
eria
lsC
hem
istr
yA
Acc
epte
dM
anus
crip
t
Publ
ishe
d on
26
Mar
ch 2
014
Dow
nloa
ded
by N
atio
nal C
hung
Hsi
ng U
nive
rsity
on
120
420
14 1
036
16
View Article OnlineDOI 101039C4TA01057D
5
electrode (SCE) on a Model CHI 660E electrochemical workstation under a 500 W 1
high-pressure mercury lamp irradiation 2
3
3 Results and discussion 4
31 FT-IR spectra XRD and TGA Analysis 5
FT-IR measurement is employed to investigate the bonding interactions in GO before 6
and after the oxidation process FT-IR spectra of GO Y2O3 and 5 GOY are shown in Fig 1 7
In the spectrum of GO the peak at about 1721 cm-1
is attributed to the stretching vibrations of 8
C=O The peaks appear at about 1223 and 1564 cm-1
correspond to the stretching vibrations 9
of C-O and C=C respectively23
The FT-IR spectra of Y2O3 and 5 GOY composite have 10
similar curve shape while a new peak appears at 1550 cm-1
of 5 GOY This result indicates 11
the GO has successfully composited with Y2O3 12
Fig 2 shows the crystal structure of GO Y2O3 and 5 GOY composite GO shows a 13
sharp peak at 2θ = 105o corresponding to the (001) reflection of graphite oxide
152425 The 14
diffraction peaks observed at 2θ = 421deg originate from disorderedly stacked GO sheets26
The 15
peaks located at 198deg 286deg 351deg 501deg 494deg and 512deg (2θ) result from the presence of 16
Y2O3 which are in agreement with the theoretical data of hematite (JCPDS No 41-0015)2728
17
In the pattern of 5 GOY the presence of diffraction peak at 2θ of 421deg indicating that GO 18
exists in the composite material It should be noted that there is a diffraction peak observed at 19
2θ = 101deg on both patterns of Y2O3 and 5 GOY which originates from intermediate YO(OH) 20
structure27
21
Fig 3 presents results of TGA analysis of the as-synthesized GO Y2O3 and 5 GOY 22
composite powder The samples were heated from room temperature to 600 degC at 5 degC min-1
23
under N2 flow As can be seen in Fig3 GO starts to lose mass upon heating even below 24
100 degC The major mass loss occurs at about 200 degC is caused by pyrolysis of the 25
oxygen-containing functional groups generating CO CO2 and stream29-31
Y2O3 and 5 GOY 26
have the same shape and show mass losses at three temperature ~100 320 and 400 degC The 27
first mass loss at about 100 degC is related to dehydration of free and physically absorbed 28
molecular water The next mass loss at about 320 degC is supposed to be related with the first 29
dehydration of chemisorbed and combined water from Y(OH)33233
The third mass loss at 30
Page 6 of 24Journal of Materials Chemistry A
Jour
nalo
fMat
eria
lsC
hem
istr
yA
Acc
epte
dM
anus
crip
t
Publ
ishe
d on
26
Mar
ch 2
014
Dow
nloa
ded
by N
atio
nal C
hung
Hsi
ng U
nive
rsity
on
120
420
14 1
036
16
View Article OnlineDOI 101039C4TA01057D
6
about 400 degC confirms dehydration of structural water from YOOH phase34
1
32 Morphology Characterization 2
The morphology of the as-obtained samples are examined by FESEM It can be 3
observed in Fig 4A that the as-prepared Y2O3 illustrates a uniform flake-like shape with 4
irregular edges Its lateral size ranges from 70 to 150 nm and thickness is around 10 to 20 nm 5
It can be observed that the prepared graphene oxide illustrates the flake-like shape and 6
layer-layer structure of graphene oxide edges (Fig 4B) Fig 4C and D displays the 7
morphologies of 5 GOY and 20 GOY composites respectively As can be seen with GO 8
content increasing the flake-like structure becomes irregular At the same time GO and Y2O3 9
aggregate The EDX profile (Fig 4D insert) exhibits strong carbon oxygen and yttrium peaks 10
Fig 4E and F exhibit HRTEM images of the GOY composite As shown in Fig 4E and F the 11
lattice fringes of Y2O3 nanocrystals and GO are simultaneously observed indicating strong 12
interactions between Y and the GO support The resolved lattice fringes of (111) planes (d = 13
031 nm) are attributed to GO and the lattice fringes of (111) planes (d = 027 nm) are 14
assigned to Y2O3 nanocrystals 15
33 XPS analysis 16
Fig 5A shows the XPS full survey spectra in the binding energy range of 0-1100 eV for 17
GO Y2O3 5 GOY and 20 GOY composite As shown in Fig 5A all the samples contain C 18
and O however the Y-contained samples show two peaks at about 1582 eV and 1600 eV 19
which are attributed to Y6 Fig 5B-D shows the high-resolution XPS regional spectra of Y 3d 20
O 1s and C 1s for 5 GOY respectively The relatively strong peaks at 1581 eV and 1599 eV 21
can be attributed to Y 3d52 and Y 3d32 respectively (Fig 5B) These results are in agreement 22
with values of Y2O3 reported in the literature35
It is well reported that yttrium retards the 23
combination of photogenerated electron-hole pairs41718
this may be due to the presence of 24
extra hydroxyl species to delay recombination through hole trapping6 Three kinds of surface 25
oxygen species could be distinguished in the O 1s spectra as shown in Fig 5C The binding 26
energy of 5309 eV 5318 and 5330 eV are ascribed to the lattice oxygen the hydroxyl 27
groups and the C-OH respectively36
As shown in Fig 5D the XPS spectrum of C 1s from 5 28
GOY is collected which can be deconvoluted into four peaks sp2 bonded carbon at 2848 eV 29
(CndashC) epoxyhydroxyls at 2860 eV (CndashO) carbonyls at 2879 eV (C=O) and carboxyls at 30
Page 7 of 24 Journal of Materials Chemistry A
Jour
nalo
fMat
eria
lsC
hem
istr
yA
Acc
epte
dM
anus
crip
t
Publ
ishe
d on
26
Mar
ch 2
014
Dow
nloa
ded
by N
atio
nal C
hung
Hsi
ng U
nive
rsity
on
120
420
14 1
036
16
View Article OnlineDOI 101039C4TA01057D
7
2891 eV (OndashC=O) indicating the high percentage of oxygen-contained functional groups37
1
Chemisorbed surface hydroxyl groups can enhance photocatalysis by trapping photoinduced 2
holes resulting in an increase in the formation of highly oxidizing OH radicals38
3
34 Photocatalytic Activity for dye degradation 4
For comparative purposes the photodegradation efficiencies of MB and MO mediated 5
by the different photocatalysts under UV irradiation are shown in Fig 6 Before comparison 6
the adsorption and photodegradation performances of GO Y2O3 and 5 GOY on MB were 7
investigated (Fig S1) As displayed in Fig S1 both Y2O3 and 5 GOY have good adsorption 8
affinity to MB After stirring for 30 min under dark about 80 MB could be absorbed by 9
Y2O3 and 5 GOY which is much better than GO (lower than 20) After photocatalysis for 10
35min MB can be degraded thoroughly by 5 GOY Then the photocatalytic activities of the 11
GO Y2O3 5 GOY 10 GOY 20 GOY and 50 GOY composite photocatalysts were compared 12
via the reduction of MB and MO under ambient temperature Photodegradation time is 35 13
min It has been reported that a large surface area helps to increase the photocatalytic reaction 14
sites39
From the O1s spectrum of Y2O3 (Fig S2 supplementary material) the oxygen 15
composition of Y2O3 and 5 GOY samples at different states (Table S1 supplementary 16
material) more OH radicals are available in 5 GOY As expected under UV irradiation the 17
degradation of MB is slower than 10 with a GO photocatalyst However the conversion of 18
MB reaches 95 after 35 min when using Y2O3 as a photocatalyst The four kinds of GOY 19
samples exhibite better photocatalytic properties in the degradation of MB than bare GO and 20
Y2O3 under UV irradiation Moreover with increasing the amount of GO the degradation of 21
MB increases slowly Considering the simplicity and economy of the MB degradation 5 22
GOY is selected as the photocatalyst in the following experiments The photocatalytic 23
activities of 5 GOY was compared with commercial TiO2 P25 (Fig S3 supplementary 24
material) indicating the photocatalytic property of 5 GOY was quite comparable with P25 25
The GOY composites also have photocatalytic activities to MO As can be seen in Fig 6 GO 26
has good affinity to MO and the 50 GOY has best degradation efficiency to MO among the 27
GOY composites 28
The photocatalyst dosage may affect the MB degradation efficiency Fig 7A illustrates 29
MB degradation at varying photocatalyst dosages (5 to 10 mg) MB degradation efficiency 30
Page 8 of 24Journal of Materials Chemistry A
Jour
nalo
fMat
eria
lsC
hem
istr
yA
Acc
epte
dM
anus
crip
t
Publ
ishe
d on
26
Mar
ch 2
014
Dow
nloa
ded
by N
atio
nal C
hung
Hsi
ng U
nive
rsity
on
120
420
14 1
036
16
View Article OnlineDOI 101039C4TA01057D
8
increases with increasing the contact time In addition with increasing the dosage the MB 1
degradation efficiency slowly increases As displayed in Fig 7A the best dosage is 10 mg 2
As the MB concentration may also influence degradation MB degradation under various 3
concentration of MB is investigated It can be seen clearly in Fig 7B that MB conversion 4
efficiency is as much as 100 after degradation for 35 min when the MB concentration is 5
lower than 25 mg L-1
The conversion efficiency will decrease when the MB concentration is 6
higher than 275 mg L-1
The final conversion efficiency will no more than 90 if 300 mg 7
L-1
MB solution is used 8
Because the solution pH can remarkably influence MB degradation the effect of initial 9
pH on the degradation of MB with 5 GOY catalyst is determined as presented in Fig 7C As 10
shown in Fig 7C the conversion of MB will finally reach 100 when the solution pH is 11
lower than 519 If the solution pH controlled at 63 the conversion efficiency will decrease 12
sharply and only 80 MB will convert after 35 min Therefore the solution pH is set at 41 13
35 Photocatalytic mechanism 14
The magnitude of the photocurrent represents the charge collection efficiency of the 15
electrode surface and indirectly indicates the separated efficiency of electron-hole pairs40
16
From the insert of Fig 8 5 GOY modified photoelectrode is prompted in generating 17
photocurrent under visible and UV-visible light GOY photoelectrodes yield the greater 18
photocurrent than Y2O3 photoelectrode under UV irradiation in Fig 8 19
Fig 9 shows the PL spectra of the Y2O3 and GOY photocatalysts With Y2O3 as 20
photocatalyst the PL signal centered around 450 nm is detected revealing that ∙OH radicals 21
are generated on the irradiated Y2O3 When GOY nanocomposites are used as the 22
photocatalysts the PL signal intensity is increased which suggests that the yield of ∙OH 23
radicals is enhanced on the irradiated GOY nanocomposite The enhancement in 24
photoactivity can be attributed to the remarkable synergistic effect of the combination of 25
Y2O3 and the GO sheets leading to the efficient separation of photogenerated carriers in the 26
Y2O3 and GO coupling system 27
It is well known that the photodegradation process of the photocatalysts is strongly 28
relative to electron-hole pairs generated by light irradiation on catalysts The photogenerated 29
electrons and holes can migrate to the surface of the catalysts and then can be trapped 30
Page 9 of 24 Journal of Materials Chemistry A
Jour
nalo
fMat
eria
lsC
hem
istr
yA
Acc
epte
dM
anus
crip
t
Publ
ishe
d on
26
Mar
ch 2
014
Dow
nloa
ded
by N
atio
nal C
hung
Hsi
ng U
nive
rsity
on
120
420
14 1
036
16
View Article OnlineDOI 101039C4TA01057D
9
generally by the oxygen and surface hydroxyls to ultimately produce hydroxyl radicals (middotOH) 1
that react with the adsorbed reactants41
As we know Y2O3 is n-type semiconductor with a 2
wide band gap about 56 eV42
To understand the charge separation process of Y2O3 and 3
GOYs the band edge positions of conduction band (CB) and valence band (VB) of 4
semiconductor Y2O3 has been calculated by the following equation43
5
EVB = X - Ee + 05Eg (1) 6
ECB = EVB - Eg (2) 7
where is the absolute electronegativity of the semiconductor e is the energy of free 8
electrons on the hydrogen scale (sim45 eV) and g is the bandgap energy of the 9
semiconductor The value of for Y2O3 is obtained by the arithmetic mean of the electron 10
affinity and the first ionization of the constituent atoms reported in the literatures44
to be 535 11
eV Thus the CB and VB potentials of Y2O3 are calculated to be -195 and 365 eV versus 12
normal hydrogen electrode (NHE) respectively It can be seen that the VB potential of 13
sample is more positive than the redox potential of OHminus∙OH (189 VNHE) indicating that 14
the photogenerated holes have strong oxidative ability and they can oxidize OHminus into ∙OH In 15
addition the CB potential of sample is negative enough to reduce O2 to O2∙ minus
(minus013 VNHE) 16
via eminus 17
Based on these results a possible mechanism for the photocatalytic is proposed as 18
follows and shown in Fig 10 19
Y2O3 + hν rarr Y2O3 (h+e) (3) 20
Y2O3 (e) + GO rarr Y2O3 + GO (e) (4) 21
GO (e) + O2 rarr GO + O2bullminus (5) 22
Y2O3 (h) + OHminus rarrY2O3 + OH
bull (6) 23
Y2O3 (h) + O2bullminus
+ OHbull + MB rarr CO2 +H2O+SO4
2minus + NO3
minus + Cl
minus (7) 24
25
4 Conclusions 26
In conclusion a novel GOY nanocomposite with different GO content has been obtained 27
via a one-step hydrothermal method The FT-IR XRD EDX and XPS results showed the 28
yttrium was successfully composited with GO The morphology characterization showed the 29
as-obtained GOY had nanoflake structure After stirring for 30 min under dark about 80 30
Page 10 of 24Journal of Materials Chemistry A
Jour
nalo
fMat
eria
lsC
hem
istr
yA
Acc
epte
dM
anus
crip
t
Publ
ishe
d on
26
Mar
ch 2
014
Dow
nloa
ded
by N
atio
nal C
hung
Hsi
ng U
nive
rsity
on
120
420
14 1
036
16
View Article OnlineDOI 101039C4TA01057D
10
MB could be absorbed by Y2O3 and 5 GOY The as-prepared GOY had good degradation 1
performance on both MB and MO under UV irradiation Compared with other GOY 2
composites 5 GOY had better photocatalytic activity to MB Factors such as dosages of 3
photocatalyst contaminant concentration and solution pH on MB conversion were also 4
investigated and discussed The catalyst also showed good stability and recyclability It is 5
expected that the GOY nanocomposite would be a potential candidate for treatment of dye 6
containing wastewater 7
8
Acknowledgments 9
This work was supported by the National Natural Science Foundation of China (No 10
21307104) Natural Science Foundation of Jiangsu Province China (NoBK20130438) the 11
Scientific Research Project of Environmental Fund of Yangzhou City (YHK1303) and 12
Jiangsu Key Laboratory of Environmental Material and Engineering (K12031) We thank the 13
Testing Center of Yangzhou University for sample characterization 14
15
Notes and References 16
1 B K Korbahti K Artut C Gecgel A Ozer Chem Eng J 2011 173 677-688 17
2 V K Gupta D Pathania S Agarwal P Singh J Hazard Mater 2012 243 179-186 18
3 N Wetchakun S Chaiwichain B Inceesungvorn K Pingmuang S Phanichphant A I 19
Minett J Chen ACS Appl Mater Interfaces 2012 4 3718-3723 20
4 Y F Li D Xu J I Oh W Shen X Li Y Yu ACS Catal 2012 2 391-398 21
5 M Khan W B Cao J Mol Catal A Chem 2013 376 71-77 22
6 Y F Wu Q J Zhang X F Yin H Q Cheng RSC Advances 2013 3 9670-9676 23
7 F H Chu C W Huang C L Hsin C W Wang S Y Yu P H Yeh W W Wu 24
Nanoscale 2012 4 1471-1475 25
8 L J Xu J L Wang Environ Sci Technol 2012 46 10145-10153 26
9 Y C Zhang J Li H Y Xu Appl Catal B 2012 123-124 18-26 27
10 S Usai S Obreg n A I Becerro G ol n J Phys Chem C 2013 117 24479-24484 28
11 A K Geim K S Novoselov Nat Mater 2007 6 183-191 29
12 K-Y Shin J-Y Hong J Jang Adv Mater 2011 23 2113-2118 30
Page 11 of 24 Journal of Materials Chemistry A
Jour
nalo
fMat
eria
lsC
hem
istr
yA
Acc
epte
dM
anus
crip
t
Publ
ishe
d on
26
Mar
ch 2
014
Dow
nloa
ded
by N
atio
nal C
hung
Hsi
ng U
nive
rsity
on
120
420
14 1
036
16
View Article OnlineDOI 101039C4TA01057D
11
13 G K Pradhan D K Padhi K M Parida ACS Appl Mater Interfaces 2013 5 1
9101-9110 2
14 E Lee J Y Hong H Kang J Jang J Hazard Mater 2012 219-220 13-18 3
15 Y S Fu H Q Chen X Q Sun X Wang Appl Catal B 2012 111-112 280-287 4
16 K Krishnamoorthy R Mohan S J Kim Appl Phys Lett 2011 98 244101 5
17 M Li J Zhang Y Zhang Chem Phys Lett 2012 527 63-66 6
18 F Meng J Li Z Hong M Zhi A Sakla C Xiang N Wu Catal Today 2013 199 7
48-52 8
19 H Zhang K Tan H Zheng Y Gu W F Zhang Mater Chem Phys 2011 125 9
156-160 10
20 X Niu S Li H Chu J Zhou J Rare Earths 2011 29 225-229 11
21 H Narayan H Alemu L Setofolo L Macheli ISRN Phys Chem 2012 841521 1-9 12
22 M J Allen V C Tung R B Kaner Chem Rev 2010 110 132-145 13
23 F Y Ban S R Majid N M Huang H N Lim Int J Electrochem Sci 2012 7 14
4345-4351 15
24 Y L Min G Q He Q J Xu Y C Chen J Mater Chem A 2014 2 1294-1301 16
25 W Fan W Gao C Zhang W W Tjiu J S Pan T X Liu J Mater Chem 2012 22 17
25108-25115 18
26 Z -S Wu W Ren L Wen L Gao J Zhao Z Chen G Zhou F Li H -M Cheng ACS 19
Nano 2010 4 3187-3194 20
27 J A Dorman Y B Mao J R Bargar J P Chang J Phys Chem C 2010 114 21
17422-17427 22
28 R P Ermakov VV Voronov P P Fedorov Nanosystems physics chemistry 23
mathematics 2013 4 (2) 196-205 24
29 A Lerf H He M Forster J Klinowski J Phys Chem B 1998102(23) 4477-4482 25
30 G Wang Z Yang X Li C Li Carbon 2005 43(12) 2564-2570 26
31 S Stankovich D A Dikin R D Piner K A Kohlhaas A Kleinhammes Y Y Jia Y 27
Wu S T Nguyen R S Ruoff Carbon 2007 45 1558-1565 28
32 M Aghazadeh A Nozad H Adelkhani M Ghaemi J Electrochem Soc 2010 157 29
D519-D522 30
Page 12 of 24Journal of Materials Chemistry A
Jour
nalo
fMat
eria
lsC
hem
istr
yA
Acc
epte
dM
anus
crip
t
Publ
ishe
d on
26
Mar
ch 2
014
Dow
nloa
ded
by N
atio
nal C
hung
Hsi
ng U
nive
rsity
on
120
420
14 1
036
16
View Article OnlineDOI 101039C4TA01057D
12
33 L Nan Y Kazumichi J Solid State Chem 2008 181 1738-1743 1
34 R Srinivasan N R Yogamalar J Elanchezhiyan R J Joseyphus A C Bose J Alloy 2
Compd 2010 496 472-477 3
35 S Somacescu J M C Moreno P Osiceanu B L Su V Parvulescu J Phys Chem C 4
2010 114 19365 5
36 J H Pan W I Lee Chem Mater 2006 18 847-853 6
37 Y Chen B H Song X S Tang L Lu J M Xue J Mater Chem 2012 22 7
17656-17662 8
38 J Xu Y Chang Y Zhang S Ma Y Qu C Xu Appl Surf Sci 2008 255 1996-1999 9
39 LP Zhu NC Bing LL Wang HY Jin GH Liao LJ Wang Dalton Trans 2012 41 10
2959-2965 11
40 Z Pei L Ding H Lin S Weng Z Zheng Y Hou P Liu J Mater Chem A 2013 1 12
10099-10102 13
41Y L Pan S Z Deng L Polavarapu N Y Gao P Y Yuan C H Sow Q H Xu 14
Langmuir 2012 28 12304-12310 15
42 P Rouffignac J S Park R G Gordon Chem Mater 2005 17 4808-4814 16
43 H Xu H Li C Wu J Chu Y Yan H Shu Z Gu J Hazard Mater 2008 153 17
877-880 18
44 T Andersen H K Haugen H Hotop J Phys Chem Ref Data 1999 28(6) 1511-1533 19
20
Page 13 of 24 Journal of Materials Chemistry A
Jour
nalo
fMat
eria
lsC
hem
istr
yA
Acc
epte
dM
anus
crip
t
Publ
ishe
d on
26
Mar
ch 2
014
Dow
nloa
ded
by N
atio
nal C
hung
Hsi
ng U
nive
rsity
on
120
420
14 1
036
16
View Article OnlineDOI 101039C4TA01057D
13
Figure captions 1
2
Figure 1 FT-IR spectra of GO Y2O3 and 5 GOY composites 3
Figure 2 XRD patterns of GO Y2O3 and 5 GOY composites 4
Figure 3 TGA curves of GO Y2O3 and 5 GOY composites 5
Figure 4 FESEM images of (A) Y2O3 (Insert low magnification) (B) GO (C) 5 GOY and 6
(D) 20 GOY composites (Insert EDS spectrum of 20 GOY sample) (E) and (F) 7
HRTEM images of 5 GOY taken after intense ultrasonic dispersion in ethanol for 30 8
min 9
Figure 5 XPS spectra (A) full survey spectra of GO Y2O3 and GOY nanocomposite (B) Y 10
3d of 5 GOY (C) O 1s of 5 GOY (D) C 1s of 5 GOY 11
Figure 6 Comparison of photodegradation efficiency using as-synthesized GO Y2O3 and 12
GOY composites 13
Figure 7 (A) Effect of dosage on MB conversion MB concentration 25 ppm pH = 41 (B) 14
Effect of MB concentration on the degradation Dosage 10 mg pH = 41 (C) Effect of 15
solution pH on MB conversion MB concentration 25 ppm Dosage 10 mg 16
Figure 8 Photocurrent responses of GO Y2O3 and 5 GOY photoelectrodes under UV 17
illumination Insert Photocurrent responses of 5 GOY under different illumination 18
conditions Scan rate 50 mVs The electrolyte solution was 05 M NaCl 19
Figure 9 PL spectra of Y2O3 5 GOY and 20 GOY samples (λex = 258 nm) 20
Figure 10 Proposed mechanism for the photodegradation of MB on GOY composite21
Page 14 of 24Journal of Materials Chemistry A
Jour
nalo
fMat
eria
lsC
hem
istr
yA
Acc
epte
dM
anus
crip
t
Publ
ishe
d on
26
Mar
ch 2
014
Dow
nloa
ded
by N
atio
nal C
hung
Hsi
ng U
nive
rsity
on
120
420
14 1
036
16
View Article OnlineDOI 101039C4TA01057D
14
Figure 1 1
2
3
4
500 1000 1500 2000 2500 3000 3500 4000
1657
Tra
ns
mit
tan
ce
Wavenumber cm-1
1657
1550
1564 17211223
1436
1436
GO
Y2O
3
5GOY
5
6
Page 15 of 24 Journal of Materials Chemistry A
Jour
nalo
fMat
eria
lsC
hem
istr
yA
Acc
epte
dM
anus
crip
t
Publ
ishe
d on
26
Mar
ch 2
014
Dow
nloa
ded
by N
atio
nal C
hung
Hsi
ng U
nive
rsity
on
120
420
14 1
036
16
View Article OnlineDOI 101039C4TA01057D
15
Figure 2 1
2
3
10 20 30 40 50 60 70
5GOY2O
3
Inte
ns
ity
a
u
2degree
GO
Y2O
3
4
5
6
Page 16 of 24Journal of Materials Chemistry A
Jour
nalo
fMat
eria
lsC
hem
istr
yA
Acc
epte
dM
anus
crip
t
Publ
ishe
d on
26
Mar
ch 2
014
Dow
nloa
ded
by N
atio
nal C
hung
Hsi
ng U
nive
rsity
on
120
420
14 1
036
16
View Article OnlineDOI 101039C4TA01057D
16
Figure 3 1
2
0 100 200 300 400 500 60040
50
60
70
80
90
100
5GOY
Y2O
3
GO
We
igh
t
Temperature oC
3
4
Page 17 of 24 Journal of Materials Chemistry A
Jour
nalo
fMat
eria
lsC
hem
istr
yA
Acc
epte
dM
anus
crip
t
Publ
ishe
d on
26
Mar
ch 2
014
Dow
nloa
ded
by N
atio
nal C
hung
Hsi
ng U
nive
rsity
on
120
420
14 1
036
16
View Article OnlineDOI 101039C4TA01057D
17
Figure 4 1
2
3
4
5
6
7
8
9
10
11
12
13
14
15
16
17
18
19
20
21
22
23
24
25
26
27
28
29
30
31
32
33
34
35
36
37
38
39
40
41
Page 18 of 24Journal of Materials Chemistry A
Jour
nalo
fMat
eria
lsC
hem
istr
yA
Acc
epte
dM
anus
crip
t
Publ
ishe
d on
26
Mar
ch 2
014
Dow
nloa
ded
by N
atio
nal C
hung
Hsi
ng U
nive
rsity
on
120
420
14 1
036
16
View Article OnlineDOI 101039C4TA01057D
18
Figure 5 1
2
3
1200 1000 800 600 400 200 0
Y 3d
C 1s
20 GOY
5 GOY
Y2O
3
Inte
ns
ity
a
u
Binding Energy eV
GO
O 1s
A
150 155 160 165 170 175
Inte
ns
ity
a
u
Binding Energy eV
Y 3d32
BY 3d
52
4
5
6
526 528 530 532 534 536
Inte
ns
ity
a
u
Binding Energy eV
O 1sC
282 284 286 288 290 292
Inte
ns
ity
a
u
Binding Energy eV
C-C
C-OC=O O-C=O
DC 1s
7
8
Page 19 of 24 Journal of Materials Chemistry A
Jour
nalo
fMat
eria
lsC
hem
istr
yA
Acc
epte
dM
anus
crip
t
Publ
ishe
d on
26
Mar
ch 2
014
Dow
nloa
ded
by N
atio
nal C
hung
Hsi
ng U
nive
rsity
on
120
420
14 1
036
16
View Article OnlineDOI 101039C4TA01057D
19
1
Figure 6 2
3
00
02
04
06
08
10
12
Y2O
3
20GOY
50GOY
10GOY
5GOYCo
nv
ers
ion
Photocatalysts
MO
MB
GO
4
5
6
7
8
Page 20 of 24Journal of Materials Chemistry A
Jour
nalo
fMat
eria
lsC
hem
istr
yA
Acc
epte
dM
anus
crip
t
Publ
ishe
d on
26
Mar
ch 2
014
Dow
nloa
ded
by N
atio
nal C
hung
Hsi
ng U
nive
rsity
on
120
420
14 1
036
16
View Article OnlineDOI 101039C4TA01057D
20
Figure 7 1
2
-5 0 5 10 15 20 25 30 35 40060
070
080
090
Co
nv
ers
ion
Time min
5 mg
6 mg
7 mg
8 mg
9 mg
10 mg
A100
-5 0 5 10 15 20 25 30 35 40
060
070
080
090
Co
nv
ers
ion
Time min
200 mg L-1
225 mg L-1
250 mg L-1
275 mg L-1
300 mg L-1
B100
3
4
-5 0 5 10 15 20 25 30 35 40
110
050
060
070
080
090
Co
nv
ers
ion
Time min
pH 303
pH 418
pH 519
pH 630
100
C
5
6
7
8
9
Page 21 of 24 Journal of Materials Chemistry A
Jour
nalo
fMat
eria
lsC
hem
istr
yA
Acc
epte
dM
anus
crip
t
Publ
ishe
d on
26
Mar
ch 2
014
Dow
nloa
ded
by N
atio
nal C
hung
Hsi
ng U
nive
rsity
on
120
420
14 1
036
16
View Article OnlineDOI 101039C4TA01057D
21
1
2
Figure 8 3
4
5
6
7
02 00 -02 -04
0
5
10
15
20j
A
cm
-2
E V (vs SCE)
Y2O
3
GO
5GOY
02 01 00 -01 -02 -0300
05
10
15
20
25
30
35
j A
cm
-2
E V (vs SCE)
Uv
Vis
Dark
5GOY
Page 22 of 24Journal of Materials Chemistry A
Jour
nalo
fMat
eria
lsC
hem
istr
yA
Acc
epte
dM
anus
crip
t
Publ
ishe
d on
26
Mar
ch 2
014
Dow
nloa
ded
by N
atio
nal C
hung
Hsi
ng U
nive
rsity
on
120
420
14 1
036
16
View Article OnlineDOI 101039C4TA01057D
22
1
2
Figure 9 3
4
400 450 500 550 600 650 700 750 800
Inte
ns
ity
a
u
Wavelength nm
20 GOY
5 GOY
Y2O
3
5
6
7
Page 23 of 24 Journal of Materials Chemistry A
Jour
nalo
fMat
eria
lsC
hem
istr
yA
Acc
epte
dM
anus
crip
t
Publ
ishe
d on
26
Mar
ch 2
014
Dow
nloa
ded
by N
atio
nal C
hung
Hsi
ng U
nive
rsity
on
120
420
14 1
036
16
View Article OnlineDOI 101039C4TA01057D
23
1
Figure 10 2
3
4
5
6
Page 24 of 24Journal of Materials Chemistry A
Jour
nalo
fMat
eria
lsC
hem
istr
yA
Acc
epte
dM
anus
crip
t
Publ
ishe
d on
26
Mar
ch 2
014
Dow
nloa
ded
by N
atio
nal C
hung
Hsi
ng U
nive
rsity
on
120
420
14 1
036
16
View Article OnlineDOI 101039C4TA01057D
Graphical abstract
A novel yttrium-doped graphene oxide (GOY) composite was firstly prepared and its
photocatalytic performance was investigated by degradation of MB
Page 1 of 24 Journal of Materials Chemistry A
Jour
nalo
fMat
eria
lsC
hem
istr
yA
Acc
epte
dM
anus
crip
t
Publ
ishe
d on
26
Mar
ch 2
014
Dow
nloa
ded
by N
atio
nal C
hung
Hsi
ng U
nive
rsity
on
120
420
14 1
036
16
View Article OnlineDOI 101039C4TA01057D
1
Synthesis of novel Yttrium-doped graphene oxide nanocomposite 1
for dye removal 2
Ya Zhang1
Saisai Yuan2 Yanhua Zhao
1 Honggui Wang
1 Chenda He
1 3
1 Jiangsu Key Laboratory of Environmental Material and Engineering School of Environmental Science 4
and Engineering Yangzhou University Yangzhou 225127 PR China 5
2 School of Chemistry and Chemical Engineering Yangzhou University Yangzhou 225009 PR China 6
7
ABSTRACT 8
A novel yttrium-doped graphene oxide (GOY) composite was prepared by hydrothermal 9
method The morphology results showed that the graphene oxide (GO) can successfully 10
composite with yttrium and the as-prepared GOY had a nanoflake structure From the 11
photoelectrochemical analysis and photoluminescence (PL) spectra the primary role of GO 12
in Y2O3 was confirmed as an electron conductor enhancing the photocurrent density As 13
expected the as-obtained GOY composites had better photocatalytic performance on 14
decomposition of methylene blue molecules than bare GO and Y2O3 The 5 GOY (10 mg) 15
could degrade MB (25 ppm) thoroughly (~100 ) within 10 min which was quite 16
comparable with the commercial TiO2 P25 under UV irradiation A possible 17
mechanism of photocatalysis was also been presented 18
19
Keywords Yttrium-doped graphene oxide Methylene blue Ultraviolet light Photocatalyst 20
21
1 Introduction 22
Nowadays the growing population has led to the increasing contamination of surface 23
and ground water Organic dyes used in textile and food industries are one of the important 24
sources of the environmental contaminations due to their non-biodegradability and high 25
toxicity to aquatic creatures and carcinogenic effects on humans12
Semiconductor 26
photocatalysis has been extensively studied as a viable water treatment method34
27
Photocatalyst which accelerates light-driven chemical reactions has been paid a great 28
Corresponding author Tel +86-514-87979528 E-mail address zhangyayzueducn (Y Zhang) hcdyzueducn (CD
He)
Page 2 of 24Journal of Materials Chemistry A
Jour
nalo
fMat
eria
lsC
hem
istr
yA
Acc
epte
dM
anus
crip
t
Publ
ishe
d on
26
Mar
ch 2
014
Dow
nloa
ded
by N
atio
nal C
hung
Hsi
ng U
nive
rsity
on
120
420
14 1
036
16
View Article OnlineDOI 101039C4TA01057D
2
attention due to fascinating properties such as quantum confinement and enhanced reactivity5 1
Up to date diverse photocatalytic materials have been introduced including TiO2 ZnO 2
Fe3O4 SnO2 and BiVO43 6-10
Graphene oxide (GO) a two-dimensional sheet of sp2
3
hybridized carbon composing of only carbon oxygen and hydrogen has a high specific 4
surface area and tunable electronic structure11ndash13
Due to its extraordinary physical properties 5
high chemical and thermal stability graphene has been receiving recent attention as a support 6
for catalysts13-15
Recently a TiO2 nanorod-decorated graphene sheets has been prepared by 7
Jang and coworkers14
This nanocomposite had highly efficient photocatalytic activities under 8
visible-light irradiation Wang et al has reported a high-performance and recyclable 9
visible-light photocatalysis cobalt ferrite and graphene composite15
The spontaneous 10
exfoliated GO as an auxiliary co-catalyst has been reported that it can remarkably enhanced 11
the photocatalytic hydrogen production of TiO216
Although graphene has shown potential 12
applications in water treatment as a photocatalyst further optimization or modification of the 13
GO structure is still necessary for enhancing its photocatalytic activity 14
Impurity doping with proper oxidation state is useful for red shifting the absorption edge 15
as well as reducing the rate of electron-hole pairrsquos recombination which improves the 16
photocatalytic activity of a photocatalyst41718
It is reported that yttrium doping in TiO2 gives 17
improved photocatalytic response attributed to the visible light absorption electron-hole 18
pairrsquos separation higher interfacial charge transfer lower crystallite size and high specific 19
surface area419-21
This property enhances the performance of Y-based catalysts used in 20
wastewater treatment 21
In this work a novel yttrium-doped GO (GOY) was firstly synthesized via hydrothermal 22
method with different GO doping concentration The as-synthesized samples were 23
characterized by XRD FT-IR FESEM HRTEM and XPS The corresponding photocatalytic 24
activity was evaluated by measuring the photocatalytic degradation of methylene blue (MB) 25
and methlene orange (MO) degradation under UV irradiation A possible 26
mechanism of photocatalysis was also been presented based on the results of 27
photoelectrochemical analysis and PL spectra 28
29
30
Page 3 of 24 Journal of Materials Chemistry A
Jour
nalo
fMat
eria
lsC
hem
istr
yA
Acc
epte
dM
anus
crip
t
Publ
ishe
d on
26
Mar
ch 2
014
Dow
nloa
ded
by N
atio
nal C
hung
Hsi
ng U
nive
rsity
on
120
420
14 1
036
16
View Article OnlineDOI 101039C4TA01057D
3
2 Experimental 1
Yttrium (III) nitrate hexahydrate (Y(NO3)3middot6H2O) polyvinylpyrrolidone ((C6H9NO)n) 2
ethanol graphite NaCl H2SO4 H2O2 P2O5 and K2S2O7 were purchased from Sinopharm 3
Chemical Reagent Company TiO2 P25 was obtained from Evonik Industries All the reagents 4
were of analytical grade and used as received without further treatment All solutions were 5
prepared with DI water 6
21 Preparation of Y2O3 and GO Y2O3 composite catalysts 7
GO was prepared via a modified Hummer method as reported previously22
In a typical 8
synthesis procedure 0776 g Yttrium (III) nitrate hexahydrate (Y(NO3)3middot6H2O) 0223g 9
polyvinylpyrrolidone ((C6H9NO)n) and certain amounts of GO were dissolved in a 7 mL DI 10
water and 33 mL ethanol Then the solution dissolved under magnetic stirring The obtained 11
transparent solution was transferred into a 50 mL polytetrafluoroethylene (PTFE) 12
(Teflon)-lined steel autoclaves and heated at 180 oC for 16 h After cooling to ambient 13
temperature the precipitate was centrifuged washed several times with ethanol and dried at 14
60 oC in an oven As a control experiment Y2O3 nanoparticles were prepared under the same 15
conditions without adding GO The Y-doped GO composite containing 5 10 20 and 50 mg 16
GO are denoted as 5 GOY 10 GOY 20 GOY and 50 GOY respectively 17
22 Characterization 18
The X-ray diffraction (XRD) patterns were obtained by a Bruker D8 advance X-ray 19
diffractometer using monochromatic Cu Kα radiation (λ = 15406 Aring) with an accelerating 20
voltage of 40 kV and current of 40 mA The 2θ range used in the measurement was from 10 21
to 70 The FT-IR spectra of the samples were measured on a Cary 610670 microscope 22
(Varian US) with scanning from 4000 to 400 cm-1
by using KBr pellets under ambient 23
temperature Thermogravimetric analysis (TGA) was performed with a PE Pyris-1 instrument 24
at a heating rate of 10 oC min
-1 under N2 atmosphere Field emission scanning electron 25
microscopy (FESEM) was examined on a field-emission scanning electron microanalyzer 26
(Hitachi S-4800 Japan) Energy dispersive X-ray spectroscopy (EDX) was performed on a 27
XL-30ESEM scanning electron microscopy High-resolution transmission electron 28
microscopy (HRTEM) was recorded on a Tecnai G2 F30 S-TWIN transmission electron 29
microscopes X-ray photoelectron spectroscopy (XPS) measurements were carried out with 30
Page 4 of 24Journal of Materials Chemistry A
Jour
nalo
fMat
eria
lsC
hem
istr
yA
Acc
epte
dM
anus
crip
t
Publ
ishe
d on
26
Mar
ch 2
014
Dow
nloa
ded
by N
atio
nal C
hung
Hsi
ng U
nive
rsity
on
120
420
14 1
036
16
View Article OnlineDOI 101039C4TA01057D
4
an ESCALAB 250 photoelectron spectrometer using Al Kα radiation (Thermo-VG Scientific 1
US) The photoluminescence (PL) spectra were measured with a JY HRD double grating 2
monochromator at room temperature 3
23 Degradation of methylene blue (MB) and methylene orange (MO) 4
Photocatalysis experiments were carried out in a BL-GHX-V photochemical reactor 5
(Shanghai Bilon Instrument Co Ltd) The UV source (λ lt 420 nm) was provided by a 500 W 6
high-pressure mercury lamp Reactor and UV source were surrounded by a circulating water 7
jacket to maintain constant temperature UV irradiation photocatalytic activities of GO Y2O3 8
and GOY composite were evaluated through the degradation of MB and MO 9
A stock solution of MB (or MO) at 1000 ppm was prepared using DI water In a typical 10
run 005 g of photocatalyst was dispersed in a 20 mL MB (or MO) (25 ppm) Then the 11
suspension was stirred for 30 min in the dark to ensure adsorptiondesorption equilibrium 12
before light illumination At each specific sampling time aqueous sample was withdrawn by 13
a 5 mL syringe and filtered immediately by a 022 μm filter film to remove the catalyst 14
particles before analysis All experiments were repeated at least two times and averages were 15
reported The concentration of MB (or MO) was then determined by measuring the 16
absorbance at λmax 600 nm via UV-vis spectrophotometer To determine the catalytic 17
recycling properties the catalyst was separated after reaction for 30 min and washed 18
thoroughly with ultrapure water and ethanol followed by drying at 60 oC for 12 h in vacuum 19
oven Finally the catalyst was separated by magnet and redispersed in a new reaction system 20
for subsequent catalytic experiments under the same reaction conditions The reduction ratio 21
of MB (or MO) was calculated using the following expression 22
Degradation ratio of MB = times100 23
where A0 and At were the absorbance intensities when illuminated for 0 (that is just after the 24
dark adsorption) and t min respectively 25
24 Photoelectrochemical Measurements 26
All photoelectrochemical characteristics were performed in the electrolytic cell 27
consisted of a GO Y2O3 or GOY composites (2 mg mL-1 100 μL) coated FTO glass working 28
electrode (2cm2cm) a platinum wire counter electrode and a saturated calomel reference 29
Page 5 of 24 Journal of Materials Chemistry A
Jour
nalo
fMat
eria
lsC
hem
istr
yA
Acc
epte
dM
anus
crip
t
Publ
ishe
d on
26
Mar
ch 2
014
Dow
nloa
ded
by N
atio
nal C
hung
Hsi
ng U
nive
rsity
on
120
420
14 1
036
16
View Article OnlineDOI 101039C4TA01057D
5
electrode (SCE) on a Model CHI 660E electrochemical workstation under a 500 W 1
high-pressure mercury lamp irradiation 2
3
3 Results and discussion 4
31 FT-IR spectra XRD and TGA Analysis 5
FT-IR measurement is employed to investigate the bonding interactions in GO before 6
and after the oxidation process FT-IR spectra of GO Y2O3 and 5 GOY are shown in Fig 1 7
In the spectrum of GO the peak at about 1721 cm-1
is attributed to the stretching vibrations of 8
C=O The peaks appear at about 1223 and 1564 cm-1
correspond to the stretching vibrations 9
of C-O and C=C respectively23
The FT-IR spectra of Y2O3 and 5 GOY composite have 10
similar curve shape while a new peak appears at 1550 cm-1
of 5 GOY This result indicates 11
the GO has successfully composited with Y2O3 12
Fig 2 shows the crystal structure of GO Y2O3 and 5 GOY composite GO shows a 13
sharp peak at 2θ = 105o corresponding to the (001) reflection of graphite oxide
152425 The 14
diffraction peaks observed at 2θ = 421deg originate from disorderedly stacked GO sheets26
The 15
peaks located at 198deg 286deg 351deg 501deg 494deg and 512deg (2θ) result from the presence of 16
Y2O3 which are in agreement with the theoretical data of hematite (JCPDS No 41-0015)2728
17
In the pattern of 5 GOY the presence of diffraction peak at 2θ of 421deg indicating that GO 18
exists in the composite material It should be noted that there is a diffraction peak observed at 19
2θ = 101deg on both patterns of Y2O3 and 5 GOY which originates from intermediate YO(OH) 20
structure27
21
Fig 3 presents results of TGA analysis of the as-synthesized GO Y2O3 and 5 GOY 22
composite powder The samples were heated from room temperature to 600 degC at 5 degC min-1
23
under N2 flow As can be seen in Fig3 GO starts to lose mass upon heating even below 24
100 degC The major mass loss occurs at about 200 degC is caused by pyrolysis of the 25
oxygen-containing functional groups generating CO CO2 and stream29-31
Y2O3 and 5 GOY 26
have the same shape and show mass losses at three temperature ~100 320 and 400 degC The 27
first mass loss at about 100 degC is related to dehydration of free and physically absorbed 28
molecular water The next mass loss at about 320 degC is supposed to be related with the first 29
dehydration of chemisorbed and combined water from Y(OH)33233
The third mass loss at 30
Page 6 of 24Journal of Materials Chemistry A
Jour
nalo
fMat
eria
lsC
hem
istr
yA
Acc
epte
dM
anus
crip
t
Publ
ishe
d on
26
Mar
ch 2
014
Dow
nloa
ded
by N
atio
nal C
hung
Hsi
ng U
nive
rsity
on
120
420
14 1
036
16
View Article OnlineDOI 101039C4TA01057D
6
about 400 degC confirms dehydration of structural water from YOOH phase34
1
32 Morphology Characterization 2
The morphology of the as-obtained samples are examined by FESEM It can be 3
observed in Fig 4A that the as-prepared Y2O3 illustrates a uniform flake-like shape with 4
irregular edges Its lateral size ranges from 70 to 150 nm and thickness is around 10 to 20 nm 5
It can be observed that the prepared graphene oxide illustrates the flake-like shape and 6
layer-layer structure of graphene oxide edges (Fig 4B) Fig 4C and D displays the 7
morphologies of 5 GOY and 20 GOY composites respectively As can be seen with GO 8
content increasing the flake-like structure becomes irregular At the same time GO and Y2O3 9
aggregate The EDX profile (Fig 4D insert) exhibits strong carbon oxygen and yttrium peaks 10
Fig 4E and F exhibit HRTEM images of the GOY composite As shown in Fig 4E and F the 11
lattice fringes of Y2O3 nanocrystals and GO are simultaneously observed indicating strong 12
interactions between Y and the GO support The resolved lattice fringes of (111) planes (d = 13
031 nm) are attributed to GO and the lattice fringes of (111) planes (d = 027 nm) are 14
assigned to Y2O3 nanocrystals 15
33 XPS analysis 16
Fig 5A shows the XPS full survey spectra in the binding energy range of 0-1100 eV for 17
GO Y2O3 5 GOY and 20 GOY composite As shown in Fig 5A all the samples contain C 18
and O however the Y-contained samples show two peaks at about 1582 eV and 1600 eV 19
which are attributed to Y6 Fig 5B-D shows the high-resolution XPS regional spectra of Y 3d 20
O 1s and C 1s for 5 GOY respectively The relatively strong peaks at 1581 eV and 1599 eV 21
can be attributed to Y 3d52 and Y 3d32 respectively (Fig 5B) These results are in agreement 22
with values of Y2O3 reported in the literature35
It is well reported that yttrium retards the 23
combination of photogenerated electron-hole pairs41718
this may be due to the presence of 24
extra hydroxyl species to delay recombination through hole trapping6 Three kinds of surface 25
oxygen species could be distinguished in the O 1s spectra as shown in Fig 5C The binding 26
energy of 5309 eV 5318 and 5330 eV are ascribed to the lattice oxygen the hydroxyl 27
groups and the C-OH respectively36
As shown in Fig 5D the XPS spectrum of C 1s from 5 28
GOY is collected which can be deconvoluted into four peaks sp2 bonded carbon at 2848 eV 29
(CndashC) epoxyhydroxyls at 2860 eV (CndashO) carbonyls at 2879 eV (C=O) and carboxyls at 30
Page 7 of 24 Journal of Materials Chemistry A
Jour
nalo
fMat
eria
lsC
hem
istr
yA
Acc
epte
dM
anus
crip
t
Publ
ishe
d on
26
Mar
ch 2
014
Dow
nloa
ded
by N
atio
nal C
hung
Hsi
ng U
nive
rsity
on
120
420
14 1
036
16
View Article OnlineDOI 101039C4TA01057D
7
2891 eV (OndashC=O) indicating the high percentage of oxygen-contained functional groups37
1
Chemisorbed surface hydroxyl groups can enhance photocatalysis by trapping photoinduced 2
holes resulting in an increase in the formation of highly oxidizing OH radicals38
3
34 Photocatalytic Activity for dye degradation 4
For comparative purposes the photodegradation efficiencies of MB and MO mediated 5
by the different photocatalysts under UV irradiation are shown in Fig 6 Before comparison 6
the adsorption and photodegradation performances of GO Y2O3 and 5 GOY on MB were 7
investigated (Fig S1) As displayed in Fig S1 both Y2O3 and 5 GOY have good adsorption 8
affinity to MB After stirring for 30 min under dark about 80 MB could be absorbed by 9
Y2O3 and 5 GOY which is much better than GO (lower than 20) After photocatalysis for 10
35min MB can be degraded thoroughly by 5 GOY Then the photocatalytic activities of the 11
GO Y2O3 5 GOY 10 GOY 20 GOY and 50 GOY composite photocatalysts were compared 12
via the reduction of MB and MO under ambient temperature Photodegradation time is 35 13
min It has been reported that a large surface area helps to increase the photocatalytic reaction 14
sites39
From the O1s spectrum of Y2O3 (Fig S2 supplementary material) the oxygen 15
composition of Y2O3 and 5 GOY samples at different states (Table S1 supplementary 16
material) more OH radicals are available in 5 GOY As expected under UV irradiation the 17
degradation of MB is slower than 10 with a GO photocatalyst However the conversion of 18
MB reaches 95 after 35 min when using Y2O3 as a photocatalyst The four kinds of GOY 19
samples exhibite better photocatalytic properties in the degradation of MB than bare GO and 20
Y2O3 under UV irradiation Moreover with increasing the amount of GO the degradation of 21
MB increases slowly Considering the simplicity and economy of the MB degradation 5 22
GOY is selected as the photocatalyst in the following experiments The photocatalytic 23
activities of 5 GOY was compared with commercial TiO2 P25 (Fig S3 supplementary 24
material) indicating the photocatalytic property of 5 GOY was quite comparable with P25 25
The GOY composites also have photocatalytic activities to MO As can be seen in Fig 6 GO 26
has good affinity to MO and the 50 GOY has best degradation efficiency to MO among the 27
GOY composites 28
The photocatalyst dosage may affect the MB degradation efficiency Fig 7A illustrates 29
MB degradation at varying photocatalyst dosages (5 to 10 mg) MB degradation efficiency 30
Page 8 of 24Journal of Materials Chemistry A
Jour
nalo
fMat
eria
lsC
hem
istr
yA
Acc
epte
dM
anus
crip
t
Publ
ishe
d on
26
Mar
ch 2
014
Dow
nloa
ded
by N
atio
nal C
hung
Hsi
ng U
nive
rsity
on
120
420
14 1
036
16
View Article OnlineDOI 101039C4TA01057D
8
increases with increasing the contact time In addition with increasing the dosage the MB 1
degradation efficiency slowly increases As displayed in Fig 7A the best dosage is 10 mg 2
As the MB concentration may also influence degradation MB degradation under various 3
concentration of MB is investigated It can be seen clearly in Fig 7B that MB conversion 4
efficiency is as much as 100 after degradation for 35 min when the MB concentration is 5
lower than 25 mg L-1
The conversion efficiency will decrease when the MB concentration is 6
higher than 275 mg L-1
The final conversion efficiency will no more than 90 if 300 mg 7
L-1
MB solution is used 8
Because the solution pH can remarkably influence MB degradation the effect of initial 9
pH on the degradation of MB with 5 GOY catalyst is determined as presented in Fig 7C As 10
shown in Fig 7C the conversion of MB will finally reach 100 when the solution pH is 11
lower than 519 If the solution pH controlled at 63 the conversion efficiency will decrease 12
sharply and only 80 MB will convert after 35 min Therefore the solution pH is set at 41 13
35 Photocatalytic mechanism 14
The magnitude of the photocurrent represents the charge collection efficiency of the 15
electrode surface and indirectly indicates the separated efficiency of electron-hole pairs40
16
From the insert of Fig 8 5 GOY modified photoelectrode is prompted in generating 17
photocurrent under visible and UV-visible light GOY photoelectrodes yield the greater 18
photocurrent than Y2O3 photoelectrode under UV irradiation in Fig 8 19
Fig 9 shows the PL spectra of the Y2O3 and GOY photocatalysts With Y2O3 as 20
photocatalyst the PL signal centered around 450 nm is detected revealing that ∙OH radicals 21
are generated on the irradiated Y2O3 When GOY nanocomposites are used as the 22
photocatalysts the PL signal intensity is increased which suggests that the yield of ∙OH 23
radicals is enhanced on the irradiated GOY nanocomposite The enhancement in 24
photoactivity can be attributed to the remarkable synergistic effect of the combination of 25
Y2O3 and the GO sheets leading to the efficient separation of photogenerated carriers in the 26
Y2O3 and GO coupling system 27
It is well known that the photodegradation process of the photocatalysts is strongly 28
relative to electron-hole pairs generated by light irradiation on catalysts The photogenerated 29
electrons and holes can migrate to the surface of the catalysts and then can be trapped 30
Page 9 of 24 Journal of Materials Chemistry A
Jour
nalo
fMat
eria
lsC
hem
istr
yA
Acc
epte
dM
anus
crip
t
Publ
ishe
d on
26
Mar
ch 2
014
Dow
nloa
ded
by N
atio
nal C
hung
Hsi
ng U
nive
rsity
on
120
420
14 1
036
16
View Article OnlineDOI 101039C4TA01057D
9
generally by the oxygen and surface hydroxyls to ultimately produce hydroxyl radicals (middotOH) 1
that react with the adsorbed reactants41
As we know Y2O3 is n-type semiconductor with a 2
wide band gap about 56 eV42
To understand the charge separation process of Y2O3 and 3
GOYs the band edge positions of conduction band (CB) and valence band (VB) of 4
semiconductor Y2O3 has been calculated by the following equation43
5
EVB = X - Ee + 05Eg (1) 6
ECB = EVB - Eg (2) 7
where is the absolute electronegativity of the semiconductor e is the energy of free 8
electrons on the hydrogen scale (sim45 eV) and g is the bandgap energy of the 9
semiconductor The value of for Y2O3 is obtained by the arithmetic mean of the electron 10
affinity and the first ionization of the constituent atoms reported in the literatures44
to be 535 11
eV Thus the CB and VB potentials of Y2O3 are calculated to be -195 and 365 eV versus 12
normal hydrogen electrode (NHE) respectively It can be seen that the VB potential of 13
sample is more positive than the redox potential of OHminus∙OH (189 VNHE) indicating that 14
the photogenerated holes have strong oxidative ability and they can oxidize OHminus into ∙OH In 15
addition the CB potential of sample is negative enough to reduce O2 to O2∙ minus
(minus013 VNHE) 16
via eminus 17
Based on these results a possible mechanism for the photocatalytic is proposed as 18
follows and shown in Fig 10 19
Y2O3 + hν rarr Y2O3 (h+e) (3) 20
Y2O3 (e) + GO rarr Y2O3 + GO (e) (4) 21
GO (e) + O2 rarr GO + O2bullminus (5) 22
Y2O3 (h) + OHminus rarrY2O3 + OH
bull (6) 23
Y2O3 (h) + O2bullminus
+ OHbull + MB rarr CO2 +H2O+SO4
2minus + NO3
minus + Cl
minus (7) 24
25
4 Conclusions 26
In conclusion a novel GOY nanocomposite with different GO content has been obtained 27
via a one-step hydrothermal method The FT-IR XRD EDX and XPS results showed the 28
yttrium was successfully composited with GO The morphology characterization showed the 29
as-obtained GOY had nanoflake structure After stirring for 30 min under dark about 80 30
Page 10 of 24Journal of Materials Chemistry A
Jour
nalo
fMat
eria
lsC
hem
istr
yA
Acc
epte
dM
anus
crip
t
Publ
ishe
d on
26
Mar
ch 2
014
Dow
nloa
ded
by N
atio
nal C
hung
Hsi
ng U
nive
rsity
on
120
420
14 1
036
16
View Article OnlineDOI 101039C4TA01057D
10
MB could be absorbed by Y2O3 and 5 GOY The as-prepared GOY had good degradation 1
performance on both MB and MO under UV irradiation Compared with other GOY 2
composites 5 GOY had better photocatalytic activity to MB Factors such as dosages of 3
photocatalyst contaminant concentration and solution pH on MB conversion were also 4
investigated and discussed The catalyst also showed good stability and recyclability It is 5
expected that the GOY nanocomposite would be a potential candidate for treatment of dye 6
containing wastewater 7
8
Acknowledgments 9
This work was supported by the National Natural Science Foundation of China (No 10
21307104) Natural Science Foundation of Jiangsu Province China (NoBK20130438) the 11
Scientific Research Project of Environmental Fund of Yangzhou City (YHK1303) and 12
Jiangsu Key Laboratory of Environmental Material and Engineering (K12031) We thank the 13
Testing Center of Yangzhou University for sample characterization 14
15
Notes and References 16
1 B K Korbahti K Artut C Gecgel A Ozer Chem Eng J 2011 173 677-688 17
2 V K Gupta D Pathania S Agarwal P Singh J Hazard Mater 2012 243 179-186 18
3 N Wetchakun S Chaiwichain B Inceesungvorn K Pingmuang S Phanichphant A I 19
Minett J Chen ACS Appl Mater Interfaces 2012 4 3718-3723 20
4 Y F Li D Xu J I Oh W Shen X Li Y Yu ACS Catal 2012 2 391-398 21
5 M Khan W B Cao J Mol Catal A Chem 2013 376 71-77 22
6 Y F Wu Q J Zhang X F Yin H Q Cheng RSC Advances 2013 3 9670-9676 23
7 F H Chu C W Huang C L Hsin C W Wang S Y Yu P H Yeh W W Wu 24
Nanoscale 2012 4 1471-1475 25
8 L J Xu J L Wang Environ Sci Technol 2012 46 10145-10153 26
9 Y C Zhang J Li H Y Xu Appl Catal B 2012 123-124 18-26 27
10 S Usai S Obreg n A I Becerro G ol n J Phys Chem C 2013 117 24479-24484 28
11 A K Geim K S Novoselov Nat Mater 2007 6 183-191 29
12 K-Y Shin J-Y Hong J Jang Adv Mater 2011 23 2113-2118 30
Page 11 of 24 Journal of Materials Chemistry A
Jour
nalo
fMat
eria
lsC
hem
istr
yA
Acc
epte
dM
anus
crip
t
Publ
ishe
d on
26
Mar
ch 2
014
Dow
nloa
ded
by N
atio
nal C
hung
Hsi
ng U
nive
rsity
on
120
420
14 1
036
16
View Article OnlineDOI 101039C4TA01057D
11
13 G K Pradhan D K Padhi K M Parida ACS Appl Mater Interfaces 2013 5 1
9101-9110 2
14 E Lee J Y Hong H Kang J Jang J Hazard Mater 2012 219-220 13-18 3
15 Y S Fu H Q Chen X Q Sun X Wang Appl Catal B 2012 111-112 280-287 4
16 K Krishnamoorthy R Mohan S J Kim Appl Phys Lett 2011 98 244101 5
17 M Li J Zhang Y Zhang Chem Phys Lett 2012 527 63-66 6
18 F Meng J Li Z Hong M Zhi A Sakla C Xiang N Wu Catal Today 2013 199 7
48-52 8
19 H Zhang K Tan H Zheng Y Gu W F Zhang Mater Chem Phys 2011 125 9
156-160 10
20 X Niu S Li H Chu J Zhou J Rare Earths 2011 29 225-229 11
21 H Narayan H Alemu L Setofolo L Macheli ISRN Phys Chem 2012 841521 1-9 12
22 M J Allen V C Tung R B Kaner Chem Rev 2010 110 132-145 13
23 F Y Ban S R Majid N M Huang H N Lim Int J Electrochem Sci 2012 7 14
4345-4351 15
24 Y L Min G Q He Q J Xu Y C Chen J Mater Chem A 2014 2 1294-1301 16
25 W Fan W Gao C Zhang W W Tjiu J S Pan T X Liu J Mater Chem 2012 22 17
25108-25115 18
26 Z -S Wu W Ren L Wen L Gao J Zhao Z Chen G Zhou F Li H -M Cheng ACS 19
Nano 2010 4 3187-3194 20
27 J A Dorman Y B Mao J R Bargar J P Chang J Phys Chem C 2010 114 21
17422-17427 22
28 R P Ermakov VV Voronov P P Fedorov Nanosystems physics chemistry 23
mathematics 2013 4 (2) 196-205 24
29 A Lerf H He M Forster J Klinowski J Phys Chem B 1998102(23) 4477-4482 25
30 G Wang Z Yang X Li C Li Carbon 2005 43(12) 2564-2570 26
31 S Stankovich D A Dikin R D Piner K A Kohlhaas A Kleinhammes Y Y Jia Y 27
Wu S T Nguyen R S Ruoff Carbon 2007 45 1558-1565 28
32 M Aghazadeh A Nozad H Adelkhani M Ghaemi J Electrochem Soc 2010 157 29
D519-D522 30
Page 12 of 24Journal of Materials Chemistry A
Jour
nalo
fMat
eria
lsC
hem
istr
yA
Acc
epte
dM
anus
crip
t
Publ
ishe
d on
26
Mar
ch 2
014
Dow
nloa
ded
by N
atio
nal C
hung
Hsi
ng U
nive
rsity
on
120
420
14 1
036
16
View Article OnlineDOI 101039C4TA01057D
12
33 L Nan Y Kazumichi J Solid State Chem 2008 181 1738-1743 1
34 R Srinivasan N R Yogamalar J Elanchezhiyan R J Joseyphus A C Bose J Alloy 2
Compd 2010 496 472-477 3
35 S Somacescu J M C Moreno P Osiceanu B L Su V Parvulescu J Phys Chem C 4
2010 114 19365 5
36 J H Pan W I Lee Chem Mater 2006 18 847-853 6
37 Y Chen B H Song X S Tang L Lu J M Xue J Mater Chem 2012 22 7
17656-17662 8
38 J Xu Y Chang Y Zhang S Ma Y Qu C Xu Appl Surf Sci 2008 255 1996-1999 9
39 LP Zhu NC Bing LL Wang HY Jin GH Liao LJ Wang Dalton Trans 2012 41 10
2959-2965 11
40 Z Pei L Ding H Lin S Weng Z Zheng Y Hou P Liu J Mater Chem A 2013 1 12
10099-10102 13
41Y L Pan S Z Deng L Polavarapu N Y Gao P Y Yuan C H Sow Q H Xu 14
Langmuir 2012 28 12304-12310 15
42 P Rouffignac J S Park R G Gordon Chem Mater 2005 17 4808-4814 16
43 H Xu H Li C Wu J Chu Y Yan H Shu Z Gu J Hazard Mater 2008 153 17
877-880 18
44 T Andersen H K Haugen H Hotop J Phys Chem Ref Data 1999 28(6) 1511-1533 19
20
Page 13 of 24 Journal of Materials Chemistry A
Jour
nalo
fMat
eria
lsC
hem
istr
yA
Acc
epte
dM
anus
crip
t
Publ
ishe
d on
26
Mar
ch 2
014
Dow
nloa
ded
by N
atio
nal C
hung
Hsi
ng U
nive
rsity
on
120
420
14 1
036
16
View Article OnlineDOI 101039C4TA01057D
13
Figure captions 1
2
Figure 1 FT-IR spectra of GO Y2O3 and 5 GOY composites 3
Figure 2 XRD patterns of GO Y2O3 and 5 GOY composites 4
Figure 3 TGA curves of GO Y2O3 and 5 GOY composites 5
Figure 4 FESEM images of (A) Y2O3 (Insert low magnification) (B) GO (C) 5 GOY and 6
(D) 20 GOY composites (Insert EDS spectrum of 20 GOY sample) (E) and (F) 7
HRTEM images of 5 GOY taken after intense ultrasonic dispersion in ethanol for 30 8
min 9
Figure 5 XPS spectra (A) full survey spectra of GO Y2O3 and GOY nanocomposite (B) Y 10
3d of 5 GOY (C) O 1s of 5 GOY (D) C 1s of 5 GOY 11
Figure 6 Comparison of photodegradation efficiency using as-synthesized GO Y2O3 and 12
GOY composites 13
Figure 7 (A) Effect of dosage on MB conversion MB concentration 25 ppm pH = 41 (B) 14
Effect of MB concentration on the degradation Dosage 10 mg pH = 41 (C) Effect of 15
solution pH on MB conversion MB concentration 25 ppm Dosage 10 mg 16
Figure 8 Photocurrent responses of GO Y2O3 and 5 GOY photoelectrodes under UV 17
illumination Insert Photocurrent responses of 5 GOY under different illumination 18
conditions Scan rate 50 mVs The electrolyte solution was 05 M NaCl 19
Figure 9 PL spectra of Y2O3 5 GOY and 20 GOY samples (λex = 258 nm) 20
Figure 10 Proposed mechanism for the photodegradation of MB on GOY composite21
Page 14 of 24Journal of Materials Chemistry A
Jour
nalo
fMat
eria
lsC
hem
istr
yA
Acc
epte
dM
anus
crip
t
Publ
ishe
d on
26
Mar
ch 2
014
Dow
nloa
ded
by N
atio
nal C
hung
Hsi
ng U
nive
rsity
on
120
420
14 1
036
16
View Article OnlineDOI 101039C4TA01057D
14
Figure 1 1
2
3
4
500 1000 1500 2000 2500 3000 3500 4000
1657
Tra
ns
mit
tan
ce
Wavenumber cm-1
1657
1550
1564 17211223
1436
1436
GO
Y2O
3
5GOY
5
6
Page 15 of 24 Journal of Materials Chemistry A
Jour
nalo
fMat
eria
lsC
hem
istr
yA
Acc
epte
dM
anus
crip
t
Publ
ishe
d on
26
Mar
ch 2
014
Dow
nloa
ded
by N
atio
nal C
hung
Hsi
ng U
nive
rsity
on
120
420
14 1
036
16
View Article OnlineDOI 101039C4TA01057D
15
Figure 2 1
2
3
10 20 30 40 50 60 70
5GOY2O
3
Inte
ns
ity
a
u
2degree
GO
Y2O
3
4
5
6
Page 16 of 24Journal of Materials Chemistry A
Jour
nalo
fMat
eria
lsC
hem
istr
yA
Acc
epte
dM
anus
crip
t
Publ
ishe
d on
26
Mar
ch 2
014
Dow
nloa
ded
by N
atio
nal C
hung
Hsi
ng U
nive
rsity
on
120
420
14 1
036
16
View Article OnlineDOI 101039C4TA01057D
16
Figure 3 1
2
0 100 200 300 400 500 60040
50
60
70
80
90
100
5GOY
Y2O
3
GO
We
igh
t
Temperature oC
3
4
Page 17 of 24 Journal of Materials Chemistry A
Jour
nalo
fMat
eria
lsC
hem
istr
yA
Acc
epte
dM
anus
crip
t
Publ
ishe
d on
26
Mar
ch 2
014
Dow
nloa
ded
by N
atio
nal C
hung
Hsi
ng U
nive
rsity
on
120
420
14 1
036
16
View Article OnlineDOI 101039C4TA01057D
17
Figure 4 1
2
3
4
5
6
7
8
9
10
11
12
13
14
15
16
17
18
19
20
21
22
23
24
25
26
27
28
29
30
31
32
33
34
35
36
37
38
39
40
41
Page 18 of 24Journal of Materials Chemistry A
Jour
nalo
fMat
eria
lsC
hem
istr
yA
Acc
epte
dM
anus
crip
t
Publ
ishe
d on
26
Mar
ch 2
014
Dow
nloa
ded
by N
atio
nal C
hung
Hsi
ng U
nive
rsity
on
120
420
14 1
036
16
View Article OnlineDOI 101039C4TA01057D
18
Figure 5 1
2
3
1200 1000 800 600 400 200 0
Y 3d
C 1s
20 GOY
5 GOY
Y2O
3
Inte
ns
ity
a
u
Binding Energy eV
GO
O 1s
A
150 155 160 165 170 175
Inte
ns
ity
a
u
Binding Energy eV
Y 3d32
BY 3d
52
4
5
6
526 528 530 532 534 536
Inte
ns
ity
a
u
Binding Energy eV
O 1sC
282 284 286 288 290 292
Inte
ns
ity
a
u
Binding Energy eV
C-C
C-OC=O O-C=O
DC 1s
7
8
Page 19 of 24 Journal of Materials Chemistry A
Jour
nalo
fMat
eria
lsC
hem
istr
yA
Acc
epte
dM
anus
crip
t
Publ
ishe
d on
26
Mar
ch 2
014
Dow
nloa
ded
by N
atio
nal C
hung
Hsi
ng U
nive
rsity
on
120
420
14 1
036
16
View Article OnlineDOI 101039C4TA01057D
19
1
Figure 6 2
3
00
02
04
06
08
10
12
Y2O
3
20GOY
50GOY
10GOY
5GOYCo
nv
ers
ion
Photocatalysts
MO
MB
GO
4
5
6
7
8
Page 20 of 24Journal of Materials Chemistry A
Jour
nalo
fMat
eria
lsC
hem
istr
yA
Acc
epte
dM
anus
crip
t
Publ
ishe
d on
26
Mar
ch 2
014
Dow
nloa
ded
by N
atio
nal C
hung
Hsi
ng U
nive
rsity
on
120
420
14 1
036
16
View Article OnlineDOI 101039C4TA01057D
20
Figure 7 1
2
-5 0 5 10 15 20 25 30 35 40060
070
080
090
Co
nv
ers
ion
Time min
5 mg
6 mg
7 mg
8 mg
9 mg
10 mg
A100
-5 0 5 10 15 20 25 30 35 40
060
070
080
090
Co
nv
ers
ion
Time min
200 mg L-1
225 mg L-1
250 mg L-1
275 mg L-1
300 mg L-1
B100
3
4
-5 0 5 10 15 20 25 30 35 40
110
050
060
070
080
090
Co
nv
ers
ion
Time min
pH 303
pH 418
pH 519
pH 630
100
C
5
6
7
8
9
Page 21 of 24 Journal of Materials Chemistry A
Jour
nalo
fMat
eria
lsC
hem
istr
yA
Acc
epte
dM
anus
crip
t
Publ
ishe
d on
26
Mar
ch 2
014
Dow
nloa
ded
by N
atio
nal C
hung
Hsi
ng U
nive
rsity
on
120
420
14 1
036
16
View Article OnlineDOI 101039C4TA01057D
21
1
2
Figure 8 3
4
5
6
7
02 00 -02 -04
0
5
10
15
20j
A
cm
-2
E V (vs SCE)
Y2O
3
GO
5GOY
02 01 00 -01 -02 -0300
05
10
15
20
25
30
35
j A
cm
-2
E V (vs SCE)
Uv
Vis
Dark
5GOY
Page 22 of 24Journal of Materials Chemistry A
Jour
nalo
fMat
eria
lsC
hem
istr
yA
Acc
epte
dM
anus
crip
t
Publ
ishe
d on
26
Mar
ch 2
014
Dow
nloa
ded
by N
atio
nal C
hung
Hsi
ng U
nive
rsity
on
120
420
14 1
036
16
View Article OnlineDOI 101039C4TA01057D
22
1
2
Figure 9 3
4
400 450 500 550 600 650 700 750 800
Inte
ns
ity
a
u
Wavelength nm
20 GOY
5 GOY
Y2O
3
5
6
7
Page 23 of 24 Journal of Materials Chemistry A
Jour
nalo
fMat
eria
lsC
hem
istr
yA
Acc
epte
dM
anus
crip
t
Publ
ishe
d on
26
Mar
ch 2
014
Dow
nloa
ded
by N
atio
nal C
hung
Hsi
ng U
nive
rsity
on
120
420
14 1
036
16
View Article OnlineDOI 101039C4TA01057D
23
1
Figure 10 2
3
4
5
6
Page 24 of 24Journal of Materials Chemistry A
Jour
nalo
fMat
eria
lsC
hem
istr
yA
Acc
epte
dM
anus
crip
t
Publ
ishe
d on
26
Mar
ch 2
014
Dow
nloa
ded
by N
atio
nal C
hung
Hsi
ng U
nive
rsity
on
120
420
14 1
036
16
View Article OnlineDOI 101039C4TA01057D
1
Synthesis of novel Yttrium-doped graphene oxide nanocomposite 1
for dye removal 2
Ya Zhang1
Saisai Yuan2 Yanhua Zhao
1 Honggui Wang
1 Chenda He
1 3
1 Jiangsu Key Laboratory of Environmental Material and Engineering School of Environmental Science 4
and Engineering Yangzhou University Yangzhou 225127 PR China 5
2 School of Chemistry and Chemical Engineering Yangzhou University Yangzhou 225009 PR China 6
7
ABSTRACT 8
A novel yttrium-doped graphene oxide (GOY) composite was prepared by hydrothermal 9
method The morphology results showed that the graphene oxide (GO) can successfully 10
composite with yttrium and the as-prepared GOY had a nanoflake structure From the 11
photoelectrochemical analysis and photoluminescence (PL) spectra the primary role of GO 12
in Y2O3 was confirmed as an electron conductor enhancing the photocurrent density As 13
expected the as-obtained GOY composites had better photocatalytic performance on 14
decomposition of methylene blue molecules than bare GO and Y2O3 The 5 GOY (10 mg) 15
could degrade MB (25 ppm) thoroughly (~100 ) within 10 min which was quite 16
comparable with the commercial TiO2 P25 under UV irradiation A possible 17
mechanism of photocatalysis was also been presented 18
19
Keywords Yttrium-doped graphene oxide Methylene blue Ultraviolet light Photocatalyst 20
21
1 Introduction 22
Nowadays the growing population has led to the increasing contamination of surface 23
and ground water Organic dyes used in textile and food industries are one of the important 24
sources of the environmental contaminations due to their non-biodegradability and high 25
toxicity to aquatic creatures and carcinogenic effects on humans12
Semiconductor 26
photocatalysis has been extensively studied as a viable water treatment method34
27
Photocatalyst which accelerates light-driven chemical reactions has been paid a great 28
Corresponding author Tel +86-514-87979528 E-mail address zhangyayzueducn (Y Zhang) hcdyzueducn (CD
He)
Page 2 of 24Journal of Materials Chemistry A
Jour
nalo
fMat
eria
lsC
hem
istr
yA
Acc
epte
dM
anus
crip
t
Publ
ishe
d on
26
Mar
ch 2
014
Dow
nloa
ded
by N
atio
nal C
hung
Hsi
ng U
nive
rsity
on
120
420
14 1
036
16
View Article OnlineDOI 101039C4TA01057D
2
attention due to fascinating properties such as quantum confinement and enhanced reactivity5 1
Up to date diverse photocatalytic materials have been introduced including TiO2 ZnO 2
Fe3O4 SnO2 and BiVO43 6-10
Graphene oxide (GO) a two-dimensional sheet of sp2
3
hybridized carbon composing of only carbon oxygen and hydrogen has a high specific 4
surface area and tunable electronic structure11ndash13
Due to its extraordinary physical properties 5
high chemical and thermal stability graphene has been receiving recent attention as a support 6
for catalysts13-15
Recently a TiO2 nanorod-decorated graphene sheets has been prepared by 7
Jang and coworkers14
This nanocomposite had highly efficient photocatalytic activities under 8
visible-light irradiation Wang et al has reported a high-performance and recyclable 9
visible-light photocatalysis cobalt ferrite and graphene composite15
The spontaneous 10
exfoliated GO as an auxiliary co-catalyst has been reported that it can remarkably enhanced 11
the photocatalytic hydrogen production of TiO216
Although graphene has shown potential 12
applications in water treatment as a photocatalyst further optimization or modification of the 13
GO structure is still necessary for enhancing its photocatalytic activity 14
Impurity doping with proper oxidation state is useful for red shifting the absorption edge 15
as well as reducing the rate of electron-hole pairrsquos recombination which improves the 16
photocatalytic activity of a photocatalyst41718
It is reported that yttrium doping in TiO2 gives 17
improved photocatalytic response attributed to the visible light absorption electron-hole 18
pairrsquos separation higher interfacial charge transfer lower crystallite size and high specific 19
surface area419-21
This property enhances the performance of Y-based catalysts used in 20
wastewater treatment 21
In this work a novel yttrium-doped GO (GOY) was firstly synthesized via hydrothermal 22
method with different GO doping concentration The as-synthesized samples were 23
characterized by XRD FT-IR FESEM HRTEM and XPS The corresponding photocatalytic 24
activity was evaluated by measuring the photocatalytic degradation of methylene blue (MB) 25
and methlene orange (MO) degradation under UV irradiation A possible 26
mechanism of photocatalysis was also been presented based on the results of 27
photoelectrochemical analysis and PL spectra 28
29
30
Page 3 of 24 Journal of Materials Chemistry A
Jour
nalo
fMat
eria
lsC
hem
istr
yA
Acc
epte
dM
anus
crip
t
Publ
ishe
d on
26
Mar
ch 2
014
Dow
nloa
ded
by N
atio
nal C
hung
Hsi
ng U
nive
rsity
on
120
420
14 1
036
16
View Article OnlineDOI 101039C4TA01057D
3
2 Experimental 1
Yttrium (III) nitrate hexahydrate (Y(NO3)3middot6H2O) polyvinylpyrrolidone ((C6H9NO)n) 2
ethanol graphite NaCl H2SO4 H2O2 P2O5 and K2S2O7 were purchased from Sinopharm 3
Chemical Reagent Company TiO2 P25 was obtained from Evonik Industries All the reagents 4
were of analytical grade and used as received without further treatment All solutions were 5
prepared with DI water 6
21 Preparation of Y2O3 and GO Y2O3 composite catalysts 7
GO was prepared via a modified Hummer method as reported previously22
In a typical 8
synthesis procedure 0776 g Yttrium (III) nitrate hexahydrate (Y(NO3)3middot6H2O) 0223g 9
polyvinylpyrrolidone ((C6H9NO)n) and certain amounts of GO were dissolved in a 7 mL DI 10
water and 33 mL ethanol Then the solution dissolved under magnetic stirring The obtained 11
transparent solution was transferred into a 50 mL polytetrafluoroethylene (PTFE) 12
(Teflon)-lined steel autoclaves and heated at 180 oC for 16 h After cooling to ambient 13
temperature the precipitate was centrifuged washed several times with ethanol and dried at 14
60 oC in an oven As a control experiment Y2O3 nanoparticles were prepared under the same 15
conditions without adding GO The Y-doped GO composite containing 5 10 20 and 50 mg 16
GO are denoted as 5 GOY 10 GOY 20 GOY and 50 GOY respectively 17
22 Characterization 18
The X-ray diffraction (XRD) patterns were obtained by a Bruker D8 advance X-ray 19
diffractometer using monochromatic Cu Kα radiation (λ = 15406 Aring) with an accelerating 20
voltage of 40 kV and current of 40 mA The 2θ range used in the measurement was from 10 21
to 70 The FT-IR spectra of the samples were measured on a Cary 610670 microscope 22
(Varian US) with scanning from 4000 to 400 cm-1
by using KBr pellets under ambient 23
temperature Thermogravimetric analysis (TGA) was performed with a PE Pyris-1 instrument 24
at a heating rate of 10 oC min
-1 under N2 atmosphere Field emission scanning electron 25
microscopy (FESEM) was examined on a field-emission scanning electron microanalyzer 26
(Hitachi S-4800 Japan) Energy dispersive X-ray spectroscopy (EDX) was performed on a 27
XL-30ESEM scanning electron microscopy High-resolution transmission electron 28
microscopy (HRTEM) was recorded on a Tecnai G2 F30 S-TWIN transmission electron 29
microscopes X-ray photoelectron spectroscopy (XPS) measurements were carried out with 30
Page 4 of 24Journal of Materials Chemistry A
Jour
nalo
fMat
eria
lsC
hem
istr
yA
Acc
epte
dM
anus
crip
t
Publ
ishe
d on
26
Mar
ch 2
014
Dow
nloa
ded
by N
atio
nal C
hung
Hsi
ng U
nive
rsity
on
120
420
14 1
036
16
View Article OnlineDOI 101039C4TA01057D
4
an ESCALAB 250 photoelectron spectrometer using Al Kα radiation (Thermo-VG Scientific 1
US) The photoluminescence (PL) spectra were measured with a JY HRD double grating 2
monochromator at room temperature 3
23 Degradation of methylene blue (MB) and methylene orange (MO) 4
Photocatalysis experiments were carried out in a BL-GHX-V photochemical reactor 5
(Shanghai Bilon Instrument Co Ltd) The UV source (λ lt 420 nm) was provided by a 500 W 6
high-pressure mercury lamp Reactor and UV source were surrounded by a circulating water 7
jacket to maintain constant temperature UV irradiation photocatalytic activities of GO Y2O3 8
and GOY composite were evaluated through the degradation of MB and MO 9
A stock solution of MB (or MO) at 1000 ppm was prepared using DI water In a typical 10
run 005 g of photocatalyst was dispersed in a 20 mL MB (or MO) (25 ppm) Then the 11
suspension was stirred for 30 min in the dark to ensure adsorptiondesorption equilibrium 12
before light illumination At each specific sampling time aqueous sample was withdrawn by 13
a 5 mL syringe and filtered immediately by a 022 μm filter film to remove the catalyst 14
particles before analysis All experiments were repeated at least two times and averages were 15
reported The concentration of MB (or MO) was then determined by measuring the 16
absorbance at λmax 600 nm via UV-vis spectrophotometer To determine the catalytic 17
recycling properties the catalyst was separated after reaction for 30 min and washed 18
thoroughly with ultrapure water and ethanol followed by drying at 60 oC for 12 h in vacuum 19
oven Finally the catalyst was separated by magnet and redispersed in a new reaction system 20
for subsequent catalytic experiments under the same reaction conditions The reduction ratio 21
of MB (or MO) was calculated using the following expression 22
Degradation ratio of MB = times100 23
where A0 and At were the absorbance intensities when illuminated for 0 (that is just after the 24
dark adsorption) and t min respectively 25
24 Photoelectrochemical Measurements 26
All photoelectrochemical characteristics were performed in the electrolytic cell 27
consisted of a GO Y2O3 or GOY composites (2 mg mL-1 100 μL) coated FTO glass working 28
electrode (2cm2cm) a platinum wire counter electrode and a saturated calomel reference 29
Page 5 of 24 Journal of Materials Chemistry A
Jour
nalo
fMat
eria
lsC
hem
istr
yA
Acc
epte
dM
anus
crip
t
Publ
ishe
d on
26
Mar
ch 2
014
Dow
nloa
ded
by N
atio
nal C
hung
Hsi
ng U
nive
rsity
on
120
420
14 1
036
16
View Article OnlineDOI 101039C4TA01057D
5
electrode (SCE) on a Model CHI 660E electrochemical workstation under a 500 W 1
high-pressure mercury lamp irradiation 2
3
3 Results and discussion 4
31 FT-IR spectra XRD and TGA Analysis 5
FT-IR measurement is employed to investigate the bonding interactions in GO before 6
and after the oxidation process FT-IR spectra of GO Y2O3 and 5 GOY are shown in Fig 1 7
In the spectrum of GO the peak at about 1721 cm-1
is attributed to the stretching vibrations of 8
C=O The peaks appear at about 1223 and 1564 cm-1
correspond to the stretching vibrations 9
of C-O and C=C respectively23
The FT-IR spectra of Y2O3 and 5 GOY composite have 10
similar curve shape while a new peak appears at 1550 cm-1
of 5 GOY This result indicates 11
the GO has successfully composited with Y2O3 12
Fig 2 shows the crystal structure of GO Y2O3 and 5 GOY composite GO shows a 13
sharp peak at 2θ = 105o corresponding to the (001) reflection of graphite oxide
152425 The 14
diffraction peaks observed at 2θ = 421deg originate from disorderedly stacked GO sheets26
The 15
peaks located at 198deg 286deg 351deg 501deg 494deg and 512deg (2θ) result from the presence of 16
Y2O3 which are in agreement with the theoretical data of hematite (JCPDS No 41-0015)2728
17
In the pattern of 5 GOY the presence of diffraction peak at 2θ of 421deg indicating that GO 18
exists in the composite material It should be noted that there is a diffraction peak observed at 19
2θ = 101deg on both patterns of Y2O3 and 5 GOY which originates from intermediate YO(OH) 20
structure27
21
Fig 3 presents results of TGA analysis of the as-synthesized GO Y2O3 and 5 GOY 22
composite powder The samples were heated from room temperature to 600 degC at 5 degC min-1
23
under N2 flow As can be seen in Fig3 GO starts to lose mass upon heating even below 24
100 degC The major mass loss occurs at about 200 degC is caused by pyrolysis of the 25
oxygen-containing functional groups generating CO CO2 and stream29-31
Y2O3 and 5 GOY 26
have the same shape and show mass losses at three temperature ~100 320 and 400 degC The 27
first mass loss at about 100 degC is related to dehydration of free and physically absorbed 28
molecular water The next mass loss at about 320 degC is supposed to be related with the first 29
dehydration of chemisorbed and combined water from Y(OH)33233
The third mass loss at 30
Page 6 of 24Journal of Materials Chemistry A
Jour
nalo
fMat
eria
lsC
hem
istr
yA
Acc
epte
dM
anus
crip
t
Publ
ishe
d on
26
Mar
ch 2
014
Dow
nloa
ded
by N
atio
nal C
hung
Hsi
ng U
nive
rsity
on
120
420
14 1
036
16
View Article OnlineDOI 101039C4TA01057D
6
about 400 degC confirms dehydration of structural water from YOOH phase34
1
32 Morphology Characterization 2
The morphology of the as-obtained samples are examined by FESEM It can be 3
observed in Fig 4A that the as-prepared Y2O3 illustrates a uniform flake-like shape with 4
irregular edges Its lateral size ranges from 70 to 150 nm and thickness is around 10 to 20 nm 5
It can be observed that the prepared graphene oxide illustrates the flake-like shape and 6
layer-layer structure of graphene oxide edges (Fig 4B) Fig 4C and D displays the 7
morphologies of 5 GOY and 20 GOY composites respectively As can be seen with GO 8
content increasing the flake-like structure becomes irregular At the same time GO and Y2O3 9
aggregate The EDX profile (Fig 4D insert) exhibits strong carbon oxygen and yttrium peaks 10
Fig 4E and F exhibit HRTEM images of the GOY composite As shown in Fig 4E and F the 11
lattice fringes of Y2O3 nanocrystals and GO are simultaneously observed indicating strong 12
interactions between Y and the GO support The resolved lattice fringes of (111) planes (d = 13
031 nm) are attributed to GO and the lattice fringes of (111) planes (d = 027 nm) are 14
assigned to Y2O3 nanocrystals 15
33 XPS analysis 16
Fig 5A shows the XPS full survey spectra in the binding energy range of 0-1100 eV for 17
GO Y2O3 5 GOY and 20 GOY composite As shown in Fig 5A all the samples contain C 18
and O however the Y-contained samples show two peaks at about 1582 eV and 1600 eV 19
which are attributed to Y6 Fig 5B-D shows the high-resolution XPS regional spectra of Y 3d 20
O 1s and C 1s for 5 GOY respectively The relatively strong peaks at 1581 eV and 1599 eV 21
can be attributed to Y 3d52 and Y 3d32 respectively (Fig 5B) These results are in agreement 22
with values of Y2O3 reported in the literature35
It is well reported that yttrium retards the 23
combination of photogenerated electron-hole pairs41718
this may be due to the presence of 24
extra hydroxyl species to delay recombination through hole trapping6 Three kinds of surface 25
oxygen species could be distinguished in the O 1s spectra as shown in Fig 5C The binding 26
energy of 5309 eV 5318 and 5330 eV are ascribed to the lattice oxygen the hydroxyl 27
groups and the C-OH respectively36
As shown in Fig 5D the XPS spectrum of C 1s from 5 28
GOY is collected which can be deconvoluted into four peaks sp2 bonded carbon at 2848 eV 29
(CndashC) epoxyhydroxyls at 2860 eV (CndashO) carbonyls at 2879 eV (C=O) and carboxyls at 30
Page 7 of 24 Journal of Materials Chemistry A
Jour
nalo
fMat
eria
lsC
hem
istr
yA
Acc
epte
dM
anus
crip
t
Publ
ishe
d on
26
Mar
ch 2
014
Dow
nloa
ded
by N
atio
nal C
hung
Hsi
ng U
nive
rsity
on
120
420
14 1
036
16
View Article OnlineDOI 101039C4TA01057D
7
2891 eV (OndashC=O) indicating the high percentage of oxygen-contained functional groups37
1
Chemisorbed surface hydroxyl groups can enhance photocatalysis by trapping photoinduced 2
holes resulting in an increase in the formation of highly oxidizing OH radicals38
3
34 Photocatalytic Activity for dye degradation 4
For comparative purposes the photodegradation efficiencies of MB and MO mediated 5
by the different photocatalysts under UV irradiation are shown in Fig 6 Before comparison 6
the adsorption and photodegradation performances of GO Y2O3 and 5 GOY on MB were 7
investigated (Fig S1) As displayed in Fig S1 both Y2O3 and 5 GOY have good adsorption 8
affinity to MB After stirring for 30 min under dark about 80 MB could be absorbed by 9
Y2O3 and 5 GOY which is much better than GO (lower than 20) After photocatalysis for 10
35min MB can be degraded thoroughly by 5 GOY Then the photocatalytic activities of the 11
GO Y2O3 5 GOY 10 GOY 20 GOY and 50 GOY composite photocatalysts were compared 12
via the reduction of MB and MO under ambient temperature Photodegradation time is 35 13
min It has been reported that a large surface area helps to increase the photocatalytic reaction 14
sites39
From the O1s spectrum of Y2O3 (Fig S2 supplementary material) the oxygen 15
composition of Y2O3 and 5 GOY samples at different states (Table S1 supplementary 16
material) more OH radicals are available in 5 GOY As expected under UV irradiation the 17
degradation of MB is slower than 10 with a GO photocatalyst However the conversion of 18
MB reaches 95 after 35 min when using Y2O3 as a photocatalyst The four kinds of GOY 19
samples exhibite better photocatalytic properties in the degradation of MB than bare GO and 20
Y2O3 under UV irradiation Moreover with increasing the amount of GO the degradation of 21
MB increases slowly Considering the simplicity and economy of the MB degradation 5 22
GOY is selected as the photocatalyst in the following experiments The photocatalytic 23
activities of 5 GOY was compared with commercial TiO2 P25 (Fig S3 supplementary 24
material) indicating the photocatalytic property of 5 GOY was quite comparable with P25 25
The GOY composites also have photocatalytic activities to MO As can be seen in Fig 6 GO 26
has good affinity to MO and the 50 GOY has best degradation efficiency to MO among the 27
GOY composites 28
The photocatalyst dosage may affect the MB degradation efficiency Fig 7A illustrates 29
MB degradation at varying photocatalyst dosages (5 to 10 mg) MB degradation efficiency 30
Page 8 of 24Journal of Materials Chemistry A
Jour
nalo
fMat
eria
lsC
hem
istr
yA
Acc
epte
dM
anus
crip
t
Publ
ishe
d on
26
Mar
ch 2
014
Dow
nloa
ded
by N
atio
nal C
hung
Hsi
ng U
nive
rsity
on
120
420
14 1
036
16
View Article OnlineDOI 101039C4TA01057D
8
increases with increasing the contact time In addition with increasing the dosage the MB 1
degradation efficiency slowly increases As displayed in Fig 7A the best dosage is 10 mg 2
As the MB concentration may also influence degradation MB degradation under various 3
concentration of MB is investigated It can be seen clearly in Fig 7B that MB conversion 4
efficiency is as much as 100 after degradation for 35 min when the MB concentration is 5
lower than 25 mg L-1
The conversion efficiency will decrease when the MB concentration is 6
higher than 275 mg L-1
The final conversion efficiency will no more than 90 if 300 mg 7
L-1
MB solution is used 8
Because the solution pH can remarkably influence MB degradation the effect of initial 9
pH on the degradation of MB with 5 GOY catalyst is determined as presented in Fig 7C As 10
shown in Fig 7C the conversion of MB will finally reach 100 when the solution pH is 11
lower than 519 If the solution pH controlled at 63 the conversion efficiency will decrease 12
sharply and only 80 MB will convert after 35 min Therefore the solution pH is set at 41 13
35 Photocatalytic mechanism 14
The magnitude of the photocurrent represents the charge collection efficiency of the 15
electrode surface and indirectly indicates the separated efficiency of electron-hole pairs40
16
From the insert of Fig 8 5 GOY modified photoelectrode is prompted in generating 17
photocurrent under visible and UV-visible light GOY photoelectrodes yield the greater 18
photocurrent than Y2O3 photoelectrode under UV irradiation in Fig 8 19
Fig 9 shows the PL spectra of the Y2O3 and GOY photocatalysts With Y2O3 as 20
photocatalyst the PL signal centered around 450 nm is detected revealing that ∙OH radicals 21
are generated on the irradiated Y2O3 When GOY nanocomposites are used as the 22
photocatalysts the PL signal intensity is increased which suggests that the yield of ∙OH 23
radicals is enhanced on the irradiated GOY nanocomposite The enhancement in 24
photoactivity can be attributed to the remarkable synergistic effect of the combination of 25
Y2O3 and the GO sheets leading to the efficient separation of photogenerated carriers in the 26
Y2O3 and GO coupling system 27
It is well known that the photodegradation process of the photocatalysts is strongly 28
relative to electron-hole pairs generated by light irradiation on catalysts The photogenerated 29
electrons and holes can migrate to the surface of the catalysts and then can be trapped 30
Page 9 of 24 Journal of Materials Chemistry A
Jour
nalo
fMat
eria
lsC
hem
istr
yA
Acc
epte
dM
anus
crip
t
Publ
ishe
d on
26
Mar
ch 2
014
Dow
nloa
ded
by N
atio
nal C
hung
Hsi
ng U
nive
rsity
on
120
420
14 1
036
16
View Article OnlineDOI 101039C4TA01057D
9
generally by the oxygen and surface hydroxyls to ultimately produce hydroxyl radicals (middotOH) 1
that react with the adsorbed reactants41
As we know Y2O3 is n-type semiconductor with a 2
wide band gap about 56 eV42
To understand the charge separation process of Y2O3 and 3
GOYs the band edge positions of conduction band (CB) and valence band (VB) of 4
semiconductor Y2O3 has been calculated by the following equation43
5
EVB = X - Ee + 05Eg (1) 6
ECB = EVB - Eg (2) 7
where is the absolute electronegativity of the semiconductor e is the energy of free 8
electrons on the hydrogen scale (sim45 eV) and g is the bandgap energy of the 9
semiconductor The value of for Y2O3 is obtained by the arithmetic mean of the electron 10
affinity and the first ionization of the constituent atoms reported in the literatures44
to be 535 11
eV Thus the CB and VB potentials of Y2O3 are calculated to be -195 and 365 eV versus 12
normal hydrogen electrode (NHE) respectively It can be seen that the VB potential of 13
sample is more positive than the redox potential of OHminus∙OH (189 VNHE) indicating that 14
the photogenerated holes have strong oxidative ability and they can oxidize OHminus into ∙OH In 15
addition the CB potential of sample is negative enough to reduce O2 to O2∙ minus
(minus013 VNHE) 16
via eminus 17
Based on these results a possible mechanism for the photocatalytic is proposed as 18
follows and shown in Fig 10 19
Y2O3 + hν rarr Y2O3 (h+e) (3) 20
Y2O3 (e) + GO rarr Y2O3 + GO (e) (4) 21
GO (e) + O2 rarr GO + O2bullminus (5) 22
Y2O3 (h) + OHminus rarrY2O3 + OH
bull (6) 23
Y2O3 (h) + O2bullminus
+ OHbull + MB rarr CO2 +H2O+SO4
2minus + NO3
minus + Cl
minus (7) 24
25
4 Conclusions 26
In conclusion a novel GOY nanocomposite with different GO content has been obtained 27
via a one-step hydrothermal method The FT-IR XRD EDX and XPS results showed the 28
yttrium was successfully composited with GO The morphology characterization showed the 29
as-obtained GOY had nanoflake structure After stirring for 30 min under dark about 80 30
Page 10 of 24Journal of Materials Chemistry A
Jour
nalo
fMat
eria
lsC
hem
istr
yA
Acc
epte
dM
anus
crip
t
Publ
ishe
d on
26
Mar
ch 2
014
Dow
nloa
ded
by N
atio
nal C
hung
Hsi
ng U
nive
rsity
on
120
420
14 1
036
16
View Article OnlineDOI 101039C4TA01057D
10
MB could be absorbed by Y2O3 and 5 GOY The as-prepared GOY had good degradation 1
performance on both MB and MO under UV irradiation Compared with other GOY 2
composites 5 GOY had better photocatalytic activity to MB Factors such as dosages of 3
photocatalyst contaminant concentration and solution pH on MB conversion were also 4
investigated and discussed The catalyst also showed good stability and recyclability It is 5
expected that the GOY nanocomposite would be a potential candidate for treatment of dye 6
containing wastewater 7
8
Acknowledgments 9
This work was supported by the National Natural Science Foundation of China (No 10
21307104) Natural Science Foundation of Jiangsu Province China (NoBK20130438) the 11
Scientific Research Project of Environmental Fund of Yangzhou City (YHK1303) and 12
Jiangsu Key Laboratory of Environmental Material and Engineering (K12031) We thank the 13
Testing Center of Yangzhou University for sample characterization 14
15
Notes and References 16
1 B K Korbahti K Artut C Gecgel A Ozer Chem Eng J 2011 173 677-688 17
2 V K Gupta D Pathania S Agarwal P Singh J Hazard Mater 2012 243 179-186 18
3 N Wetchakun S Chaiwichain B Inceesungvorn K Pingmuang S Phanichphant A I 19
Minett J Chen ACS Appl Mater Interfaces 2012 4 3718-3723 20
4 Y F Li D Xu J I Oh W Shen X Li Y Yu ACS Catal 2012 2 391-398 21
5 M Khan W B Cao J Mol Catal A Chem 2013 376 71-77 22
6 Y F Wu Q J Zhang X F Yin H Q Cheng RSC Advances 2013 3 9670-9676 23
7 F H Chu C W Huang C L Hsin C W Wang S Y Yu P H Yeh W W Wu 24
Nanoscale 2012 4 1471-1475 25
8 L J Xu J L Wang Environ Sci Technol 2012 46 10145-10153 26
9 Y C Zhang J Li H Y Xu Appl Catal B 2012 123-124 18-26 27
10 S Usai S Obreg n A I Becerro G ol n J Phys Chem C 2013 117 24479-24484 28
11 A K Geim K S Novoselov Nat Mater 2007 6 183-191 29
12 K-Y Shin J-Y Hong J Jang Adv Mater 2011 23 2113-2118 30
Page 11 of 24 Journal of Materials Chemistry A
Jour
nalo
fMat
eria
lsC
hem
istr
yA
Acc
epte
dM
anus
crip
t
Publ
ishe
d on
26
Mar
ch 2
014
Dow
nloa
ded
by N
atio
nal C
hung
Hsi
ng U
nive
rsity
on
120
420
14 1
036
16
View Article OnlineDOI 101039C4TA01057D
11
13 G K Pradhan D K Padhi K M Parida ACS Appl Mater Interfaces 2013 5 1
9101-9110 2
14 E Lee J Y Hong H Kang J Jang J Hazard Mater 2012 219-220 13-18 3
15 Y S Fu H Q Chen X Q Sun X Wang Appl Catal B 2012 111-112 280-287 4
16 K Krishnamoorthy R Mohan S J Kim Appl Phys Lett 2011 98 244101 5
17 M Li J Zhang Y Zhang Chem Phys Lett 2012 527 63-66 6
18 F Meng J Li Z Hong M Zhi A Sakla C Xiang N Wu Catal Today 2013 199 7
48-52 8
19 H Zhang K Tan H Zheng Y Gu W F Zhang Mater Chem Phys 2011 125 9
156-160 10
20 X Niu S Li H Chu J Zhou J Rare Earths 2011 29 225-229 11
21 H Narayan H Alemu L Setofolo L Macheli ISRN Phys Chem 2012 841521 1-9 12
22 M J Allen V C Tung R B Kaner Chem Rev 2010 110 132-145 13
23 F Y Ban S R Majid N M Huang H N Lim Int J Electrochem Sci 2012 7 14
4345-4351 15
24 Y L Min G Q He Q J Xu Y C Chen J Mater Chem A 2014 2 1294-1301 16
25 W Fan W Gao C Zhang W W Tjiu J S Pan T X Liu J Mater Chem 2012 22 17
25108-25115 18
26 Z -S Wu W Ren L Wen L Gao J Zhao Z Chen G Zhou F Li H -M Cheng ACS 19
Nano 2010 4 3187-3194 20
27 J A Dorman Y B Mao J R Bargar J P Chang J Phys Chem C 2010 114 21
17422-17427 22
28 R P Ermakov VV Voronov P P Fedorov Nanosystems physics chemistry 23
mathematics 2013 4 (2) 196-205 24
29 A Lerf H He M Forster J Klinowski J Phys Chem B 1998102(23) 4477-4482 25
30 G Wang Z Yang X Li C Li Carbon 2005 43(12) 2564-2570 26
31 S Stankovich D A Dikin R D Piner K A Kohlhaas A Kleinhammes Y Y Jia Y 27
Wu S T Nguyen R S Ruoff Carbon 2007 45 1558-1565 28
32 M Aghazadeh A Nozad H Adelkhani M Ghaemi J Electrochem Soc 2010 157 29
D519-D522 30
Page 12 of 24Journal of Materials Chemistry A
Jour
nalo
fMat
eria
lsC
hem
istr
yA
Acc
epte
dM
anus
crip
t
Publ
ishe
d on
26
Mar
ch 2
014
Dow
nloa
ded
by N
atio
nal C
hung
Hsi
ng U
nive
rsity
on
120
420
14 1
036
16
View Article OnlineDOI 101039C4TA01057D
12
33 L Nan Y Kazumichi J Solid State Chem 2008 181 1738-1743 1
34 R Srinivasan N R Yogamalar J Elanchezhiyan R J Joseyphus A C Bose J Alloy 2
Compd 2010 496 472-477 3
35 S Somacescu J M C Moreno P Osiceanu B L Su V Parvulescu J Phys Chem C 4
2010 114 19365 5
36 J H Pan W I Lee Chem Mater 2006 18 847-853 6
37 Y Chen B H Song X S Tang L Lu J M Xue J Mater Chem 2012 22 7
17656-17662 8
38 J Xu Y Chang Y Zhang S Ma Y Qu C Xu Appl Surf Sci 2008 255 1996-1999 9
39 LP Zhu NC Bing LL Wang HY Jin GH Liao LJ Wang Dalton Trans 2012 41 10
2959-2965 11
40 Z Pei L Ding H Lin S Weng Z Zheng Y Hou P Liu J Mater Chem A 2013 1 12
10099-10102 13
41Y L Pan S Z Deng L Polavarapu N Y Gao P Y Yuan C H Sow Q H Xu 14
Langmuir 2012 28 12304-12310 15
42 P Rouffignac J S Park R G Gordon Chem Mater 2005 17 4808-4814 16
43 H Xu H Li C Wu J Chu Y Yan H Shu Z Gu J Hazard Mater 2008 153 17
877-880 18
44 T Andersen H K Haugen H Hotop J Phys Chem Ref Data 1999 28(6) 1511-1533 19
20
Page 13 of 24 Journal of Materials Chemistry A
Jour
nalo
fMat
eria
lsC
hem
istr
yA
Acc
epte
dM
anus
crip
t
Publ
ishe
d on
26
Mar
ch 2
014
Dow
nloa
ded
by N
atio
nal C
hung
Hsi
ng U
nive
rsity
on
120
420
14 1
036
16
View Article OnlineDOI 101039C4TA01057D
13
Figure captions 1
2
Figure 1 FT-IR spectra of GO Y2O3 and 5 GOY composites 3
Figure 2 XRD patterns of GO Y2O3 and 5 GOY composites 4
Figure 3 TGA curves of GO Y2O3 and 5 GOY composites 5
Figure 4 FESEM images of (A) Y2O3 (Insert low magnification) (B) GO (C) 5 GOY and 6
(D) 20 GOY composites (Insert EDS spectrum of 20 GOY sample) (E) and (F) 7
HRTEM images of 5 GOY taken after intense ultrasonic dispersion in ethanol for 30 8
min 9
Figure 5 XPS spectra (A) full survey spectra of GO Y2O3 and GOY nanocomposite (B) Y 10
3d of 5 GOY (C) O 1s of 5 GOY (D) C 1s of 5 GOY 11
Figure 6 Comparison of photodegradation efficiency using as-synthesized GO Y2O3 and 12
GOY composites 13
Figure 7 (A) Effect of dosage on MB conversion MB concentration 25 ppm pH = 41 (B) 14
Effect of MB concentration on the degradation Dosage 10 mg pH = 41 (C) Effect of 15
solution pH on MB conversion MB concentration 25 ppm Dosage 10 mg 16
Figure 8 Photocurrent responses of GO Y2O3 and 5 GOY photoelectrodes under UV 17
illumination Insert Photocurrent responses of 5 GOY under different illumination 18
conditions Scan rate 50 mVs The electrolyte solution was 05 M NaCl 19
Figure 9 PL spectra of Y2O3 5 GOY and 20 GOY samples (λex = 258 nm) 20
Figure 10 Proposed mechanism for the photodegradation of MB on GOY composite21
Page 14 of 24Journal of Materials Chemistry A
Jour
nalo
fMat
eria
lsC
hem
istr
yA
Acc
epte
dM
anus
crip
t
Publ
ishe
d on
26
Mar
ch 2
014
Dow
nloa
ded
by N
atio
nal C
hung
Hsi
ng U
nive
rsity
on
120
420
14 1
036
16
View Article OnlineDOI 101039C4TA01057D
14
Figure 1 1
2
3
4
500 1000 1500 2000 2500 3000 3500 4000
1657
Tra
ns
mit
tan
ce
Wavenumber cm-1
1657
1550
1564 17211223
1436
1436
GO
Y2O
3
5GOY
5
6
Page 15 of 24 Journal of Materials Chemistry A
Jour
nalo
fMat
eria
lsC
hem
istr
yA
Acc
epte
dM
anus
crip
t
Publ
ishe
d on
26
Mar
ch 2
014
Dow
nloa
ded
by N
atio
nal C
hung
Hsi
ng U
nive
rsity
on
120
420
14 1
036
16
View Article OnlineDOI 101039C4TA01057D
15
Figure 2 1
2
3
10 20 30 40 50 60 70
5GOY2O
3
Inte
ns
ity
a
u
2degree
GO
Y2O
3
4
5
6
Page 16 of 24Journal of Materials Chemistry A
Jour
nalo
fMat
eria
lsC
hem
istr
yA
Acc
epte
dM
anus
crip
t
Publ
ishe
d on
26
Mar
ch 2
014
Dow
nloa
ded
by N
atio
nal C
hung
Hsi
ng U
nive
rsity
on
120
420
14 1
036
16
View Article OnlineDOI 101039C4TA01057D
16
Figure 3 1
2
0 100 200 300 400 500 60040
50
60
70
80
90
100
5GOY
Y2O
3
GO
We
igh
t
Temperature oC
3
4
Page 17 of 24 Journal of Materials Chemistry A
Jour
nalo
fMat
eria
lsC
hem
istr
yA
Acc
epte
dM
anus
crip
t
Publ
ishe
d on
26
Mar
ch 2
014
Dow
nloa
ded
by N
atio
nal C
hung
Hsi
ng U
nive
rsity
on
120
420
14 1
036
16
View Article OnlineDOI 101039C4TA01057D
17
Figure 4 1
2
3
4
5
6
7
8
9
10
11
12
13
14
15
16
17
18
19
20
21
22
23
24
25
26
27
28
29
30
31
32
33
34
35
36
37
38
39
40
41
Page 18 of 24Journal of Materials Chemistry A
Jour
nalo
fMat
eria
lsC
hem
istr
yA
Acc
epte
dM
anus
crip
t
Publ
ishe
d on
26
Mar
ch 2
014
Dow
nloa
ded
by N
atio
nal C
hung
Hsi
ng U
nive
rsity
on
120
420
14 1
036
16
View Article OnlineDOI 101039C4TA01057D
18
Figure 5 1
2
3
1200 1000 800 600 400 200 0
Y 3d
C 1s
20 GOY
5 GOY
Y2O
3
Inte
ns
ity
a
u
Binding Energy eV
GO
O 1s
A
150 155 160 165 170 175
Inte
ns
ity
a
u
Binding Energy eV
Y 3d32
BY 3d
52
4
5
6
526 528 530 532 534 536
Inte
ns
ity
a
u
Binding Energy eV
O 1sC
282 284 286 288 290 292
Inte
ns
ity
a
u
Binding Energy eV
C-C
C-OC=O O-C=O
DC 1s
7
8
Page 19 of 24 Journal of Materials Chemistry A
Jour
nalo
fMat
eria
lsC
hem
istr
yA
Acc
epte
dM
anus
crip
t
Publ
ishe
d on
26
Mar
ch 2
014
Dow
nloa
ded
by N
atio
nal C
hung
Hsi
ng U
nive
rsity
on
120
420
14 1
036
16
View Article OnlineDOI 101039C4TA01057D
19
1
Figure 6 2
3
00
02
04
06
08
10
12
Y2O
3
20GOY
50GOY
10GOY
5GOYCo
nv
ers
ion
Photocatalysts
MO
MB
GO
4
5
6
7
8
Page 20 of 24Journal of Materials Chemistry A
Jour
nalo
fMat
eria
lsC
hem
istr
yA
Acc
epte
dM
anus
crip
t
Publ
ishe
d on
26
Mar
ch 2
014
Dow
nloa
ded
by N
atio
nal C
hung
Hsi
ng U
nive
rsity
on
120
420
14 1
036
16
View Article OnlineDOI 101039C4TA01057D
20
Figure 7 1
2
-5 0 5 10 15 20 25 30 35 40060
070
080
090
Co
nv
ers
ion
Time min
5 mg
6 mg
7 mg
8 mg
9 mg
10 mg
A100
-5 0 5 10 15 20 25 30 35 40
060
070
080
090
Co
nv
ers
ion
Time min
200 mg L-1
225 mg L-1
250 mg L-1
275 mg L-1
300 mg L-1
B100
3
4
-5 0 5 10 15 20 25 30 35 40
110
050
060
070
080
090
Co
nv
ers
ion
Time min
pH 303
pH 418
pH 519
pH 630
100
C
5
6
7
8
9
Page 21 of 24 Journal of Materials Chemistry A
Jour
nalo
fMat
eria
lsC
hem
istr
yA
Acc
epte
dM
anus
crip
t
Publ
ishe
d on
26
Mar
ch 2
014
Dow
nloa
ded
by N
atio
nal C
hung
Hsi
ng U
nive
rsity
on
120
420
14 1
036
16
View Article OnlineDOI 101039C4TA01057D
21
1
2
Figure 8 3
4
5
6
7
02 00 -02 -04
0
5
10
15
20j
A
cm
-2
E V (vs SCE)
Y2O
3
GO
5GOY
02 01 00 -01 -02 -0300
05
10
15
20
25
30
35
j A
cm
-2
E V (vs SCE)
Uv
Vis
Dark
5GOY
Page 22 of 24Journal of Materials Chemistry A
Jour
nalo
fMat
eria
lsC
hem
istr
yA
Acc
epte
dM
anus
crip
t
Publ
ishe
d on
26
Mar
ch 2
014
Dow
nloa
ded
by N
atio
nal C
hung
Hsi
ng U
nive
rsity
on
120
420
14 1
036
16
View Article OnlineDOI 101039C4TA01057D
22
1
2
Figure 9 3
4
400 450 500 550 600 650 700 750 800
Inte
ns
ity
a
u
Wavelength nm
20 GOY
5 GOY
Y2O
3
5
6
7
Page 23 of 24 Journal of Materials Chemistry A
Jour
nalo
fMat
eria
lsC
hem
istr
yA
Acc
epte
dM
anus
crip
t
Publ
ishe
d on
26
Mar
ch 2
014
Dow
nloa
ded
by N
atio
nal C
hung
Hsi
ng U
nive
rsity
on
120
420
14 1
036
16
View Article OnlineDOI 101039C4TA01057D
23
1
Figure 10 2
3
4
5
6
Page 24 of 24Journal of Materials Chemistry A
Jour
nalo
fMat
eria
lsC
hem
istr
yA
Acc
epte
dM
anus
crip
t
Publ
ishe
d on
26
Mar
ch 2
014
Dow
nloa
ded
by N
atio
nal C
hung
Hsi
ng U
nive
rsity
on
120
420
14 1
036
16
View Article OnlineDOI 101039C4TA01057D
2
attention due to fascinating properties such as quantum confinement and enhanced reactivity5 1
Up to date diverse photocatalytic materials have been introduced including TiO2 ZnO 2
Fe3O4 SnO2 and BiVO43 6-10
Graphene oxide (GO) a two-dimensional sheet of sp2
3
hybridized carbon composing of only carbon oxygen and hydrogen has a high specific 4
surface area and tunable electronic structure11ndash13
Due to its extraordinary physical properties 5
high chemical and thermal stability graphene has been receiving recent attention as a support 6
for catalysts13-15
Recently a TiO2 nanorod-decorated graphene sheets has been prepared by 7
Jang and coworkers14
This nanocomposite had highly efficient photocatalytic activities under 8
visible-light irradiation Wang et al has reported a high-performance and recyclable 9
visible-light photocatalysis cobalt ferrite and graphene composite15
The spontaneous 10
exfoliated GO as an auxiliary co-catalyst has been reported that it can remarkably enhanced 11
the photocatalytic hydrogen production of TiO216
Although graphene has shown potential 12
applications in water treatment as a photocatalyst further optimization or modification of the 13
GO structure is still necessary for enhancing its photocatalytic activity 14
Impurity doping with proper oxidation state is useful for red shifting the absorption edge 15
as well as reducing the rate of electron-hole pairrsquos recombination which improves the 16
photocatalytic activity of a photocatalyst41718
It is reported that yttrium doping in TiO2 gives 17
improved photocatalytic response attributed to the visible light absorption electron-hole 18
pairrsquos separation higher interfacial charge transfer lower crystallite size and high specific 19
surface area419-21
This property enhances the performance of Y-based catalysts used in 20
wastewater treatment 21
In this work a novel yttrium-doped GO (GOY) was firstly synthesized via hydrothermal 22
method with different GO doping concentration The as-synthesized samples were 23
characterized by XRD FT-IR FESEM HRTEM and XPS The corresponding photocatalytic 24
activity was evaluated by measuring the photocatalytic degradation of methylene blue (MB) 25
and methlene orange (MO) degradation under UV irradiation A possible 26
mechanism of photocatalysis was also been presented based on the results of 27
photoelectrochemical analysis and PL spectra 28
29
30
Page 3 of 24 Journal of Materials Chemistry A
Jour
nalo
fMat
eria
lsC
hem
istr
yA
Acc
epte
dM
anus
crip
t
Publ
ishe
d on
26
Mar
ch 2
014
Dow
nloa
ded
by N
atio
nal C
hung
Hsi
ng U
nive
rsity
on
120
420
14 1
036
16
View Article OnlineDOI 101039C4TA01057D
3
2 Experimental 1
Yttrium (III) nitrate hexahydrate (Y(NO3)3middot6H2O) polyvinylpyrrolidone ((C6H9NO)n) 2
ethanol graphite NaCl H2SO4 H2O2 P2O5 and K2S2O7 were purchased from Sinopharm 3
Chemical Reagent Company TiO2 P25 was obtained from Evonik Industries All the reagents 4
were of analytical grade and used as received without further treatment All solutions were 5
prepared with DI water 6
21 Preparation of Y2O3 and GO Y2O3 composite catalysts 7
GO was prepared via a modified Hummer method as reported previously22
In a typical 8
synthesis procedure 0776 g Yttrium (III) nitrate hexahydrate (Y(NO3)3middot6H2O) 0223g 9
polyvinylpyrrolidone ((C6H9NO)n) and certain amounts of GO were dissolved in a 7 mL DI 10
water and 33 mL ethanol Then the solution dissolved under magnetic stirring The obtained 11
transparent solution was transferred into a 50 mL polytetrafluoroethylene (PTFE) 12
(Teflon)-lined steel autoclaves and heated at 180 oC for 16 h After cooling to ambient 13
temperature the precipitate was centrifuged washed several times with ethanol and dried at 14
60 oC in an oven As a control experiment Y2O3 nanoparticles were prepared under the same 15
conditions without adding GO The Y-doped GO composite containing 5 10 20 and 50 mg 16
GO are denoted as 5 GOY 10 GOY 20 GOY and 50 GOY respectively 17
22 Characterization 18
The X-ray diffraction (XRD) patterns were obtained by a Bruker D8 advance X-ray 19
diffractometer using monochromatic Cu Kα radiation (λ = 15406 Aring) with an accelerating 20
voltage of 40 kV and current of 40 mA The 2θ range used in the measurement was from 10 21
to 70 The FT-IR spectra of the samples were measured on a Cary 610670 microscope 22
(Varian US) with scanning from 4000 to 400 cm-1
by using KBr pellets under ambient 23
temperature Thermogravimetric analysis (TGA) was performed with a PE Pyris-1 instrument 24
at a heating rate of 10 oC min
-1 under N2 atmosphere Field emission scanning electron 25
microscopy (FESEM) was examined on a field-emission scanning electron microanalyzer 26
(Hitachi S-4800 Japan) Energy dispersive X-ray spectroscopy (EDX) was performed on a 27
XL-30ESEM scanning electron microscopy High-resolution transmission electron 28
microscopy (HRTEM) was recorded on a Tecnai G2 F30 S-TWIN transmission electron 29
microscopes X-ray photoelectron spectroscopy (XPS) measurements were carried out with 30
Page 4 of 24Journal of Materials Chemistry A
Jour
nalo
fMat
eria
lsC
hem
istr
yA
Acc
epte
dM
anus
crip
t
Publ
ishe
d on
26
Mar
ch 2
014
Dow
nloa
ded
by N
atio
nal C
hung
Hsi
ng U
nive
rsity
on
120
420
14 1
036
16
View Article OnlineDOI 101039C4TA01057D
4
an ESCALAB 250 photoelectron spectrometer using Al Kα radiation (Thermo-VG Scientific 1
US) The photoluminescence (PL) spectra were measured with a JY HRD double grating 2
monochromator at room temperature 3
23 Degradation of methylene blue (MB) and methylene orange (MO) 4
Photocatalysis experiments were carried out in a BL-GHX-V photochemical reactor 5
(Shanghai Bilon Instrument Co Ltd) The UV source (λ lt 420 nm) was provided by a 500 W 6
high-pressure mercury lamp Reactor and UV source were surrounded by a circulating water 7
jacket to maintain constant temperature UV irradiation photocatalytic activities of GO Y2O3 8
and GOY composite were evaluated through the degradation of MB and MO 9
A stock solution of MB (or MO) at 1000 ppm was prepared using DI water In a typical 10
run 005 g of photocatalyst was dispersed in a 20 mL MB (or MO) (25 ppm) Then the 11
suspension was stirred for 30 min in the dark to ensure adsorptiondesorption equilibrium 12
before light illumination At each specific sampling time aqueous sample was withdrawn by 13
a 5 mL syringe and filtered immediately by a 022 μm filter film to remove the catalyst 14
particles before analysis All experiments were repeated at least two times and averages were 15
reported The concentration of MB (or MO) was then determined by measuring the 16
absorbance at λmax 600 nm via UV-vis spectrophotometer To determine the catalytic 17
recycling properties the catalyst was separated after reaction for 30 min and washed 18
thoroughly with ultrapure water and ethanol followed by drying at 60 oC for 12 h in vacuum 19
oven Finally the catalyst was separated by magnet and redispersed in a new reaction system 20
for subsequent catalytic experiments under the same reaction conditions The reduction ratio 21
of MB (or MO) was calculated using the following expression 22
Degradation ratio of MB = times100 23
where A0 and At were the absorbance intensities when illuminated for 0 (that is just after the 24
dark adsorption) and t min respectively 25
24 Photoelectrochemical Measurements 26
All photoelectrochemical characteristics were performed in the electrolytic cell 27
consisted of a GO Y2O3 or GOY composites (2 mg mL-1 100 μL) coated FTO glass working 28
electrode (2cm2cm) a platinum wire counter electrode and a saturated calomel reference 29
Page 5 of 24 Journal of Materials Chemistry A
Jour
nalo
fMat
eria
lsC
hem
istr
yA
Acc
epte
dM
anus
crip
t
Publ
ishe
d on
26
Mar
ch 2
014
Dow
nloa
ded
by N
atio
nal C
hung
Hsi
ng U
nive
rsity
on
120
420
14 1
036
16
View Article OnlineDOI 101039C4TA01057D
5
electrode (SCE) on a Model CHI 660E electrochemical workstation under a 500 W 1
high-pressure mercury lamp irradiation 2
3
3 Results and discussion 4
31 FT-IR spectra XRD and TGA Analysis 5
FT-IR measurement is employed to investigate the bonding interactions in GO before 6
and after the oxidation process FT-IR spectra of GO Y2O3 and 5 GOY are shown in Fig 1 7
In the spectrum of GO the peak at about 1721 cm-1
is attributed to the stretching vibrations of 8
C=O The peaks appear at about 1223 and 1564 cm-1
correspond to the stretching vibrations 9
of C-O and C=C respectively23
The FT-IR spectra of Y2O3 and 5 GOY composite have 10
similar curve shape while a new peak appears at 1550 cm-1
of 5 GOY This result indicates 11
the GO has successfully composited with Y2O3 12
Fig 2 shows the crystal structure of GO Y2O3 and 5 GOY composite GO shows a 13
sharp peak at 2θ = 105o corresponding to the (001) reflection of graphite oxide
152425 The 14
diffraction peaks observed at 2θ = 421deg originate from disorderedly stacked GO sheets26
The 15
peaks located at 198deg 286deg 351deg 501deg 494deg and 512deg (2θ) result from the presence of 16
Y2O3 which are in agreement with the theoretical data of hematite (JCPDS No 41-0015)2728
17
In the pattern of 5 GOY the presence of diffraction peak at 2θ of 421deg indicating that GO 18
exists in the composite material It should be noted that there is a diffraction peak observed at 19
2θ = 101deg on both patterns of Y2O3 and 5 GOY which originates from intermediate YO(OH) 20
structure27
21
Fig 3 presents results of TGA analysis of the as-synthesized GO Y2O3 and 5 GOY 22
composite powder The samples were heated from room temperature to 600 degC at 5 degC min-1
23
under N2 flow As can be seen in Fig3 GO starts to lose mass upon heating even below 24
100 degC The major mass loss occurs at about 200 degC is caused by pyrolysis of the 25
oxygen-containing functional groups generating CO CO2 and stream29-31
Y2O3 and 5 GOY 26
have the same shape and show mass losses at three temperature ~100 320 and 400 degC The 27
first mass loss at about 100 degC is related to dehydration of free and physically absorbed 28
molecular water The next mass loss at about 320 degC is supposed to be related with the first 29
dehydration of chemisorbed and combined water from Y(OH)33233
The third mass loss at 30
Page 6 of 24Journal of Materials Chemistry A
Jour
nalo
fMat
eria
lsC
hem
istr
yA
Acc
epte
dM
anus
crip
t
Publ
ishe
d on
26
Mar
ch 2
014
Dow
nloa
ded
by N
atio
nal C
hung
Hsi
ng U
nive
rsity
on
120
420
14 1
036
16
View Article OnlineDOI 101039C4TA01057D
6
about 400 degC confirms dehydration of structural water from YOOH phase34
1
32 Morphology Characterization 2
The morphology of the as-obtained samples are examined by FESEM It can be 3
observed in Fig 4A that the as-prepared Y2O3 illustrates a uniform flake-like shape with 4
irregular edges Its lateral size ranges from 70 to 150 nm and thickness is around 10 to 20 nm 5
It can be observed that the prepared graphene oxide illustrates the flake-like shape and 6
layer-layer structure of graphene oxide edges (Fig 4B) Fig 4C and D displays the 7
morphologies of 5 GOY and 20 GOY composites respectively As can be seen with GO 8
content increasing the flake-like structure becomes irregular At the same time GO and Y2O3 9
aggregate The EDX profile (Fig 4D insert) exhibits strong carbon oxygen and yttrium peaks 10
Fig 4E and F exhibit HRTEM images of the GOY composite As shown in Fig 4E and F the 11
lattice fringes of Y2O3 nanocrystals and GO are simultaneously observed indicating strong 12
interactions between Y and the GO support The resolved lattice fringes of (111) planes (d = 13
031 nm) are attributed to GO and the lattice fringes of (111) planes (d = 027 nm) are 14
assigned to Y2O3 nanocrystals 15
33 XPS analysis 16
Fig 5A shows the XPS full survey spectra in the binding energy range of 0-1100 eV for 17
GO Y2O3 5 GOY and 20 GOY composite As shown in Fig 5A all the samples contain C 18
and O however the Y-contained samples show two peaks at about 1582 eV and 1600 eV 19
which are attributed to Y6 Fig 5B-D shows the high-resolution XPS regional spectra of Y 3d 20
O 1s and C 1s for 5 GOY respectively The relatively strong peaks at 1581 eV and 1599 eV 21
can be attributed to Y 3d52 and Y 3d32 respectively (Fig 5B) These results are in agreement 22
with values of Y2O3 reported in the literature35
It is well reported that yttrium retards the 23
combination of photogenerated electron-hole pairs41718
this may be due to the presence of 24
extra hydroxyl species to delay recombination through hole trapping6 Three kinds of surface 25
oxygen species could be distinguished in the O 1s spectra as shown in Fig 5C The binding 26
energy of 5309 eV 5318 and 5330 eV are ascribed to the lattice oxygen the hydroxyl 27
groups and the C-OH respectively36
As shown in Fig 5D the XPS spectrum of C 1s from 5 28
GOY is collected which can be deconvoluted into four peaks sp2 bonded carbon at 2848 eV 29
(CndashC) epoxyhydroxyls at 2860 eV (CndashO) carbonyls at 2879 eV (C=O) and carboxyls at 30
Page 7 of 24 Journal of Materials Chemistry A
Jour
nalo
fMat
eria
lsC
hem
istr
yA
Acc
epte
dM
anus
crip
t
Publ
ishe
d on
26
Mar
ch 2
014
Dow
nloa
ded
by N
atio
nal C
hung
Hsi
ng U
nive
rsity
on
120
420
14 1
036
16
View Article OnlineDOI 101039C4TA01057D
7
2891 eV (OndashC=O) indicating the high percentage of oxygen-contained functional groups37
1
Chemisorbed surface hydroxyl groups can enhance photocatalysis by trapping photoinduced 2
holes resulting in an increase in the formation of highly oxidizing OH radicals38
3
34 Photocatalytic Activity for dye degradation 4
For comparative purposes the photodegradation efficiencies of MB and MO mediated 5
by the different photocatalysts under UV irradiation are shown in Fig 6 Before comparison 6
the adsorption and photodegradation performances of GO Y2O3 and 5 GOY on MB were 7
investigated (Fig S1) As displayed in Fig S1 both Y2O3 and 5 GOY have good adsorption 8
affinity to MB After stirring for 30 min under dark about 80 MB could be absorbed by 9
Y2O3 and 5 GOY which is much better than GO (lower than 20) After photocatalysis for 10
35min MB can be degraded thoroughly by 5 GOY Then the photocatalytic activities of the 11
GO Y2O3 5 GOY 10 GOY 20 GOY and 50 GOY composite photocatalysts were compared 12
via the reduction of MB and MO under ambient temperature Photodegradation time is 35 13
min It has been reported that a large surface area helps to increase the photocatalytic reaction 14
sites39
From the O1s spectrum of Y2O3 (Fig S2 supplementary material) the oxygen 15
composition of Y2O3 and 5 GOY samples at different states (Table S1 supplementary 16
material) more OH radicals are available in 5 GOY As expected under UV irradiation the 17
degradation of MB is slower than 10 with a GO photocatalyst However the conversion of 18
MB reaches 95 after 35 min when using Y2O3 as a photocatalyst The four kinds of GOY 19
samples exhibite better photocatalytic properties in the degradation of MB than bare GO and 20
Y2O3 under UV irradiation Moreover with increasing the amount of GO the degradation of 21
MB increases slowly Considering the simplicity and economy of the MB degradation 5 22
GOY is selected as the photocatalyst in the following experiments The photocatalytic 23
activities of 5 GOY was compared with commercial TiO2 P25 (Fig S3 supplementary 24
material) indicating the photocatalytic property of 5 GOY was quite comparable with P25 25
The GOY composites also have photocatalytic activities to MO As can be seen in Fig 6 GO 26
has good affinity to MO and the 50 GOY has best degradation efficiency to MO among the 27
GOY composites 28
The photocatalyst dosage may affect the MB degradation efficiency Fig 7A illustrates 29
MB degradation at varying photocatalyst dosages (5 to 10 mg) MB degradation efficiency 30
Page 8 of 24Journal of Materials Chemistry A
Jour
nalo
fMat
eria
lsC
hem
istr
yA
Acc
epte
dM
anus
crip
t
Publ
ishe
d on
26
Mar
ch 2
014
Dow
nloa
ded
by N
atio
nal C
hung
Hsi
ng U
nive
rsity
on
120
420
14 1
036
16
View Article OnlineDOI 101039C4TA01057D
8
increases with increasing the contact time In addition with increasing the dosage the MB 1
degradation efficiency slowly increases As displayed in Fig 7A the best dosage is 10 mg 2
As the MB concentration may also influence degradation MB degradation under various 3
concentration of MB is investigated It can be seen clearly in Fig 7B that MB conversion 4
efficiency is as much as 100 after degradation for 35 min when the MB concentration is 5
lower than 25 mg L-1
The conversion efficiency will decrease when the MB concentration is 6
higher than 275 mg L-1
The final conversion efficiency will no more than 90 if 300 mg 7
L-1
MB solution is used 8
Because the solution pH can remarkably influence MB degradation the effect of initial 9
pH on the degradation of MB with 5 GOY catalyst is determined as presented in Fig 7C As 10
shown in Fig 7C the conversion of MB will finally reach 100 when the solution pH is 11
lower than 519 If the solution pH controlled at 63 the conversion efficiency will decrease 12
sharply and only 80 MB will convert after 35 min Therefore the solution pH is set at 41 13
35 Photocatalytic mechanism 14
The magnitude of the photocurrent represents the charge collection efficiency of the 15
electrode surface and indirectly indicates the separated efficiency of electron-hole pairs40
16
From the insert of Fig 8 5 GOY modified photoelectrode is prompted in generating 17
photocurrent under visible and UV-visible light GOY photoelectrodes yield the greater 18
photocurrent than Y2O3 photoelectrode under UV irradiation in Fig 8 19
Fig 9 shows the PL spectra of the Y2O3 and GOY photocatalysts With Y2O3 as 20
photocatalyst the PL signal centered around 450 nm is detected revealing that ∙OH radicals 21
are generated on the irradiated Y2O3 When GOY nanocomposites are used as the 22
photocatalysts the PL signal intensity is increased which suggests that the yield of ∙OH 23
radicals is enhanced on the irradiated GOY nanocomposite The enhancement in 24
photoactivity can be attributed to the remarkable synergistic effect of the combination of 25
Y2O3 and the GO sheets leading to the efficient separation of photogenerated carriers in the 26
Y2O3 and GO coupling system 27
It is well known that the photodegradation process of the photocatalysts is strongly 28
relative to electron-hole pairs generated by light irradiation on catalysts The photogenerated 29
electrons and holes can migrate to the surface of the catalysts and then can be trapped 30
Page 9 of 24 Journal of Materials Chemistry A
Jour
nalo
fMat
eria
lsC
hem
istr
yA
Acc
epte
dM
anus
crip
t
Publ
ishe
d on
26
Mar
ch 2
014
Dow
nloa
ded
by N
atio
nal C
hung
Hsi
ng U
nive
rsity
on
120
420
14 1
036
16
View Article OnlineDOI 101039C4TA01057D
9
generally by the oxygen and surface hydroxyls to ultimately produce hydroxyl radicals (middotOH) 1
that react with the adsorbed reactants41
As we know Y2O3 is n-type semiconductor with a 2
wide band gap about 56 eV42
To understand the charge separation process of Y2O3 and 3
GOYs the band edge positions of conduction band (CB) and valence band (VB) of 4
semiconductor Y2O3 has been calculated by the following equation43
5
EVB = X - Ee + 05Eg (1) 6
ECB = EVB - Eg (2) 7
where is the absolute electronegativity of the semiconductor e is the energy of free 8
electrons on the hydrogen scale (sim45 eV) and g is the bandgap energy of the 9
semiconductor The value of for Y2O3 is obtained by the arithmetic mean of the electron 10
affinity and the first ionization of the constituent atoms reported in the literatures44
to be 535 11
eV Thus the CB and VB potentials of Y2O3 are calculated to be -195 and 365 eV versus 12
normal hydrogen electrode (NHE) respectively It can be seen that the VB potential of 13
sample is more positive than the redox potential of OHminus∙OH (189 VNHE) indicating that 14
the photogenerated holes have strong oxidative ability and they can oxidize OHminus into ∙OH In 15
addition the CB potential of sample is negative enough to reduce O2 to O2∙ minus
(minus013 VNHE) 16
via eminus 17
Based on these results a possible mechanism for the photocatalytic is proposed as 18
follows and shown in Fig 10 19
Y2O3 + hν rarr Y2O3 (h+e) (3) 20
Y2O3 (e) + GO rarr Y2O3 + GO (e) (4) 21
GO (e) + O2 rarr GO + O2bullminus (5) 22
Y2O3 (h) + OHminus rarrY2O3 + OH
bull (6) 23
Y2O3 (h) + O2bullminus
+ OHbull + MB rarr CO2 +H2O+SO4
2minus + NO3
minus + Cl
minus (7) 24
25
4 Conclusions 26
In conclusion a novel GOY nanocomposite with different GO content has been obtained 27
via a one-step hydrothermal method The FT-IR XRD EDX and XPS results showed the 28
yttrium was successfully composited with GO The morphology characterization showed the 29
as-obtained GOY had nanoflake structure After stirring for 30 min under dark about 80 30
Page 10 of 24Journal of Materials Chemistry A
Jour
nalo
fMat
eria
lsC
hem
istr
yA
Acc
epte
dM
anus
crip
t
Publ
ishe
d on
26
Mar
ch 2
014
Dow
nloa
ded
by N
atio
nal C
hung
Hsi
ng U
nive
rsity
on
120
420
14 1
036
16
View Article OnlineDOI 101039C4TA01057D
10
MB could be absorbed by Y2O3 and 5 GOY The as-prepared GOY had good degradation 1
performance on both MB and MO under UV irradiation Compared with other GOY 2
composites 5 GOY had better photocatalytic activity to MB Factors such as dosages of 3
photocatalyst contaminant concentration and solution pH on MB conversion were also 4
investigated and discussed The catalyst also showed good stability and recyclability It is 5
expected that the GOY nanocomposite would be a potential candidate for treatment of dye 6
containing wastewater 7
8
Acknowledgments 9
This work was supported by the National Natural Science Foundation of China (No 10
21307104) Natural Science Foundation of Jiangsu Province China (NoBK20130438) the 11
Scientific Research Project of Environmental Fund of Yangzhou City (YHK1303) and 12
Jiangsu Key Laboratory of Environmental Material and Engineering (K12031) We thank the 13
Testing Center of Yangzhou University for sample characterization 14
15
Notes and References 16
1 B K Korbahti K Artut C Gecgel A Ozer Chem Eng J 2011 173 677-688 17
2 V K Gupta D Pathania S Agarwal P Singh J Hazard Mater 2012 243 179-186 18
3 N Wetchakun S Chaiwichain B Inceesungvorn K Pingmuang S Phanichphant A I 19
Minett J Chen ACS Appl Mater Interfaces 2012 4 3718-3723 20
4 Y F Li D Xu J I Oh W Shen X Li Y Yu ACS Catal 2012 2 391-398 21
5 M Khan W B Cao J Mol Catal A Chem 2013 376 71-77 22
6 Y F Wu Q J Zhang X F Yin H Q Cheng RSC Advances 2013 3 9670-9676 23
7 F H Chu C W Huang C L Hsin C W Wang S Y Yu P H Yeh W W Wu 24
Nanoscale 2012 4 1471-1475 25
8 L J Xu J L Wang Environ Sci Technol 2012 46 10145-10153 26
9 Y C Zhang J Li H Y Xu Appl Catal B 2012 123-124 18-26 27
10 S Usai S Obreg n A I Becerro G ol n J Phys Chem C 2013 117 24479-24484 28
11 A K Geim K S Novoselov Nat Mater 2007 6 183-191 29
12 K-Y Shin J-Y Hong J Jang Adv Mater 2011 23 2113-2118 30
Page 11 of 24 Journal of Materials Chemistry A
Jour
nalo
fMat
eria
lsC
hem
istr
yA
Acc
epte
dM
anus
crip
t
Publ
ishe
d on
26
Mar
ch 2
014
Dow
nloa
ded
by N
atio
nal C
hung
Hsi
ng U
nive
rsity
on
120
420
14 1
036
16
View Article OnlineDOI 101039C4TA01057D
11
13 G K Pradhan D K Padhi K M Parida ACS Appl Mater Interfaces 2013 5 1
9101-9110 2
14 E Lee J Y Hong H Kang J Jang J Hazard Mater 2012 219-220 13-18 3
15 Y S Fu H Q Chen X Q Sun X Wang Appl Catal B 2012 111-112 280-287 4
16 K Krishnamoorthy R Mohan S J Kim Appl Phys Lett 2011 98 244101 5
17 M Li J Zhang Y Zhang Chem Phys Lett 2012 527 63-66 6
18 F Meng J Li Z Hong M Zhi A Sakla C Xiang N Wu Catal Today 2013 199 7
48-52 8
19 H Zhang K Tan H Zheng Y Gu W F Zhang Mater Chem Phys 2011 125 9
156-160 10
20 X Niu S Li H Chu J Zhou J Rare Earths 2011 29 225-229 11
21 H Narayan H Alemu L Setofolo L Macheli ISRN Phys Chem 2012 841521 1-9 12
22 M J Allen V C Tung R B Kaner Chem Rev 2010 110 132-145 13
23 F Y Ban S R Majid N M Huang H N Lim Int J Electrochem Sci 2012 7 14
4345-4351 15
24 Y L Min G Q He Q J Xu Y C Chen J Mater Chem A 2014 2 1294-1301 16
25 W Fan W Gao C Zhang W W Tjiu J S Pan T X Liu J Mater Chem 2012 22 17
25108-25115 18
26 Z -S Wu W Ren L Wen L Gao J Zhao Z Chen G Zhou F Li H -M Cheng ACS 19
Nano 2010 4 3187-3194 20
27 J A Dorman Y B Mao J R Bargar J P Chang J Phys Chem C 2010 114 21
17422-17427 22
28 R P Ermakov VV Voronov P P Fedorov Nanosystems physics chemistry 23
mathematics 2013 4 (2) 196-205 24
29 A Lerf H He M Forster J Klinowski J Phys Chem B 1998102(23) 4477-4482 25
30 G Wang Z Yang X Li C Li Carbon 2005 43(12) 2564-2570 26
31 S Stankovich D A Dikin R D Piner K A Kohlhaas A Kleinhammes Y Y Jia Y 27
Wu S T Nguyen R S Ruoff Carbon 2007 45 1558-1565 28
32 M Aghazadeh A Nozad H Adelkhani M Ghaemi J Electrochem Soc 2010 157 29
D519-D522 30
Page 12 of 24Journal of Materials Chemistry A
Jour
nalo
fMat
eria
lsC
hem
istr
yA
Acc
epte
dM
anus
crip
t
Publ
ishe
d on
26
Mar
ch 2
014
Dow
nloa
ded
by N
atio
nal C
hung
Hsi
ng U
nive
rsity
on
120
420
14 1
036
16
View Article OnlineDOI 101039C4TA01057D
12
33 L Nan Y Kazumichi J Solid State Chem 2008 181 1738-1743 1
34 R Srinivasan N R Yogamalar J Elanchezhiyan R J Joseyphus A C Bose J Alloy 2
Compd 2010 496 472-477 3
35 S Somacescu J M C Moreno P Osiceanu B L Su V Parvulescu J Phys Chem C 4
2010 114 19365 5
36 J H Pan W I Lee Chem Mater 2006 18 847-853 6
37 Y Chen B H Song X S Tang L Lu J M Xue J Mater Chem 2012 22 7
17656-17662 8
38 J Xu Y Chang Y Zhang S Ma Y Qu C Xu Appl Surf Sci 2008 255 1996-1999 9
39 LP Zhu NC Bing LL Wang HY Jin GH Liao LJ Wang Dalton Trans 2012 41 10
2959-2965 11
40 Z Pei L Ding H Lin S Weng Z Zheng Y Hou P Liu J Mater Chem A 2013 1 12
10099-10102 13
41Y L Pan S Z Deng L Polavarapu N Y Gao P Y Yuan C H Sow Q H Xu 14
Langmuir 2012 28 12304-12310 15
42 P Rouffignac J S Park R G Gordon Chem Mater 2005 17 4808-4814 16
43 H Xu H Li C Wu J Chu Y Yan H Shu Z Gu J Hazard Mater 2008 153 17
877-880 18
44 T Andersen H K Haugen H Hotop J Phys Chem Ref Data 1999 28(6) 1511-1533 19
20
Page 13 of 24 Journal of Materials Chemistry A
Jour
nalo
fMat
eria
lsC
hem
istr
yA
Acc
epte
dM
anus
crip
t
Publ
ishe
d on
26
Mar
ch 2
014
Dow
nloa
ded
by N
atio
nal C
hung
Hsi
ng U
nive
rsity
on
120
420
14 1
036
16
View Article OnlineDOI 101039C4TA01057D
13
Figure captions 1
2
Figure 1 FT-IR spectra of GO Y2O3 and 5 GOY composites 3
Figure 2 XRD patterns of GO Y2O3 and 5 GOY composites 4
Figure 3 TGA curves of GO Y2O3 and 5 GOY composites 5
Figure 4 FESEM images of (A) Y2O3 (Insert low magnification) (B) GO (C) 5 GOY and 6
(D) 20 GOY composites (Insert EDS spectrum of 20 GOY sample) (E) and (F) 7
HRTEM images of 5 GOY taken after intense ultrasonic dispersion in ethanol for 30 8
min 9
Figure 5 XPS spectra (A) full survey spectra of GO Y2O3 and GOY nanocomposite (B) Y 10
3d of 5 GOY (C) O 1s of 5 GOY (D) C 1s of 5 GOY 11
Figure 6 Comparison of photodegradation efficiency using as-synthesized GO Y2O3 and 12
GOY composites 13
Figure 7 (A) Effect of dosage on MB conversion MB concentration 25 ppm pH = 41 (B) 14
Effect of MB concentration on the degradation Dosage 10 mg pH = 41 (C) Effect of 15
solution pH on MB conversion MB concentration 25 ppm Dosage 10 mg 16
Figure 8 Photocurrent responses of GO Y2O3 and 5 GOY photoelectrodes under UV 17
illumination Insert Photocurrent responses of 5 GOY under different illumination 18
conditions Scan rate 50 mVs The electrolyte solution was 05 M NaCl 19
Figure 9 PL spectra of Y2O3 5 GOY and 20 GOY samples (λex = 258 nm) 20
Figure 10 Proposed mechanism for the photodegradation of MB on GOY composite21
Page 14 of 24Journal of Materials Chemistry A
Jour
nalo
fMat
eria
lsC
hem
istr
yA
Acc
epte
dM
anus
crip
t
Publ
ishe
d on
26
Mar
ch 2
014
Dow
nloa
ded
by N
atio
nal C
hung
Hsi
ng U
nive
rsity
on
120
420
14 1
036
16
View Article OnlineDOI 101039C4TA01057D
14
Figure 1 1
2
3
4
500 1000 1500 2000 2500 3000 3500 4000
1657
Tra
ns
mit
tan
ce
Wavenumber cm-1
1657
1550
1564 17211223
1436
1436
GO
Y2O
3
5GOY
5
6
Page 15 of 24 Journal of Materials Chemistry A
Jour
nalo
fMat
eria
lsC
hem
istr
yA
Acc
epte
dM
anus
crip
t
Publ
ishe
d on
26
Mar
ch 2
014
Dow
nloa
ded
by N
atio
nal C
hung
Hsi
ng U
nive
rsity
on
120
420
14 1
036
16
View Article OnlineDOI 101039C4TA01057D
15
Figure 2 1
2
3
10 20 30 40 50 60 70
5GOY2O
3
Inte
ns
ity
a
u
2degree
GO
Y2O
3
4
5
6
Page 16 of 24Journal of Materials Chemistry A
Jour
nalo
fMat
eria
lsC
hem
istr
yA
Acc
epte
dM
anus
crip
t
Publ
ishe
d on
26
Mar
ch 2
014
Dow
nloa
ded
by N
atio
nal C
hung
Hsi
ng U
nive
rsity
on
120
420
14 1
036
16
View Article OnlineDOI 101039C4TA01057D
16
Figure 3 1
2
0 100 200 300 400 500 60040
50
60
70
80
90
100
5GOY
Y2O
3
GO
We
igh
t
Temperature oC
3
4
Page 17 of 24 Journal of Materials Chemistry A
Jour
nalo
fMat
eria
lsC
hem
istr
yA
Acc
epte
dM
anus
crip
t
Publ
ishe
d on
26
Mar
ch 2
014
Dow
nloa
ded
by N
atio
nal C
hung
Hsi
ng U
nive
rsity
on
120
420
14 1
036
16
View Article OnlineDOI 101039C4TA01057D
17
Figure 4 1
2
3
4
5
6
7
8
9
10
11
12
13
14
15
16
17
18
19
20
21
22
23
24
25
26
27
28
29
30
31
32
33
34
35
36
37
38
39
40
41
Page 18 of 24Journal of Materials Chemistry A
Jour
nalo
fMat
eria
lsC
hem
istr
yA
Acc
epte
dM
anus
crip
t
Publ
ishe
d on
26
Mar
ch 2
014
Dow
nloa
ded
by N
atio
nal C
hung
Hsi
ng U
nive
rsity
on
120
420
14 1
036
16
View Article OnlineDOI 101039C4TA01057D
18
Figure 5 1
2
3
1200 1000 800 600 400 200 0
Y 3d
C 1s
20 GOY
5 GOY
Y2O
3
Inte
ns
ity
a
u
Binding Energy eV
GO
O 1s
A
150 155 160 165 170 175
Inte
ns
ity
a
u
Binding Energy eV
Y 3d32
BY 3d
52
4
5
6
526 528 530 532 534 536
Inte
ns
ity
a
u
Binding Energy eV
O 1sC
282 284 286 288 290 292
Inte
ns
ity
a
u
Binding Energy eV
C-C
C-OC=O O-C=O
DC 1s
7
8
Page 19 of 24 Journal of Materials Chemistry A
Jour
nalo
fMat
eria
lsC
hem
istr
yA
Acc
epte
dM
anus
crip
t
Publ
ishe
d on
26
Mar
ch 2
014
Dow
nloa
ded
by N
atio
nal C
hung
Hsi
ng U
nive
rsity
on
120
420
14 1
036
16
View Article OnlineDOI 101039C4TA01057D
19
1
Figure 6 2
3
00
02
04
06
08
10
12
Y2O
3
20GOY
50GOY
10GOY
5GOYCo
nv
ers
ion
Photocatalysts
MO
MB
GO
4
5
6
7
8
Page 20 of 24Journal of Materials Chemistry A
Jour
nalo
fMat
eria
lsC
hem
istr
yA
Acc
epte
dM
anus
crip
t
Publ
ishe
d on
26
Mar
ch 2
014
Dow
nloa
ded
by N
atio
nal C
hung
Hsi
ng U
nive
rsity
on
120
420
14 1
036
16
View Article OnlineDOI 101039C4TA01057D
20
Figure 7 1
2
-5 0 5 10 15 20 25 30 35 40060
070
080
090
Co
nv
ers
ion
Time min
5 mg
6 mg
7 mg
8 mg
9 mg
10 mg
A100
-5 0 5 10 15 20 25 30 35 40
060
070
080
090
Co
nv
ers
ion
Time min
200 mg L-1
225 mg L-1
250 mg L-1
275 mg L-1
300 mg L-1
B100
3
4
-5 0 5 10 15 20 25 30 35 40
110
050
060
070
080
090
Co
nv
ers
ion
Time min
pH 303
pH 418
pH 519
pH 630
100
C
5
6
7
8
9
Page 21 of 24 Journal of Materials Chemistry A
Jour
nalo
fMat
eria
lsC
hem
istr
yA
Acc
epte
dM
anus
crip
t
Publ
ishe
d on
26
Mar
ch 2
014
Dow
nloa
ded
by N
atio
nal C
hung
Hsi
ng U
nive
rsity
on
120
420
14 1
036
16
View Article OnlineDOI 101039C4TA01057D
21
1
2
Figure 8 3
4
5
6
7
02 00 -02 -04
0
5
10
15
20j
A
cm
-2
E V (vs SCE)
Y2O
3
GO
5GOY
02 01 00 -01 -02 -0300
05
10
15
20
25
30
35
j A
cm
-2
E V (vs SCE)
Uv
Vis
Dark
5GOY
Page 22 of 24Journal of Materials Chemistry A
Jour
nalo
fMat
eria
lsC
hem
istr
yA
Acc
epte
dM
anus
crip
t
Publ
ishe
d on
26
Mar
ch 2
014
Dow
nloa
ded
by N
atio
nal C
hung
Hsi
ng U
nive
rsity
on
120
420
14 1
036
16
View Article OnlineDOI 101039C4TA01057D
22
1
2
Figure 9 3
4
400 450 500 550 600 650 700 750 800
Inte
ns
ity
a
u
Wavelength nm
20 GOY
5 GOY
Y2O
3
5
6
7
Page 23 of 24 Journal of Materials Chemistry A
Jour
nalo
fMat
eria
lsC
hem
istr
yA
Acc
epte
dM
anus
crip
t
Publ
ishe
d on
26
Mar
ch 2
014
Dow
nloa
ded
by N
atio
nal C
hung
Hsi
ng U
nive
rsity
on
120
420
14 1
036
16
View Article OnlineDOI 101039C4TA01057D
23
1
Figure 10 2
3
4
5
6
Page 24 of 24Journal of Materials Chemistry A
Jour
nalo
fMat
eria
lsC
hem
istr
yA
Acc
epte
dM
anus
crip
t
Publ
ishe
d on
26
Mar
ch 2
014
Dow
nloa
ded
by N
atio
nal C
hung
Hsi
ng U
nive
rsity
on
120
420
14 1
036
16
View Article OnlineDOI 101039C4TA01057D
3
2 Experimental 1
Yttrium (III) nitrate hexahydrate (Y(NO3)3middot6H2O) polyvinylpyrrolidone ((C6H9NO)n) 2
ethanol graphite NaCl H2SO4 H2O2 P2O5 and K2S2O7 were purchased from Sinopharm 3
Chemical Reagent Company TiO2 P25 was obtained from Evonik Industries All the reagents 4
were of analytical grade and used as received without further treatment All solutions were 5
prepared with DI water 6
21 Preparation of Y2O3 and GO Y2O3 composite catalysts 7
GO was prepared via a modified Hummer method as reported previously22
In a typical 8
synthesis procedure 0776 g Yttrium (III) nitrate hexahydrate (Y(NO3)3middot6H2O) 0223g 9
polyvinylpyrrolidone ((C6H9NO)n) and certain amounts of GO were dissolved in a 7 mL DI 10
water and 33 mL ethanol Then the solution dissolved under magnetic stirring The obtained 11
transparent solution was transferred into a 50 mL polytetrafluoroethylene (PTFE) 12
(Teflon)-lined steel autoclaves and heated at 180 oC for 16 h After cooling to ambient 13
temperature the precipitate was centrifuged washed several times with ethanol and dried at 14
60 oC in an oven As a control experiment Y2O3 nanoparticles were prepared under the same 15
conditions without adding GO The Y-doped GO composite containing 5 10 20 and 50 mg 16
GO are denoted as 5 GOY 10 GOY 20 GOY and 50 GOY respectively 17
22 Characterization 18
The X-ray diffraction (XRD) patterns were obtained by a Bruker D8 advance X-ray 19
diffractometer using monochromatic Cu Kα radiation (λ = 15406 Aring) with an accelerating 20
voltage of 40 kV and current of 40 mA The 2θ range used in the measurement was from 10 21
to 70 The FT-IR spectra of the samples were measured on a Cary 610670 microscope 22
(Varian US) with scanning from 4000 to 400 cm-1
by using KBr pellets under ambient 23
temperature Thermogravimetric analysis (TGA) was performed with a PE Pyris-1 instrument 24
at a heating rate of 10 oC min
-1 under N2 atmosphere Field emission scanning electron 25
microscopy (FESEM) was examined on a field-emission scanning electron microanalyzer 26
(Hitachi S-4800 Japan) Energy dispersive X-ray spectroscopy (EDX) was performed on a 27
XL-30ESEM scanning electron microscopy High-resolution transmission electron 28
microscopy (HRTEM) was recorded on a Tecnai G2 F30 S-TWIN transmission electron 29
microscopes X-ray photoelectron spectroscopy (XPS) measurements were carried out with 30
Page 4 of 24Journal of Materials Chemistry A
Jour
nalo
fMat
eria
lsC
hem
istr
yA
Acc
epte
dM
anus
crip
t
Publ
ishe
d on
26
Mar
ch 2
014
Dow
nloa
ded
by N
atio
nal C
hung
Hsi
ng U
nive
rsity
on
120
420
14 1
036
16
View Article OnlineDOI 101039C4TA01057D
4
an ESCALAB 250 photoelectron spectrometer using Al Kα radiation (Thermo-VG Scientific 1
US) The photoluminescence (PL) spectra were measured with a JY HRD double grating 2
monochromator at room temperature 3
23 Degradation of methylene blue (MB) and methylene orange (MO) 4
Photocatalysis experiments were carried out in a BL-GHX-V photochemical reactor 5
(Shanghai Bilon Instrument Co Ltd) The UV source (λ lt 420 nm) was provided by a 500 W 6
high-pressure mercury lamp Reactor and UV source were surrounded by a circulating water 7
jacket to maintain constant temperature UV irradiation photocatalytic activities of GO Y2O3 8
and GOY composite were evaluated through the degradation of MB and MO 9
A stock solution of MB (or MO) at 1000 ppm was prepared using DI water In a typical 10
run 005 g of photocatalyst was dispersed in a 20 mL MB (or MO) (25 ppm) Then the 11
suspension was stirred for 30 min in the dark to ensure adsorptiondesorption equilibrium 12
before light illumination At each specific sampling time aqueous sample was withdrawn by 13
a 5 mL syringe and filtered immediately by a 022 μm filter film to remove the catalyst 14
particles before analysis All experiments were repeated at least two times and averages were 15
reported The concentration of MB (or MO) was then determined by measuring the 16
absorbance at λmax 600 nm via UV-vis spectrophotometer To determine the catalytic 17
recycling properties the catalyst was separated after reaction for 30 min and washed 18
thoroughly with ultrapure water and ethanol followed by drying at 60 oC for 12 h in vacuum 19
oven Finally the catalyst was separated by magnet and redispersed in a new reaction system 20
for subsequent catalytic experiments under the same reaction conditions The reduction ratio 21
of MB (or MO) was calculated using the following expression 22
Degradation ratio of MB = times100 23
where A0 and At were the absorbance intensities when illuminated for 0 (that is just after the 24
dark adsorption) and t min respectively 25
24 Photoelectrochemical Measurements 26
All photoelectrochemical characteristics were performed in the electrolytic cell 27
consisted of a GO Y2O3 or GOY composites (2 mg mL-1 100 μL) coated FTO glass working 28
electrode (2cm2cm) a platinum wire counter electrode and a saturated calomel reference 29
Page 5 of 24 Journal of Materials Chemistry A
Jour
nalo
fMat
eria
lsC
hem
istr
yA
Acc
epte
dM
anus
crip
t
Publ
ishe
d on
26
Mar
ch 2
014
Dow
nloa
ded
by N
atio
nal C
hung
Hsi
ng U
nive
rsity
on
120
420
14 1
036
16
View Article OnlineDOI 101039C4TA01057D
5
electrode (SCE) on a Model CHI 660E electrochemical workstation under a 500 W 1
high-pressure mercury lamp irradiation 2
3
3 Results and discussion 4
31 FT-IR spectra XRD and TGA Analysis 5
FT-IR measurement is employed to investigate the bonding interactions in GO before 6
and after the oxidation process FT-IR spectra of GO Y2O3 and 5 GOY are shown in Fig 1 7
In the spectrum of GO the peak at about 1721 cm-1
is attributed to the stretching vibrations of 8
C=O The peaks appear at about 1223 and 1564 cm-1
correspond to the stretching vibrations 9
of C-O and C=C respectively23
The FT-IR spectra of Y2O3 and 5 GOY composite have 10
similar curve shape while a new peak appears at 1550 cm-1
of 5 GOY This result indicates 11
the GO has successfully composited with Y2O3 12
Fig 2 shows the crystal structure of GO Y2O3 and 5 GOY composite GO shows a 13
sharp peak at 2θ = 105o corresponding to the (001) reflection of graphite oxide
152425 The 14
diffraction peaks observed at 2θ = 421deg originate from disorderedly stacked GO sheets26
The 15
peaks located at 198deg 286deg 351deg 501deg 494deg and 512deg (2θ) result from the presence of 16
Y2O3 which are in agreement with the theoretical data of hematite (JCPDS No 41-0015)2728
17
In the pattern of 5 GOY the presence of diffraction peak at 2θ of 421deg indicating that GO 18
exists in the composite material It should be noted that there is a diffraction peak observed at 19
2θ = 101deg on both patterns of Y2O3 and 5 GOY which originates from intermediate YO(OH) 20
structure27
21
Fig 3 presents results of TGA analysis of the as-synthesized GO Y2O3 and 5 GOY 22
composite powder The samples were heated from room temperature to 600 degC at 5 degC min-1
23
under N2 flow As can be seen in Fig3 GO starts to lose mass upon heating even below 24
100 degC The major mass loss occurs at about 200 degC is caused by pyrolysis of the 25
oxygen-containing functional groups generating CO CO2 and stream29-31
Y2O3 and 5 GOY 26
have the same shape and show mass losses at three temperature ~100 320 and 400 degC The 27
first mass loss at about 100 degC is related to dehydration of free and physically absorbed 28
molecular water The next mass loss at about 320 degC is supposed to be related with the first 29
dehydration of chemisorbed and combined water from Y(OH)33233
The third mass loss at 30
Page 6 of 24Journal of Materials Chemistry A
Jour
nalo
fMat
eria
lsC
hem
istr
yA
Acc
epte
dM
anus
crip
t
Publ
ishe
d on
26
Mar
ch 2
014
Dow
nloa
ded
by N
atio
nal C
hung
Hsi
ng U
nive
rsity
on
120
420
14 1
036
16
View Article OnlineDOI 101039C4TA01057D
6
about 400 degC confirms dehydration of structural water from YOOH phase34
1
32 Morphology Characterization 2
The morphology of the as-obtained samples are examined by FESEM It can be 3
observed in Fig 4A that the as-prepared Y2O3 illustrates a uniform flake-like shape with 4
irregular edges Its lateral size ranges from 70 to 150 nm and thickness is around 10 to 20 nm 5
It can be observed that the prepared graphene oxide illustrates the flake-like shape and 6
layer-layer structure of graphene oxide edges (Fig 4B) Fig 4C and D displays the 7
morphologies of 5 GOY and 20 GOY composites respectively As can be seen with GO 8
content increasing the flake-like structure becomes irregular At the same time GO and Y2O3 9
aggregate The EDX profile (Fig 4D insert) exhibits strong carbon oxygen and yttrium peaks 10
Fig 4E and F exhibit HRTEM images of the GOY composite As shown in Fig 4E and F the 11
lattice fringes of Y2O3 nanocrystals and GO are simultaneously observed indicating strong 12
interactions between Y and the GO support The resolved lattice fringes of (111) planes (d = 13
031 nm) are attributed to GO and the lattice fringes of (111) planes (d = 027 nm) are 14
assigned to Y2O3 nanocrystals 15
33 XPS analysis 16
Fig 5A shows the XPS full survey spectra in the binding energy range of 0-1100 eV for 17
GO Y2O3 5 GOY and 20 GOY composite As shown in Fig 5A all the samples contain C 18
and O however the Y-contained samples show two peaks at about 1582 eV and 1600 eV 19
which are attributed to Y6 Fig 5B-D shows the high-resolution XPS regional spectra of Y 3d 20
O 1s and C 1s for 5 GOY respectively The relatively strong peaks at 1581 eV and 1599 eV 21
can be attributed to Y 3d52 and Y 3d32 respectively (Fig 5B) These results are in agreement 22
with values of Y2O3 reported in the literature35
It is well reported that yttrium retards the 23
combination of photogenerated electron-hole pairs41718
this may be due to the presence of 24
extra hydroxyl species to delay recombination through hole trapping6 Three kinds of surface 25
oxygen species could be distinguished in the O 1s spectra as shown in Fig 5C The binding 26
energy of 5309 eV 5318 and 5330 eV are ascribed to the lattice oxygen the hydroxyl 27
groups and the C-OH respectively36
As shown in Fig 5D the XPS spectrum of C 1s from 5 28
GOY is collected which can be deconvoluted into four peaks sp2 bonded carbon at 2848 eV 29
(CndashC) epoxyhydroxyls at 2860 eV (CndashO) carbonyls at 2879 eV (C=O) and carboxyls at 30
Page 7 of 24 Journal of Materials Chemistry A
Jour
nalo
fMat
eria
lsC
hem
istr
yA
Acc
epte
dM
anus
crip
t
Publ
ishe
d on
26
Mar
ch 2
014
Dow
nloa
ded
by N
atio
nal C
hung
Hsi
ng U
nive
rsity
on
120
420
14 1
036
16
View Article OnlineDOI 101039C4TA01057D
7
2891 eV (OndashC=O) indicating the high percentage of oxygen-contained functional groups37
1
Chemisorbed surface hydroxyl groups can enhance photocatalysis by trapping photoinduced 2
holes resulting in an increase in the formation of highly oxidizing OH radicals38
3
34 Photocatalytic Activity for dye degradation 4
For comparative purposes the photodegradation efficiencies of MB and MO mediated 5
by the different photocatalysts under UV irradiation are shown in Fig 6 Before comparison 6
the adsorption and photodegradation performances of GO Y2O3 and 5 GOY on MB were 7
investigated (Fig S1) As displayed in Fig S1 both Y2O3 and 5 GOY have good adsorption 8
affinity to MB After stirring for 30 min under dark about 80 MB could be absorbed by 9
Y2O3 and 5 GOY which is much better than GO (lower than 20) After photocatalysis for 10
35min MB can be degraded thoroughly by 5 GOY Then the photocatalytic activities of the 11
GO Y2O3 5 GOY 10 GOY 20 GOY and 50 GOY composite photocatalysts were compared 12
via the reduction of MB and MO under ambient temperature Photodegradation time is 35 13
min It has been reported that a large surface area helps to increase the photocatalytic reaction 14
sites39
From the O1s spectrum of Y2O3 (Fig S2 supplementary material) the oxygen 15
composition of Y2O3 and 5 GOY samples at different states (Table S1 supplementary 16
material) more OH radicals are available in 5 GOY As expected under UV irradiation the 17
degradation of MB is slower than 10 with a GO photocatalyst However the conversion of 18
MB reaches 95 after 35 min when using Y2O3 as a photocatalyst The four kinds of GOY 19
samples exhibite better photocatalytic properties in the degradation of MB than bare GO and 20
Y2O3 under UV irradiation Moreover with increasing the amount of GO the degradation of 21
MB increases slowly Considering the simplicity and economy of the MB degradation 5 22
GOY is selected as the photocatalyst in the following experiments The photocatalytic 23
activities of 5 GOY was compared with commercial TiO2 P25 (Fig S3 supplementary 24
material) indicating the photocatalytic property of 5 GOY was quite comparable with P25 25
The GOY composites also have photocatalytic activities to MO As can be seen in Fig 6 GO 26
has good affinity to MO and the 50 GOY has best degradation efficiency to MO among the 27
GOY composites 28
The photocatalyst dosage may affect the MB degradation efficiency Fig 7A illustrates 29
MB degradation at varying photocatalyst dosages (5 to 10 mg) MB degradation efficiency 30
Page 8 of 24Journal of Materials Chemistry A
Jour
nalo
fMat
eria
lsC
hem
istr
yA
Acc
epte
dM
anus
crip
t
Publ
ishe
d on
26
Mar
ch 2
014
Dow
nloa
ded
by N
atio
nal C
hung
Hsi
ng U
nive
rsity
on
120
420
14 1
036
16
View Article OnlineDOI 101039C4TA01057D
8
increases with increasing the contact time In addition with increasing the dosage the MB 1
degradation efficiency slowly increases As displayed in Fig 7A the best dosage is 10 mg 2
As the MB concentration may also influence degradation MB degradation under various 3
concentration of MB is investigated It can be seen clearly in Fig 7B that MB conversion 4
efficiency is as much as 100 after degradation for 35 min when the MB concentration is 5
lower than 25 mg L-1
The conversion efficiency will decrease when the MB concentration is 6
higher than 275 mg L-1
The final conversion efficiency will no more than 90 if 300 mg 7
L-1
MB solution is used 8
Because the solution pH can remarkably influence MB degradation the effect of initial 9
pH on the degradation of MB with 5 GOY catalyst is determined as presented in Fig 7C As 10
shown in Fig 7C the conversion of MB will finally reach 100 when the solution pH is 11
lower than 519 If the solution pH controlled at 63 the conversion efficiency will decrease 12
sharply and only 80 MB will convert after 35 min Therefore the solution pH is set at 41 13
35 Photocatalytic mechanism 14
The magnitude of the photocurrent represents the charge collection efficiency of the 15
electrode surface and indirectly indicates the separated efficiency of electron-hole pairs40
16
From the insert of Fig 8 5 GOY modified photoelectrode is prompted in generating 17
photocurrent under visible and UV-visible light GOY photoelectrodes yield the greater 18
photocurrent than Y2O3 photoelectrode under UV irradiation in Fig 8 19
Fig 9 shows the PL spectra of the Y2O3 and GOY photocatalysts With Y2O3 as 20
photocatalyst the PL signal centered around 450 nm is detected revealing that ∙OH radicals 21
are generated on the irradiated Y2O3 When GOY nanocomposites are used as the 22
photocatalysts the PL signal intensity is increased which suggests that the yield of ∙OH 23
radicals is enhanced on the irradiated GOY nanocomposite The enhancement in 24
photoactivity can be attributed to the remarkable synergistic effect of the combination of 25
Y2O3 and the GO sheets leading to the efficient separation of photogenerated carriers in the 26
Y2O3 and GO coupling system 27
It is well known that the photodegradation process of the photocatalysts is strongly 28
relative to electron-hole pairs generated by light irradiation on catalysts The photogenerated 29
electrons and holes can migrate to the surface of the catalysts and then can be trapped 30
Page 9 of 24 Journal of Materials Chemistry A
Jour
nalo
fMat
eria
lsC
hem
istr
yA
Acc
epte
dM
anus
crip
t
Publ
ishe
d on
26
Mar
ch 2
014
Dow
nloa
ded
by N
atio
nal C
hung
Hsi
ng U
nive
rsity
on
120
420
14 1
036
16
View Article OnlineDOI 101039C4TA01057D
9
generally by the oxygen and surface hydroxyls to ultimately produce hydroxyl radicals (middotOH) 1
that react with the adsorbed reactants41
As we know Y2O3 is n-type semiconductor with a 2
wide band gap about 56 eV42
To understand the charge separation process of Y2O3 and 3
GOYs the band edge positions of conduction band (CB) and valence band (VB) of 4
semiconductor Y2O3 has been calculated by the following equation43
5
EVB = X - Ee + 05Eg (1) 6
ECB = EVB - Eg (2) 7
where is the absolute electronegativity of the semiconductor e is the energy of free 8
electrons on the hydrogen scale (sim45 eV) and g is the bandgap energy of the 9
semiconductor The value of for Y2O3 is obtained by the arithmetic mean of the electron 10
affinity and the first ionization of the constituent atoms reported in the literatures44
to be 535 11
eV Thus the CB and VB potentials of Y2O3 are calculated to be -195 and 365 eV versus 12
normal hydrogen electrode (NHE) respectively It can be seen that the VB potential of 13
sample is more positive than the redox potential of OHminus∙OH (189 VNHE) indicating that 14
the photogenerated holes have strong oxidative ability and they can oxidize OHminus into ∙OH In 15
addition the CB potential of sample is negative enough to reduce O2 to O2∙ minus
(minus013 VNHE) 16
via eminus 17
Based on these results a possible mechanism for the photocatalytic is proposed as 18
follows and shown in Fig 10 19
Y2O3 + hν rarr Y2O3 (h+e) (3) 20
Y2O3 (e) + GO rarr Y2O3 + GO (e) (4) 21
GO (e) + O2 rarr GO + O2bullminus (5) 22
Y2O3 (h) + OHminus rarrY2O3 + OH
bull (6) 23
Y2O3 (h) + O2bullminus
+ OHbull + MB rarr CO2 +H2O+SO4
2minus + NO3
minus + Cl
minus (7) 24
25
4 Conclusions 26
In conclusion a novel GOY nanocomposite with different GO content has been obtained 27
via a one-step hydrothermal method The FT-IR XRD EDX and XPS results showed the 28
yttrium was successfully composited with GO The morphology characterization showed the 29
as-obtained GOY had nanoflake structure After stirring for 30 min under dark about 80 30
Page 10 of 24Journal of Materials Chemistry A
Jour
nalo
fMat
eria
lsC
hem
istr
yA
Acc
epte
dM
anus
crip
t
Publ
ishe
d on
26
Mar
ch 2
014
Dow
nloa
ded
by N
atio
nal C
hung
Hsi
ng U
nive
rsity
on
120
420
14 1
036
16
View Article OnlineDOI 101039C4TA01057D
10
MB could be absorbed by Y2O3 and 5 GOY The as-prepared GOY had good degradation 1
performance on both MB and MO under UV irradiation Compared with other GOY 2
composites 5 GOY had better photocatalytic activity to MB Factors such as dosages of 3
photocatalyst contaminant concentration and solution pH on MB conversion were also 4
investigated and discussed The catalyst also showed good stability and recyclability It is 5
expected that the GOY nanocomposite would be a potential candidate for treatment of dye 6
containing wastewater 7
8
Acknowledgments 9
This work was supported by the National Natural Science Foundation of China (No 10
21307104) Natural Science Foundation of Jiangsu Province China (NoBK20130438) the 11
Scientific Research Project of Environmental Fund of Yangzhou City (YHK1303) and 12
Jiangsu Key Laboratory of Environmental Material and Engineering (K12031) We thank the 13
Testing Center of Yangzhou University for sample characterization 14
15
Notes and References 16
1 B K Korbahti K Artut C Gecgel A Ozer Chem Eng J 2011 173 677-688 17
2 V K Gupta D Pathania S Agarwal P Singh J Hazard Mater 2012 243 179-186 18
3 N Wetchakun S Chaiwichain B Inceesungvorn K Pingmuang S Phanichphant A I 19
Minett J Chen ACS Appl Mater Interfaces 2012 4 3718-3723 20
4 Y F Li D Xu J I Oh W Shen X Li Y Yu ACS Catal 2012 2 391-398 21
5 M Khan W B Cao J Mol Catal A Chem 2013 376 71-77 22
6 Y F Wu Q J Zhang X F Yin H Q Cheng RSC Advances 2013 3 9670-9676 23
7 F H Chu C W Huang C L Hsin C W Wang S Y Yu P H Yeh W W Wu 24
Nanoscale 2012 4 1471-1475 25
8 L J Xu J L Wang Environ Sci Technol 2012 46 10145-10153 26
9 Y C Zhang J Li H Y Xu Appl Catal B 2012 123-124 18-26 27
10 S Usai S Obreg n A I Becerro G ol n J Phys Chem C 2013 117 24479-24484 28
11 A K Geim K S Novoselov Nat Mater 2007 6 183-191 29
12 K-Y Shin J-Y Hong J Jang Adv Mater 2011 23 2113-2118 30
Page 11 of 24 Journal of Materials Chemistry A
Jour
nalo
fMat
eria
lsC
hem
istr
yA
Acc
epte
dM
anus
crip
t
Publ
ishe
d on
26
Mar
ch 2
014
Dow
nloa
ded
by N
atio
nal C
hung
Hsi
ng U
nive
rsity
on
120
420
14 1
036
16
View Article OnlineDOI 101039C4TA01057D
11
13 G K Pradhan D K Padhi K M Parida ACS Appl Mater Interfaces 2013 5 1
9101-9110 2
14 E Lee J Y Hong H Kang J Jang J Hazard Mater 2012 219-220 13-18 3
15 Y S Fu H Q Chen X Q Sun X Wang Appl Catal B 2012 111-112 280-287 4
16 K Krishnamoorthy R Mohan S J Kim Appl Phys Lett 2011 98 244101 5
17 M Li J Zhang Y Zhang Chem Phys Lett 2012 527 63-66 6
18 F Meng J Li Z Hong M Zhi A Sakla C Xiang N Wu Catal Today 2013 199 7
48-52 8
19 H Zhang K Tan H Zheng Y Gu W F Zhang Mater Chem Phys 2011 125 9
156-160 10
20 X Niu S Li H Chu J Zhou J Rare Earths 2011 29 225-229 11
21 H Narayan H Alemu L Setofolo L Macheli ISRN Phys Chem 2012 841521 1-9 12
22 M J Allen V C Tung R B Kaner Chem Rev 2010 110 132-145 13
23 F Y Ban S R Majid N M Huang H N Lim Int J Electrochem Sci 2012 7 14
4345-4351 15
24 Y L Min G Q He Q J Xu Y C Chen J Mater Chem A 2014 2 1294-1301 16
25 W Fan W Gao C Zhang W W Tjiu J S Pan T X Liu J Mater Chem 2012 22 17
25108-25115 18
26 Z -S Wu W Ren L Wen L Gao J Zhao Z Chen G Zhou F Li H -M Cheng ACS 19
Nano 2010 4 3187-3194 20
27 J A Dorman Y B Mao J R Bargar J P Chang J Phys Chem C 2010 114 21
17422-17427 22
28 R P Ermakov VV Voronov P P Fedorov Nanosystems physics chemistry 23
mathematics 2013 4 (2) 196-205 24
29 A Lerf H He M Forster J Klinowski J Phys Chem B 1998102(23) 4477-4482 25
30 G Wang Z Yang X Li C Li Carbon 2005 43(12) 2564-2570 26
31 S Stankovich D A Dikin R D Piner K A Kohlhaas A Kleinhammes Y Y Jia Y 27
Wu S T Nguyen R S Ruoff Carbon 2007 45 1558-1565 28
32 M Aghazadeh A Nozad H Adelkhani M Ghaemi J Electrochem Soc 2010 157 29
D519-D522 30
Page 12 of 24Journal of Materials Chemistry A
Jour
nalo
fMat
eria
lsC
hem
istr
yA
Acc
epte
dM
anus
crip
t
Publ
ishe
d on
26
Mar
ch 2
014
Dow
nloa
ded
by N
atio
nal C
hung
Hsi
ng U
nive
rsity
on
120
420
14 1
036
16
View Article OnlineDOI 101039C4TA01057D
12
33 L Nan Y Kazumichi J Solid State Chem 2008 181 1738-1743 1
34 R Srinivasan N R Yogamalar J Elanchezhiyan R J Joseyphus A C Bose J Alloy 2
Compd 2010 496 472-477 3
35 S Somacescu J M C Moreno P Osiceanu B L Su V Parvulescu J Phys Chem C 4
2010 114 19365 5
36 J H Pan W I Lee Chem Mater 2006 18 847-853 6
37 Y Chen B H Song X S Tang L Lu J M Xue J Mater Chem 2012 22 7
17656-17662 8
38 J Xu Y Chang Y Zhang S Ma Y Qu C Xu Appl Surf Sci 2008 255 1996-1999 9
39 LP Zhu NC Bing LL Wang HY Jin GH Liao LJ Wang Dalton Trans 2012 41 10
2959-2965 11
40 Z Pei L Ding H Lin S Weng Z Zheng Y Hou P Liu J Mater Chem A 2013 1 12
10099-10102 13
41Y L Pan S Z Deng L Polavarapu N Y Gao P Y Yuan C H Sow Q H Xu 14
Langmuir 2012 28 12304-12310 15
42 P Rouffignac J S Park R G Gordon Chem Mater 2005 17 4808-4814 16
43 H Xu H Li C Wu J Chu Y Yan H Shu Z Gu J Hazard Mater 2008 153 17
877-880 18
44 T Andersen H K Haugen H Hotop J Phys Chem Ref Data 1999 28(6) 1511-1533 19
20
Page 13 of 24 Journal of Materials Chemistry A
Jour
nalo
fMat
eria
lsC
hem
istr
yA
Acc
epte
dM
anus
crip
t
Publ
ishe
d on
26
Mar
ch 2
014
Dow
nloa
ded
by N
atio
nal C
hung
Hsi
ng U
nive
rsity
on
120
420
14 1
036
16
View Article OnlineDOI 101039C4TA01057D
13
Figure captions 1
2
Figure 1 FT-IR spectra of GO Y2O3 and 5 GOY composites 3
Figure 2 XRD patterns of GO Y2O3 and 5 GOY composites 4
Figure 3 TGA curves of GO Y2O3 and 5 GOY composites 5
Figure 4 FESEM images of (A) Y2O3 (Insert low magnification) (B) GO (C) 5 GOY and 6
(D) 20 GOY composites (Insert EDS spectrum of 20 GOY sample) (E) and (F) 7
HRTEM images of 5 GOY taken after intense ultrasonic dispersion in ethanol for 30 8
min 9
Figure 5 XPS spectra (A) full survey spectra of GO Y2O3 and GOY nanocomposite (B) Y 10
3d of 5 GOY (C) O 1s of 5 GOY (D) C 1s of 5 GOY 11
Figure 6 Comparison of photodegradation efficiency using as-synthesized GO Y2O3 and 12
GOY composites 13
Figure 7 (A) Effect of dosage on MB conversion MB concentration 25 ppm pH = 41 (B) 14
Effect of MB concentration on the degradation Dosage 10 mg pH = 41 (C) Effect of 15
solution pH on MB conversion MB concentration 25 ppm Dosage 10 mg 16
Figure 8 Photocurrent responses of GO Y2O3 and 5 GOY photoelectrodes under UV 17
illumination Insert Photocurrent responses of 5 GOY under different illumination 18
conditions Scan rate 50 mVs The electrolyte solution was 05 M NaCl 19
Figure 9 PL spectra of Y2O3 5 GOY and 20 GOY samples (λex = 258 nm) 20
Figure 10 Proposed mechanism for the photodegradation of MB on GOY composite21
Page 14 of 24Journal of Materials Chemistry A
Jour
nalo
fMat
eria
lsC
hem
istr
yA
Acc
epte
dM
anus
crip
t
Publ
ishe
d on
26
Mar
ch 2
014
Dow
nloa
ded
by N
atio
nal C
hung
Hsi
ng U
nive
rsity
on
120
420
14 1
036
16
View Article OnlineDOI 101039C4TA01057D
14
Figure 1 1
2
3
4
500 1000 1500 2000 2500 3000 3500 4000
1657
Tra
ns
mit
tan
ce
Wavenumber cm-1
1657
1550
1564 17211223
1436
1436
GO
Y2O
3
5GOY
5
6
Page 15 of 24 Journal of Materials Chemistry A
Jour
nalo
fMat
eria
lsC
hem
istr
yA
Acc
epte
dM
anus
crip
t
Publ
ishe
d on
26
Mar
ch 2
014
Dow
nloa
ded
by N
atio
nal C
hung
Hsi
ng U
nive
rsity
on
120
420
14 1
036
16
View Article OnlineDOI 101039C4TA01057D
15
Figure 2 1
2
3
10 20 30 40 50 60 70
5GOY2O
3
Inte
ns
ity
a
u
2degree
GO
Y2O
3
4
5
6
Page 16 of 24Journal of Materials Chemistry A
Jour
nalo
fMat
eria
lsC
hem
istr
yA
Acc
epte
dM
anus
crip
t
Publ
ishe
d on
26
Mar
ch 2
014
Dow
nloa
ded
by N
atio
nal C
hung
Hsi
ng U
nive
rsity
on
120
420
14 1
036
16
View Article OnlineDOI 101039C4TA01057D
16
Figure 3 1
2
0 100 200 300 400 500 60040
50
60
70
80
90
100
5GOY
Y2O
3
GO
We
igh
t
Temperature oC
3
4
Page 17 of 24 Journal of Materials Chemistry A
Jour
nalo
fMat
eria
lsC
hem
istr
yA
Acc
epte
dM
anus
crip
t
Publ
ishe
d on
26
Mar
ch 2
014
Dow
nloa
ded
by N
atio
nal C
hung
Hsi
ng U
nive
rsity
on
120
420
14 1
036
16
View Article OnlineDOI 101039C4TA01057D
17
Figure 4 1
2
3
4
5
6
7
8
9
10
11
12
13
14
15
16
17
18
19
20
21
22
23
24
25
26
27
28
29
30
31
32
33
34
35
36
37
38
39
40
41
Page 18 of 24Journal of Materials Chemistry A
Jour
nalo
fMat
eria
lsC
hem
istr
yA
Acc
epte
dM
anus
crip
t
Publ
ishe
d on
26
Mar
ch 2
014
Dow
nloa
ded
by N
atio
nal C
hung
Hsi
ng U
nive
rsity
on
120
420
14 1
036
16
View Article OnlineDOI 101039C4TA01057D
18
Figure 5 1
2
3
1200 1000 800 600 400 200 0
Y 3d
C 1s
20 GOY
5 GOY
Y2O
3
Inte
ns
ity
a
u
Binding Energy eV
GO
O 1s
A
150 155 160 165 170 175
Inte
ns
ity
a
u
Binding Energy eV
Y 3d32
BY 3d
52
4
5
6
526 528 530 532 534 536
Inte
ns
ity
a
u
Binding Energy eV
O 1sC
282 284 286 288 290 292
Inte
ns
ity
a
u
Binding Energy eV
C-C
C-OC=O O-C=O
DC 1s
7
8
Page 19 of 24 Journal of Materials Chemistry A
Jour
nalo
fMat
eria
lsC
hem
istr
yA
Acc
epte
dM
anus
crip
t
Publ
ishe
d on
26
Mar
ch 2
014
Dow
nloa
ded
by N
atio
nal C
hung
Hsi
ng U
nive
rsity
on
120
420
14 1
036
16
View Article OnlineDOI 101039C4TA01057D
19
1
Figure 6 2
3
00
02
04
06
08
10
12
Y2O
3
20GOY
50GOY
10GOY
5GOYCo
nv
ers
ion
Photocatalysts
MO
MB
GO
4
5
6
7
8
Page 20 of 24Journal of Materials Chemistry A
Jour
nalo
fMat
eria
lsC
hem
istr
yA
Acc
epte
dM
anus
crip
t
Publ
ishe
d on
26
Mar
ch 2
014
Dow
nloa
ded
by N
atio
nal C
hung
Hsi
ng U
nive
rsity
on
120
420
14 1
036
16
View Article OnlineDOI 101039C4TA01057D
20
Figure 7 1
2
-5 0 5 10 15 20 25 30 35 40060
070
080
090
Co
nv
ers
ion
Time min
5 mg
6 mg
7 mg
8 mg
9 mg
10 mg
A100
-5 0 5 10 15 20 25 30 35 40
060
070
080
090
Co
nv
ers
ion
Time min
200 mg L-1
225 mg L-1
250 mg L-1
275 mg L-1
300 mg L-1
B100
3
4
-5 0 5 10 15 20 25 30 35 40
110
050
060
070
080
090
Co
nv
ers
ion
Time min
pH 303
pH 418
pH 519
pH 630
100
C
5
6
7
8
9
Page 21 of 24 Journal of Materials Chemistry A
Jour
nalo
fMat
eria
lsC
hem
istr
yA
Acc
epte
dM
anus
crip
t
Publ
ishe
d on
26
Mar
ch 2
014
Dow
nloa
ded
by N
atio
nal C
hung
Hsi
ng U
nive
rsity
on
120
420
14 1
036
16
View Article OnlineDOI 101039C4TA01057D
21
1
2
Figure 8 3
4
5
6
7
02 00 -02 -04
0
5
10
15
20j
A
cm
-2
E V (vs SCE)
Y2O
3
GO
5GOY
02 01 00 -01 -02 -0300
05
10
15
20
25
30
35
j A
cm
-2
E V (vs SCE)
Uv
Vis
Dark
5GOY
Page 22 of 24Journal of Materials Chemistry A
Jour
nalo
fMat
eria
lsC
hem
istr
yA
Acc
epte
dM
anus
crip
t
Publ
ishe
d on
26
Mar
ch 2
014
Dow
nloa
ded
by N
atio
nal C
hung
Hsi
ng U
nive
rsity
on
120
420
14 1
036
16
View Article OnlineDOI 101039C4TA01057D
22
1
2
Figure 9 3
4
400 450 500 550 600 650 700 750 800
Inte
ns
ity
a
u
Wavelength nm
20 GOY
5 GOY
Y2O
3
5
6
7
Page 23 of 24 Journal of Materials Chemistry A
Jour
nalo
fMat
eria
lsC
hem
istr
yA
Acc
epte
dM
anus
crip
t
Publ
ishe
d on
26
Mar
ch 2
014
Dow
nloa
ded
by N
atio
nal C
hung
Hsi
ng U
nive
rsity
on
120
420
14 1
036
16
View Article OnlineDOI 101039C4TA01057D
23
1
Figure 10 2
3
4
5
6
Page 24 of 24Journal of Materials Chemistry A
Jour
nalo
fMat
eria
lsC
hem
istr
yA
Acc
epte
dM
anus
crip
t
Publ
ishe
d on
26
Mar
ch 2
014
Dow
nloa
ded
by N
atio
nal C
hung
Hsi
ng U
nive
rsity
on
120
420
14 1
036
16
View Article OnlineDOI 101039C4TA01057D
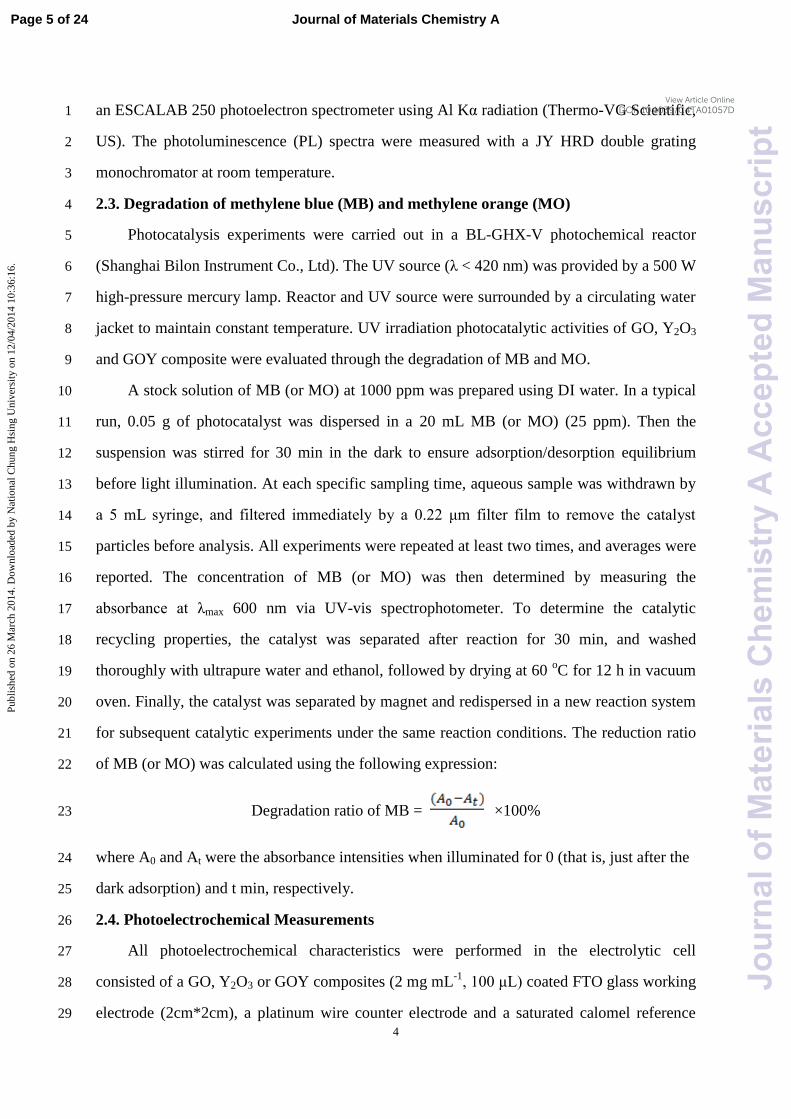
4
an ESCALAB 250 photoelectron spectrometer using Al Kα radiation (Thermo-VG Scientific 1
US) The photoluminescence (PL) spectra were measured with a JY HRD double grating 2
monochromator at room temperature 3
23 Degradation of methylene blue (MB) and methylene orange (MO) 4
Photocatalysis experiments were carried out in a BL-GHX-V photochemical reactor 5
(Shanghai Bilon Instrument Co Ltd) The UV source (λ lt 420 nm) was provided by a 500 W 6
high-pressure mercury lamp Reactor and UV source were surrounded by a circulating water 7
jacket to maintain constant temperature UV irradiation photocatalytic activities of GO Y2O3 8
and GOY composite were evaluated through the degradation of MB and MO 9
A stock solution of MB (or MO) at 1000 ppm was prepared using DI water In a typical 10
run 005 g of photocatalyst was dispersed in a 20 mL MB (or MO) (25 ppm) Then the 11
suspension was stirred for 30 min in the dark to ensure adsorptiondesorption equilibrium 12
before light illumination At each specific sampling time aqueous sample was withdrawn by 13
a 5 mL syringe and filtered immediately by a 022 μm filter film to remove the catalyst 14
particles before analysis All experiments were repeated at least two times and averages were 15
reported The concentration of MB (or MO) was then determined by measuring the 16
absorbance at λmax 600 nm via UV-vis spectrophotometer To determine the catalytic 17
recycling properties the catalyst was separated after reaction for 30 min and washed 18
thoroughly with ultrapure water and ethanol followed by drying at 60 oC for 12 h in vacuum 19
oven Finally the catalyst was separated by magnet and redispersed in a new reaction system 20
for subsequent catalytic experiments under the same reaction conditions The reduction ratio 21
of MB (or MO) was calculated using the following expression 22
Degradation ratio of MB = times100 23
where A0 and At were the absorbance intensities when illuminated for 0 (that is just after the 24
dark adsorption) and t min respectively 25
24 Photoelectrochemical Measurements 26
All photoelectrochemical characteristics were performed in the electrolytic cell 27
consisted of a GO Y2O3 or GOY composites (2 mg mL-1 100 μL) coated FTO glass working 28
electrode (2cm2cm) a platinum wire counter electrode and a saturated calomel reference 29
Page 5 of 24 Journal of Materials Chemistry A
Jour
nalo
fMat
eria
lsC
hem
istr
yA
Acc
epte
dM
anus
crip
t
Publ
ishe
d on
26
Mar
ch 2
014
Dow
nloa
ded
by N
atio
nal C
hung
Hsi
ng U
nive
rsity
on
120
420
14 1
036
16
View Article OnlineDOI 101039C4TA01057D
5
electrode (SCE) on a Model CHI 660E electrochemical workstation under a 500 W 1
high-pressure mercury lamp irradiation 2
3
3 Results and discussion 4
31 FT-IR spectra XRD and TGA Analysis 5
FT-IR measurement is employed to investigate the bonding interactions in GO before 6
and after the oxidation process FT-IR spectra of GO Y2O3 and 5 GOY are shown in Fig 1 7
In the spectrum of GO the peak at about 1721 cm-1
is attributed to the stretching vibrations of 8
C=O The peaks appear at about 1223 and 1564 cm-1
correspond to the stretching vibrations 9
of C-O and C=C respectively23
The FT-IR spectra of Y2O3 and 5 GOY composite have 10
similar curve shape while a new peak appears at 1550 cm-1
of 5 GOY This result indicates 11
the GO has successfully composited with Y2O3 12
Fig 2 shows the crystal structure of GO Y2O3 and 5 GOY composite GO shows a 13
sharp peak at 2θ = 105o corresponding to the (001) reflection of graphite oxide
152425 The 14
diffraction peaks observed at 2θ = 421deg originate from disorderedly stacked GO sheets26
The 15
peaks located at 198deg 286deg 351deg 501deg 494deg and 512deg (2θ) result from the presence of 16
Y2O3 which are in agreement with the theoretical data of hematite (JCPDS No 41-0015)2728
17
In the pattern of 5 GOY the presence of diffraction peak at 2θ of 421deg indicating that GO 18
exists in the composite material It should be noted that there is a diffraction peak observed at 19
2θ = 101deg on both patterns of Y2O3 and 5 GOY which originates from intermediate YO(OH) 20
structure27
21
Fig 3 presents results of TGA analysis of the as-synthesized GO Y2O3 and 5 GOY 22
composite powder The samples were heated from room temperature to 600 degC at 5 degC min-1
23
under N2 flow As can be seen in Fig3 GO starts to lose mass upon heating even below 24
100 degC The major mass loss occurs at about 200 degC is caused by pyrolysis of the 25
oxygen-containing functional groups generating CO CO2 and stream29-31
Y2O3 and 5 GOY 26
have the same shape and show mass losses at three temperature ~100 320 and 400 degC The 27
first mass loss at about 100 degC is related to dehydration of free and physically absorbed 28
molecular water The next mass loss at about 320 degC is supposed to be related with the first 29
dehydration of chemisorbed and combined water from Y(OH)33233
The third mass loss at 30
Page 6 of 24Journal of Materials Chemistry A
Jour
nalo
fMat
eria
lsC
hem
istr
yA
Acc
epte
dM
anus
crip
t
Publ
ishe
d on
26
Mar
ch 2
014
Dow
nloa
ded
by N
atio
nal C
hung
Hsi
ng U
nive
rsity
on
120
420
14 1
036
16
View Article OnlineDOI 101039C4TA01057D
6
about 400 degC confirms dehydration of structural water from YOOH phase34
1
32 Morphology Characterization 2
The morphology of the as-obtained samples are examined by FESEM It can be 3
observed in Fig 4A that the as-prepared Y2O3 illustrates a uniform flake-like shape with 4
irregular edges Its lateral size ranges from 70 to 150 nm and thickness is around 10 to 20 nm 5
It can be observed that the prepared graphene oxide illustrates the flake-like shape and 6
layer-layer structure of graphene oxide edges (Fig 4B) Fig 4C and D displays the 7
morphologies of 5 GOY and 20 GOY composites respectively As can be seen with GO 8
content increasing the flake-like structure becomes irregular At the same time GO and Y2O3 9
aggregate The EDX profile (Fig 4D insert) exhibits strong carbon oxygen and yttrium peaks 10
Fig 4E and F exhibit HRTEM images of the GOY composite As shown in Fig 4E and F the 11
lattice fringes of Y2O3 nanocrystals and GO are simultaneously observed indicating strong 12
interactions between Y and the GO support The resolved lattice fringes of (111) planes (d = 13
031 nm) are attributed to GO and the lattice fringes of (111) planes (d = 027 nm) are 14
assigned to Y2O3 nanocrystals 15
33 XPS analysis 16
Fig 5A shows the XPS full survey spectra in the binding energy range of 0-1100 eV for 17
GO Y2O3 5 GOY and 20 GOY composite As shown in Fig 5A all the samples contain C 18
and O however the Y-contained samples show two peaks at about 1582 eV and 1600 eV 19
which are attributed to Y6 Fig 5B-D shows the high-resolution XPS regional spectra of Y 3d 20
O 1s and C 1s for 5 GOY respectively The relatively strong peaks at 1581 eV and 1599 eV 21
can be attributed to Y 3d52 and Y 3d32 respectively (Fig 5B) These results are in agreement 22
with values of Y2O3 reported in the literature35
It is well reported that yttrium retards the 23
combination of photogenerated electron-hole pairs41718
this may be due to the presence of 24
extra hydroxyl species to delay recombination through hole trapping6 Three kinds of surface 25
oxygen species could be distinguished in the O 1s spectra as shown in Fig 5C The binding 26
energy of 5309 eV 5318 and 5330 eV are ascribed to the lattice oxygen the hydroxyl 27
groups and the C-OH respectively36
As shown in Fig 5D the XPS spectrum of C 1s from 5 28
GOY is collected which can be deconvoluted into four peaks sp2 bonded carbon at 2848 eV 29
(CndashC) epoxyhydroxyls at 2860 eV (CndashO) carbonyls at 2879 eV (C=O) and carboxyls at 30
Page 7 of 24 Journal of Materials Chemistry A
Jour
nalo
fMat
eria
lsC
hem
istr
yA
Acc
epte
dM
anus
crip
t
Publ
ishe
d on
26
Mar
ch 2
014
Dow
nloa
ded
by N
atio
nal C
hung
Hsi
ng U
nive
rsity
on
120
420
14 1
036
16
View Article OnlineDOI 101039C4TA01057D
7
2891 eV (OndashC=O) indicating the high percentage of oxygen-contained functional groups37
1
Chemisorbed surface hydroxyl groups can enhance photocatalysis by trapping photoinduced 2
holes resulting in an increase in the formation of highly oxidizing OH radicals38
3
34 Photocatalytic Activity for dye degradation 4
For comparative purposes the photodegradation efficiencies of MB and MO mediated 5
by the different photocatalysts under UV irradiation are shown in Fig 6 Before comparison 6
the adsorption and photodegradation performances of GO Y2O3 and 5 GOY on MB were 7
investigated (Fig S1) As displayed in Fig S1 both Y2O3 and 5 GOY have good adsorption 8
affinity to MB After stirring for 30 min under dark about 80 MB could be absorbed by 9
Y2O3 and 5 GOY which is much better than GO (lower than 20) After photocatalysis for 10
35min MB can be degraded thoroughly by 5 GOY Then the photocatalytic activities of the 11
GO Y2O3 5 GOY 10 GOY 20 GOY and 50 GOY composite photocatalysts were compared 12
via the reduction of MB and MO under ambient temperature Photodegradation time is 35 13
min It has been reported that a large surface area helps to increase the photocatalytic reaction 14
sites39
From the O1s spectrum of Y2O3 (Fig S2 supplementary material) the oxygen 15
composition of Y2O3 and 5 GOY samples at different states (Table S1 supplementary 16
material) more OH radicals are available in 5 GOY As expected under UV irradiation the 17
degradation of MB is slower than 10 with a GO photocatalyst However the conversion of 18
MB reaches 95 after 35 min when using Y2O3 as a photocatalyst The four kinds of GOY 19
samples exhibite better photocatalytic properties in the degradation of MB than bare GO and 20
Y2O3 under UV irradiation Moreover with increasing the amount of GO the degradation of 21
MB increases slowly Considering the simplicity and economy of the MB degradation 5 22
GOY is selected as the photocatalyst in the following experiments The photocatalytic 23
activities of 5 GOY was compared with commercial TiO2 P25 (Fig S3 supplementary 24
material) indicating the photocatalytic property of 5 GOY was quite comparable with P25 25
The GOY composites also have photocatalytic activities to MO As can be seen in Fig 6 GO 26
has good affinity to MO and the 50 GOY has best degradation efficiency to MO among the 27
GOY composites 28
The photocatalyst dosage may affect the MB degradation efficiency Fig 7A illustrates 29
MB degradation at varying photocatalyst dosages (5 to 10 mg) MB degradation efficiency 30
Page 8 of 24Journal of Materials Chemistry A
Jour
nalo
fMat
eria
lsC
hem
istr
yA
Acc
epte
dM
anus
crip
t
Publ
ishe
d on
26
Mar
ch 2
014
Dow
nloa
ded
by N
atio
nal C
hung
Hsi
ng U
nive
rsity
on
120
420
14 1
036
16
View Article OnlineDOI 101039C4TA01057D
8
increases with increasing the contact time In addition with increasing the dosage the MB 1
degradation efficiency slowly increases As displayed in Fig 7A the best dosage is 10 mg 2
As the MB concentration may also influence degradation MB degradation under various 3
concentration of MB is investigated It can be seen clearly in Fig 7B that MB conversion 4
efficiency is as much as 100 after degradation for 35 min when the MB concentration is 5
lower than 25 mg L-1
The conversion efficiency will decrease when the MB concentration is 6
higher than 275 mg L-1
The final conversion efficiency will no more than 90 if 300 mg 7
L-1
MB solution is used 8
Because the solution pH can remarkably influence MB degradation the effect of initial 9
pH on the degradation of MB with 5 GOY catalyst is determined as presented in Fig 7C As 10
shown in Fig 7C the conversion of MB will finally reach 100 when the solution pH is 11
lower than 519 If the solution pH controlled at 63 the conversion efficiency will decrease 12
sharply and only 80 MB will convert after 35 min Therefore the solution pH is set at 41 13
35 Photocatalytic mechanism 14
The magnitude of the photocurrent represents the charge collection efficiency of the 15
electrode surface and indirectly indicates the separated efficiency of electron-hole pairs40
16
From the insert of Fig 8 5 GOY modified photoelectrode is prompted in generating 17
photocurrent under visible and UV-visible light GOY photoelectrodes yield the greater 18
photocurrent than Y2O3 photoelectrode under UV irradiation in Fig 8 19
Fig 9 shows the PL spectra of the Y2O3 and GOY photocatalysts With Y2O3 as 20
photocatalyst the PL signal centered around 450 nm is detected revealing that ∙OH radicals 21
are generated on the irradiated Y2O3 When GOY nanocomposites are used as the 22
photocatalysts the PL signal intensity is increased which suggests that the yield of ∙OH 23
radicals is enhanced on the irradiated GOY nanocomposite The enhancement in 24
photoactivity can be attributed to the remarkable synergistic effect of the combination of 25
Y2O3 and the GO sheets leading to the efficient separation of photogenerated carriers in the 26
Y2O3 and GO coupling system 27
It is well known that the photodegradation process of the photocatalysts is strongly 28
relative to electron-hole pairs generated by light irradiation on catalysts The photogenerated 29
electrons and holes can migrate to the surface of the catalysts and then can be trapped 30
Page 9 of 24 Journal of Materials Chemistry A
Jour
nalo
fMat
eria
lsC
hem
istr
yA
Acc
epte
dM
anus
crip
t
Publ
ishe
d on
26
Mar
ch 2
014
Dow
nloa
ded
by N
atio
nal C
hung
Hsi
ng U
nive
rsity
on
120
420
14 1
036
16
View Article OnlineDOI 101039C4TA01057D
9
generally by the oxygen and surface hydroxyls to ultimately produce hydroxyl radicals (middotOH) 1
that react with the adsorbed reactants41
As we know Y2O3 is n-type semiconductor with a 2
wide band gap about 56 eV42
To understand the charge separation process of Y2O3 and 3
GOYs the band edge positions of conduction band (CB) and valence band (VB) of 4
semiconductor Y2O3 has been calculated by the following equation43
5
EVB = X - Ee + 05Eg (1) 6
ECB = EVB - Eg (2) 7
where is the absolute electronegativity of the semiconductor e is the energy of free 8
electrons on the hydrogen scale (sim45 eV) and g is the bandgap energy of the 9
semiconductor The value of for Y2O3 is obtained by the arithmetic mean of the electron 10
affinity and the first ionization of the constituent atoms reported in the literatures44
to be 535 11
eV Thus the CB and VB potentials of Y2O3 are calculated to be -195 and 365 eV versus 12
normal hydrogen electrode (NHE) respectively It can be seen that the VB potential of 13
sample is more positive than the redox potential of OHminus∙OH (189 VNHE) indicating that 14
the photogenerated holes have strong oxidative ability and they can oxidize OHminus into ∙OH In 15
addition the CB potential of sample is negative enough to reduce O2 to O2∙ minus
(minus013 VNHE) 16
via eminus 17
Based on these results a possible mechanism for the photocatalytic is proposed as 18
follows and shown in Fig 10 19
Y2O3 + hν rarr Y2O3 (h+e) (3) 20
Y2O3 (e) + GO rarr Y2O3 + GO (e) (4) 21
GO (e) + O2 rarr GO + O2bullminus (5) 22
Y2O3 (h) + OHminus rarrY2O3 + OH
bull (6) 23
Y2O3 (h) + O2bullminus
+ OHbull + MB rarr CO2 +H2O+SO4
2minus + NO3
minus + Cl
minus (7) 24
25
4 Conclusions 26
In conclusion a novel GOY nanocomposite with different GO content has been obtained 27
via a one-step hydrothermal method The FT-IR XRD EDX and XPS results showed the 28
yttrium was successfully composited with GO The morphology characterization showed the 29
as-obtained GOY had nanoflake structure After stirring for 30 min under dark about 80 30
Page 10 of 24Journal of Materials Chemistry A
Jour
nalo
fMat
eria
lsC
hem
istr
yA
Acc
epte
dM
anus
crip
t
Publ
ishe
d on
26
Mar
ch 2
014
Dow
nloa
ded
by N
atio
nal C
hung
Hsi
ng U
nive
rsity
on
120
420
14 1
036
16
View Article OnlineDOI 101039C4TA01057D
10
MB could be absorbed by Y2O3 and 5 GOY The as-prepared GOY had good degradation 1
performance on both MB and MO under UV irradiation Compared with other GOY 2
composites 5 GOY had better photocatalytic activity to MB Factors such as dosages of 3
photocatalyst contaminant concentration and solution pH on MB conversion were also 4
investigated and discussed The catalyst also showed good stability and recyclability It is 5
expected that the GOY nanocomposite would be a potential candidate for treatment of dye 6
containing wastewater 7
8
Acknowledgments 9
This work was supported by the National Natural Science Foundation of China (No 10
21307104) Natural Science Foundation of Jiangsu Province China (NoBK20130438) the 11
Scientific Research Project of Environmental Fund of Yangzhou City (YHK1303) and 12
Jiangsu Key Laboratory of Environmental Material and Engineering (K12031) We thank the 13
Testing Center of Yangzhou University for sample characterization 14
15
Notes and References 16
1 B K Korbahti K Artut C Gecgel A Ozer Chem Eng J 2011 173 677-688 17
2 V K Gupta D Pathania S Agarwal P Singh J Hazard Mater 2012 243 179-186 18
3 N Wetchakun S Chaiwichain B Inceesungvorn K Pingmuang S Phanichphant A I 19
Minett J Chen ACS Appl Mater Interfaces 2012 4 3718-3723 20
4 Y F Li D Xu J I Oh W Shen X Li Y Yu ACS Catal 2012 2 391-398 21
5 M Khan W B Cao J Mol Catal A Chem 2013 376 71-77 22
6 Y F Wu Q J Zhang X F Yin H Q Cheng RSC Advances 2013 3 9670-9676 23
7 F H Chu C W Huang C L Hsin C W Wang S Y Yu P H Yeh W W Wu 24
Nanoscale 2012 4 1471-1475 25
8 L J Xu J L Wang Environ Sci Technol 2012 46 10145-10153 26
9 Y C Zhang J Li H Y Xu Appl Catal B 2012 123-124 18-26 27
10 S Usai S Obreg n A I Becerro G ol n J Phys Chem C 2013 117 24479-24484 28
11 A K Geim K S Novoselov Nat Mater 2007 6 183-191 29
12 K-Y Shin J-Y Hong J Jang Adv Mater 2011 23 2113-2118 30
Page 11 of 24 Journal of Materials Chemistry A
Jour
nalo
fMat
eria
lsC
hem
istr
yA
Acc
epte
dM
anus
crip
t
Publ
ishe
d on
26
Mar
ch 2
014
Dow
nloa
ded
by N
atio
nal C
hung
Hsi
ng U
nive
rsity
on
120
420
14 1
036
16
View Article OnlineDOI 101039C4TA01057D
11
13 G K Pradhan D K Padhi K M Parida ACS Appl Mater Interfaces 2013 5 1
9101-9110 2
14 E Lee J Y Hong H Kang J Jang J Hazard Mater 2012 219-220 13-18 3
15 Y S Fu H Q Chen X Q Sun X Wang Appl Catal B 2012 111-112 280-287 4
16 K Krishnamoorthy R Mohan S J Kim Appl Phys Lett 2011 98 244101 5
17 M Li J Zhang Y Zhang Chem Phys Lett 2012 527 63-66 6
18 F Meng J Li Z Hong M Zhi A Sakla C Xiang N Wu Catal Today 2013 199 7
48-52 8
19 H Zhang K Tan H Zheng Y Gu W F Zhang Mater Chem Phys 2011 125 9
156-160 10
20 X Niu S Li H Chu J Zhou J Rare Earths 2011 29 225-229 11
21 H Narayan H Alemu L Setofolo L Macheli ISRN Phys Chem 2012 841521 1-9 12
22 M J Allen V C Tung R B Kaner Chem Rev 2010 110 132-145 13
23 F Y Ban S R Majid N M Huang H N Lim Int J Electrochem Sci 2012 7 14
4345-4351 15
24 Y L Min G Q He Q J Xu Y C Chen J Mater Chem A 2014 2 1294-1301 16
25 W Fan W Gao C Zhang W W Tjiu J S Pan T X Liu J Mater Chem 2012 22 17
25108-25115 18
26 Z -S Wu W Ren L Wen L Gao J Zhao Z Chen G Zhou F Li H -M Cheng ACS 19
Nano 2010 4 3187-3194 20
27 J A Dorman Y B Mao J R Bargar J P Chang J Phys Chem C 2010 114 21
17422-17427 22
28 R P Ermakov VV Voronov P P Fedorov Nanosystems physics chemistry 23
mathematics 2013 4 (2) 196-205 24
29 A Lerf H He M Forster J Klinowski J Phys Chem B 1998102(23) 4477-4482 25
30 G Wang Z Yang X Li C Li Carbon 2005 43(12) 2564-2570 26
31 S Stankovich D A Dikin R D Piner K A Kohlhaas A Kleinhammes Y Y Jia Y 27
Wu S T Nguyen R S Ruoff Carbon 2007 45 1558-1565 28
32 M Aghazadeh A Nozad H Adelkhani M Ghaemi J Electrochem Soc 2010 157 29
D519-D522 30
Page 12 of 24Journal of Materials Chemistry A
Jour
nalo
fMat
eria
lsC
hem
istr
yA
Acc
epte
dM
anus
crip
t
Publ
ishe
d on
26
Mar
ch 2
014
Dow
nloa
ded
by N
atio
nal C
hung
Hsi
ng U
nive
rsity
on
120
420
14 1
036
16
View Article OnlineDOI 101039C4TA01057D
12
33 L Nan Y Kazumichi J Solid State Chem 2008 181 1738-1743 1
34 R Srinivasan N R Yogamalar J Elanchezhiyan R J Joseyphus A C Bose J Alloy 2
Compd 2010 496 472-477 3
35 S Somacescu J M C Moreno P Osiceanu B L Su V Parvulescu J Phys Chem C 4
2010 114 19365 5
36 J H Pan W I Lee Chem Mater 2006 18 847-853 6
37 Y Chen B H Song X S Tang L Lu J M Xue J Mater Chem 2012 22 7
17656-17662 8
38 J Xu Y Chang Y Zhang S Ma Y Qu C Xu Appl Surf Sci 2008 255 1996-1999 9
39 LP Zhu NC Bing LL Wang HY Jin GH Liao LJ Wang Dalton Trans 2012 41 10
2959-2965 11
40 Z Pei L Ding H Lin S Weng Z Zheng Y Hou P Liu J Mater Chem A 2013 1 12
10099-10102 13
41Y L Pan S Z Deng L Polavarapu N Y Gao P Y Yuan C H Sow Q H Xu 14
Langmuir 2012 28 12304-12310 15
42 P Rouffignac J S Park R G Gordon Chem Mater 2005 17 4808-4814 16
43 H Xu H Li C Wu J Chu Y Yan H Shu Z Gu J Hazard Mater 2008 153 17
877-880 18
44 T Andersen H K Haugen H Hotop J Phys Chem Ref Data 1999 28(6) 1511-1533 19
20
Page 13 of 24 Journal of Materials Chemistry A
Jour
nalo
fMat
eria
lsC
hem
istr
yA
Acc
epte
dM
anus
crip
t
Publ
ishe
d on
26
Mar
ch 2
014
Dow
nloa
ded
by N
atio
nal C
hung
Hsi
ng U
nive
rsity
on
120
420
14 1
036
16
View Article OnlineDOI 101039C4TA01057D
13
Figure captions 1
2
Figure 1 FT-IR spectra of GO Y2O3 and 5 GOY composites 3
Figure 2 XRD patterns of GO Y2O3 and 5 GOY composites 4
Figure 3 TGA curves of GO Y2O3 and 5 GOY composites 5
Figure 4 FESEM images of (A) Y2O3 (Insert low magnification) (B) GO (C) 5 GOY and 6
(D) 20 GOY composites (Insert EDS spectrum of 20 GOY sample) (E) and (F) 7
HRTEM images of 5 GOY taken after intense ultrasonic dispersion in ethanol for 30 8
min 9
Figure 5 XPS spectra (A) full survey spectra of GO Y2O3 and GOY nanocomposite (B) Y 10
3d of 5 GOY (C) O 1s of 5 GOY (D) C 1s of 5 GOY 11
Figure 6 Comparison of photodegradation efficiency using as-synthesized GO Y2O3 and 12
GOY composites 13
Figure 7 (A) Effect of dosage on MB conversion MB concentration 25 ppm pH = 41 (B) 14
Effect of MB concentration on the degradation Dosage 10 mg pH = 41 (C) Effect of 15
solution pH on MB conversion MB concentration 25 ppm Dosage 10 mg 16
Figure 8 Photocurrent responses of GO Y2O3 and 5 GOY photoelectrodes under UV 17
illumination Insert Photocurrent responses of 5 GOY under different illumination 18
conditions Scan rate 50 mVs The electrolyte solution was 05 M NaCl 19
Figure 9 PL spectra of Y2O3 5 GOY and 20 GOY samples (λex = 258 nm) 20
Figure 10 Proposed mechanism for the photodegradation of MB on GOY composite21
Page 14 of 24Journal of Materials Chemistry A
Jour
nalo
fMat
eria
lsC
hem
istr
yA
Acc
epte
dM
anus
crip
t
Publ
ishe
d on
26
Mar
ch 2
014
Dow
nloa
ded
by N
atio
nal C
hung
Hsi
ng U
nive
rsity
on
120
420
14 1
036
16
View Article OnlineDOI 101039C4TA01057D
14
Figure 1 1
2
3
4
500 1000 1500 2000 2500 3000 3500 4000
1657
Tra
ns
mit
tan
ce
Wavenumber cm-1
1657
1550
1564 17211223
1436
1436
GO
Y2O
3
5GOY
5
6
Page 15 of 24 Journal of Materials Chemistry A
Jour
nalo
fMat
eria
lsC
hem
istr
yA
Acc
epte
dM
anus
crip
t
Publ
ishe
d on
26
Mar
ch 2
014
Dow
nloa
ded
by N
atio
nal C
hung
Hsi
ng U
nive
rsity
on
120
420
14 1
036
16
View Article OnlineDOI 101039C4TA01057D
15
Figure 2 1
2
3
10 20 30 40 50 60 70
5GOY2O
3
Inte
ns
ity
a
u
2degree
GO
Y2O
3
4
5
6
Page 16 of 24Journal of Materials Chemistry A
Jour
nalo
fMat
eria
lsC
hem
istr
yA
Acc
epte
dM
anus
crip
t
Publ
ishe
d on
26
Mar
ch 2
014
Dow
nloa
ded
by N
atio
nal C
hung
Hsi
ng U
nive
rsity
on
120
420
14 1
036
16
View Article OnlineDOI 101039C4TA01057D
16
Figure 3 1
2
0 100 200 300 400 500 60040
50
60
70
80
90
100
5GOY
Y2O
3
GO
We
igh
t
Temperature oC
3
4
Page 17 of 24 Journal of Materials Chemistry A
Jour
nalo
fMat
eria
lsC
hem
istr
yA
Acc
epte
dM
anus
crip
t
Publ
ishe
d on
26
Mar
ch 2
014
Dow
nloa
ded
by N
atio
nal C
hung
Hsi
ng U
nive
rsity
on
120
420
14 1
036
16
View Article OnlineDOI 101039C4TA01057D
17
Figure 4 1
2
3
4
5
6
7
8
9
10
11
12
13
14
15
16
17
18
19
20
21
22
23
24
25
26
27
28
29
30
31
32
33
34
35
36
37
38
39
40
41
Page 18 of 24Journal of Materials Chemistry A
Jour
nalo
fMat
eria
lsC
hem
istr
yA
Acc
epte
dM
anus
crip
t
Publ
ishe
d on
26
Mar
ch 2
014
Dow
nloa
ded
by N
atio
nal C
hung
Hsi
ng U
nive
rsity
on
120
420
14 1
036
16
View Article OnlineDOI 101039C4TA01057D
18
Figure 5 1
2
3
1200 1000 800 600 400 200 0
Y 3d
C 1s
20 GOY
5 GOY
Y2O
3
Inte
ns
ity
a
u
Binding Energy eV
GO
O 1s
A
150 155 160 165 170 175
Inte
ns
ity
a
u
Binding Energy eV
Y 3d32
BY 3d
52
4
5
6
526 528 530 532 534 536
Inte
ns
ity
a
u
Binding Energy eV
O 1sC
282 284 286 288 290 292
Inte
ns
ity
a
u
Binding Energy eV
C-C
C-OC=O O-C=O
DC 1s
7
8
Page 19 of 24 Journal of Materials Chemistry A
Jour
nalo
fMat
eria
lsC
hem
istr
yA
Acc
epte
dM
anus
crip
t
Publ
ishe
d on
26
Mar
ch 2
014
Dow
nloa
ded
by N
atio
nal C
hung
Hsi
ng U
nive
rsity
on
120
420
14 1
036
16
View Article OnlineDOI 101039C4TA01057D
19
1
Figure 6 2
3
00
02
04
06
08
10
12
Y2O
3
20GOY
50GOY
10GOY
5GOYCo
nv
ers
ion
Photocatalysts
MO
MB
GO
4
5
6
7
8
Page 20 of 24Journal of Materials Chemistry A
Jour
nalo
fMat
eria
lsC
hem
istr
yA
Acc
epte
dM
anus
crip
t
Publ
ishe
d on
26
Mar
ch 2
014
Dow
nloa
ded
by N
atio
nal C
hung
Hsi
ng U
nive
rsity
on
120
420
14 1
036
16
View Article OnlineDOI 101039C4TA01057D
20
Figure 7 1
2
-5 0 5 10 15 20 25 30 35 40060
070
080
090
Co
nv
ers
ion
Time min
5 mg
6 mg
7 mg
8 mg
9 mg
10 mg
A100
-5 0 5 10 15 20 25 30 35 40
060
070
080
090
Co
nv
ers
ion
Time min
200 mg L-1
225 mg L-1
250 mg L-1
275 mg L-1
300 mg L-1
B100
3
4
-5 0 5 10 15 20 25 30 35 40
110
050
060
070
080
090
Co
nv
ers
ion
Time min
pH 303
pH 418
pH 519
pH 630
100
C
5
6
7
8
9
Page 21 of 24 Journal of Materials Chemistry A
Jour
nalo
fMat
eria
lsC
hem
istr
yA
Acc
epte
dM
anus
crip
t
Publ
ishe
d on
26
Mar
ch 2
014
Dow
nloa
ded
by N
atio
nal C
hung
Hsi
ng U
nive
rsity
on
120
420
14 1
036
16
View Article OnlineDOI 101039C4TA01057D
21
1
2
Figure 8 3
4
5
6
7
02 00 -02 -04
0
5
10
15
20j
A
cm
-2
E V (vs SCE)
Y2O
3
GO
5GOY
02 01 00 -01 -02 -0300
05
10
15
20
25
30
35
j A
cm
-2
E V (vs SCE)
Uv
Vis
Dark
5GOY
Page 22 of 24Journal of Materials Chemistry A
Jour
nalo
fMat
eria
lsC
hem
istr
yA
Acc
epte
dM
anus
crip
t
Publ
ishe
d on
26
Mar
ch 2
014
Dow
nloa
ded
by N
atio
nal C
hung
Hsi
ng U
nive
rsity
on
120
420
14 1
036
16
View Article OnlineDOI 101039C4TA01057D
22
1
2
Figure 9 3
4
400 450 500 550 600 650 700 750 800
Inte
ns
ity
a
u
Wavelength nm
20 GOY
5 GOY
Y2O
3
5
6
7
Page 23 of 24 Journal of Materials Chemistry A
Jour
nalo
fMat
eria
lsC
hem
istr
yA
Acc
epte
dM
anus
crip
t
Publ
ishe
d on
26
Mar
ch 2
014
Dow
nloa
ded
by N
atio
nal C
hung
Hsi
ng U
nive
rsity
on
120
420
14 1
036
16
View Article OnlineDOI 101039C4TA01057D
23
1
Figure 10 2
3
4
5
6
Page 24 of 24Journal of Materials Chemistry A
Jour
nalo
fMat
eria
lsC
hem
istr
yA
Acc
epte
dM
anus
crip
t
Publ
ishe
d on
26
Mar
ch 2
014
Dow
nloa
ded
by N
atio
nal C
hung
Hsi
ng U
nive
rsity
on
120
420
14 1
036
16
View Article OnlineDOI 101039C4TA01057D
5
electrode (SCE) on a Model CHI 660E electrochemical workstation under a 500 W 1
high-pressure mercury lamp irradiation 2
3
3 Results and discussion 4
31 FT-IR spectra XRD and TGA Analysis 5
FT-IR measurement is employed to investigate the bonding interactions in GO before 6
and after the oxidation process FT-IR spectra of GO Y2O3 and 5 GOY are shown in Fig 1 7
In the spectrum of GO the peak at about 1721 cm-1
is attributed to the stretching vibrations of 8
C=O The peaks appear at about 1223 and 1564 cm-1
correspond to the stretching vibrations 9
of C-O and C=C respectively23
The FT-IR spectra of Y2O3 and 5 GOY composite have 10
similar curve shape while a new peak appears at 1550 cm-1
of 5 GOY This result indicates 11
the GO has successfully composited with Y2O3 12
Fig 2 shows the crystal structure of GO Y2O3 and 5 GOY composite GO shows a 13
sharp peak at 2θ = 105o corresponding to the (001) reflection of graphite oxide
152425 The 14
diffraction peaks observed at 2θ = 421deg originate from disorderedly stacked GO sheets26
The 15
peaks located at 198deg 286deg 351deg 501deg 494deg and 512deg (2θ) result from the presence of 16
Y2O3 which are in agreement with the theoretical data of hematite (JCPDS No 41-0015)2728
17
In the pattern of 5 GOY the presence of diffraction peak at 2θ of 421deg indicating that GO 18
exists in the composite material It should be noted that there is a diffraction peak observed at 19
2θ = 101deg on both patterns of Y2O3 and 5 GOY which originates from intermediate YO(OH) 20
structure27
21
Fig 3 presents results of TGA analysis of the as-synthesized GO Y2O3 and 5 GOY 22
composite powder The samples were heated from room temperature to 600 degC at 5 degC min-1
23
under N2 flow As can be seen in Fig3 GO starts to lose mass upon heating even below 24
100 degC The major mass loss occurs at about 200 degC is caused by pyrolysis of the 25
oxygen-containing functional groups generating CO CO2 and stream29-31
Y2O3 and 5 GOY 26
have the same shape and show mass losses at three temperature ~100 320 and 400 degC The 27
first mass loss at about 100 degC is related to dehydration of free and physically absorbed 28
molecular water The next mass loss at about 320 degC is supposed to be related with the first 29
dehydration of chemisorbed and combined water from Y(OH)33233
The third mass loss at 30
Page 6 of 24Journal of Materials Chemistry A
Jour
nalo
fMat
eria
lsC
hem
istr
yA
Acc
epte
dM
anus
crip
t
Publ
ishe
d on
26
Mar
ch 2
014
Dow
nloa
ded
by N
atio
nal C
hung
Hsi
ng U
nive
rsity
on
120
420
14 1
036
16
View Article OnlineDOI 101039C4TA01057D
6
about 400 degC confirms dehydration of structural water from YOOH phase34
1
32 Morphology Characterization 2
The morphology of the as-obtained samples are examined by FESEM It can be 3
observed in Fig 4A that the as-prepared Y2O3 illustrates a uniform flake-like shape with 4
irregular edges Its lateral size ranges from 70 to 150 nm and thickness is around 10 to 20 nm 5
It can be observed that the prepared graphene oxide illustrates the flake-like shape and 6
layer-layer structure of graphene oxide edges (Fig 4B) Fig 4C and D displays the 7
morphologies of 5 GOY and 20 GOY composites respectively As can be seen with GO 8
content increasing the flake-like structure becomes irregular At the same time GO and Y2O3 9
aggregate The EDX profile (Fig 4D insert) exhibits strong carbon oxygen and yttrium peaks 10
Fig 4E and F exhibit HRTEM images of the GOY composite As shown in Fig 4E and F the 11
lattice fringes of Y2O3 nanocrystals and GO are simultaneously observed indicating strong 12
interactions between Y and the GO support The resolved lattice fringes of (111) planes (d = 13
031 nm) are attributed to GO and the lattice fringes of (111) planes (d = 027 nm) are 14
assigned to Y2O3 nanocrystals 15
33 XPS analysis 16
Fig 5A shows the XPS full survey spectra in the binding energy range of 0-1100 eV for 17
GO Y2O3 5 GOY and 20 GOY composite As shown in Fig 5A all the samples contain C 18
and O however the Y-contained samples show two peaks at about 1582 eV and 1600 eV 19
which are attributed to Y6 Fig 5B-D shows the high-resolution XPS regional spectra of Y 3d 20
O 1s and C 1s for 5 GOY respectively The relatively strong peaks at 1581 eV and 1599 eV 21
can be attributed to Y 3d52 and Y 3d32 respectively (Fig 5B) These results are in agreement 22
with values of Y2O3 reported in the literature35
It is well reported that yttrium retards the 23
combination of photogenerated electron-hole pairs41718
this may be due to the presence of 24
extra hydroxyl species to delay recombination through hole trapping6 Three kinds of surface 25
oxygen species could be distinguished in the O 1s spectra as shown in Fig 5C The binding 26
energy of 5309 eV 5318 and 5330 eV are ascribed to the lattice oxygen the hydroxyl 27
groups and the C-OH respectively36
As shown in Fig 5D the XPS spectrum of C 1s from 5 28
GOY is collected which can be deconvoluted into four peaks sp2 bonded carbon at 2848 eV 29
(CndashC) epoxyhydroxyls at 2860 eV (CndashO) carbonyls at 2879 eV (C=O) and carboxyls at 30
Page 7 of 24 Journal of Materials Chemistry A
Jour
nalo
fMat
eria
lsC
hem
istr
yA
Acc
epte
dM
anus
crip
t
Publ
ishe
d on
26
Mar
ch 2
014
Dow
nloa
ded
by N
atio
nal C
hung
Hsi
ng U
nive
rsity
on
120
420
14 1
036
16
View Article OnlineDOI 101039C4TA01057D
7
2891 eV (OndashC=O) indicating the high percentage of oxygen-contained functional groups37
1
Chemisorbed surface hydroxyl groups can enhance photocatalysis by trapping photoinduced 2
holes resulting in an increase in the formation of highly oxidizing OH radicals38
3
34 Photocatalytic Activity for dye degradation 4
For comparative purposes the photodegradation efficiencies of MB and MO mediated 5
by the different photocatalysts under UV irradiation are shown in Fig 6 Before comparison 6
the adsorption and photodegradation performances of GO Y2O3 and 5 GOY on MB were 7
investigated (Fig S1) As displayed in Fig S1 both Y2O3 and 5 GOY have good adsorption 8
affinity to MB After stirring for 30 min under dark about 80 MB could be absorbed by 9
Y2O3 and 5 GOY which is much better than GO (lower than 20) After photocatalysis for 10
35min MB can be degraded thoroughly by 5 GOY Then the photocatalytic activities of the 11
GO Y2O3 5 GOY 10 GOY 20 GOY and 50 GOY composite photocatalysts were compared 12
via the reduction of MB and MO under ambient temperature Photodegradation time is 35 13
min It has been reported that a large surface area helps to increase the photocatalytic reaction 14
sites39
From the O1s spectrum of Y2O3 (Fig S2 supplementary material) the oxygen 15
composition of Y2O3 and 5 GOY samples at different states (Table S1 supplementary 16
material) more OH radicals are available in 5 GOY As expected under UV irradiation the 17
degradation of MB is slower than 10 with a GO photocatalyst However the conversion of 18
MB reaches 95 after 35 min when using Y2O3 as a photocatalyst The four kinds of GOY 19
samples exhibite better photocatalytic properties in the degradation of MB than bare GO and 20
Y2O3 under UV irradiation Moreover with increasing the amount of GO the degradation of 21
MB increases slowly Considering the simplicity and economy of the MB degradation 5 22
GOY is selected as the photocatalyst in the following experiments The photocatalytic 23
activities of 5 GOY was compared with commercial TiO2 P25 (Fig S3 supplementary 24
material) indicating the photocatalytic property of 5 GOY was quite comparable with P25 25
The GOY composites also have photocatalytic activities to MO As can be seen in Fig 6 GO 26
has good affinity to MO and the 50 GOY has best degradation efficiency to MO among the 27
GOY composites 28
The photocatalyst dosage may affect the MB degradation efficiency Fig 7A illustrates 29
MB degradation at varying photocatalyst dosages (5 to 10 mg) MB degradation efficiency 30
Page 8 of 24Journal of Materials Chemistry A
Jour
nalo
fMat
eria
lsC
hem
istr
yA
Acc
epte
dM
anus
crip
t
Publ
ishe
d on
26
Mar
ch 2
014
Dow
nloa
ded
by N
atio
nal C
hung
Hsi
ng U
nive
rsity
on
120
420
14 1
036
16
View Article OnlineDOI 101039C4TA01057D
8
increases with increasing the contact time In addition with increasing the dosage the MB 1
degradation efficiency slowly increases As displayed in Fig 7A the best dosage is 10 mg 2
As the MB concentration may also influence degradation MB degradation under various 3
concentration of MB is investigated It can be seen clearly in Fig 7B that MB conversion 4
efficiency is as much as 100 after degradation for 35 min when the MB concentration is 5
lower than 25 mg L-1
The conversion efficiency will decrease when the MB concentration is 6
higher than 275 mg L-1
The final conversion efficiency will no more than 90 if 300 mg 7
L-1
MB solution is used 8
Because the solution pH can remarkably influence MB degradation the effect of initial 9
pH on the degradation of MB with 5 GOY catalyst is determined as presented in Fig 7C As 10
shown in Fig 7C the conversion of MB will finally reach 100 when the solution pH is 11
lower than 519 If the solution pH controlled at 63 the conversion efficiency will decrease 12
sharply and only 80 MB will convert after 35 min Therefore the solution pH is set at 41 13
35 Photocatalytic mechanism 14
The magnitude of the photocurrent represents the charge collection efficiency of the 15
electrode surface and indirectly indicates the separated efficiency of electron-hole pairs40
16
From the insert of Fig 8 5 GOY modified photoelectrode is prompted in generating 17
photocurrent under visible and UV-visible light GOY photoelectrodes yield the greater 18
photocurrent than Y2O3 photoelectrode under UV irradiation in Fig 8 19
Fig 9 shows the PL spectra of the Y2O3 and GOY photocatalysts With Y2O3 as 20
photocatalyst the PL signal centered around 450 nm is detected revealing that ∙OH radicals 21
are generated on the irradiated Y2O3 When GOY nanocomposites are used as the 22
photocatalysts the PL signal intensity is increased which suggests that the yield of ∙OH 23
radicals is enhanced on the irradiated GOY nanocomposite The enhancement in 24
photoactivity can be attributed to the remarkable synergistic effect of the combination of 25
Y2O3 and the GO sheets leading to the efficient separation of photogenerated carriers in the 26
Y2O3 and GO coupling system 27
It is well known that the photodegradation process of the photocatalysts is strongly 28
relative to electron-hole pairs generated by light irradiation on catalysts The photogenerated 29
electrons and holes can migrate to the surface of the catalysts and then can be trapped 30
Page 9 of 24 Journal of Materials Chemistry A
Jour
nalo
fMat
eria
lsC
hem
istr
yA
Acc
epte
dM
anus
crip
t
Publ
ishe
d on
26
Mar
ch 2
014
Dow
nloa
ded
by N
atio
nal C
hung
Hsi
ng U
nive
rsity
on
120
420
14 1
036
16
View Article OnlineDOI 101039C4TA01057D
9
generally by the oxygen and surface hydroxyls to ultimately produce hydroxyl radicals (middotOH) 1
that react with the adsorbed reactants41
As we know Y2O3 is n-type semiconductor with a 2
wide band gap about 56 eV42
To understand the charge separation process of Y2O3 and 3
GOYs the band edge positions of conduction band (CB) and valence band (VB) of 4
semiconductor Y2O3 has been calculated by the following equation43
5
EVB = X - Ee + 05Eg (1) 6
ECB = EVB - Eg (2) 7
where is the absolute electronegativity of the semiconductor e is the energy of free 8
electrons on the hydrogen scale (sim45 eV) and g is the bandgap energy of the 9
semiconductor The value of for Y2O3 is obtained by the arithmetic mean of the electron 10
affinity and the first ionization of the constituent atoms reported in the literatures44
to be 535 11
eV Thus the CB and VB potentials of Y2O3 are calculated to be -195 and 365 eV versus 12
normal hydrogen electrode (NHE) respectively It can be seen that the VB potential of 13
sample is more positive than the redox potential of OHminus∙OH (189 VNHE) indicating that 14
the photogenerated holes have strong oxidative ability and they can oxidize OHminus into ∙OH In 15
addition the CB potential of sample is negative enough to reduce O2 to O2∙ minus
(minus013 VNHE) 16
via eminus 17
Based on these results a possible mechanism for the photocatalytic is proposed as 18
follows and shown in Fig 10 19
Y2O3 + hν rarr Y2O3 (h+e) (3) 20
Y2O3 (e) + GO rarr Y2O3 + GO (e) (4) 21
GO (e) + O2 rarr GO + O2bullminus (5) 22
Y2O3 (h) + OHminus rarrY2O3 + OH
bull (6) 23
Y2O3 (h) + O2bullminus
+ OHbull + MB rarr CO2 +H2O+SO4
2minus + NO3
minus + Cl
minus (7) 24
25
4 Conclusions 26
In conclusion a novel GOY nanocomposite with different GO content has been obtained 27
via a one-step hydrothermal method The FT-IR XRD EDX and XPS results showed the 28
yttrium was successfully composited with GO The morphology characterization showed the 29
as-obtained GOY had nanoflake structure After stirring for 30 min under dark about 80 30
Page 10 of 24Journal of Materials Chemistry A
Jour
nalo
fMat
eria
lsC
hem
istr
yA
Acc
epte
dM
anus
crip
t
Publ
ishe
d on
26
Mar
ch 2
014
Dow
nloa
ded
by N
atio
nal C
hung
Hsi
ng U
nive
rsity
on
120
420
14 1
036
16
View Article OnlineDOI 101039C4TA01057D
10
MB could be absorbed by Y2O3 and 5 GOY The as-prepared GOY had good degradation 1
performance on both MB and MO under UV irradiation Compared with other GOY 2
composites 5 GOY had better photocatalytic activity to MB Factors such as dosages of 3
photocatalyst contaminant concentration and solution pH on MB conversion were also 4
investigated and discussed The catalyst also showed good stability and recyclability It is 5
expected that the GOY nanocomposite would be a potential candidate for treatment of dye 6
containing wastewater 7
8
Acknowledgments 9
This work was supported by the National Natural Science Foundation of China (No 10
21307104) Natural Science Foundation of Jiangsu Province China (NoBK20130438) the 11
Scientific Research Project of Environmental Fund of Yangzhou City (YHK1303) and 12
Jiangsu Key Laboratory of Environmental Material and Engineering (K12031) We thank the 13
Testing Center of Yangzhou University for sample characterization 14
15
Notes and References 16
1 B K Korbahti K Artut C Gecgel A Ozer Chem Eng J 2011 173 677-688 17
2 V K Gupta D Pathania S Agarwal P Singh J Hazard Mater 2012 243 179-186 18
3 N Wetchakun S Chaiwichain B Inceesungvorn K Pingmuang S Phanichphant A I 19
Minett J Chen ACS Appl Mater Interfaces 2012 4 3718-3723 20
4 Y F Li D Xu J I Oh W Shen X Li Y Yu ACS Catal 2012 2 391-398 21
5 M Khan W B Cao J Mol Catal A Chem 2013 376 71-77 22
6 Y F Wu Q J Zhang X F Yin H Q Cheng RSC Advances 2013 3 9670-9676 23
7 F H Chu C W Huang C L Hsin C W Wang S Y Yu P H Yeh W W Wu 24
Nanoscale 2012 4 1471-1475 25
8 L J Xu J L Wang Environ Sci Technol 2012 46 10145-10153 26
9 Y C Zhang J Li H Y Xu Appl Catal B 2012 123-124 18-26 27
10 S Usai S Obreg n A I Becerro G ol n J Phys Chem C 2013 117 24479-24484 28
11 A K Geim K S Novoselov Nat Mater 2007 6 183-191 29
12 K-Y Shin J-Y Hong J Jang Adv Mater 2011 23 2113-2118 30
Page 11 of 24 Journal of Materials Chemistry A
Jour
nalo
fMat
eria
lsC
hem
istr
yA
Acc
epte
dM
anus
crip
t
Publ
ishe
d on
26
Mar
ch 2
014
Dow
nloa
ded
by N
atio
nal C
hung
Hsi
ng U
nive
rsity
on
120
420
14 1
036
16
View Article OnlineDOI 101039C4TA01057D
11
13 G K Pradhan D K Padhi K M Parida ACS Appl Mater Interfaces 2013 5 1
9101-9110 2
14 E Lee J Y Hong H Kang J Jang J Hazard Mater 2012 219-220 13-18 3
15 Y S Fu H Q Chen X Q Sun X Wang Appl Catal B 2012 111-112 280-287 4
16 K Krishnamoorthy R Mohan S J Kim Appl Phys Lett 2011 98 244101 5
17 M Li J Zhang Y Zhang Chem Phys Lett 2012 527 63-66 6
18 F Meng J Li Z Hong M Zhi A Sakla C Xiang N Wu Catal Today 2013 199 7
48-52 8
19 H Zhang K Tan H Zheng Y Gu W F Zhang Mater Chem Phys 2011 125 9
156-160 10
20 X Niu S Li H Chu J Zhou J Rare Earths 2011 29 225-229 11
21 H Narayan H Alemu L Setofolo L Macheli ISRN Phys Chem 2012 841521 1-9 12
22 M J Allen V C Tung R B Kaner Chem Rev 2010 110 132-145 13
23 F Y Ban S R Majid N M Huang H N Lim Int J Electrochem Sci 2012 7 14
4345-4351 15
24 Y L Min G Q He Q J Xu Y C Chen J Mater Chem A 2014 2 1294-1301 16
25 W Fan W Gao C Zhang W W Tjiu J S Pan T X Liu J Mater Chem 2012 22 17
25108-25115 18
26 Z -S Wu W Ren L Wen L Gao J Zhao Z Chen G Zhou F Li H -M Cheng ACS 19
Nano 2010 4 3187-3194 20
27 J A Dorman Y B Mao J R Bargar J P Chang J Phys Chem C 2010 114 21
17422-17427 22
28 R P Ermakov VV Voronov P P Fedorov Nanosystems physics chemistry 23
mathematics 2013 4 (2) 196-205 24
29 A Lerf H He M Forster J Klinowski J Phys Chem B 1998102(23) 4477-4482 25
30 G Wang Z Yang X Li C Li Carbon 2005 43(12) 2564-2570 26
31 S Stankovich D A Dikin R D Piner K A Kohlhaas A Kleinhammes Y Y Jia Y 27
Wu S T Nguyen R S Ruoff Carbon 2007 45 1558-1565 28
32 M Aghazadeh A Nozad H Adelkhani M Ghaemi J Electrochem Soc 2010 157 29
D519-D522 30
Page 12 of 24Journal of Materials Chemistry A
Jour
nalo
fMat
eria
lsC
hem
istr
yA
Acc
epte
dM
anus
crip
t
Publ
ishe
d on
26
Mar
ch 2
014
Dow
nloa
ded
by N
atio
nal C
hung
Hsi
ng U
nive
rsity
on
120
420
14 1
036
16
View Article OnlineDOI 101039C4TA01057D
12
33 L Nan Y Kazumichi J Solid State Chem 2008 181 1738-1743 1
34 R Srinivasan N R Yogamalar J Elanchezhiyan R J Joseyphus A C Bose J Alloy 2
Compd 2010 496 472-477 3
35 S Somacescu J M C Moreno P Osiceanu B L Su V Parvulescu J Phys Chem C 4
2010 114 19365 5
36 J H Pan W I Lee Chem Mater 2006 18 847-853 6
37 Y Chen B H Song X S Tang L Lu J M Xue J Mater Chem 2012 22 7
17656-17662 8
38 J Xu Y Chang Y Zhang S Ma Y Qu C Xu Appl Surf Sci 2008 255 1996-1999 9
39 LP Zhu NC Bing LL Wang HY Jin GH Liao LJ Wang Dalton Trans 2012 41 10
2959-2965 11
40 Z Pei L Ding H Lin S Weng Z Zheng Y Hou P Liu J Mater Chem A 2013 1 12
10099-10102 13
41Y L Pan S Z Deng L Polavarapu N Y Gao P Y Yuan C H Sow Q H Xu 14
Langmuir 2012 28 12304-12310 15
42 P Rouffignac J S Park R G Gordon Chem Mater 2005 17 4808-4814 16
43 H Xu H Li C Wu J Chu Y Yan H Shu Z Gu J Hazard Mater 2008 153 17
877-880 18
44 T Andersen H K Haugen H Hotop J Phys Chem Ref Data 1999 28(6) 1511-1533 19
20
Page 13 of 24 Journal of Materials Chemistry A
Jour
nalo
fMat
eria
lsC
hem
istr
yA
Acc
epte
dM
anus
crip
t
Publ
ishe
d on
26
Mar
ch 2
014
Dow
nloa
ded
by N
atio
nal C
hung
Hsi
ng U
nive
rsity
on
120
420
14 1
036
16
View Article OnlineDOI 101039C4TA01057D
13
Figure captions 1
2
Figure 1 FT-IR spectra of GO Y2O3 and 5 GOY composites 3
Figure 2 XRD patterns of GO Y2O3 and 5 GOY composites 4
Figure 3 TGA curves of GO Y2O3 and 5 GOY composites 5
Figure 4 FESEM images of (A) Y2O3 (Insert low magnification) (B) GO (C) 5 GOY and 6
(D) 20 GOY composites (Insert EDS spectrum of 20 GOY sample) (E) and (F) 7
HRTEM images of 5 GOY taken after intense ultrasonic dispersion in ethanol for 30 8
min 9
Figure 5 XPS spectra (A) full survey spectra of GO Y2O3 and GOY nanocomposite (B) Y 10
3d of 5 GOY (C) O 1s of 5 GOY (D) C 1s of 5 GOY 11
Figure 6 Comparison of photodegradation efficiency using as-synthesized GO Y2O3 and 12
GOY composites 13
Figure 7 (A) Effect of dosage on MB conversion MB concentration 25 ppm pH = 41 (B) 14
Effect of MB concentration on the degradation Dosage 10 mg pH = 41 (C) Effect of 15
solution pH on MB conversion MB concentration 25 ppm Dosage 10 mg 16
Figure 8 Photocurrent responses of GO Y2O3 and 5 GOY photoelectrodes under UV 17
illumination Insert Photocurrent responses of 5 GOY under different illumination 18
conditions Scan rate 50 mVs The electrolyte solution was 05 M NaCl 19
Figure 9 PL spectra of Y2O3 5 GOY and 20 GOY samples (λex = 258 nm) 20
Figure 10 Proposed mechanism for the photodegradation of MB on GOY composite21
Page 14 of 24Journal of Materials Chemistry A
Jour
nalo
fMat
eria
lsC
hem
istr
yA
Acc
epte
dM
anus
crip
t
Publ
ishe
d on
26
Mar
ch 2
014
Dow
nloa
ded
by N
atio
nal C
hung
Hsi
ng U
nive
rsity
on
120
420
14 1
036
16
View Article OnlineDOI 101039C4TA01057D
14
Figure 1 1
2
3
4
500 1000 1500 2000 2500 3000 3500 4000
1657
Tra
ns
mit
tan
ce
Wavenumber cm-1
1657
1550
1564 17211223
1436
1436
GO
Y2O
3
5GOY
5
6
Page 15 of 24 Journal of Materials Chemistry A
Jour
nalo
fMat
eria
lsC
hem
istr
yA
Acc
epte
dM
anus
crip
t
Publ
ishe
d on
26
Mar
ch 2
014
Dow
nloa
ded
by N
atio
nal C
hung
Hsi
ng U
nive
rsity
on
120
420
14 1
036
16
View Article OnlineDOI 101039C4TA01057D
15
Figure 2 1
2
3
10 20 30 40 50 60 70
5GOY2O
3
Inte
ns
ity
a
u
2degree
GO
Y2O
3
4
5
6
Page 16 of 24Journal of Materials Chemistry A
Jour
nalo
fMat
eria
lsC
hem
istr
yA
Acc
epte
dM
anus
crip
t
Publ
ishe
d on
26
Mar
ch 2
014
Dow
nloa
ded
by N
atio
nal C
hung
Hsi
ng U
nive
rsity
on
120
420
14 1
036
16
View Article OnlineDOI 101039C4TA01057D
16
Figure 3 1
2
0 100 200 300 400 500 60040
50
60
70
80
90
100
5GOY
Y2O
3
GO
We
igh
t
Temperature oC
3
4
Page 17 of 24 Journal of Materials Chemistry A
Jour
nalo
fMat
eria
lsC
hem
istr
yA
Acc
epte
dM
anus
crip
t
Publ
ishe
d on
26
Mar
ch 2
014
Dow
nloa
ded
by N
atio
nal C
hung
Hsi
ng U
nive
rsity
on
120
420
14 1
036
16
View Article OnlineDOI 101039C4TA01057D
17
Figure 4 1
2
3
4
5
6
7
8
9
10
11
12
13
14
15
16
17
18
19
20
21
22
23
24
25
26
27
28
29
30
31
32
33
34
35
36
37
38
39
40
41
Page 18 of 24Journal of Materials Chemistry A
Jour
nalo
fMat
eria
lsC
hem
istr
yA
Acc
epte
dM
anus
crip
t
Publ
ishe
d on
26
Mar
ch 2
014
Dow
nloa
ded
by N
atio
nal C
hung
Hsi
ng U
nive
rsity
on
120
420
14 1
036
16
View Article OnlineDOI 101039C4TA01057D
18
Figure 5 1
2
3
1200 1000 800 600 400 200 0
Y 3d
C 1s
20 GOY
5 GOY
Y2O
3
Inte
ns
ity
a
u
Binding Energy eV
GO
O 1s
A
150 155 160 165 170 175
Inte
ns
ity
a
u
Binding Energy eV
Y 3d32
BY 3d
52
4
5
6
526 528 530 532 534 536
Inte
ns
ity
a
u
Binding Energy eV
O 1sC
282 284 286 288 290 292
Inte
ns
ity
a
u
Binding Energy eV
C-C
C-OC=O O-C=O
DC 1s
7
8
Page 19 of 24 Journal of Materials Chemistry A
Jour
nalo
fMat
eria
lsC
hem
istr
yA
Acc
epte
dM
anus
crip
t
Publ
ishe
d on
26
Mar
ch 2
014
Dow
nloa
ded
by N
atio
nal C
hung
Hsi
ng U
nive
rsity
on
120
420
14 1
036
16
View Article OnlineDOI 101039C4TA01057D
19
1
Figure 6 2
3
00
02
04
06
08
10
12
Y2O
3
20GOY
50GOY
10GOY
5GOYCo
nv
ers
ion
Photocatalysts
MO
MB
GO
4
5
6
7
8
Page 20 of 24Journal of Materials Chemistry A
Jour
nalo
fMat
eria
lsC
hem
istr
yA
Acc
epte
dM
anus
crip
t
Publ
ishe
d on
26
Mar
ch 2
014
Dow
nloa
ded
by N
atio
nal C
hung
Hsi
ng U
nive
rsity
on
120
420
14 1
036
16
View Article OnlineDOI 101039C4TA01057D
20
Figure 7 1
2
-5 0 5 10 15 20 25 30 35 40060
070
080
090
Co
nv
ers
ion
Time min
5 mg
6 mg
7 mg
8 mg
9 mg
10 mg
A100
-5 0 5 10 15 20 25 30 35 40
060
070
080
090
Co
nv
ers
ion
Time min
200 mg L-1
225 mg L-1
250 mg L-1
275 mg L-1
300 mg L-1
B100
3
4
-5 0 5 10 15 20 25 30 35 40
110
050
060
070
080
090
Co
nv
ers
ion
Time min
pH 303
pH 418
pH 519
pH 630
100
C
5
6
7
8
9
Page 21 of 24 Journal of Materials Chemistry A
Jour
nalo
fMat
eria
lsC
hem
istr
yA
Acc
epte
dM
anus
crip
t
Publ
ishe
d on
26
Mar
ch 2
014
Dow
nloa
ded
by N
atio
nal C
hung
Hsi
ng U
nive
rsity
on
120
420
14 1
036
16
View Article OnlineDOI 101039C4TA01057D
21
1
2
Figure 8 3
4
5
6
7
02 00 -02 -04
0
5
10
15
20j
A
cm
-2
E V (vs SCE)
Y2O
3
GO
5GOY
02 01 00 -01 -02 -0300
05
10
15
20
25
30
35
j A
cm
-2
E V (vs SCE)
Uv
Vis
Dark
5GOY
Page 22 of 24Journal of Materials Chemistry A
Jour
nalo
fMat
eria
lsC
hem
istr
yA
Acc
epte
dM
anus
crip
t
Publ
ishe
d on
26
Mar
ch 2
014
Dow
nloa
ded
by N
atio
nal C
hung
Hsi
ng U
nive
rsity
on
120
420
14 1
036
16
View Article OnlineDOI 101039C4TA01057D
22
1
2
Figure 9 3
4
400 450 500 550 600 650 700 750 800
Inte
ns
ity
a
u
Wavelength nm
20 GOY
5 GOY
Y2O
3
5
6
7
Page 23 of 24 Journal of Materials Chemistry A
Jour
nalo
fMat
eria
lsC
hem
istr
yA
Acc
epte
dM
anus
crip
t
Publ
ishe
d on
26
Mar
ch 2
014
Dow
nloa
ded
by N
atio
nal C
hung
Hsi
ng U
nive
rsity
on
120
420
14 1
036
16
View Article OnlineDOI 101039C4TA01057D
23
1
Figure 10 2
3
4
5
6
Page 24 of 24Journal of Materials Chemistry A
Jour
nalo
fMat
eria
lsC
hem
istr
yA
Acc
epte
dM
anus
crip
t
Publ
ishe
d on
26
Mar
ch 2
014
Dow
nloa
ded
by N
atio
nal C
hung
Hsi
ng U
nive
rsity
on
120
420
14 1
036
16
View Article OnlineDOI 101039C4TA01057D
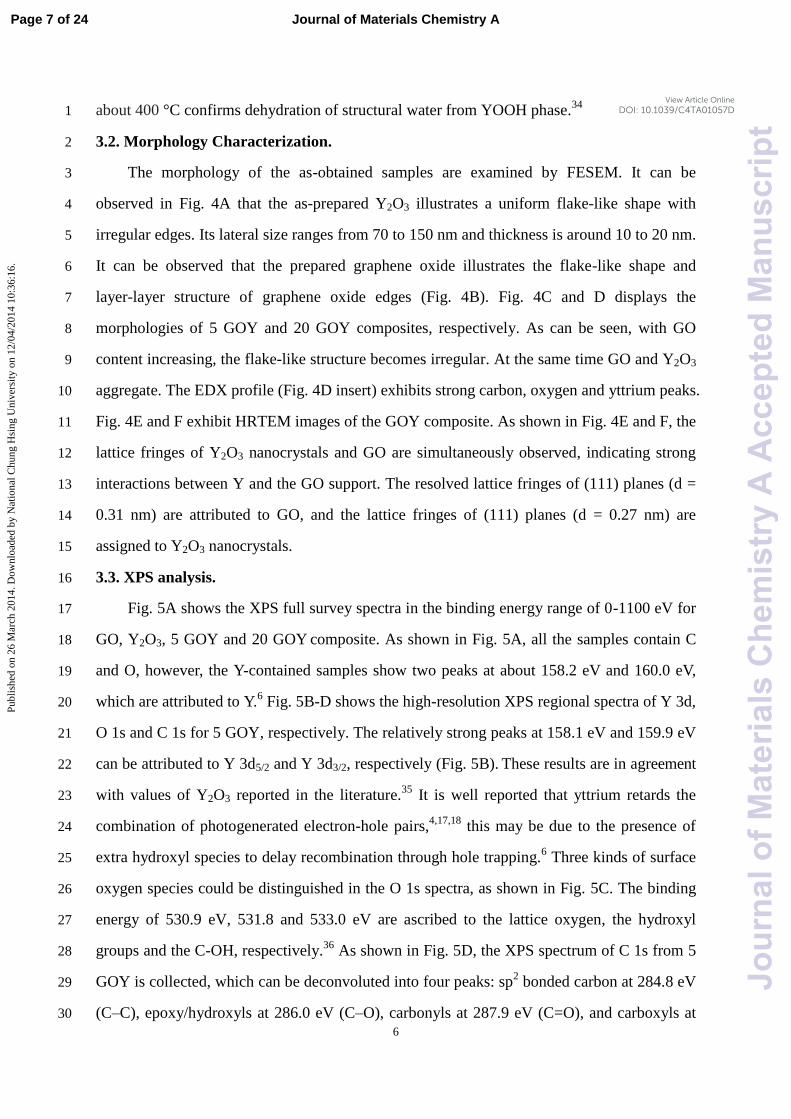
6
about 400 degC confirms dehydration of structural water from YOOH phase34
1
32 Morphology Characterization 2
The morphology of the as-obtained samples are examined by FESEM It can be 3
observed in Fig 4A that the as-prepared Y2O3 illustrates a uniform flake-like shape with 4
irregular edges Its lateral size ranges from 70 to 150 nm and thickness is around 10 to 20 nm 5
It can be observed that the prepared graphene oxide illustrates the flake-like shape and 6
layer-layer structure of graphene oxide edges (Fig 4B) Fig 4C and D displays the 7
morphologies of 5 GOY and 20 GOY composites respectively As can be seen with GO 8
content increasing the flake-like structure becomes irregular At the same time GO and Y2O3 9
aggregate The EDX profile (Fig 4D insert) exhibits strong carbon oxygen and yttrium peaks 10
Fig 4E and F exhibit HRTEM images of the GOY composite As shown in Fig 4E and F the 11
lattice fringes of Y2O3 nanocrystals and GO are simultaneously observed indicating strong 12
interactions between Y and the GO support The resolved lattice fringes of (111) planes (d = 13
031 nm) are attributed to GO and the lattice fringes of (111) planes (d = 027 nm) are 14
assigned to Y2O3 nanocrystals 15
33 XPS analysis 16
Fig 5A shows the XPS full survey spectra in the binding energy range of 0-1100 eV for 17
GO Y2O3 5 GOY and 20 GOY composite As shown in Fig 5A all the samples contain C 18
and O however the Y-contained samples show two peaks at about 1582 eV and 1600 eV 19
which are attributed to Y6 Fig 5B-D shows the high-resolution XPS regional spectra of Y 3d 20
O 1s and C 1s for 5 GOY respectively The relatively strong peaks at 1581 eV and 1599 eV 21
can be attributed to Y 3d52 and Y 3d32 respectively (Fig 5B) These results are in agreement 22
with values of Y2O3 reported in the literature35
It is well reported that yttrium retards the 23
combination of photogenerated electron-hole pairs41718
this may be due to the presence of 24
extra hydroxyl species to delay recombination through hole trapping6 Three kinds of surface 25
oxygen species could be distinguished in the O 1s spectra as shown in Fig 5C The binding 26
energy of 5309 eV 5318 and 5330 eV are ascribed to the lattice oxygen the hydroxyl 27
groups and the C-OH respectively36
As shown in Fig 5D the XPS spectrum of C 1s from 5 28
GOY is collected which can be deconvoluted into four peaks sp2 bonded carbon at 2848 eV 29
(CndashC) epoxyhydroxyls at 2860 eV (CndashO) carbonyls at 2879 eV (C=O) and carboxyls at 30
Page 7 of 24 Journal of Materials Chemistry A
Jour
nalo
fMat
eria
lsC
hem
istr
yA
Acc
epte
dM
anus
crip
t
Publ
ishe
d on
26
Mar
ch 2
014
Dow
nloa
ded
by N
atio
nal C
hung
Hsi
ng U
nive
rsity
on
120
420
14 1
036
16
View Article OnlineDOI 101039C4TA01057D
7
2891 eV (OndashC=O) indicating the high percentage of oxygen-contained functional groups37
1
Chemisorbed surface hydroxyl groups can enhance photocatalysis by trapping photoinduced 2
holes resulting in an increase in the formation of highly oxidizing OH radicals38
3
34 Photocatalytic Activity for dye degradation 4
For comparative purposes the photodegradation efficiencies of MB and MO mediated 5
by the different photocatalysts under UV irradiation are shown in Fig 6 Before comparison 6
the adsorption and photodegradation performances of GO Y2O3 and 5 GOY on MB were 7
investigated (Fig S1) As displayed in Fig S1 both Y2O3 and 5 GOY have good adsorption 8
affinity to MB After stirring for 30 min under dark about 80 MB could be absorbed by 9
Y2O3 and 5 GOY which is much better than GO (lower than 20) After photocatalysis for 10
35min MB can be degraded thoroughly by 5 GOY Then the photocatalytic activities of the 11
GO Y2O3 5 GOY 10 GOY 20 GOY and 50 GOY composite photocatalysts were compared 12
via the reduction of MB and MO under ambient temperature Photodegradation time is 35 13
min It has been reported that a large surface area helps to increase the photocatalytic reaction 14
sites39
From the O1s spectrum of Y2O3 (Fig S2 supplementary material) the oxygen 15
composition of Y2O3 and 5 GOY samples at different states (Table S1 supplementary 16
material) more OH radicals are available in 5 GOY As expected under UV irradiation the 17
degradation of MB is slower than 10 with a GO photocatalyst However the conversion of 18
MB reaches 95 after 35 min when using Y2O3 as a photocatalyst The four kinds of GOY 19
samples exhibite better photocatalytic properties in the degradation of MB than bare GO and 20
Y2O3 under UV irradiation Moreover with increasing the amount of GO the degradation of 21
MB increases slowly Considering the simplicity and economy of the MB degradation 5 22
GOY is selected as the photocatalyst in the following experiments The photocatalytic 23
activities of 5 GOY was compared with commercial TiO2 P25 (Fig S3 supplementary 24
material) indicating the photocatalytic property of 5 GOY was quite comparable with P25 25
The GOY composites also have photocatalytic activities to MO As can be seen in Fig 6 GO 26
has good affinity to MO and the 50 GOY has best degradation efficiency to MO among the 27
GOY composites 28
The photocatalyst dosage may affect the MB degradation efficiency Fig 7A illustrates 29
MB degradation at varying photocatalyst dosages (5 to 10 mg) MB degradation efficiency 30
Page 8 of 24Journal of Materials Chemistry A
Jour
nalo
fMat
eria
lsC
hem
istr
yA
Acc
epte
dM
anus
crip
t
Publ
ishe
d on
26
Mar
ch 2
014
Dow
nloa
ded
by N
atio
nal C
hung
Hsi
ng U
nive
rsity
on
120
420
14 1
036
16
View Article OnlineDOI 101039C4TA01057D
8
increases with increasing the contact time In addition with increasing the dosage the MB 1
degradation efficiency slowly increases As displayed in Fig 7A the best dosage is 10 mg 2
As the MB concentration may also influence degradation MB degradation under various 3
concentration of MB is investigated It can be seen clearly in Fig 7B that MB conversion 4
efficiency is as much as 100 after degradation for 35 min when the MB concentration is 5
lower than 25 mg L-1
The conversion efficiency will decrease when the MB concentration is 6
higher than 275 mg L-1
The final conversion efficiency will no more than 90 if 300 mg 7
L-1
MB solution is used 8
Because the solution pH can remarkably influence MB degradation the effect of initial 9
pH on the degradation of MB with 5 GOY catalyst is determined as presented in Fig 7C As 10
shown in Fig 7C the conversion of MB will finally reach 100 when the solution pH is 11
lower than 519 If the solution pH controlled at 63 the conversion efficiency will decrease 12
sharply and only 80 MB will convert after 35 min Therefore the solution pH is set at 41 13
35 Photocatalytic mechanism 14
The magnitude of the photocurrent represents the charge collection efficiency of the 15
electrode surface and indirectly indicates the separated efficiency of electron-hole pairs40
16
From the insert of Fig 8 5 GOY modified photoelectrode is prompted in generating 17
photocurrent under visible and UV-visible light GOY photoelectrodes yield the greater 18
photocurrent than Y2O3 photoelectrode under UV irradiation in Fig 8 19
Fig 9 shows the PL spectra of the Y2O3 and GOY photocatalysts With Y2O3 as 20
photocatalyst the PL signal centered around 450 nm is detected revealing that ∙OH radicals 21
are generated on the irradiated Y2O3 When GOY nanocomposites are used as the 22
photocatalysts the PL signal intensity is increased which suggests that the yield of ∙OH 23
radicals is enhanced on the irradiated GOY nanocomposite The enhancement in 24
photoactivity can be attributed to the remarkable synergistic effect of the combination of 25
Y2O3 and the GO sheets leading to the efficient separation of photogenerated carriers in the 26
Y2O3 and GO coupling system 27
It is well known that the photodegradation process of the photocatalysts is strongly 28
relative to electron-hole pairs generated by light irradiation on catalysts The photogenerated 29
electrons and holes can migrate to the surface of the catalysts and then can be trapped 30
Page 9 of 24 Journal of Materials Chemistry A
Jour
nalo
fMat
eria
lsC
hem
istr
yA
Acc
epte
dM
anus
crip
t
Publ
ishe
d on
26
Mar
ch 2
014
Dow
nloa
ded
by N
atio
nal C
hung
Hsi
ng U
nive
rsity
on
120
420
14 1
036
16
View Article OnlineDOI 101039C4TA01057D
9
generally by the oxygen and surface hydroxyls to ultimately produce hydroxyl radicals (middotOH) 1
that react with the adsorbed reactants41
As we know Y2O3 is n-type semiconductor with a 2
wide band gap about 56 eV42
To understand the charge separation process of Y2O3 and 3
GOYs the band edge positions of conduction band (CB) and valence band (VB) of 4
semiconductor Y2O3 has been calculated by the following equation43
5
EVB = X - Ee + 05Eg (1) 6
ECB = EVB - Eg (2) 7
where is the absolute electronegativity of the semiconductor e is the energy of free 8
electrons on the hydrogen scale (sim45 eV) and g is the bandgap energy of the 9
semiconductor The value of for Y2O3 is obtained by the arithmetic mean of the electron 10
affinity and the first ionization of the constituent atoms reported in the literatures44
to be 535 11
eV Thus the CB and VB potentials of Y2O3 are calculated to be -195 and 365 eV versus 12
normal hydrogen electrode (NHE) respectively It can be seen that the VB potential of 13
sample is more positive than the redox potential of OHminus∙OH (189 VNHE) indicating that 14
the photogenerated holes have strong oxidative ability and they can oxidize OHminus into ∙OH In 15
addition the CB potential of sample is negative enough to reduce O2 to O2∙ minus
(minus013 VNHE) 16
via eminus 17
Based on these results a possible mechanism for the photocatalytic is proposed as 18
follows and shown in Fig 10 19
Y2O3 + hν rarr Y2O3 (h+e) (3) 20
Y2O3 (e) + GO rarr Y2O3 + GO (e) (4) 21
GO (e) + O2 rarr GO + O2bullminus (5) 22
Y2O3 (h) + OHminus rarrY2O3 + OH
bull (6) 23
Y2O3 (h) + O2bullminus
+ OHbull + MB rarr CO2 +H2O+SO4
2minus + NO3
minus + Cl
minus (7) 24
25
4 Conclusions 26
In conclusion a novel GOY nanocomposite with different GO content has been obtained 27
via a one-step hydrothermal method The FT-IR XRD EDX and XPS results showed the 28
yttrium was successfully composited with GO The morphology characterization showed the 29
as-obtained GOY had nanoflake structure After stirring for 30 min under dark about 80 30
Page 10 of 24Journal of Materials Chemistry A
Jour
nalo
fMat
eria
lsC
hem
istr
yA
Acc
epte
dM
anus
crip
t
Publ
ishe
d on
26
Mar
ch 2
014
Dow
nloa
ded
by N
atio
nal C
hung
Hsi
ng U
nive
rsity
on
120
420
14 1
036
16
View Article OnlineDOI 101039C4TA01057D
10
MB could be absorbed by Y2O3 and 5 GOY The as-prepared GOY had good degradation 1
performance on both MB and MO under UV irradiation Compared with other GOY 2
composites 5 GOY had better photocatalytic activity to MB Factors such as dosages of 3
photocatalyst contaminant concentration and solution pH on MB conversion were also 4
investigated and discussed The catalyst also showed good stability and recyclability It is 5
expected that the GOY nanocomposite would be a potential candidate for treatment of dye 6
containing wastewater 7
8
Acknowledgments 9
This work was supported by the National Natural Science Foundation of China (No 10
21307104) Natural Science Foundation of Jiangsu Province China (NoBK20130438) the 11
Scientific Research Project of Environmental Fund of Yangzhou City (YHK1303) and 12
Jiangsu Key Laboratory of Environmental Material and Engineering (K12031) We thank the 13
Testing Center of Yangzhou University for sample characterization 14
15
Notes and References 16
1 B K Korbahti K Artut C Gecgel A Ozer Chem Eng J 2011 173 677-688 17
2 V K Gupta D Pathania S Agarwal P Singh J Hazard Mater 2012 243 179-186 18
3 N Wetchakun S Chaiwichain B Inceesungvorn K Pingmuang S Phanichphant A I 19
Minett J Chen ACS Appl Mater Interfaces 2012 4 3718-3723 20
4 Y F Li D Xu J I Oh W Shen X Li Y Yu ACS Catal 2012 2 391-398 21
5 M Khan W B Cao J Mol Catal A Chem 2013 376 71-77 22
6 Y F Wu Q J Zhang X F Yin H Q Cheng RSC Advances 2013 3 9670-9676 23
7 F H Chu C W Huang C L Hsin C W Wang S Y Yu P H Yeh W W Wu 24
Nanoscale 2012 4 1471-1475 25
8 L J Xu J L Wang Environ Sci Technol 2012 46 10145-10153 26
9 Y C Zhang J Li H Y Xu Appl Catal B 2012 123-124 18-26 27
10 S Usai S Obreg n A I Becerro G ol n J Phys Chem C 2013 117 24479-24484 28
11 A K Geim K S Novoselov Nat Mater 2007 6 183-191 29
12 K-Y Shin J-Y Hong J Jang Adv Mater 2011 23 2113-2118 30
Page 11 of 24 Journal of Materials Chemistry A
Jour
nalo
fMat
eria
lsC
hem
istr
yA
Acc
epte
dM
anus
crip
t
Publ
ishe
d on
26
Mar
ch 2
014
Dow
nloa
ded
by N
atio
nal C
hung
Hsi
ng U
nive
rsity
on
120
420
14 1
036
16
View Article OnlineDOI 101039C4TA01057D
11
13 G K Pradhan D K Padhi K M Parida ACS Appl Mater Interfaces 2013 5 1
9101-9110 2
14 E Lee J Y Hong H Kang J Jang J Hazard Mater 2012 219-220 13-18 3
15 Y S Fu H Q Chen X Q Sun X Wang Appl Catal B 2012 111-112 280-287 4
16 K Krishnamoorthy R Mohan S J Kim Appl Phys Lett 2011 98 244101 5
17 M Li J Zhang Y Zhang Chem Phys Lett 2012 527 63-66 6
18 F Meng J Li Z Hong M Zhi A Sakla C Xiang N Wu Catal Today 2013 199 7
48-52 8
19 H Zhang K Tan H Zheng Y Gu W F Zhang Mater Chem Phys 2011 125 9
156-160 10
20 X Niu S Li H Chu J Zhou J Rare Earths 2011 29 225-229 11
21 H Narayan H Alemu L Setofolo L Macheli ISRN Phys Chem 2012 841521 1-9 12
22 M J Allen V C Tung R B Kaner Chem Rev 2010 110 132-145 13
23 F Y Ban S R Majid N M Huang H N Lim Int J Electrochem Sci 2012 7 14
4345-4351 15
24 Y L Min G Q He Q J Xu Y C Chen J Mater Chem A 2014 2 1294-1301 16
25 W Fan W Gao C Zhang W W Tjiu J S Pan T X Liu J Mater Chem 2012 22 17
25108-25115 18
26 Z -S Wu W Ren L Wen L Gao J Zhao Z Chen G Zhou F Li H -M Cheng ACS 19
Nano 2010 4 3187-3194 20
27 J A Dorman Y B Mao J R Bargar J P Chang J Phys Chem C 2010 114 21
17422-17427 22
28 R P Ermakov VV Voronov P P Fedorov Nanosystems physics chemistry 23
mathematics 2013 4 (2) 196-205 24
29 A Lerf H He M Forster J Klinowski J Phys Chem B 1998102(23) 4477-4482 25
30 G Wang Z Yang X Li C Li Carbon 2005 43(12) 2564-2570 26
31 S Stankovich D A Dikin R D Piner K A Kohlhaas A Kleinhammes Y Y Jia Y 27
Wu S T Nguyen R S Ruoff Carbon 2007 45 1558-1565 28
32 M Aghazadeh A Nozad H Adelkhani M Ghaemi J Electrochem Soc 2010 157 29
D519-D522 30
Page 12 of 24Journal of Materials Chemistry A
Jour
nalo
fMat
eria
lsC
hem
istr
yA
Acc
epte
dM
anus
crip
t
Publ
ishe
d on
26
Mar
ch 2
014
Dow
nloa
ded
by N
atio
nal C
hung
Hsi
ng U
nive
rsity
on
120
420
14 1
036
16
View Article OnlineDOI 101039C4TA01057D
12
33 L Nan Y Kazumichi J Solid State Chem 2008 181 1738-1743 1
34 R Srinivasan N R Yogamalar J Elanchezhiyan R J Joseyphus A C Bose J Alloy 2
Compd 2010 496 472-477 3
35 S Somacescu J M C Moreno P Osiceanu B L Su V Parvulescu J Phys Chem C 4
2010 114 19365 5
36 J H Pan W I Lee Chem Mater 2006 18 847-853 6
37 Y Chen B H Song X S Tang L Lu J M Xue J Mater Chem 2012 22 7
17656-17662 8
38 J Xu Y Chang Y Zhang S Ma Y Qu C Xu Appl Surf Sci 2008 255 1996-1999 9
39 LP Zhu NC Bing LL Wang HY Jin GH Liao LJ Wang Dalton Trans 2012 41 10
2959-2965 11
40 Z Pei L Ding H Lin S Weng Z Zheng Y Hou P Liu J Mater Chem A 2013 1 12
10099-10102 13
41Y L Pan S Z Deng L Polavarapu N Y Gao P Y Yuan C H Sow Q H Xu 14
Langmuir 2012 28 12304-12310 15
42 P Rouffignac J S Park R G Gordon Chem Mater 2005 17 4808-4814 16
43 H Xu H Li C Wu J Chu Y Yan H Shu Z Gu J Hazard Mater 2008 153 17
877-880 18
44 T Andersen H K Haugen H Hotop J Phys Chem Ref Data 1999 28(6) 1511-1533 19
20
Page 13 of 24 Journal of Materials Chemistry A
Jour
nalo
fMat
eria
lsC
hem
istr
yA
Acc
epte
dM
anus
crip
t
Publ
ishe
d on
26
Mar
ch 2
014
Dow
nloa
ded
by N
atio
nal C
hung
Hsi
ng U
nive
rsity
on
120
420
14 1
036
16
View Article OnlineDOI 101039C4TA01057D
13
Figure captions 1
2
Figure 1 FT-IR spectra of GO Y2O3 and 5 GOY composites 3
Figure 2 XRD patterns of GO Y2O3 and 5 GOY composites 4
Figure 3 TGA curves of GO Y2O3 and 5 GOY composites 5
Figure 4 FESEM images of (A) Y2O3 (Insert low magnification) (B) GO (C) 5 GOY and 6
(D) 20 GOY composites (Insert EDS spectrum of 20 GOY sample) (E) and (F) 7
HRTEM images of 5 GOY taken after intense ultrasonic dispersion in ethanol for 30 8
min 9
Figure 5 XPS spectra (A) full survey spectra of GO Y2O3 and GOY nanocomposite (B) Y 10
3d of 5 GOY (C) O 1s of 5 GOY (D) C 1s of 5 GOY 11
Figure 6 Comparison of photodegradation efficiency using as-synthesized GO Y2O3 and 12
GOY composites 13
Figure 7 (A) Effect of dosage on MB conversion MB concentration 25 ppm pH = 41 (B) 14
Effect of MB concentration on the degradation Dosage 10 mg pH = 41 (C) Effect of 15
solution pH on MB conversion MB concentration 25 ppm Dosage 10 mg 16
Figure 8 Photocurrent responses of GO Y2O3 and 5 GOY photoelectrodes under UV 17
illumination Insert Photocurrent responses of 5 GOY under different illumination 18
conditions Scan rate 50 mVs The electrolyte solution was 05 M NaCl 19
Figure 9 PL spectra of Y2O3 5 GOY and 20 GOY samples (λex = 258 nm) 20
Figure 10 Proposed mechanism for the photodegradation of MB on GOY composite21
Page 14 of 24Journal of Materials Chemistry A
Jour
nalo
fMat
eria
lsC
hem
istr
yA
Acc
epte
dM
anus
crip
t
Publ
ishe
d on
26
Mar
ch 2
014
Dow
nloa
ded
by N
atio
nal C
hung
Hsi
ng U
nive
rsity
on
120
420
14 1
036
16
View Article OnlineDOI 101039C4TA01057D
14
Figure 1 1
2
3
4
500 1000 1500 2000 2500 3000 3500 4000
1657
Tra
ns
mit
tan
ce
Wavenumber cm-1
1657
1550
1564 17211223
1436
1436
GO
Y2O
3
5GOY
5
6
Page 15 of 24 Journal of Materials Chemistry A
Jour
nalo
fMat
eria
lsC
hem
istr
yA
Acc
epte
dM
anus
crip
t
Publ
ishe
d on
26
Mar
ch 2
014
Dow
nloa
ded
by N
atio
nal C
hung
Hsi
ng U
nive
rsity
on
120
420
14 1
036
16
View Article OnlineDOI 101039C4TA01057D
15
Figure 2 1
2
3
10 20 30 40 50 60 70
5GOY2O
3
Inte
ns
ity
a
u
2degree
GO
Y2O
3
4
5
6
Page 16 of 24Journal of Materials Chemistry A
Jour
nalo
fMat
eria
lsC
hem
istr
yA
Acc
epte
dM
anus
crip
t
Publ
ishe
d on
26
Mar
ch 2
014
Dow
nloa
ded
by N
atio
nal C
hung
Hsi
ng U
nive
rsity
on
120
420
14 1
036
16
View Article OnlineDOI 101039C4TA01057D
16
Figure 3 1
2
0 100 200 300 400 500 60040
50
60
70
80
90
100
5GOY
Y2O
3
GO
We
igh
t
Temperature oC
3
4
Page 17 of 24 Journal of Materials Chemistry A
Jour
nalo
fMat
eria
lsC
hem
istr
yA
Acc
epte
dM
anus
crip
t
Publ
ishe
d on
26
Mar
ch 2
014
Dow
nloa
ded
by N
atio
nal C
hung
Hsi
ng U
nive
rsity
on
120
420
14 1
036
16
View Article OnlineDOI 101039C4TA01057D
17
Figure 4 1
2
3
4
5
6
7
8
9
10
11
12
13
14
15
16
17
18
19
20
21
22
23
24
25
26
27
28
29
30
31
32
33
34
35
36
37
38
39
40
41
Page 18 of 24Journal of Materials Chemistry A
Jour
nalo
fMat
eria
lsC
hem
istr
yA
Acc
epte
dM
anus
crip
t
Publ
ishe
d on
26
Mar
ch 2
014
Dow
nloa
ded
by N
atio
nal C
hung
Hsi
ng U
nive
rsity
on
120
420
14 1
036
16
View Article OnlineDOI 101039C4TA01057D
18
Figure 5 1
2
3
1200 1000 800 600 400 200 0
Y 3d
C 1s
20 GOY
5 GOY
Y2O
3
Inte
ns
ity
a
u
Binding Energy eV
GO
O 1s
A
150 155 160 165 170 175
Inte
ns
ity
a
u
Binding Energy eV
Y 3d32
BY 3d
52
4
5
6
526 528 530 532 534 536
Inte
ns
ity
a
u
Binding Energy eV
O 1sC
282 284 286 288 290 292
Inte
ns
ity
a
u
Binding Energy eV
C-C
C-OC=O O-C=O
DC 1s
7
8
Page 19 of 24 Journal of Materials Chemistry A
Jour
nalo
fMat
eria
lsC
hem
istr
yA
Acc
epte
dM
anus
crip
t
Publ
ishe
d on
26
Mar
ch 2
014
Dow
nloa
ded
by N
atio
nal C
hung
Hsi
ng U
nive
rsity
on
120
420
14 1
036
16
View Article OnlineDOI 101039C4TA01057D
19
1
Figure 6 2
3
00
02
04
06
08
10
12
Y2O
3
20GOY
50GOY
10GOY
5GOYCo
nv
ers
ion
Photocatalysts
MO
MB
GO
4
5
6
7
8
Page 20 of 24Journal of Materials Chemistry A
Jour
nalo
fMat
eria
lsC
hem
istr
yA
Acc
epte
dM
anus
crip
t
Publ
ishe
d on
26
Mar
ch 2
014
Dow
nloa
ded
by N
atio
nal C
hung
Hsi
ng U
nive
rsity
on
120
420
14 1
036
16
View Article OnlineDOI 101039C4TA01057D
20
Figure 7 1
2
-5 0 5 10 15 20 25 30 35 40060
070
080
090
Co
nv
ers
ion
Time min
5 mg
6 mg
7 mg
8 mg
9 mg
10 mg
A100
-5 0 5 10 15 20 25 30 35 40
060
070
080
090
Co
nv
ers
ion
Time min
200 mg L-1
225 mg L-1
250 mg L-1
275 mg L-1
300 mg L-1
B100
3
4
-5 0 5 10 15 20 25 30 35 40
110
050
060
070
080
090
Co
nv
ers
ion
Time min
pH 303
pH 418
pH 519
pH 630
100
C
5
6
7
8
9
Page 21 of 24 Journal of Materials Chemistry A
Jour
nalo
fMat
eria
lsC
hem
istr
yA
Acc
epte
dM
anus
crip
t
Publ
ishe
d on
26
Mar
ch 2
014
Dow
nloa
ded
by N
atio
nal C
hung
Hsi
ng U
nive
rsity
on
120
420
14 1
036
16
View Article OnlineDOI 101039C4TA01057D
21
1
2
Figure 8 3
4
5
6
7
02 00 -02 -04
0
5
10
15
20j
A
cm
-2
E V (vs SCE)
Y2O
3
GO
5GOY
02 01 00 -01 -02 -0300
05
10
15
20
25
30
35
j A
cm
-2
E V (vs SCE)
Uv
Vis
Dark
5GOY
Page 22 of 24Journal of Materials Chemistry A
Jour
nalo
fMat
eria
lsC
hem
istr
yA
Acc
epte
dM
anus
crip
t
Publ
ishe
d on
26
Mar
ch 2
014
Dow
nloa
ded
by N
atio
nal C
hung
Hsi
ng U
nive
rsity
on
120
420
14 1
036
16
View Article OnlineDOI 101039C4TA01057D
22
1
2
Figure 9 3
4
400 450 500 550 600 650 700 750 800
Inte
ns
ity
a
u
Wavelength nm
20 GOY
5 GOY
Y2O
3
5
6
7
Page 23 of 24 Journal of Materials Chemistry A
Jour
nalo
fMat
eria
lsC
hem
istr
yA
Acc
epte
dM
anus
crip
t
Publ
ishe
d on
26
Mar
ch 2
014
Dow
nloa
ded
by N
atio
nal C
hung
Hsi
ng U
nive
rsity
on
120
420
14 1
036
16
View Article OnlineDOI 101039C4TA01057D
23
1
Figure 10 2
3
4
5
6
Page 24 of 24Journal of Materials Chemistry A
Jour
nalo
fMat
eria
lsC
hem
istr
yA
Acc
epte
dM
anus
crip
t
Publ
ishe
d on
26
Mar
ch 2
014
Dow
nloa
ded
by N
atio
nal C
hung
Hsi
ng U
nive
rsity
on
120
420
14 1
036
16
View Article OnlineDOI 101039C4TA01057D
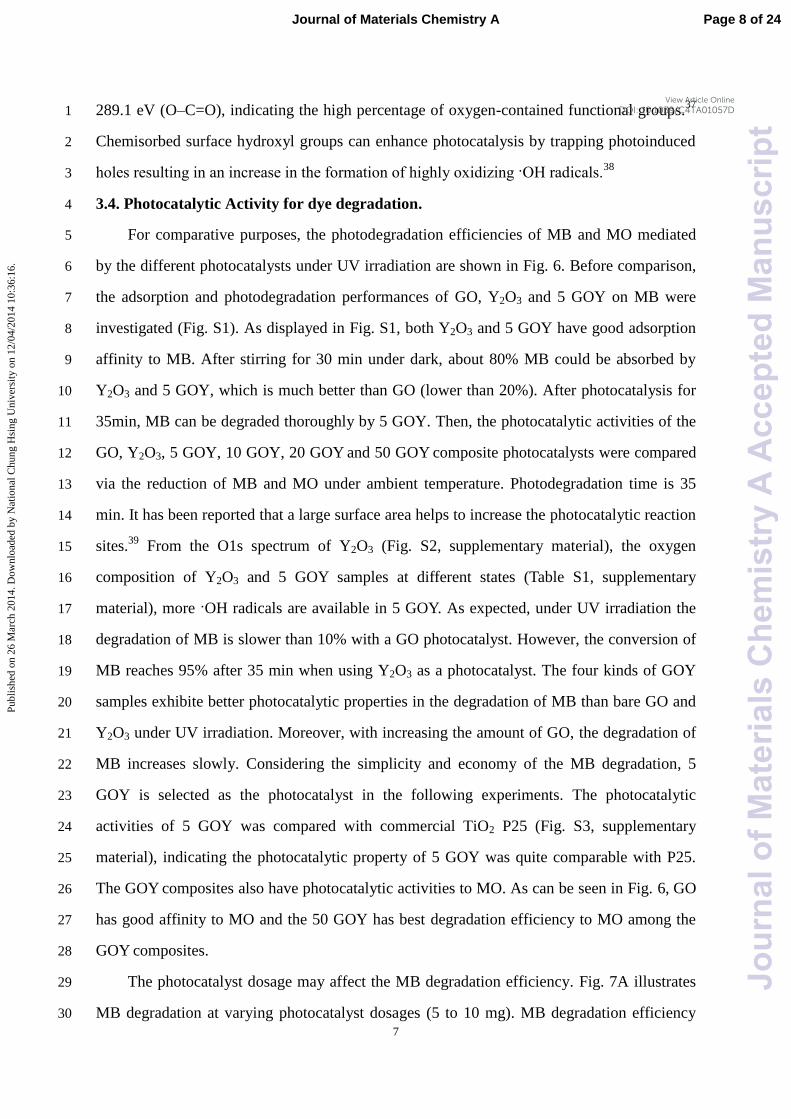
7
2891 eV (OndashC=O) indicating the high percentage of oxygen-contained functional groups37
1
Chemisorbed surface hydroxyl groups can enhance photocatalysis by trapping photoinduced 2
holes resulting in an increase in the formation of highly oxidizing OH radicals38
3
34 Photocatalytic Activity for dye degradation 4
For comparative purposes the photodegradation efficiencies of MB and MO mediated 5
by the different photocatalysts under UV irradiation are shown in Fig 6 Before comparison 6
the adsorption and photodegradation performances of GO Y2O3 and 5 GOY on MB were 7
investigated (Fig S1) As displayed in Fig S1 both Y2O3 and 5 GOY have good adsorption 8
affinity to MB After stirring for 30 min under dark about 80 MB could be absorbed by 9
Y2O3 and 5 GOY which is much better than GO (lower than 20) After photocatalysis for 10
35min MB can be degraded thoroughly by 5 GOY Then the photocatalytic activities of the 11
GO Y2O3 5 GOY 10 GOY 20 GOY and 50 GOY composite photocatalysts were compared 12
via the reduction of MB and MO under ambient temperature Photodegradation time is 35 13
min It has been reported that a large surface area helps to increase the photocatalytic reaction 14
sites39
From the O1s spectrum of Y2O3 (Fig S2 supplementary material) the oxygen 15
composition of Y2O3 and 5 GOY samples at different states (Table S1 supplementary 16
material) more OH radicals are available in 5 GOY As expected under UV irradiation the 17
degradation of MB is slower than 10 with a GO photocatalyst However the conversion of 18
MB reaches 95 after 35 min when using Y2O3 as a photocatalyst The four kinds of GOY 19
samples exhibite better photocatalytic properties in the degradation of MB than bare GO and 20
Y2O3 under UV irradiation Moreover with increasing the amount of GO the degradation of 21
MB increases slowly Considering the simplicity and economy of the MB degradation 5 22
GOY is selected as the photocatalyst in the following experiments The photocatalytic 23
activities of 5 GOY was compared with commercial TiO2 P25 (Fig S3 supplementary 24
material) indicating the photocatalytic property of 5 GOY was quite comparable with P25 25
The GOY composites also have photocatalytic activities to MO As can be seen in Fig 6 GO 26
has good affinity to MO and the 50 GOY has best degradation efficiency to MO among the 27
GOY composites 28
The photocatalyst dosage may affect the MB degradation efficiency Fig 7A illustrates 29
MB degradation at varying photocatalyst dosages (5 to 10 mg) MB degradation efficiency 30
Page 8 of 24Journal of Materials Chemistry A
Jour
nalo
fMat
eria
lsC
hem
istr
yA
Acc
epte
dM
anus
crip
t
Publ
ishe
d on
26
Mar
ch 2
014
Dow
nloa
ded
by N
atio
nal C
hung
Hsi
ng U
nive
rsity
on
120
420
14 1
036
16
View Article OnlineDOI 101039C4TA01057D
8
increases with increasing the contact time In addition with increasing the dosage the MB 1
degradation efficiency slowly increases As displayed in Fig 7A the best dosage is 10 mg 2
As the MB concentration may also influence degradation MB degradation under various 3
concentration of MB is investigated It can be seen clearly in Fig 7B that MB conversion 4
efficiency is as much as 100 after degradation for 35 min when the MB concentration is 5
lower than 25 mg L-1
The conversion efficiency will decrease when the MB concentration is 6
higher than 275 mg L-1
The final conversion efficiency will no more than 90 if 300 mg 7
L-1
MB solution is used 8
Because the solution pH can remarkably influence MB degradation the effect of initial 9
pH on the degradation of MB with 5 GOY catalyst is determined as presented in Fig 7C As 10
shown in Fig 7C the conversion of MB will finally reach 100 when the solution pH is 11
lower than 519 If the solution pH controlled at 63 the conversion efficiency will decrease 12
sharply and only 80 MB will convert after 35 min Therefore the solution pH is set at 41 13
35 Photocatalytic mechanism 14
The magnitude of the photocurrent represents the charge collection efficiency of the 15
electrode surface and indirectly indicates the separated efficiency of electron-hole pairs40
16
From the insert of Fig 8 5 GOY modified photoelectrode is prompted in generating 17
photocurrent under visible and UV-visible light GOY photoelectrodes yield the greater 18
photocurrent than Y2O3 photoelectrode under UV irradiation in Fig 8 19
Fig 9 shows the PL spectra of the Y2O3 and GOY photocatalysts With Y2O3 as 20
photocatalyst the PL signal centered around 450 nm is detected revealing that ∙OH radicals 21
are generated on the irradiated Y2O3 When GOY nanocomposites are used as the 22
photocatalysts the PL signal intensity is increased which suggests that the yield of ∙OH 23
radicals is enhanced on the irradiated GOY nanocomposite The enhancement in 24
photoactivity can be attributed to the remarkable synergistic effect of the combination of 25
Y2O3 and the GO sheets leading to the efficient separation of photogenerated carriers in the 26
Y2O3 and GO coupling system 27
It is well known that the photodegradation process of the photocatalysts is strongly 28
relative to electron-hole pairs generated by light irradiation on catalysts The photogenerated 29
electrons and holes can migrate to the surface of the catalysts and then can be trapped 30
Page 9 of 24 Journal of Materials Chemistry A
Jour
nalo
fMat
eria
lsC
hem
istr
yA
Acc
epte
dM
anus
crip
t
Publ
ishe
d on
26
Mar
ch 2
014
Dow
nloa
ded
by N
atio
nal C
hung
Hsi
ng U
nive
rsity
on
120
420
14 1
036
16
View Article OnlineDOI 101039C4TA01057D
9
generally by the oxygen and surface hydroxyls to ultimately produce hydroxyl radicals (middotOH) 1
that react with the adsorbed reactants41
As we know Y2O3 is n-type semiconductor with a 2
wide band gap about 56 eV42
To understand the charge separation process of Y2O3 and 3
GOYs the band edge positions of conduction band (CB) and valence band (VB) of 4
semiconductor Y2O3 has been calculated by the following equation43
5
EVB = X - Ee + 05Eg (1) 6
ECB = EVB - Eg (2) 7
where is the absolute electronegativity of the semiconductor e is the energy of free 8
electrons on the hydrogen scale (sim45 eV) and g is the bandgap energy of the 9
semiconductor The value of for Y2O3 is obtained by the arithmetic mean of the electron 10
affinity and the first ionization of the constituent atoms reported in the literatures44
to be 535 11
eV Thus the CB and VB potentials of Y2O3 are calculated to be -195 and 365 eV versus 12
normal hydrogen electrode (NHE) respectively It can be seen that the VB potential of 13
sample is more positive than the redox potential of OHminus∙OH (189 VNHE) indicating that 14
the photogenerated holes have strong oxidative ability and they can oxidize OHminus into ∙OH In 15
addition the CB potential of sample is negative enough to reduce O2 to O2∙ minus
(minus013 VNHE) 16
via eminus 17
Based on these results a possible mechanism for the photocatalytic is proposed as 18
follows and shown in Fig 10 19
Y2O3 + hν rarr Y2O3 (h+e) (3) 20
Y2O3 (e) + GO rarr Y2O3 + GO (e) (4) 21
GO (e) + O2 rarr GO + O2bullminus (5) 22
Y2O3 (h) + OHminus rarrY2O3 + OH
bull (6) 23
Y2O3 (h) + O2bullminus
+ OHbull + MB rarr CO2 +H2O+SO4
2minus + NO3
minus + Cl
minus (7) 24
25
4 Conclusions 26
In conclusion a novel GOY nanocomposite with different GO content has been obtained 27
via a one-step hydrothermal method The FT-IR XRD EDX and XPS results showed the 28
yttrium was successfully composited with GO The morphology characterization showed the 29
as-obtained GOY had nanoflake structure After stirring for 30 min under dark about 80 30
Page 10 of 24Journal of Materials Chemistry A
Jour
nalo
fMat
eria
lsC
hem
istr
yA
Acc
epte
dM
anus
crip
t
Publ
ishe
d on
26
Mar
ch 2
014
Dow
nloa
ded
by N
atio
nal C
hung
Hsi
ng U
nive
rsity
on
120
420
14 1
036
16
View Article OnlineDOI 101039C4TA01057D
10
MB could be absorbed by Y2O3 and 5 GOY The as-prepared GOY had good degradation 1
performance on both MB and MO under UV irradiation Compared with other GOY 2
composites 5 GOY had better photocatalytic activity to MB Factors such as dosages of 3
photocatalyst contaminant concentration and solution pH on MB conversion were also 4
investigated and discussed The catalyst also showed good stability and recyclability It is 5
expected that the GOY nanocomposite would be a potential candidate for treatment of dye 6
containing wastewater 7
8
Acknowledgments 9
This work was supported by the National Natural Science Foundation of China (No 10
21307104) Natural Science Foundation of Jiangsu Province China (NoBK20130438) the 11
Scientific Research Project of Environmental Fund of Yangzhou City (YHK1303) and 12
Jiangsu Key Laboratory of Environmental Material and Engineering (K12031) We thank the 13
Testing Center of Yangzhou University for sample characterization 14
15
Notes and References 16
1 B K Korbahti K Artut C Gecgel A Ozer Chem Eng J 2011 173 677-688 17
2 V K Gupta D Pathania S Agarwal P Singh J Hazard Mater 2012 243 179-186 18
3 N Wetchakun S Chaiwichain B Inceesungvorn K Pingmuang S Phanichphant A I 19
Minett J Chen ACS Appl Mater Interfaces 2012 4 3718-3723 20
4 Y F Li D Xu J I Oh W Shen X Li Y Yu ACS Catal 2012 2 391-398 21
5 M Khan W B Cao J Mol Catal A Chem 2013 376 71-77 22
6 Y F Wu Q J Zhang X F Yin H Q Cheng RSC Advances 2013 3 9670-9676 23
7 F H Chu C W Huang C L Hsin C W Wang S Y Yu P H Yeh W W Wu 24
Nanoscale 2012 4 1471-1475 25
8 L J Xu J L Wang Environ Sci Technol 2012 46 10145-10153 26
9 Y C Zhang J Li H Y Xu Appl Catal B 2012 123-124 18-26 27
10 S Usai S Obreg n A I Becerro G ol n J Phys Chem C 2013 117 24479-24484 28
11 A K Geim K S Novoselov Nat Mater 2007 6 183-191 29
12 K-Y Shin J-Y Hong J Jang Adv Mater 2011 23 2113-2118 30
Page 11 of 24 Journal of Materials Chemistry A
Jour
nalo
fMat
eria
lsC
hem
istr
yA
Acc
epte
dM
anus
crip
t
Publ
ishe
d on
26
Mar
ch 2
014
Dow
nloa
ded
by N
atio
nal C
hung
Hsi
ng U
nive
rsity
on
120
420
14 1
036
16
View Article OnlineDOI 101039C4TA01057D
11
13 G K Pradhan D K Padhi K M Parida ACS Appl Mater Interfaces 2013 5 1
9101-9110 2
14 E Lee J Y Hong H Kang J Jang J Hazard Mater 2012 219-220 13-18 3
15 Y S Fu H Q Chen X Q Sun X Wang Appl Catal B 2012 111-112 280-287 4
16 K Krishnamoorthy R Mohan S J Kim Appl Phys Lett 2011 98 244101 5
17 M Li J Zhang Y Zhang Chem Phys Lett 2012 527 63-66 6
18 F Meng J Li Z Hong M Zhi A Sakla C Xiang N Wu Catal Today 2013 199 7
48-52 8
19 H Zhang K Tan H Zheng Y Gu W F Zhang Mater Chem Phys 2011 125 9
156-160 10
20 X Niu S Li H Chu J Zhou J Rare Earths 2011 29 225-229 11
21 H Narayan H Alemu L Setofolo L Macheli ISRN Phys Chem 2012 841521 1-9 12
22 M J Allen V C Tung R B Kaner Chem Rev 2010 110 132-145 13
23 F Y Ban S R Majid N M Huang H N Lim Int J Electrochem Sci 2012 7 14
4345-4351 15
24 Y L Min G Q He Q J Xu Y C Chen J Mater Chem A 2014 2 1294-1301 16
25 W Fan W Gao C Zhang W W Tjiu J S Pan T X Liu J Mater Chem 2012 22 17
25108-25115 18
26 Z -S Wu W Ren L Wen L Gao J Zhao Z Chen G Zhou F Li H -M Cheng ACS 19
Nano 2010 4 3187-3194 20
27 J A Dorman Y B Mao J R Bargar J P Chang J Phys Chem C 2010 114 21
17422-17427 22
28 R P Ermakov VV Voronov P P Fedorov Nanosystems physics chemistry 23
mathematics 2013 4 (2) 196-205 24
29 A Lerf H He M Forster J Klinowski J Phys Chem B 1998102(23) 4477-4482 25
30 G Wang Z Yang X Li C Li Carbon 2005 43(12) 2564-2570 26
31 S Stankovich D A Dikin R D Piner K A Kohlhaas A Kleinhammes Y Y Jia Y 27
Wu S T Nguyen R S Ruoff Carbon 2007 45 1558-1565 28
32 M Aghazadeh A Nozad H Adelkhani M Ghaemi J Electrochem Soc 2010 157 29
D519-D522 30
Page 12 of 24Journal of Materials Chemistry A
Jour
nalo
fMat
eria
lsC
hem
istr
yA
Acc
epte
dM
anus
crip
t
Publ
ishe
d on
26
Mar
ch 2
014
Dow
nloa
ded
by N
atio
nal C
hung
Hsi
ng U
nive
rsity
on
120
420
14 1
036
16
View Article OnlineDOI 101039C4TA01057D
12
33 L Nan Y Kazumichi J Solid State Chem 2008 181 1738-1743 1
34 R Srinivasan N R Yogamalar J Elanchezhiyan R J Joseyphus A C Bose J Alloy 2
Compd 2010 496 472-477 3
35 S Somacescu J M C Moreno P Osiceanu B L Su V Parvulescu J Phys Chem C 4
2010 114 19365 5
36 J H Pan W I Lee Chem Mater 2006 18 847-853 6
37 Y Chen B H Song X S Tang L Lu J M Xue J Mater Chem 2012 22 7
17656-17662 8
38 J Xu Y Chang Y Zhang S Ma Y Qu C Xu Appl Surf Sci 2008 255 1996-1999 9
39 LP Zhu NC Bing LL Wang HY Jin GH Liao LJ Wang Dalton Trans 2012 41 10
2959-2965 11
40 Z Pei L Ding H Lin S Weng Z Zheng Y Hou P Liu J Mater Chem A 2013 1 12
10099-10102 13
41Y L Pan S Z Deng L Polavarapu N Y Gao P Y Yuan C H Sow Q H Xu 14
Langmuir 2012 28 12304-12310 15
42 P Rouffignac J S Park R G Gordon Chem Mater 2005 17 4808-4814 16
43 H Xu H Li C Wu J Chu Y Yan H Shu Z Gu J Hazard Mater 2008 153 17
877-880 18
44 T Andersen H K Haugen H Hotop J Phys Chem Ref Data 1999 28(6) 1511-1533 19
20
Page 13 of 24 Journal of Materials Chemistry A
Jour
nalo
fMat
eria
lsC
hem
istr
yA
Acc
epte
dM
anus
crip
t
Publ
ishe
d on
26
Mar
ch 2
014
Dow
nloa
ded
by N
atio
nal C
hung
Hsi
ng U
nive
rsity
on
120
420
14 1
036
16
View Article OnlineDOI 101039C4TA01057D
13
Figure captions 1
2
Figure 1 FT-IR spectra of GO Y2O3 and 5 GOY composites 3
Figure 2 XRD patterns of GO Y2O3 and 5 GOY composites 4
Figure 3 TGA curves of GO Y2O3 and 5 GOY composites 5
Figure 4 FESEM images of (A) Y2O3 (Insert low magnification) (B) GO (C) 5 GOY and 6
(D) 20 GOY composites (Insert EDS spectrum of 20 GOY sample) (E) and (F) 7
HRTEM images of 5 GOY taken after intense ultrasonic dispersion in ethanol for 30 8
min 9
Figure 5 XPS spectra (A) full survey spectra of GO Y2O3 and GOY nanocomposite (B) Y 10
3d of 5 GOY (C) O 1s of 5 GOY (D) C 1s of 5 GOY 11
Figure 6 Comparison of photodegradation efficiency using as-synthesized GO Y2O3 and 12
GOY composites 13
Figure 7 (A) Effect of dosage on MB conversion MB concentration 25 ppm pH = 41 (B) 14
Effect of MB concentration on the degradation Dosage 10 mg pH = 41 (C) Effect of 15
solution pH on MB conversion MB concentration 25 ppm Dosage 10 mg 16
Figure 8 Photocurrent responses of GO Y2O3 and 5 GOY photoelectrodes under UV 17
illumination Insert Photocurrent responses of 5 GOY under different illumination 18
conditions Scan rate 50 mVs The electrolyte solution was 05 M NaCl 19
Figure 9 PL spectra of Y2O3 5 GOY and 20 GOY samples (λex = 258 nm) 20
Figure 10 Proposed mechanism for the photodegradation of MB on GOY composite21
Page 14 of 24Journal of Materials Chemistry A
Jour
nalo
fMat
eria
lsC
hem
istr
yA
Acc
epte
dM
anus
crip
t
Publ
ishe
d on
26
Mar
ch 2
014
Dow
nloa
ded
by N
atio
nal C
hung
Hsi
ng U
nive
rsity
on
120
420
14 1
036
16
View Article OnlineDOI 101039C4TA01057D
14
Figure 1 1
2
3
4
500 1000 1500 2000 2500 3000 3500 4000
1657
Tra
ns
mit
tan
ce
Wavenumber cm-1
1657
1550
1564 17211223
1436
1436
GO
Y2O
3
5GOY
5
6
Page 15 of 24 Journal of Materials Chemistry A
Jour
nalo
fMat
eria
lsC
hem
istr
yA
Acc
epte
dM
anus
crip
t
Publ
ishe
d on
26
Mar
ch 2
014
Dow
nloa
ded
by N
atio
nal C
hung
Hsi
ng U
nive
rsity
on
120
420
14 1
036
16
View Article OnlineDOI 101039C4TA01057D
15
Figure 2 1
2
3
10 20 30 40 50 60 70
5GOY2O
3
Inte
ns
ity
a
u
2degree
GO
Y2O
3
4
5
6
Page 16 of 24Journal of Materials Chemistry A
Jour
nalo
fMat
eria
lsC
hem
istr
yA
Acc
epte
dM
anus
crip
t
Publ
ishe
d on
26
Mar
ch 2
014
Dow
nloa
ded
by N
atio
nal C
hung
Hsi
ng U
nive
rsity
on
120
420
14 1
036
16
View Article OnlineDOI 101039C4TA01057D
16
Figure 3 1
2
0 100 200 300 400 500 60040
50
60
70
80
90
100
5GOY
Y2O
3
GO
We
igh
t
Temperature oC
3
4
Page 17 of 24 Journal of Materials Chemistry A
Jour
nalo
fMat
eria
lsC
hem
istr
yA
Acc
epte
dM
anus
crip
t
Publ
ishe
d on
26
Mar
ch 2
014
Dow
nloa
ded
by N
atio
nal C
hung
Hsi
ng U
nive
rsity
on
120
420
14 1
036
16
View Article OnlineDOI 101039C4TA01057D
17
Figure 4 1
2
3
4
5
6
7
8
9
10
11
12
13
14
15
16
17
18
19
20
21
22
23
24
25
26
27
28
29
30
31
32
33
34
35
36
37
38
39
40
41
Page 18 of 24Journal of Materials Chemistry A
Jour
nalo
fMat
eria
lsC
hem
istr
yA
Acc
epte
dM
anus
crip
t
Publ
ishe
d on
26
Mar
ch 2
014
Dow
nloa
ded
by N
atio
nal C
hung
Hsi
ng U
nive
rsity
on
120
420
14 1
036
16
View Article OnlineDOI 101039C4TA01057D
18
Figure 5 1
2
3
1200 1000 800 600 400 200 0
Y 3d
C 1s
20 GOY
5 GOY
Y2O
3
Inte
ns
ity
a
u
Binding Energy eV
GO
O 1s
A
150 155 160 165 170 175
Inte
ns
ity
a
u
Binding Energy eV
Y 3d32
BY 3d
52
4
5
6
526 528 530 532 534 536
Inte
ns
ity
a
u
Binding Energy eV
O 1sC
282 284 286 288 290 292
Inte
ns
ity
a
u
Binding Energy eV
C-C
C-OC=O O-C=O
DC 1s
7
8
Page 19 of 24 Journal of Materials Chemistry A
Jour
nalo
fMat
eria
lsC
hem
istr
yA
Acc
epte
dM
anus
crip
t
Publ
ishe
d on
26
Mar
ch 2
014
Dow
nloa
ded
by N
atio
nal C
hung
Hsi
ng U
nive
rsity
on
120
420
14 1
036
16
View Article OnlineDOI 101039C4TA01057D
19
1
Figure 6 2
3
00
02
04
06
08
10
12
Y2O
3
20GOY
50GOY
10GOY
5GOYCo
nv
ers
ion
Photocatalysts
MO
MB
GO
4
5
6
7
8
Page 20 of 24Journal of Materials Chemistry A
Jour
nalo
fMat
eria
lsC
hem
istr
yA
Acc
epte
dM
anus
crip
t
Publ
ishe
d on
26
Mar
ch 2
014
Dow
nloa
ded
by N
atio
nal C
hung
Hsi
ng U
nive
rsity
on
120
420
14 1
036
16
View Article OnlineDOI 101039C4TA01057D
20
Figure 7 1
2
-5 0 5 10 15 20 25 30 35 40060
070
080
090
Co
nv
ers
ion
Time min
5 mg
6 mg
7 mg
8 mg
9 mg
10 mg
A100
-5 0 5 10 15 20 25 30 35 40
060
070
080
090
Co
nv
ers
ion
Time min
200 mg L-1
225 mg L-1
250 mg L-1
275 mg L-1
300 mg L-1
B100
3
4
-5 0 5 10 15 20 25 30 35 40
110
050
060
070
080
090
Co
nv
ers
ion
Time min
pH 303
pH 418
pH 519
pH 630
100
C
5
6
7
8
9
Page 21 of 24 Journal of Materials Chemistry A
Jour
nalo
fMat
eria
lsC
hem
istr
yA
Acc
epte
dM
anus
crip
t
Publ
ishe
d on
26
Mar
ch 2
014
Dow
nloa
ded
by N
atio
nal C
hung
Hsi
ng U
nive
rsity
on
120
420
14 1
036
16
View Article OnlineDOI 101039C4TA01057D
21
1
2
Figure 8 3
4
5
6
7
02 00 -02 -04
0
5
10
15
20j
A
cm
-2
E V (vs SCE)
Y2O
3
GO
5GOY
02 01 00 -01 -02 -0300
05
10
15
20
25
30
35
j A
cm
-2
E V (vs SCE)
Uv
Vis
Dark
5GOY
Page 22 of 24Journal of Materials Chemistry A
Jour
nalo
fMat
eria
lsC
hem
istr
yA
Acc
epte
dM
anus
crip
t
Publ
ishe
d on
26
Mar
ch 2
014
Dow
nloa
ded
by N
atio
nal C
hung
Hsi
ng U
nive
rsity
on
120
420
14 1
036
16
View Article OnlineDOI 101039C4TA01057D
22
1
2
Figure 9 3
4
400 450 500 550 600 650 700 750 800
Inte
ns
ity
a
u
Wavelength nm
20 GOY
5 GOY
Y2O
3
5
6
7
Page 23 of 24 Journal of Materials Chemistry A
Jour
nalo
fMat
eria
lsC
hem
istr
yA
Acc
epte
dM
anus
crip
t
Publ
ishe
d on
26
Mar
ch 2
014
Dow
nloa
ded
by N
atio
nal C
hung
Hsi
ng U
nive
rsity
on
120
420
14 1
036
16
View Article OnlineDOI 101039C4TA01057D
23
1
Figure 10 2
3
4
5
6
Page 24 of 24Journal of Materials Chemistry A
Jour
nalo
fMat
eria
lsC
hem
istr
yA
Acc
epte
dM
anus
crip
t
Publ
ishe
d on
26
Mar
ch 2
014
Dow
nloa
ded
by N
atio
nal C
hung
Hsi
ng U
nive
rsity
on
120
420
14 1
036
16
View Article OnlineDOI 101039C4TA01057D
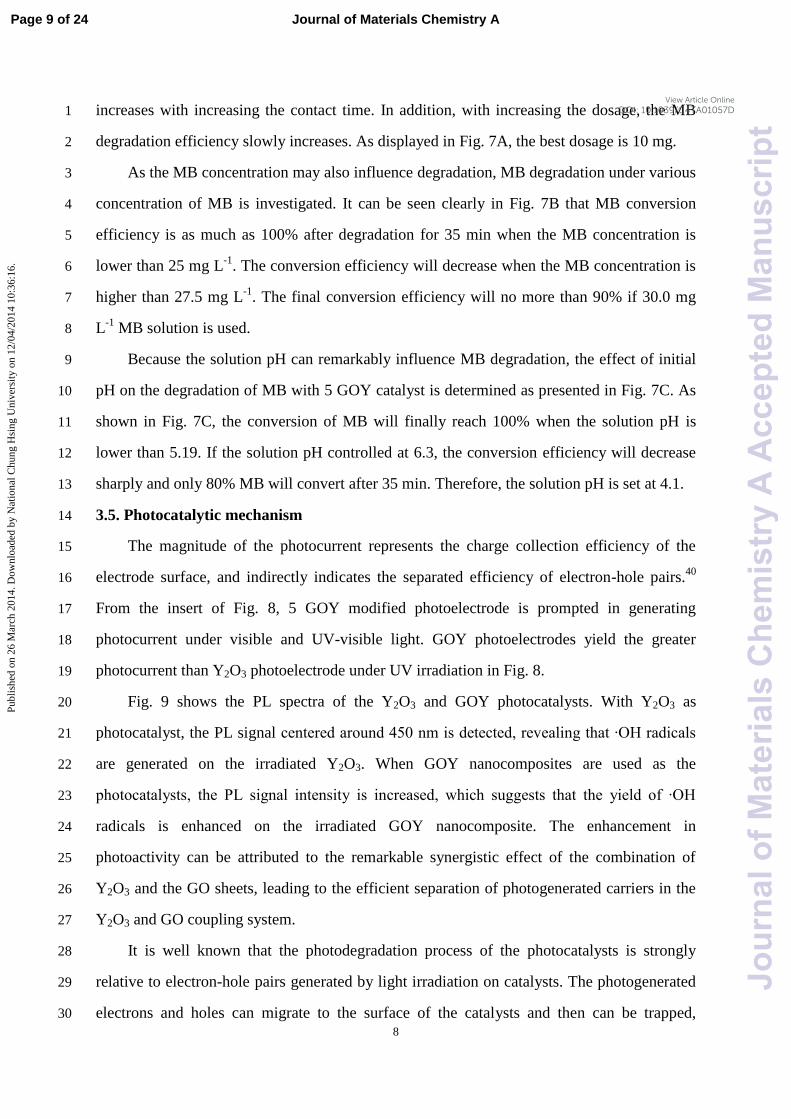
8
increases with increasing the contact time In addition with increasing the dosage the MB 1
degradation efficiency slowly increases As displayed in Fig 7A the best dosage is 10 mg 2
As the MB concentration may also influence degradation MB degradation under various 3
concentration of MB is investigated It can be seen clearly in Fig 7B that MB conversion 4
efficiency is as much as 100 after degradation for 35 min when the MB concentration is 5
lower than 25 mg L-1
The conversion efficiency will decrease when the MB concentration is 6
higher than 275 mg L-1
The final conversion efficiency will no more than 90 if 300 mg 7
L-1
MB solution is used 8
Because the solution pH can remarkably influence MB degradation the effect of initial 9
pH on the degradation of MB with 5 GOY catalyst is determined as presented in Fig 7C As 10
shown in Fig 7C the conversion of MB will finally reach 100 when the solution pH is 11
lower than 519 If the solution pH controlled at 63 the conversion efficiency will decrease 12
sharply and only 80 MB will convert after 35 min Therefore the solution pH is set at 41 13
35 Photocatalytic mechanism 14
The magnitude of the photocurrent represents the charge collection efficiency of the 15
electrode surface and indirectly indicates the separated efficiency of electron-hole pairs40
16
From the insert of Fig 8 5 GOY modified photoelectrode is prompted in generating 17
photocurrent under visible and UV-visible light GOY photoelectrodes yield the greater 18
photocurrent than Y2O3 photoelectrode under UV irradiation in Fig 8 19
Fig 9 shows the PL spectra of the Y2O3 and GOY photocatalysts With Y2O3 as 20
photocatalyst the PL signal centered around 450 nm is detected revealing that ∙OH radicals 21
are generated on the irradiated Y2O3 When GOY nanocomposites are used as the 22
photocatalysts the PL signal intensity is increased which suggests that the yield of ∙OH 23
radicals is enhanced on the irradiated GOY nanocomposite The enhancement in 24
photoactivity can be attributed to the remarkable synergistic effect of the combination of 25
Y2O3 and the GO sheets leading to the efficient separation of photogenerated carriers in the 26
Y2O3 and GO coupling system 27
It is well known that the photodegradation process of the photocatalysts is strongly 28
relative to electron-hole pairs generated by light irradiation on catalysts The photogenerated 29
electrons and holes can migrate to the surface of the catalysts and then can be trapped 30
Page 9 of 24 Journal of Materials Chemistry A
Jour
nalo
fMat
eria
lsC
hem
istr
yA
Acc
epte
dM
anus
crip
t
Publ
ishe
d on
26
Mar
ch 2
014
Dow
nloa
ded
by N
atio
nal C
hung
Hsi
ng U
nive
rsity
on
120
420
14 1
036
16
View Article OnlineDOI 101039C4TA01057D
9
generally by the oxygen and surface hydroxyls to ultimately produce hydroxyl radicals (middotOH) 1
that react with the adsorbed reactants41
As we know Y2O3 is n-type semiconductor with a 2
wide band gap about 56 eV42
To understand the charge separation process of Y2O3 and 3
GOYs the band edge positions of conduction band (CB) and valence band (VB) of 4
semiconductor Y2O3 has been calculated by the following equation43
5
EVB = X - Ee + 05Eg (1) 6
ECB = EVB - Eg (2) 7
where is the absolute electronegativity of the semiconductor e is the energy of free 8
electrons on the hydrogen scale (sim45 eV) and g is the bandgap energy of the 9
semiconductor The value of for Y2O3 is obtained by the arithmetic mean of the electron 10
affinity and the first ionization of the constituent atoms reported in the literatures44
to be 535 11
eV Thus the CB and VB potentials of Y2O3 are calculated to be -195 and 365 eV versus 12
normal hydrogen electrode (NHE) respectively It can be seen that the VB potential of 13
sample is more positive than the redox potential of OHminus∙OH (189 VNHE) indicating that 14
the photogenerated holes have strong oxidative ability and they can oxidize OHminus into ∙OH In 15
addition the CB potential of sample is negative enough to reduce O2 to O2∙ minus
(minus013 VNHE) 16
via eminus 17
Based on these results a possible mechanism for the photocatalytic is proposed as 18
follows and shown in Fig 10 19
Y2O3 + hν rarr Y2O3 (h+e) (3) 20
Y2O3 (e) + GO rarr Y2O3 + GO (e) (4) 21
GO (e) + O2 rarr GO + O2bullminus (5) 22
Y2O3 (h) + OHminus rarrY2O3 + OH
bull (6) 23
Y2O3 (h) + O2bullminus
+ OHbull + MB rarr CO2 +H2O+SO4
2minus + NO3
minus + Cl
minus (7) 24
25
4 Conclusions 26
In conclusion a novel GOY nanocomposite with different GO content has been obtained 27
via a one-step hydrothermal method The FT-IR XRD EDX and XPS results showed the 28
yttrium was successfully composited with GO The morphology characterization showed the 29
as-obtained GOY had nanoflake structure After stirring for 30 min under dark about 80 30
Page 10 of 24Journal of Materials Chemistry A
Jour
nalo
fMat
eria
lsC
hem
istr
yA
Acc
epte
dM
anus
crip
t
Publ
ishe
d on
26
Mar
ch 2
014
Dow
nloa
ded
by N
atio
nal C
hung
Hsi
ng U
nive
rsity
on
120
420
14 1
036
16
View Article OnlineDOI 101039C4TA01057D
10
MB could be absorbed by Y2O3 and 5 GOY The as-prepared GOY had good degradation 1
performance on both MB and MO under UV irradiation Compared with other GOY 2
composites 5 GOY had better photocatalytic activity to MB Factors such as dosages of 3
photocatalyst contaminant concentration and solution pH on MB conversion were also 4
investigated and discussed The catalyst also showed good stability and recyclability It is 5
expected that the GOY nanocomposite would be a potential candidate for treatment of dye 6
containing wastewater 7
8
Acknowledgments 9
This work was supported by the National Natural Science Foundation of China (No 10
21307104) Natural Science Foundation of Jiangsu Province China (NoBK20130438) the 11
Scientific Research Project of Environmental Fund of Yangzhou City (YHK1303) and 12
Jiangsu Key Laboratory of Environmental Material and Engineering (K12031) We thank the 13
Testing Center of Yangzhou University for sample characterization 14
15
Notes and References 16
1 B K Korbahti K Artut C Gecgel A Ozer Chem Eng J 2011 173 677-688 17
2 V K Gupta D Pathania S Agarwal P Singh J Hazard Mater 2012 243 179-186 18
3 N Wetchakun S Chaiwichain B Inceesungvorn K Pingmuang S Phanichphant A I 19
Minett J Chen ACS Appl Mater Interfaces 2012 4 3718-3723 20
4 Y F Li D Xu J I Oh W Shen X Li Y Yu ACS Catal 2012 2 391-398 21
5 M Khan W B Cao J Mol Catal A Chem 2013 376 71-77 22
6 Y F Wu Q J Zhang X F Yin H Q Cheng RSC Advances 2013 3 9670-9676 23
7 F H Chu C W Huang C L Hsin C W Wang S Y Yu P H Yeh W W Wu 24
Nanoscale 2012 4 1471-1475 25
8 L J Xu J L Wang Environ Sci Technol 2012 46 10145-10153 26
9 Y C Zhang J Li H Y Xu Appl Catal B 2012 123-124 18-26 27
10 S Usai S Obreg n A I Becerro G ol n J Phys Chem C 2013 117 24479-24484 28
11 A K Geim K S Novoselov Nat Mater 2007 6 183-191 29
12 K-Y Shin J-Y Hong J Jang Adv Mater 2011 23 2113-2118 30
Page 11 of 24 Journal of Materials Chemistry A
Jour
nalo
fMat
eria
lsC
hem
istr
yA
Acc
epte
dM
anus
crip
t
Publ
ishe
d on
26
Mar
ch 2
014
Dow
nloa
ded
by N
atio
nal C
hung
Hsi
ng U
nive
rsity
on
120
420
14 1
036
16
View Article OnlineDOI 101039C4TA01057D
11
13 G K Pradhan D K Padhi K M Parida ACS Appl Mater Interfaces 2013 5 1
9101-9110 2
14 E Lee J Y Hong H Kang J Jang J Hazard Mater 2012 219-220 13-18 3
15 Y S Fu H Q Chen X Q Sun X Wang Appl Catal B 2012 111-112 280-287 4
16 K Krishnamoorthy R Mohan S J Kim Appl Phys Lett 2011 98 244101 5
17 M Li J Zhang Y Zhang Chem Phys Lett 2012 527 63-66 6
18 F Meng J Li Z Hong M Zhi A Sakla C Xiang N Wu Catal Today 2013 199 7
48-52 8
19 H Zhang K Tan H Zheng Y Gu W F Zhang Mater Chem Phys 2011 125 9
156-160 10
20 X Niu S Li H Chu J Zhou J Rare Earths 2011 29 225-229 11
21 H Narayan H Alemu L Setofolo L Macheli ISRN Phys Chem 2012 841521 1-9 12
22 M J Allen V C Tung R B Kaner Chem Rev 2010 110 132-145 13
23 F Y Ban S R Majid N M Huang H N Lim Int J Electrochem Sci 2012 7 14
4345-4351 15
24 Y L Min G Q He Q J Xu Y C Chen J Mater Chem A 2014 2 1294-1301 16
25 W Fan W Gao C Zhang W W Tjiu J S Pan T X Liu J Mater Chem 2012 22 17
25108-25115 18
26 Z -S Wu W Ren L Wen L Gao J Zhao Z Chen G Zhou F Li H -M Cheng ACS 19
Nano 2010 4 3187-3194 20
27 J A Dorman Y B Mao J R Bargar J P Chang J Phys Chem C 2010 114 21
17422-17427 22
28 R P Ermakov VV Voronov P P Fedorov Nanosystems physics chemistry 23
mathematics 2013 4 (2) 196-205 24
29 A Lerf H He M Forster J Klinowski J Phys Chem B 1998102(23) 4477-4482 25
30 G Wang Z Yang X Li C Li Carbon 2005 43(12) 2564-2570 26
31 S Stankovich D A Dikin R D Piner K A Kohlhaas A Kleinhammes Y Y Jia Y 27
Wu S T Nguyen R S Ruoff Carbon 2007 45 1558-1565 28
32 M Aghazadeh A Nozad H Adelkhani M Ghaemi J Electrochem Soc 2010 157 29
D519-D522 30
Page 12 of 24Journal of Materials Chemistry A
Jour
nalo
fMat
eria
lsC
hem
istr
yA
Acc
epte
dM
anus
crip
t
Publ
ishe
d on
26
Mar
ch 2
014
Dow
nloa
ded
by N
atio
nal C
hung
Hsi
ng U
nive
rsity
on
120
420
14 1
036
16
View Article OnlineDOI 101039C4TA01057D
12
33 L Nan Y Kazumichi J Solid State Chem 2008 181 1738-1743 1
34 R Srinivasan N R Yogamalar J Elanchezhiyan R J Joseyphus A C Bose J Alloy 2
Compd 2010 496 472-477 3
35 S Somacescu J M C Moreno P Osiceanu B L Su V Parvulescu J Phys Chem C 4
2010 114 19365 5
36 J H Pan W I Lee Chem Mater 2006 18 847-853 6
37 Y Chen B H Song X S Tang L Lu J M Xue J Mater Chem 2012 22 7
17656-17662 8
38 J Xu Y Chang Y Zhang S Ma Y Qu C Xu Appl Surf Sci 2008 255 1996-1999 9
39 LP Zhu NC Bing LL Wang HY Jin GH Liao LJ Wang Dalton Trans 2012 41 10
2959-2965 11
40 Z Pei L Ding H Lin S Weng Z Zheng Y Hou P Liu J Mater Chem A 2013 1 12
10099-10102 13
41Y L Pan S Z Deng L Polavarapu N Y Gao P Y Yuan C H Sow Q H Xu 14
Langmuir 2012 28 12304-12310 15
42 P Rouffignac J S Park R G Gordon Chem Mater 2005 17 4808-4814 16
43 H Xu H Li C Wu J Chu Y Yan H Shu Z Gu J Hazard Mater 2008 153 17
877-880 18
44 T Andersen H K Haugen H Hotop J Phys Chem Ref Data 1999 28(6) 1511-1533 19
20
Page 13 of 24 Journal of Materials Chemistry A
Jour
nalo
fMat
eria
lsC
hem
istr
yA
Acc
epte
dM
anus
crip
t
Publ
ishe
d on
26
Mar
ch 2
014
Dow
nloa
ded
by N
atio
nal C
hung
Hsi
ng U
nive
rsity
on
120
420
14 1
036
16
View Article OnlineDOI 101039C4TA01057D
13
Figure captions 1
2
Figure 1 FT-IR spectra of GO Y2O3 and 5 GOY composites 3
Figure 2 XRD patterns of GO Y2O3 and 5 GOY composites 4
Figure 3 TGA curves of GO Y2O3 and 5 GOY composites 5
Figure 4 FESEM images of (A) Y2O3 (Insert low magnification) (B) GO (C) 5 GOY and 6
(D) 20 GOY composites (Insert EDS spectrum of 20 GOY sample) (E) and (F) 7
HRTEM images of 5 GOY taken after intense ultrasonic dispersion in ethanol for 30 8
min 9
Figure 5 XPS spectra (A) full survey spectra of GO Y2O3 and GOY nanocomposite (B) Y 10
3d of 5 GOY (C) O 1s of 5 GOY (D) C 1s of 5 GOY 11
Figure 6 Comparison of photodegradation efficiency using as-synthesized GO Y2O3 and 12
GOY composites 13
Figure 7 (A) Effect of dosage on MB conversion MB concentration 25 ppm pH = 41 (B) 14
Effect of MB concentration on the degradation Dosage 10 mg pH = 41 (C) Effect of 15
solution pH on MB conversion MB concentration 25 ppm Dosage 10 mg 16
Figure 8 Photocurrent responses of GO Y2O3 and 5 GOY photoelectrodes under UV 17
illumination Insert Photocurrent responses of 5 GOY under different illumination 18
conditions Scan rate 50 mVs The electrolyte solution was 05 M NaCl 19
Figure 9 PL spectra of Y2O3 5 GOY and 20 GOY samples (λex = 258 nm) 20
Figure 10 Proposed mechanism for the photodegradation of MB on GOY composite21
Page 14 of 24Journal of Materials Chemistry A
Jour
nalo
fMat
eria
lsC
hem
istr
yA
Acc
epte
dM
anus
crip
t
Publ
ishe
d on
26
Mar
ch 2
014
Dow
nloa
ded
by N
atio
nal C
hung
Hsi
ng U
nive
rsity
on
120
420
14 1
036
16
View Article OnlineDOI 101039C4TA01057D
14
Figure 1 1
2
3
4
500 1000 1500 2000 2500 3000 3500 4000
1657
Tra
ns
mit
tan
ce
Wavenumber cm-1
1657
1550
1564 17211223
1436
1436
GO
Y2O
3
5GOY
5
6
Page 15 of 24 Journal of Materials Chemistry A
Jour
nalo
fMat
eria
lsC
hem
istr
yA
Acc
epte
dM
anus
crip
t
Publ
ishe
d on
26
Mar
ch 2
014
Dow
nloa
ded
by N
atio
nal C
hung
Hsi
ng U
nive
rsity
on
120
420
14 1
036
16
View Article OnlineDOI 101039C4TA01057D
15
Figure 2 1
2
3
10 20 30 40 50 60 70
5GOY2O
3
Inte
ns
ity
a
u
2degree
GO
Y2O
3
4
5
6
Page 16 of 24Journal of Materials Chemistry A
Jour
nalo
fMat
eria
lsC
hem
istr
yA
Acc
epte
dM
anus
crip
t
Publ
ishe
d on
26
Mar
ch 2
014
Dow
nloa
ded
by N
atio
nal C
hung
Hsi
ng U
nive
rsity
on
120
420
14 1
036
16
View Article OnlineDOI 101039C4TA01057D
16
Figure 3 1
2
0 100 200 300 400 500 60040
50
60
70
80
90
100
5GOY
Y2O
3
GO
We
igh
t
Temperature oC
3
4
Page 17 of 24 Journal of Materials Chemistry A
Jour
nalo
fMat
eria
lsC
hem
istr
yA
Acc
epte
dM
anus
crip
t
Publ
ishe
d on
26
Mar
ch 2
014
Dow
nloa
ded
by N
atio
nal C
hung
Hsi
ng U
nive
rsity
on
120
420
14 1
036
16
View Article OnlineDOI 101039C4TA01057D
17
Figure 4 1
2
3
4
5
6
7
8
9
10
11
12
13
14
15
16
17
18
19
20
21
22
23
24
25
26
27
28
29
30
31
32
33
34
35
36
37
38
39
40
41
Page 18 of 24Journal of Materials Chemistry A
Jour
nalo
fMat
eria
lsC
hem
istr
yA
Acc
epte
dM
anus
crip
t
Publ
ishe
d on
26
Mar
ch 2
014
Dow
nloa
ded
by N
atio
nal C
hung
Hsi
ng U
nive
rsity
on
120
420
14 1
036
16
View Article OnlineDOI 101039C4TA01057D
18
Figure 5 1
2
3
1200 1000 800 600 400 200 0
Y 3d
C 1s
20 GOY
5 GOY
Y2O
3
Inte
ns
ity
a
u
Binding Energy eV
GO
O 1s
A
150 155 160 165 170 175
Inte
ns
ity
a
u
Binding Energy eV
Y 3d32
BY 3d
52
4
5
6
526 528 530 532 534 536
Inte
ns
ity
a
u
Binding Energy eV
O 1sC
282 284 286 288 290 292
Inte
ns
ity
a
u
Binding Energy eV
C-C
C-OC=O O-C=O
DC 1s
7
8
Page 19 of 24 Journal of Materials Chemistry A
Jour
nalo
fMat
eria
lsC
hem
istr
yA
Acc
epte
dM
anus
crip
t
Publ
ishe
d on
26
Mar
ch 2
014
Dow
nloa
ded
by N
atio
nal C
hung
Hsi
ng U
nive
rsity
on
120
420
14 1
036
16
View Article OnlineDOI 101039C4TA01057D
19
1
Figure 6 2
3
00
02
04
06
08
10
12
Y2O
3
20GOY
50GOY
10GOY
5GOYCo
nv
ers
ion
Photocatalysts
MO
MB
GO
4
5
6
7
8
Page 20 of 24Journal of Materials Chemistry A
Jour
nalo
fMat
eria
lsC
hem
istr
yA
Acc
epte
dM
anus
crip
t
Publ
ishe
d on
26
Mar
ch 2
014
Dow
nloa
ded
by N
atio
nal C
hung
Hsi
ng U
nive
rsity
on
120
420
14 1
036
16
View Article OnlineDOI 101039C4TA01057D
20
Figure 7 1
2
-5 0 5 10 15 20 25 30 35 40060
070
080
090
Co
nv
ers
ion
Time min
5 mg
6 mg
7 mg
8 mg
9 mg
10 mg
A100
-5 0 5 10 15 20 25 30 35 40
060
070
080
090
Co
nv
ers
ion
Time min
200 mg L-1
225 mg L-1
250 mg L-1
275 mg L-1
300 mg L-1
B100
3
4
-5 0 5 10 15 20 25 30 35 40
110
050
060
070
080
090
Co
nv
ers
ion
Time min
pH 303
pH 418
pH 519
pH 630
100
C
5
6
7
8
9
Page 21 of 24 Journal of Materials Chemistry A
Jour
nalo
fMat
eria
lsC
hem
istr
yA
Acc
epte
dM
anus
crip
t
Publ
ishe
d on
26
Mar
ch 2
014
Dow
nloa
ded
by N
atio
nal C
hung
Hsi
ng U
nive
rsity
on
120
420
14 1
036
16
View Article OnlineDOI 101039C4TA01057D
21
1
2
Figure 8 3
4
5
6
7
02 00 -02 -04
0
5
10
15
20j
A
cm
-2
E V (vs SCE)
Y2O
3
GO
5GOY
02 01 00 -01 -02 -0300
05
10
15
20
25
30
35
j A
cm
-2
E V (vs SCE)
Uv
Vis
Dark
5GOY
Page 22 of 24Journal of Materials Chemistry A
Jour
nalo
fMat
eria
lsC
hem
istr
yA
Acc
epte
dM
anus
crip
t
Publ
ishe
d on
26
Mar
ch 2
014
Dow
nloa
ded
by N
atio
nal C
hung
Hsi
ng U
nive
rsity
on
120
420
14 1
036
16
View Article OnlineDOI 101039C4TA01057D
22
1
2
Figure 9 3
4
400 450 500 550 600 650 700 750 800
Inte
ns
ity
a
u
Wavelength nm
20 GOY
5 GOY
Y2O
3
5
6
7
Page 23 of 24 Journal of Materials Chemistry A
Jour
nalo
fMat
eria
lsC
hem
istr
yA
Acc
epte
dM
anus
crip
t
Publ
ishe
d on
26
Mar
ch 2
014
Dow
nloa
ded
by N
atio
nal C
hung
Hsi
ng U
nive
rsity
on
120
420
14 1
036
16
View Article OnlineDOI 101039C4TA01057D
23
1
Figure 10 2
3
4
5
6
Page 24 of 24Journal of Materials Chemistry A
Jour
nalo
fMat
eria
lsC
hem
istr
yA
Acc
epte
dM
anus
crip
t
Publ
ishe
d on
26
Mar
ch 2
014
Dow
nloa
ded
by N
atio
nal C
hung
Hsi
ng U
nive
rsity
on
120
420
14 1
036
16
View Article OnlineDOI 101039C4TA01057D
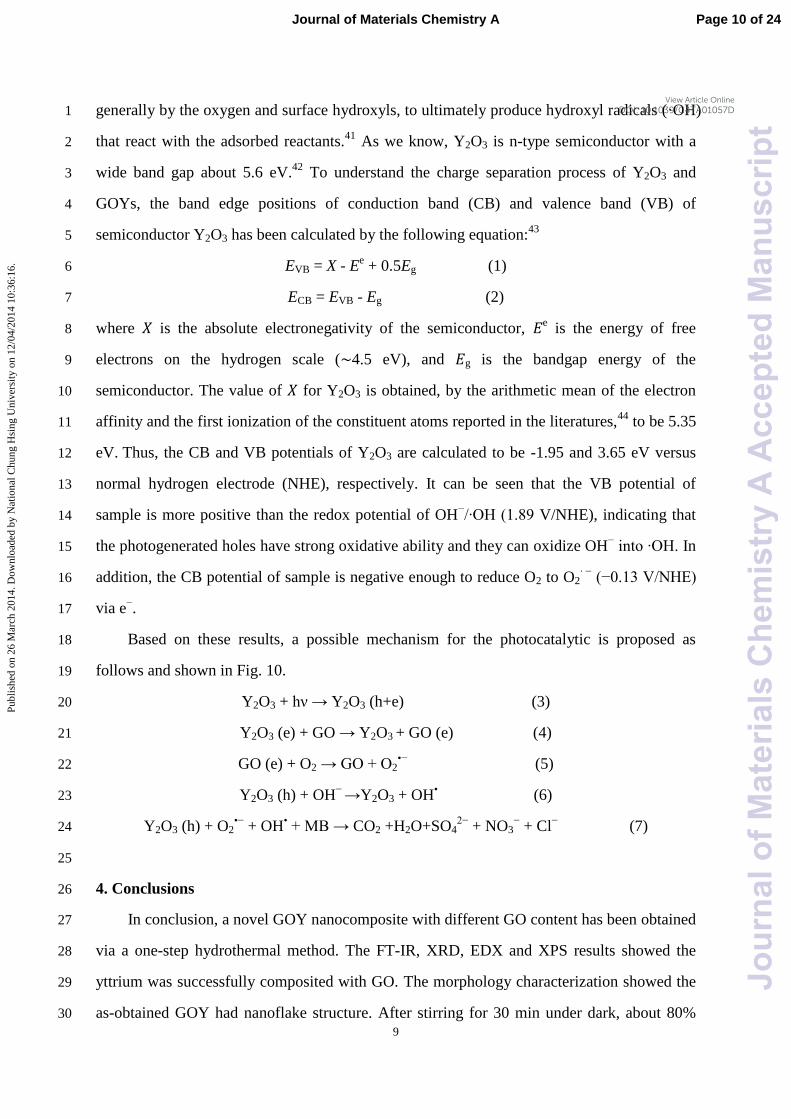
9
generally by the oxygen and surface hydroxyls to ultimately produce hydroxyl radicals (middotOH) 1
that react with the adsorbed reactants41
As we know Y2O3 is n-type semiconductor with a 2
wide band gap about 56 eV42
To understand the charge separation process of Y2O3 and 3
GOYs the band edge positions of conduction band (CB) and valence band (VB) of 4
semiconductor Y2O3 has been calculated by the following equation43
5
EVB = X - Ee + 05Eg (1) 6
ECB = EVB - Eg (2) 7
where is the absolute electronegativity of the semiconductor e is the energy of free 8
electrons on the hydrogen scale (sim45 eV) and g is the bandgap energy of the 9
semiconductor The value of for Y2O3 is obtained by the arithmetic mean of the electron 10
affinity and the first ionization of the constituent atoms reported in the literatures44
to be 535 11
eV Thus the CB and VB potentials of Y2O3 are calculated to be -195 and 365 eV versus 12
normal hydrogen electrode (NHE) respectively It can be seen that the VB potential of 13
sample is more positive than the redox potential of OHminus∙OH (189 VNHE) indicating that 14
the photogenerated holes have strong oxidative ability and they can oxidize OHminus into ∙OH In 15
addition the CB potential of sample is negative enough to reduce O2 to O2∙ minus
(minus013 VNHE) 16
via eminus 17
Based on these results a possible mechanism for the photocatalytic is proposed as 18
follows and shown in Fig 10 19
Y2O3 + hν rarr Y2O3 (h+e) (3) 20
Y2O3 (e) + GO rarr Y2O3 + GO (e) (4) 21
GO (e) + O2 rarr GO + O2bullminus (5) 22
Y2O3 (h) + OHminus rarrY2O3 + OH
bull (6) 23
Y2O3 (h) + O2bullminus
+ OHbull + MB rarr CO2 +H2O+SO4
2minus + NO3
minus + Cl
minus (7) 24
25
4 Conclusions 26
In conclusion a novel GOY nanocomposite with different GO content has been obtained 27
via a one-step hydrothermal method The FT-IR XRD EDX and XPS results showed the 28
yttrium was successfully composited with GO The morphology characterization showed the 29
as-obtained GOY had nanoflake structure After stirring for 30 min under dark about 80 30
Page 10 of 24Journal of Materials Chemistry A
Jour
nalo
fMat
eria
lsC
hem
istr
yA
Acc
epte
dM
anus
crip
t
Publ
ishe
d on
26
Mar
ch 2
014
Dow
nloa
ded
by N
atio
nal C
hung
Hsi
ng U
nive
rsity
on
120
420
14 1
036
16
View Article OnlineDOI 101039C4TA01057D
10
MB could be absorbed by Y2O3 and 5 GOY The as-prepared GOY had good degradation 1
performance on both MB and MO under UV irradiation Compared with other GOY 2
composites 5 GOY had better photocatalytic activity to MB Factors such as dosages of 3
photocatalyst contaminant concentration and solution pH on MB conversion were also 4
investigated and discussed The catalyst also showed good stability and recyclability It is 5
expected that the GOY nanocomposite would be a potential candidate for treatment of dye 6
containing wastewater 7
8
Acknowledgments 9
This work was supported by the National Natural Science Foundation of China (No 10
21307104) Natural Science Foundation of Jiangsu Province China (NoBK20130438) the 11
Scientific Research Project of Environmental Fund of Yangzhou City (YHK1303) and 12
Jiangsu Key Laboratory of Environmental Material and Engineering (K12031) We thank the 13
Testing Center of Yangzhou University for sample characterization 14
15
Notes and References 16
1 B K Korbahti K Artut C Gecgel A Ozer Chem Eng J 2011 173 677-688 17
2 V K Gupta D Pathania S Agarwal P Singh J Hazard Mater 2012 243 179-186 18
3 N Wetchakun S Chaiwichain B Inceesungvorn K Pingmuang S Phanichphant A I 19
Minett J Chen ACS Appl Mater Interfaces 2012 4 3718-3723 20
4 Y F Li D Xu J I Oh W Shen X Li Y Yu ACS Catal 2012 2 391-398 21
5 M Khan W B Cao J Mol Catal A Chem 2013 376 71-77 22
6 Y F Wu Q J Zhang X F Yin H Q Cheng RSC Advances 2013 3 9670-9676 23
7 F H Chu C W Huang C L Hsin C W Wang S Y Yu P H Yeh W W Wu 24
Nanoscale 2012 4 1471-1475 25
8 L J Xu J L Wang Environ Sci Technol 2012 46 10145-10153 26
9 Y C Zhang J Li H Y Xu Appl Catal B 2012 123-124 18-26 27
10 S Usai S Obreg n A I Becerro G ol n J Phys Chem C 2013 117 24479-24484 28
11 A K Geim K S Novoselov Nat Mater 2007 6 183-191 29
12 K-Y Shin J-Y Hong J Jang Adv Mater 2011 23 2113-2118 30
Page 11 of 24 Journal of Materials Chemistry A
Jour
nalo
fMat
eria
lsC
hem
istr
yA
Acc
epte
dM
anus
crip
t
Publ
ishe
d on
26
Mar
ch 2
014
Dow
nloa
ded
by N
atio
nal C
hung
Hsi
ng U
nive
rsity
on
120
420
14 1
036
16
View Article OnlineDOI 101039C4TA01057D
11
13 G K Pradhan D K Padhi K M Parida ACS Appl Mater Interfaces 2013 5 1
9101-9110 2
14 E Lee J Y Hong H Kang J Jang J Hazard Mater 2012 219-220 13-18 3
15 Y S Fu H Q Chen X Q Sun X Wang Appl Catal B 2012 111-112 280-287 4
16 K Krishnamoorthy R Mohan S J Kim Appl Phys Lett 2011 98 244101 5
17 M Li J Zhang Y Zhang Chem Phys Lett 2012 527 63-66 6
18 F Meng J Li Z Hong M Zhi A Sakla C Xiang N Wu Catal Today 2013 199 7
48-52 8
19 H Zhang K Tan H Zheng Y Gu W F Zhang Mater Chem Phys 2011 125 9
156-160 10
20 X Niu S Li H Chu J Zhou J Rare Earths 2011 29 225-229 11
21 H Narayan H Alemu L Setofolo L Macheli ISRN Phys Chem 2012 841521 1-9 12
22 M J Allen V C Tung R B Kaner Chem Rev 2010 110 132-145 13
23 F Y Ban S R Majid N M Huang H N Lim Int J Electrochem Sci 2012 7 14
4345-4351 15
24 Y L Min G Q He Q J Xu Y C Chen J Mater Chem A 2014 2 1294-1301 16
25 W Fan W Gao C Zhang W W Tjiu J S Pan T X Liu J Mater Chem 2012 22 17
25108-25115 18
26 Z -S Wu W Ren L Wen L Gao J Zhao Z Chen G Zhou F Li H -M Cheng ACS 19
Nano 2010 4 3187-3194 20
27 J A Dorman Y B Mao J R Bargar J P Chang J Phys Chem C 2010 114 21
17422-17427 22
28 R P Ermakov VV Voronov P P Fedorov Nanosystems physics chemistry 23
mathematics 2013 4 (2) 196-205 24
29 A Lerf H He M Forster J Klinowski J Phys Chem B 1998102(23) 4477-4482 25
30 G Wang Z Yang X Li C Li Carbon 2005 43(12) 2564-2570 26
31 S Stankovich D A Dikin R D Piner K A Kohlhaas A Kleinhammes Y Y Jia Y 27
Wu S T Nguyen R S Ruoff Carbon 2007 45 1558-1565 28
32 M Aghazadeh A Nozad H Adelkhani M Ghaemi J Electrochem Soc 2010 157 29
D519-D522 30
Page 12 of 24Journal of Materials Chemistry A
Jour
nalo
fMat
eria
lsC
hem
istr
yA
Acc
epte
dM
anus
crip
t
Publ
ishe
d on
26
Mar
ch 2
014
Dow
nloa
ded
by N
atio
nal C
hung
Hsi
ng U
nive
rsity
on
120
420
14 1
036
16
View Article OnlineDOI 101039C4TA01057D
12
33 L Nan Y Kazumichi J Solid State Chem 2008 181 1738-1743 1
34 R Srinivasan N R Yogamalar J Elanchezhiyan R J Joseyphus A C Bose J Alloy 2
Compd 2010 496 472-477 3
35 S Somacescu J M C Moreno P Osiceanu B L Su V Parvulescu J Phys Chem C 4
2010 114 19365 5
36 J H Pan W I Lee Chem Mater 2006 18 847-853 6
37 Y Chen B H Song X S Tang L Lu J M Xue J Mater Chem 2012 22 7
17656-17662 8
38 J Xu Y Chang Y Zhang S Ma Y Qu C Xu Appl Surf Sci 2008 255 1996-1999 9
39 LP Zhu NC Bing LL Wang HY Jin GH Liao LJ Wang Dalton Trans 2012 41 10
2959-2965 11
40 Z Pei L Ding H Lin S Weng Z Zheng Y Hou P Liu J Mater Chem A 2013 1 12
10099-10102 13
41Y L Pan S Z Deng L Polavarapu N Y Gao P Y Yuan C H Sow Q H Xu 14
Langmuir 2012 28 12304-12310 15
42 P Rouffignac J S Park R G Gordon Chem Mater 2005 17 4808-4814 16
43 H Xu H Li C Wu J Chu Y Yan H Shu Z Gu J Hazard Mater 2008 153 17
877-880 18
44 T Andersen H K Haugen H Hotop J Phys Chem Ref Data 1999 28(6) 1511-1533 19
20
Page 13 of 24 Journal of Materials Chemistry A
Jour
nalo
fMat
eria
lsC
hem
istr
yA
Acc
epte
dM
anus
crip
t
Publ
ishe
d on
26
Mar
ch 2
014
Dow
nloa
ded
by N
atio
nal C
hung
Hsi
ng U
nive
rsity
on
120
420
14 1
036
16
View Article OnlineDOI 101039C4TA01057D
13
Figure captions 1
2
Figure 1 FT-IR spectra of GO Y2O3 and 5 GOY composites 3
Figure 2 XRD patterns of GO Y2O3 and 5 GOY composites 4
Figure 3 TGA curves of GO Y2O3 and 5 GOY composites 5
Figure 4 FESEM images of (A) Y2O3 (Insert low magnification) (B) GO (C) 5 GOY and 6
(D) 20 GOY composites (Insert EDS spectrum of 20 GOY sample) (E) and (F) 7
HRTEM images of 5 GOY taken after intense ultrasonic dispersion in ethanol for 30 8
min 9
Figure 5 XPS spectra (A) full survey spectra of GO Y2O3 and GOY nanocomposite (B) Y 10
3d of 5 GOY (C) O 1s of 5 GOY (D) C 1s of 5 GOY 11
Figure 6 Comparison of photodegradation efficiency using as-synthesized GO Y2O3 and 12
GOY composites 13
Figure 7 (A) Effect of dosage on MB conversion MB concentration 25 ppm pH = 41 (B) 14
Effect of MB concentration on the degradation Dosage 10 mg pH = 41 (C) Effect of 15
solution pH on MB conversion MB concentration 25 ppm Dosage 10 mg 16
Figure 8 Photocurrent responses of GO Y2O3 and 5 GOY photoelectrodes under UV 17
illumination Insert Photocurrent responses of 5 GOY under different illumination 18
conditions Scan rate 50 mVs The electrolyte solution was 05 M NaCl 19
Figure 9 PL spectra of Y2O3 5 GOY and 20 GOY samples (λex = 258 nm) 20
Figure 10 Proposed mechanism for the photodegradation of MB on GOY composite21
Page 14 of 24Journal of Materials Chemistry A
Jour
nalo
fMat
eria
lsC
hem
istr
yA
Acc
epte
dM
anus
crip
t
Publ
ishe
d on
26
Mar
ch 2
014
Dow
nloa
ded
by N
atio
nal C
hung
Hsi
ng U
nive
rsity
on
120
420
14 1
036
16
View Article OnlineDOI 101039C4TA01057D
14
Figure 1 1
2
3
4
500 1000 1500 2000 2500 3000 3500 4000
1657
Tra
ns
mit
tan
ce
Wavenumber cm-1
1657
1550
1564 17211223
1436
1436
GO
Y2O
3
5GOY
5
6
Page 15 of 24 Journal of Materials Chemistry A
Jour
nalo
fMat
eria
lsC
hem
istr
yA
Acc
epte
dM
anus
crip
t
Publ
ishe
d on
26
Mar
ch 2
014
Dow
nloa
ded
by N
atio
nal C
hung
Hsi
ng U
nive
rsity
on
120
420
14 1
036
16
View Article OnlineDOI 101039C4TA01057D
15
Figure 2 1
2
3
10 20 30 40 50 60 70
5GOY2O
3
Inte
ns
ity
a
u
2degree
GO
Y2O
3
4
5
6
Page 16 of 24Journal of Materials Chemistry A
Jour
nalo
fMat
eria
lsC
hem
istr
yA
Acc
epte
dM
anus
crip
t
Publ
ishe
d on
26
Mar
ch 2
014
Dow
nloa
ded
by N
atio
nal C
hung
Hsi
ng U
nive
rsity
on
120
420
14 1
036
16
View Article OnlineDOI 101039C4TA01057D
16
Figure 3 1
2
0 100 200 300 400 500 60040
50
60
70
80
90
100
5GOY
Y2O
3
GO
We
igh
t
Temperature oC
3
4
Page 17 of 24 Journal of Materials Chemistry A
Jour
nalo
fMat
eria
lsC
hem
istr
yA
Acc
epte
dM
anus
crip
t
Publ
ishe
d on
26
Mar
ch 2
014
Dow
nloa
ded
by N
atio
nal C
hung
Hsi
ng U
nive
rsity
on
120
420
14 1
036
16
View Article OnlineDOI 101039C4TA01057D
17
Figure 4 1
2
3
4
5
6
7
8
9
10
11
12
13
14
15
16
17
18
19
20
21
22
23
24
25
26
27
28
29
30
31
32
33
34
35
36
37
38
39
40
41
Page 18 of 24Journal of Materials Chemistry A
Jour
nalo
fMat
eria
lsC
hem
istr
yA
Acc
epte
dM
anus
crip
t
Publ
ishe
d on
26
Mar
ch 2
014
Dow
nloa
ded
by N
atio
nal C
hung
Hsi
ng U
nive
rsity
on
120
420
14 1
036
16
View Article OnlineDOI 101039C4TA01057D
18
Figure 5 1
2
3
1200 1000 800 600 400 200 0
Y 3d
C 1s
20 GOY
5 GOY
Y2O
3
Inte
ns
ity
a
u
Binding Energy eV
GO
O 1s
A
150 155 160 165 170 175
Inte
ns
ity
a
u
Binding Energy eV
Y 3d32
BY 3d
52
4
5
6
526 528 530 532 534 536
Inte
ns
ity
a
u
Binding Energy eV
O 1sC
282 284 286 288 290 292
Inte
ns
ity
a
u
Binding Energy eV
C-C
C-OC=O O-C=O
DC 1s
7
8
Page 19 of 24 Journal of Materials Chemistry A
Jour
nalo
fMat
eria
lsC
hem
istr
yA
Acc
epte
dM
anus
crip
t
Publ
ishe
d on
26
Mar
ch 2
014
Dow
nloa
ded
by N
atio
nal C
hung
Hsi
ng U
nive
rsity
on
120
420
14 1
036
16
View Article OnlineDOI 101039C4TA01057D
19
1
Figure 6 2
3
00
02
04
06
08
10
12
Y2O
3
20GOY
50GOY
10GOY
5GOYCo
nv
ers
ion
Photocatalysts
MO
MB
GO
4
5
6
7
8
Page 20 of 24Journal of Materials Chemistry A
Jour
nalo
fMat
eria
lsC
hem
istr
yA
Acc
epte
dM
anus
crip
t
Publ
ishe
d on
26
Mar
ch 2
014
Dow
nloa
ded
by N
atio
nal C
hung
Hsi
ng U
nive
rsity
on
120
420
14 1
036
16
View Article OnlineDOI 101039C4TA01057D
20
Figure 7 1
2
-5 0 5 10 15 20 25 30 35 40060
070
080
090
Co
nv
ers
ion
Time min
5 mg
6 mg
7 mg
8 mg
9 mg
10 mg
A100
-5 0 5 10 15 20 25 30 35 40
060
070
080
090
Co
nv
ers
ion
Time min
200 mg L-1
225 mg L-1
250 mg L-1
275 mg L-1
300 mg L-1
B100
3
4
-5 0 5 10 15 20 25 30 35 40
110
050
060
070
080
090
Co
nv
ers
ion
Time min
pH 303
pH 418
pH 519
pH 630
100
C
5
6
7
8
9
Page 21 of 24 Journal of Materials Chemistry A
Jour
nalo
fMat
eria
lsC
hem
istr
yA
Acc
epte
dM
anus
crip
t
Publ
ishe
d on
26
Mar
ch 2
014
Dow
nloa
ded
by N
atio
nal C
hung
Hsi
ng U
nive
rsity
on
120
420
14 1
036
16
View Article OnlineDOI 101039C4TA01057D
21
1
2
Figure 8 3
4
5
6
7
02 00 -02 -04
0
5
10
15
20j
A
cm
-2
E V (vs SCE)
Y2O
3
GO
5GOY
02 01 00 -01 -02 -0300
05
10
15
20
25
30
35
j A
cm
-2
E V (vs SCE)
Uv
Vis
Dark
5GOY
Page 22 of 24Journal of Materials Chemistry A
Jour
nalo
fMat
eria
lsC
hem
istr
yA
Acc
epte
dM
anus
crip
t
Publ
ishe
d on
26
Mar
ch 2
014
Dow
nloa
ded
by N
atio
nal C
hung
Hsi
ng U
nive
rsity
on
120
420
14 1
036
16
View Article OnlineDOI 101039C4TA01057D
22
1
2
Figure 9 3
4
400 450 500 550 600 650 700 750 800
Inte
ns
ity
a
u
Wavelength nm
20 GOY
5 GOY
Y2O
3
5
6
7
Page 23 of 24 Journal of Materials Chemistry A
Jour
nalo
fMat
eria
lsC
hem
istr
yA
Acc
epte
dM
anus
crip
t
Publ
ishe
d on
26
Mar
ch 2
014
Dow
nloa
ded
by N
atio
nal C
hung
Hsi
ng U
nive
rsity
on
120
420
14 1
036
16
View Article OnlineDOI 101039C4TA01057D
23
1
Figure 10 2
3
4
5
6
Page 24 of 24Journal of Materials Chemistry A
Jour
nalo
fMat
eria
lsC
hem
istr
yA
Acc
epte
dM
anus
crip
t
Publ
ishe
d on
26
Mar
ch 2
014
Dow
nloa
ded
by N
atio
nal C
hung
Hsi
ng U
nive
rsity
on
120
420
14 1
036
16
View Article OnlineDOI 101039C4TA01057D
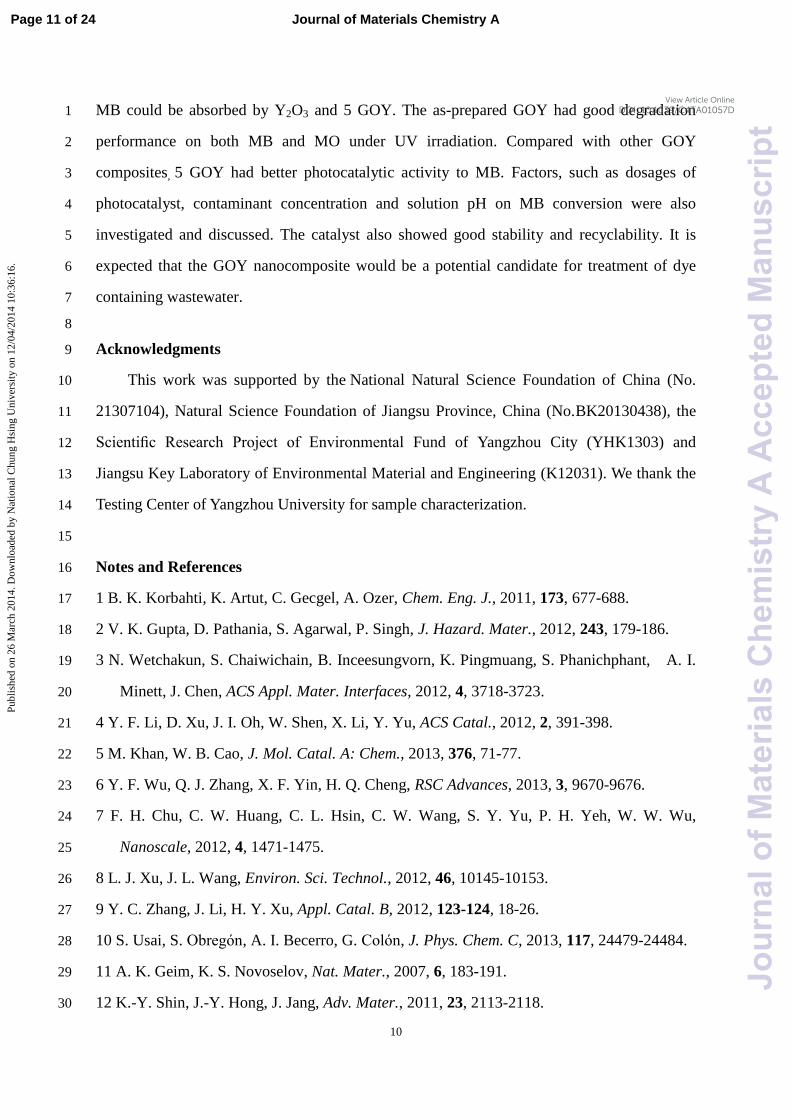
10
MB could be absorbed by Y2O3 and 5 GOY The as-prepared GOY had good degradation 1
performance on both MB and MO under UV irradiation Compared with other GOY 2
composites 5 GOY had better photocatalytic activity to MB Factors such as dosages of 3
photocatalyst contaminant concentration and solution pH on MB conversion were also 4
investigated and discussed The catalyst also showed good stability and recyclability It is 5
expected that the GOY nanocomposite would be a potential candidate for treatment of dye 6
containing wastewater 7
8
Acknowledgments 9
This work was supported by the National Natural Science Foundation of China (No 10
21307104) Natural Science Foundation of Jiangsu Province China (NoBK20130438) the 11
Scientific Research Project of Environmental Fund of Yangzhou City (YHK1303) and 12
Jiangsu Key Laboratory of Environmental Material and Engineering (K12031) We thank the 13
Testing Center of Yangzhou University for sample characterization 14
15
Notes and References 16
1 B K Korbahti K Artut C Gecgel A Ozer Chem Eng J 2011 173 677-688 17
2 V K Gupta D Pathania S Agarwal P Singh J Hazard Mater 2012 243 179-186 18
3 N Wetchakun S Chaiwichain B Inceesungvorn K Pingmuang S Phanichphant A I 19
Minett J Chen ACS Appl Mater Interfaces 2012 4 3718-3723 20
4 Y F Li D Xu J I Oh W Shen X Li Y Yu ACS Catal 2012 2 391-398 21
5 M Khan W B Cao J Mol Catal A Chem 2013 376 71-77 22
6 Y F Wu Q J Zhang X F Yin H Q Cheng RSC Advances 2013 3 9670-9676 23
7 F H Chu C W Huang C L Hsin C W Wang S Y Yu P H Yeh W W Wu 24
Nanoscale 2012 4 1471-1475 25
8 L J Xu J L Wang Environ Sci Technol 2012 46 10145-10153 26
9 Y C Zhang J Li H Y Xu Appl Catal B 2012 123-124 18-26 27
10 S Usai S Obreg n A I Becerro G ol n J Phys Chem C 2013 117 24479-24484 28
11 A K Geim K S Novoselov Nat Mater 2007 6 183-191 29
12 K-Y Shin J-Y Hong J Jang Adv Mater 2011 23 2113-2118 30
Page 11 of 24 Journal of Materials Chemistry A
Jour
nalo
fMat
eria
lsC
hem
istr
yA
Acc
epte
dM
anus
crip
t
Publ
ishe
d on
26
Mar
ch 2
014
Dow
nloa
ded
by N
atio
nal C
hung
Hsi
ng U
nive
rsity
on
120
420
14 1
036
16
View Article OnlineDOI 101039C4TA01057D
11
13 G K Pradhan D K Padhi K M Parida ACS Appl Mater Interfaces 2013 5 1
9101-9110 2
14 E Lee J Y Hong H Kang J Jang J Hazard Mater 2012 219-220 13-18 3
15 Y S Fu H Q Chen X Q Sun X Wang Appl Catal B 2012 111-112 280-287 4
16 K Krishnamoorthy R Mohan S J Kim Appl Phys Lett 2011 98 244101 5
17 M Li J Zhang Y Zhang Chem Phys Lett 2012 527 63-66 6
18 F Meng J Li Z Hong M Zhi A Sakla C Xiang N Wu Catal Today 2013 199 7
48-52 8
19 H Zhang K Tan H Zheng Y Gu W F Zhang Mater Chem Phys 2011 125 9
156-160 10
20 X Niu S Li H Chu J Zhou J Rare Earths 2011 29 225-229 11
21 H Narayan H Alemu L Setofolo L Macheli ISRN Phys Chem 2012 841521 1-9 12
22 M J Allen V C Tung R B Kaner Chem Rev 2010 110 132-145 13
23 F Y Ban S R Majid N M Huang H N Lim Int J Electrochem Sci 2012 7 14
4345-4351 15
24 Y L Min G Q He Q J Xu Y C Chen J Mater Chem A 2014 2 1294-1301 16
25 W Fan W Gao C Zhang W W Tjiu J S Pan T X Liu J Mater Chem 2012 22 17
25108-25115 18
26 Z -S Wu W Ren L Wen L Gao J Zhao Z Chen G Zhou F Li H -M Cheng ACS 19
Nano 2010 4 3187-3194 20
27 J A Dorman Y B Mao J R Bargar J P Chang J Phys Chem C 2010 114 21
17422-17427 22
28 R P Ermakov VV Voronov P P Fedorov Nanosystems physics chemistry 23
mathematics 2013 4 (2) 196-205 24
29 A Lerf H He M Forster J Klinowski J Phys Chem B 1998102(23) 4477-4482 25
30 G Wang Z Yang X Li C Li Carbon 2005 43(12) 2564-2570 26
31 S Stankovich D A Dikin R D Piner K A Kohlhaas A Kleinhammes Y Y Jia Y 27
Wu S T Nguyen R S Ruoff Carbon 2007 45 1558-1565 28
32 M Aghazadeh A Nozad H Adelkhani M Ghaemi J Electrochem Soc 2010 157 29
D519-D522 30
Page 12 of 24Journal of Materials Chemistry A
Jour
nalo
fMat
eria
lsC
hem
istr
yA
Acc
epte
dM
anus
crip
t
Publ
ishe
d on
26
Mar
ch 2
014
Dow
nloa
ded
by N
atio
nal C
hung
Hsi
ng U
nive
rsity
on
120
420
14 1
036
16
View Article OnlineDOI 101039C4TA01057D
12
33 L Nan Y Kazumichi J Solid State Chem 2008 181 1738-1743 1
34 R Srinivasan N R Yogamalar J Elanchezhiyan R J Joseyphus A C Bose J Alloy 2
Compd 2010 496 472-477 3
35 S Somacescu J M C Moreno P Osiceanu B L Su V Parvulescu J Phys Chem C 4
2010 114 19365 5
36 J H Pan W I Lee Chem Mater 2006 18 847-853 6
37 Y Chen B H Song X S Tang L Lu J M Xue J Mater Chem 2012 22 7
17656-17662 8
38 J Xu Y Chang Y Zhang S Ma Y Qu C Xu Appl Surf Sci 2008 255 1996-1999 9
39 LP Zhu NC Bing LL Wang HY Jin GH Liao LJ Wang Dalton Trans 2012 41 10
2959-2965 11
40 Z Pei L Ding H Lin S Weng Z Zheng Y Hou P Liu J Mater Chem A 2013 1 12
10099-10102 13
41Y L Pan S Z Deng L Polavarapu N Y Gao P Y Yuan C H Sow Q H Xu 14
Langmuir 2012 28 12304-12310 15
42 P Rouffignac J S Park R G Gordon Chem Mater 2005 17 4808-4814 16
43 H Xu H Li C Wu J Chu Y Yan H Shu Z Gu J Hazard Mater 2008 153 17
877-880 18
44 T Andersen H K Haugen H Hotop J Phys Chem Ref Data 1999 28(6) 1511-1533 19
20
Page 13 of 24 Journal of Materials Chemistry A
Jour
nalo
fMat
eria
lsC
hem
istr
yA
Acc
epte
dM
anus
crip
t
Publ
ishe
d on
26
Mar
ch 2
014
Dow
nloa
ded
by N
atio
nal C
hung
Hsi
ng U
nive
rsity
on
120
420
14 1
036
16
View Article OnlineDOI 101039C4TA01057D
13
Figure captions 1
2
Figure 1 FT-IR spectra of GO Y2O3 and 5 GOY composites 3
Figure 2 XRD patterns of GO Y2O3 and 5 GOY composites 4
Figure 3 TGA curves of GO Y2O3 and 5 GOY composites 5
Figure 4 FESEM images of (A) Y2O3 (Insert low magnification) (B) GO (C) 5 GOY and 6
(D) 20 GOY composites (Insert EDS spectrum of 20 GOY sample) (E) and (F) 7
HRTEM images of 5 GOY taken after intense ultrasonic dispersion in ethanol for 30 8
min 9
Figure 5 XPS spectra (A) full survey spectra of GO Y2O3 and GOY nanocomposite (B) Y 10
3d of 5 GOY (C) O 1s of 5 GOY (D) C 1s of 5 GOY 11
Figure 6 Comparison of photodegradation efficiency using as-synthesized GO Y2O3 and 12
GOY composites 13
Figure 7 (A) Effect of dosage on MB conversion MB concentration 25 ppm pH = 41 (B) 14
Effect of MB concentration on the degradation Dosage 10 mg pH = 41 (C) Effect of 15
solution pH on MB conversion MB concentration 25 ppm Dosage 10 mg 16
Figure 8 Photocurrent responses of GO Y2O3 and 5 GOY photoelectrodes under UV 17
illumination Insert Photocurrent responses of 5 GOY under different illumination 18
conditions Scan rate 50 mVs The electrolyte solution was 05 M NaCl 19
Figure 9 PL spectra of Y2O3 5 GOY and 20 GOY samples (λex = 258 nm) 20
Figure 10 Proposed mechanism for the photodegradation of MB on GOY composite21
Page 14 of 24Journal of Materials Chemistry A
Jour
nalo
fMat
eria
lsC
hem
istr
yA
Acc
epte
dM
anus
crip
t
Publ
ishe
d on
26
Mar
ch 2
014
Dow
nloa
ded
by N
atio
nal C
hung
Hsi
ng U
nive
rsity
on
120
420
14 1
036
16
View Article OnlineDOI 101039C4TA01057D
14
Figure 1 1
2
3
4
500 1000 1500 2000 2500 3000 3500 4000
1657
Tra
ns
mit
tan
ce
Wavenumber cm-1
1657
1550
1564 17211223
1436
1436
GO
Y2O
3
5GOY
5
6
Page 15 of 24 Journal of Materials Chemistry A
Jour
nalo
fMat
eria
lsC
hem
istr
yA
Acc
epte
dM
anus
crip
t
Publ
ishe
d on
26
Mar
ch 2
014
Dow
nloa
ded
by N
atio
nal C
hung
Hsi
ng U
nive
rsity
on
120
420
14 1
036
16
View Article OnlineDOI 101039C4TA01057D
15
Figure 2 1
2
3
10 20 30 40 50 60 70
5GOY2O
3
Inte
ns
ity
a
u
2degree
GO
Y2O
3
4
5
6
Page 16 of 24Journal of Materials Chemistry A
Jour
nalo
fMat
eria
lsC
hem
istr
yA
Acc
epte
dM
anus
crip
t
Publ
ishe
d on
26
Mar
ch 2
014
Dow
nloa
ded
by N
atio
nal C
hung
Hsi
ng U
nive
rsity
on
120
420
14 1
036
16
View Article OnlineDOI 101039C4TA01057D
16
Figure 3 1
2
0 100 200 300 400 500 60040
50
60
70
80
90
100
5GOY
Y2O
3
GO
We
igh
t
Temperature oC
3
4
Page 17 of 24 Journal of Materials Chemistry A
Jour
nalo
fMat
eria
lsC
hem
istr
yA
Acc
epte
dM
anus
crip
t
Publ
ishe
d on
26
Mar
ch 2
014
Dow
nloa
ded
by N
atio
nal C
hung
Hsi
ng U
nive
rsity
on
120
420
14 1
036
16
View Article OnlineDOI 101039C4TA01057D
17
Figure 4 1
2
3
4
5
6
7
8
9
10
11
12
13
14
15
16
17
18
19
20
21
22
23
24
25
26
27
28
29
30
31
32
33
34
35
36
37
38
39
40
41
Page 18 of 24Journal of Materials Chemistry A
Jour
nalo
fMat
eria
lsC
hem
istr
yA
Acc
epte
dM
anus
crip
t
Publ
ishe
d on
26
Mar
ch 2
014
Dow
nloa
ded
by N
atio
nal C
hung
Hsi
ng U
nive
rsity
on
120
420
14 1
036
16
View Article OnlineDOI 101039C4TA01057D
18
Figure 5 1
2
3
1200 1000 800 600 400 200 0
Y 3d
C 1s
20 GOY
5 GOY
Y2O
3
Inte
ns
ity
a
u
Binding Energy eV
GO
O 1s
A
150 155 160 165 170 175
Inte
ns
ity
a
u
Binding Energy eV
Y 3d32
BY 3d
52
4
5
6
526 528 530 532 534 536
Inte
ns
ity
a
u
Binding Energy eV
O 1sC
282 284 286 288 290 292
Inte
ns
ity
a
u
Binding Energy eV
C-C
C-OC=O O-C=O
DC 1s
7
8
Page 19 of 24 Journal of Materials Chemistry A
Jour
nalo
fMat
eria
lsC
hem
istr
yA
Acc
epte
dM
anus
crip
t
Publ
ishe
d on
26
Mar
ch 2
014
Dow
nloa
ded
by N
atio
nal C
hung
Hsi
ng U
nive
rsity
on
120
420
14 1
036
16
View Article OnlineDOI 101039C4TA01057D
19
1
Figure 6 2
3
00
02
04
06
08
10
12
Y2O
3
20GOY
50GOY
10GOY
5GOYCo
nv
ers
ion
Photocatalysts
MO
MB
GO
4
5
6
7
8
Page 20 of 24Journal of Materials Chemistry A
Jour
nalo
fMat
eria
lsC
hem
istr
yA
Acc
epte
dM
anus
crip
t
Publ
ishe
d on
26
Mar
ch 2
014
Dow
nloa
ded
by N
atio
nal C
hung
Hsi
ng U
nive
rsity
on
120
420
14 1
036
16
View Article OnlineDOI 101039C4TA01057D
20
Figure 7 1
2
-5 0 5 10 15 20 25 30 35 40060
070
080
090
Co
nv
ers
ion
Time min
5 mg
6 mg
7 mg
8 mg
9 mg
10 mg
A100
-5 0 5 10 15 20 25 30 35 40
060
070
080
090
Co
nv
ers
ion
Time min
200 mg L-1
225 mg L-1
250 mg L-1
275 mg L-1
300 mg L-1
B100
3
4
-5 0 5 10 15 20 25 30 35 40
110
050
060
070
080
090
Co
nv
ers
ion
Time min
pH 303
pH 418
pH 519
pH 630
100
C
5
6
7
8
9
Page 21 of 24 Journal of Materials Chemistry A
Jour
nalo
fMat
eria
lsC
hem
istr
yA
Acc
epte
dM
anus
crip
t
Publ
ishe
d on
26
Mar
ch 2
014
Dow
nloa
ded
by N
atio
nal C
hung
Hsi
ng U
nive
rsity
on
120
420
14 1
036
16
View Article OnlineDOI 101039C4TA01057D
21
1
2
Figure 8 3
4
5
6
7
02 00 -02 -04
0
5
10
15
20j
A
cm
-2
E V (vs SCE)
Y2O
3
GO
5GOY
02 01 00 -01 -02 -0300
05
10
15
20
25
30
35
j A
cm
-2
E V (vs SCE)
Uv
Vis
Dark
5GOY
Page 22 of 24Journal of Materials Chemistry A
Jour
nalo
fMat
eria
lsC
hem
istr
yA
Acc
epte
dM
anus
crip
t
Publ
ishe
d on
26
Mar
ch 2
014
Dow
nloa
ded
by N
atio
nal C
hung
Hsi
ng U
nive
rsity
on
120
420
14 1
036
16
View Article OnlineDOI 101039C4TA01057D
22
1
2
Figure 9 3
4
400 450 500 550 600 650 700 750 800
Inte
ns
ity
a
u
Wavelength nm
20 GOY
5 GOY
Y2O
3
5
6
7
Page 23 of 24 Journal of Materials Chemistry A
Jour
nalo
fMat
eria
lsC
hem
istr
yA
Acc
epte
dM
anus
crip
t
Publ
ishe
d on
26
Mar
ch 2
014
Dow
nloa
ded
by N
atio
nal C
hung
Hsi
ng U
nive
rsity
on
120
420
14 1
036
16
View Article OnlineDOI 101039C4TA01057D
23
1
Figure 10 2
3
4
5
6
Page 24 of 24Journal of Materials Chemistry A
Jour
nalo
fMat
eria
lsC
hem
istr
yA
Acc
epte
dM
anus
crip
t
Publ
ishe
d on
26
Mar
ch 2
014
Dow
nloa
ded
by N
atio
nal C
hung
Hsi
ng U
nive
rsity
on
120
420
14 1
036
16
View Article OnlineDOI 101039C4TA01057D
11
13 G K Pradhan D K Padhi K M Parida ACS Appl Mater Interfaces 2013 5 1
9101-9110 2
14 E Lee J Y Hong H Kang J Jang J Hazard Mater 2012 219-220 13-18 3
15 Y S Fu H Q Chen X Q Sun X Wang Appl Catal B 2012 111-112 280-287 4
16 K Krishnamoorthy R Mohan S J Kim Appl Phys Lett 2011 98 244101 5
17 M Li J Zhang Y Zhang Chem Phys Lett 2012 527 63-66 6
18 F Meng J Li Z Hong M Zhi A Sakla C Xiang N Wu Catal Today 2013 199 7
48-52 8
19 H Zhang K Tan H Zheng Y Gu W F Zhang Mater Chem Phys 2011 125 9
156-160 10
20 X Niu S Li H Chu J Zhou J Rare Earths 2011 29 225-229 11
21 H Narayan H Alemu L Setofolo L Macheli ISRN Phys Chem 2012 841521 1-9 12
22 M J Allen V C Tung R B Kaner Chem Rev 2010 110 132-145 13
23 F Y Ban S R Majid N M Huang H N Lim Int J Electrochem Sci 2012 7 14
4345-4351 15
24 Y L Min G Q He Q J Xu Y C Chen J Mater Chem A 2014 2 1294-1301 16
25 W Fan W Gao C Zhang W W Tjiu J S Pan T X Liu J Mater Chem 2012 22 17
25108-25115 18
26 Z -S Wu W Ren L Wen L Gao J Zhao Z Chen G Zhou F Li H -M Cheng ACS 19
Nano 2010 4 3187-3194 20
27 J A Dorman Y B Mao J R Bargar J P Chang J Phys Chem C 2010 114 21
17422-17427 22
28 R P Ermakov VV Voronov P P Fedorov Nanosystems physics chemistry 23
mathematics 2013 4 (2) 196-205 24
29 A Lerf H He M Forster J Klinowski J Phys Chem B 1998102(23) 4477-4482 25
30 G Wang Z Yang X Li C Li Carbon 2005 43(12) 2564-2570 26
31 S Stankovich D A Dikin R D Piner K A Kohlhaas A Kleinhammes Y Y Jia Y 27
Wu S T Nguyen R S Ruoff Carbon 2007 45 1558-1565 28
32 M Aghazadeh A Nozad H Adelkhani M Ghaemi J Electrochem Soc 2010 157 29
D519-D522 30
Page 12 of 24Journal of Materials Chemistry A
Jour
nalo
fMat
eria
lsC
hem
istr
yA
Acc
epte
dM
anus
crip
t
Publ
ishe
d on
26
Mar
ch 2
014
Dow
nloa
ded
by N
atio
nal C
hung
Hsi
ng U
nive
rsity
on
120
420
14 1
036
16
View Article OnlineDOI 101039C4TA01057D
12
33 L Nan Y Kazumichi J Solid State Chem 2008 181 1738-1743 1
34 R Srinivasan N R Yogamalar J Elanchezhiyan R J Joseyphus A C Bose J Alloy 2
Compd 2010 496 472-477 3
35 S Somacescu J M C Moreno P Osiceanu B L Su V Parvulescu J Phys Chem C 4
2010 114 19365 5
36 J H Pan W I Lee Chem Mater 2006 18 847-853 6
37 Y Chen B H Song X S Tang L Lu J M Xue J Mater Chem 2012 22 7
17656-17662 8
38 J Xu Y Chang Y Zhang S Ma Y Qu C Xu Appl Surf Sci 2008 255 1996-1999 9
39 LP Zhu NC Bing LL Wang HY Jin GH Liao LJ Wang Dalton Trans 2012 41 10
2959-2965 11
40 Z Pei L Ding H Lin S Weng Z Zheng Y Hou P Liu J Mater Chem A 2013 1 12
10099-10102 13
41Y L Pan S Z Deng L Polavarapu N Y Gao P Y Yuan C H Sow Q H Xu 14
Langmuir 2012 28 12304-12310 15
42 P Rouffignac J S Park R G Gordon Chem Mater 2005 17 4808-4814 16
43 H Xu H Li C Wu J Chu Y Yan H Shu Z Gu J Hazard Mater 2008 153 17
877-880 18
44 T Andersen H K Haugen H Hotop J Phys Chem Ref Data 1999 28(6) 1511-1533 19
20
Page 13 of 24 Journal of Materials Chemistry A
Jour
nalo
fMat
eria
lsC
hem
istr
yA
Acc
epte
dM
anus
crip
t
Publ
ishe
d on
26
Mar
ch 2
014
Dow
nloa
ded
by N
atio
nal C
hung
Hsi
ng U
nive
rsity
on
120
420
14 1
036
16
View Article OnlineDOI 101039C4TA01057D
13
Figure captions 1
2
Figure 1 FT-IR spectra of GO Y2O3 and 5 GOY composites 3
Figure 2 XRD patterns of GO Y2O3 and 5 GOY composites 4
Figure 3 TGA curves of GO Y2O3 and 5 GOY composites 5
Figure 4 FESEM images of (A) Y2O3 (Insert low magnification) (B) GO (C) 5 GOY and 6
(D) 20 GOY composites (Insert EDS spectrum of 20 GOY sample) (E) and (F) 7
HRTEM images of 5 GOY taken after intense ultrasonic dispersion in ethanol for 30 8
min 9
Figure 5 XPS spectra (A) full survey spectra of GO Y2O3 and GOY nanocomposite (B) Y 10
3d of 5 GOY (C) O 1s of 5 GOY (D) C 1s of 5 GOY 11
Figure 6 Comparison of photodegradation efficiency using as-synthesized GO Y2O3 and 12
GOY composites 13
Figure 7 (A) Effect of dosage on MB conversion MB concentration 25 ppm pH = 41 (B) 14
Effect of MB concentration on the degradation Dosage 10 mg pH = 41 (C) Effect of 15
solution pH on MB conversion MB concentration 25 ppm Dosage 10 mg 16
Figure 8 Photocurrent responses of GO Y2O3 and 5 GOY photoelectrodes under UV 17
illumination Insert Photocurrent responses of 5 GOY under different illumination 18
conditions Scan rate 50 mVs The electrolyte solution was 05 M NaCl 19
Figure 9 PL spectra of Y2O3 5 GOY and 20 GOY samples (λex = 258 nm) 20
Figure 10 Proposed mechanism for the photodegradation of MB on GOY composite21
Page 14 of 24Journal of Materials Chemistry A
Jour
nalo
fMat
eria
lsC
hem
istr
yA
Acc
epte
dM
anus
crip
t
Publ
ishe
d on
26
Mar
ch 2
014
Dow
nloa
ded
by N
atio
nal C
hung
Hsi
ng U
nive
rsity
on
120
420
14 1
036
16
View Article OnlineDOI 101039C4TA01057D
14
Figure 1 1
2
3
4
500 1000 1500 2000 2500 3000 3500 4000
1657
Tra
ns
mit
tan
ce
Wavenumber cm-1
1657
1550
1564 17211223
1436
1436
GO
Y2O
3
5GOY
5
6
Page 15 of 24 Journal of Materials Chemistry A
Jour
nalo
fMat
eria
lsC
hem
istr
yA
Acc
epte
dM
anus
crip
t
Publ
ishe
d on
26
Mar
ch 2
014
Dow
nloa
ded
by N
atio
nal C
hung
Hsi
ng U
nive
rsity
on
120
420
14 1
036
16
View Article OnlineDOI 101039C4TA01057D
15
Figure 2 1
2
3
10 20 30 40 50 60 70
5GOY2O
3
Inte
ns
ity
a
u
2degree
GO
Y2O
3
4
5
6
Page 16 of 24Journal of Materials Chemistry A
Jour
nalo
fMat
eria
lsC
hem
istr
yA
Acc
epte
dM
anus
crip
t
Publ
ishe
d on
26
Mar
ch 2
014
Dow
nloa
ded
by N
atio
nal C
hung
Hsi
ng U
nive
rsity
on
120
420
14 1
036
16
View Article OnlineDOI 101039C4TA01057D
16
Figure 3 1
2
0 100 200 300 400 500 60040
50
60
70
80
90
100
5GOY
Y2O
3
GO
We
igh
t
Temperature oC
3
4
Page 17 of 24 Journal of Materials Chemistry A
Jour
nalo
fMat
eria
lsC
hem
istr
yA
Acc
epte
dM
anus
crip
t
Publ
ishe
d on
26
Mar
ch 2
014
Dow
nloa
ded
by N
atio
nal C
hung
Hsi
ng U
nive
rsity
on
120
420
14 1
036
16
View Article OnlineDOI 101039C4TA01057D
17
Figure 4 1
2
3
4
5
6
7
8
9
10
11
12
13
14
15
16
17
18
19
20
21
22
23
24
25
26
27
28
29
30
31
32
33
34
35
36
37
38
39
40
41
Page 18 of 24Journal of Materials Chemistry A
Jour
nalo
fMat
eria
lsC
hem
istr
yA
Acc
epte
dM
anus
crip
t
Publ
ishe
d on
26
Mar
ch 2
014
Dow
nloa
ded
by N
atio
nal C
hung
Hsi
ng U
nive
rsity
on
120
420
14 1
036
16
View Article OnlineDOI 101039C4TA01057D
18
Figure 5 1
2
3
1200 1000 800 600 400 200 0
Y 3d
C 1s
20 GOY
5 GOY
Y2O
3
Inte
ns
ity
a
u
Binding Energy eV
GO
O 1s
A
150 155 160 165 170 175
Inte
ns
ity
a
u
Binding Energy eV
Y 3d32
BY 3d
52
4
5
6
526 528 530 532 534 536
Inte
ns
ity
a
u
Binding Energy eV
O 1sC
282 284 286 288 290 292
Inte
ns
ity
a
u
Binding Energy eV
C-C
C-OC=O O-C=O
DC 1s
7
8
Page 19 of 24 Journal of Materials Chemistry A
Jour
nalo
fMat
eria
lsC
hem
istr
yA
Acc
epte
dM
anus
crip
t
Publ
ishe
d on
26
Mar
ch 2
014
Dow
nloa
ded
by N
atio
nal C
hung
Hsi
ng U
nive
rsity
on
120
420
14 1
036
16
View Article OnlineDOI 101039C4TA01057D
19
1
Figure 6 2
3
00
02
04
06
08
10
12
Y2O
3
20GOY
50GOY
10GOY
5GOYCo
nv
ers
ion
Photocatalysts
MO
MB
GO
4
5
6
7
8
Page 20 of 24Journal of Materials Chemistry A
Jour
nalo
fMat
eria
lsC
hem
istr
yA
Acc
epte
dM
anus
crip
t
Publ
ishe
d on
26
Mar
ch 2
014
Dow
nloa
ded
by N
atio
nal C
hung
Hsi
ng U
nive
rsity
on
120
420
14 1
036
16
View Article OnlineDOI 101039C4TA01057D
20
Figure 7 1
2
-5 0 5 10 15 20 25 30 35 40060
070
080
090
Co
nv
ers
ion
Time min
5 mg
6 mg
7 mg
8 mg
9 mg
10 mg
A100
-5 0 5 10 15 20 25 30 35 40
060
070
080
090
Co
nv
ers
ion
Time min
200 mg L-1
225 mg L-1
250 mg L-1
275 mg L-1
300 mg L-1
B100
3
4
-5 0 5 10 15 20 25 30 35 40
110
050
060
070
080
090
Co
nv
ers
ion
Time min
pH 303
pH 418
pH 519
pH 630
100
C
5
6
7
8
9
Page 21 of 24 Journal of Materials Chemistry A
Jour
nalo
fMat
eria
lsC
hem
istr
yA
Acc
epte
dM
anus
crip
t
Publ
ishe
d on
26
Mar
ch 2
014
Dow
nloa
ded
by N
atio
nal C
hung
Hsi
ng U
nive
rsity
on
120
420
14 1
036
16
View Article OnlineDOI 101039C4TA01057D
21
1
2
Figure 8 3
4
5
6
7
02 00 -02 -04
0
5
10
15
20j
A
cm
-2
E V (vs SCE)
Y2O
3
GO
5GOY
02 01 00 -01 -02 -0300
05
10
15
20
25
30
35
j A
cm
-2
E V (vs SCE)
Uv
Vis
Dark
5GOY
Page 22 of 24Journal of Materials Chemistry A
Jour
nalo
fMat
eria
lsC
hem
istr
yA
Acc
epte
dM
anus
crip
t
Publ
ishe
d on
26
Mar
ch 2
014
Dow
nloa
ded
by N
atio
nal C
hung
Hsi
ng U
nive
rsity
on
120
420
14 1
036
16
View Article OnlineDOI 101039C4TA01057D
22
1
2
Figure 9 3
4
400 450 500 550 600 650 700 750 800
Inte
ns
ity
a
u
Wavelength nm
20 GOY
5 GOY
Y2O
3
5
6
7
Page 23 of 24 Journal of Materials Chemistry A
Jour
nalo
fMat
eria
lsC
hem
istr
yA
Acc
epte
dM
anus
crip
t
Publ
ishe
d on
26
Mar
ch 2
014
Dow
nloa
ded
by N
atio
nal C
hung
Hsi
ng U
nive
rsity
on
120
420
14 1
036
16
View Article OnlineDOI 101039C4TA01057D
23
1
Figure 10 2
3
4
5
6
Page 24 of 24Journal of Materials Chemistry A
Jour
nalo
fMat
eria
lsC
hem
istr
yA
Acc
epte
dM
anus
crip
t
Publ
ishe
d on
26
Mar
ch 2
014
Dow
nloa
ded
by N
atio
nal C
hung
Hsi
ng U
nive
rsity
on
120
420
14 1
036
16
View Article OnlineDOI 101039C4TA01057D
12
33 L Nan Y Kazumichi J Solid State Chem 2008 181 1738-1743 1
34 R Srinivasan N R Yogamalar J Elanchezhiyan R J Joseyphus A C Bose J Alloy 2
Compd 2010 496 472-477 3
35 S Somacescu J M C Moreno P Osiceanu B L Su V Parvulescu J Phys Chem C 4
2010 114 19365 5
36 J H Pan W I Lee Chem Mater 2006 18 847-853 6
37 Y Chen B H Song X S Tang L Lu J M Xue J Mater Chem 2012 22 7
17656-17662 8
38 J Xu Y Chang Y Zhang S Ma Y Qu C Xu Appl Surf Sci 2008 255 1996-1999 9
39 LP Zhu NC Bing LL Wang HY Jin GH Liao LJ Wang Dalton Trans 2012 41 10
2959-2965 11
40 Z Pei L Ding H Lin S Weng Z Zheng Y Hou P Liu J Mater Chem A 2013 1 12
10099-10102 13
41Y L Pan S Z Deng L Polavarapu N Y Gao P Y Yuan C H Sow Q H Xu 14
Langmuir 2012 28 12304-12310 15
42 P Rouffignac J S Park R G Gordon Chem Mater 2005 17 4808-4814 16
43 H Xu H Li C Wu J Chu Y Yan H Shu Z Gu J Hazard Mater 2008 153 17
877-880 18
44 T Andersen H K Haugen H Hotop J Phys Chem Ref Data 1999 28(6) 1511-1533 19
20
Page 13 of 24 Journal of Materials Chemistry A
Jour
nalo
fMat
eria
lsC
hem
istr
yA
Acc
epte
dM
anus
crip
t
Publ
ishe
d on
26
Mar
ch 2
014
Dow
nloa
ded
by N
atio
nal C
hung
Hsi
ng U
nive
rsity
on
120
420
14 1
036
16
View Article OnlineDOI 101039C4TA01057D
13
Figure captions 1
2
Figure 1 FT-IR spectra of GO Y2O3 and 5 GOY composites 3
Figure 2 XRD patterns of GO Y2O3 and 5 GOY composites 4
Figure 3 TGA curves of GO Y2O3 and 5 GOY composites 5
Figure 4 FESEM images of (A) Y2O3 (Insert low magnification) (B) GO (C) 5 GOY and 6
(D) 20 GOY composites (Insert EDS spectrum of 20 GOY sample) (E) and (F) 7
HRTEM images of 5 GOY taken after intense ultrasonic dispersion in ethanol for 30 8
min 9
Figure 5 XPS spectra (A) full survey spectra of GO Y2O3 and GOY nanocomposite (B) Y 10
3d of 5 GOY (C) O 1s of 5 GOY (D) C 1s of 5 GOY 11
Figure 6 Comparison of photodegradation efficiency using as-synthesized GO Y2O3 and 12
GOY composites 13
Figure 7 (A) Effect of dosage on MB conversion MB concentration 25 ppm pH = 41 (B) 14
Effect of MB concentration on the degradation Dosage 10 mg pH = 41 (C) Effect of 15
solution pH on MB conversion MB concentration 25 ppm Dosage 10 mg 16
Figure 8 Photocurrent responses of GO Y2O3 and 5 GOY photoelectrodes under UV 17
illumination Insert Photocurrent responses of 5 GOY under different illumination 18
conditions Scan rate 50 mVs The electrolyte solution was 05 M NaCl 19
Figure 9 PL spectra of Y2O3 5 GOY and 20 GOY samples (λex = 258 nm) 20
Figure 10 Proposed mechanism for the photodegradation of MB on GOY composite21
Page 14 of 24Journal of Materials Chemistry A
Jour
nalo
fMat
eria
lsC
hem
istr
yA
Acc
epte
dM
anus
crip
t
Publ
ishe
d on
26
Mar
ch 2
014
Dow
nloa
ded
by N
atio
nal C
hung
Hsi
ng U
nive
rsity
on
120
420
14 1
036
16
View Article OnlineDOI 101039C4TA01057D
14
Figure 1 1
2
3
4
500 1000 1500 2000 2500 3000 3500 4000
1657
Tra
ns
mit
tan
ce
Wavenumber cm-1
1657
1550
1564 17211223
1436
1436
GO
Y2O
3
5GOY
5
6
Page 15 of 24 Journal of Materials Chemistry A
Jour
nalo
fMat
eria
lsC
hem
istr
yA
Acc
epte
dM
anus
crip
t
Publ
ishe
d on
26
Mar
ch 2
014
Dow
nloa
ded
by N
atio
nal C
hung
Hsi
ng U
nive
rsity
on
120
420
14 1
036
16
View Article OnlineDOI 101039C4TA01057D
15
Figure 2 1
2
3
10 20 30 40 50 60 70
5GOY2O
3
Inte
ns
ity
a
u
2degree
GO
Y2O
3
4
5
6
Page 16 of 24Journal of Materials Chemistry A
Jour
nalo
fMat
eria
lsC
hem
istr
yA
Acc
epte
dM
anus
crip
t
Publ
ishe
d on
26
Mar
ch 2
014
Dow
nloa
ded
by N
atio
nal C
hung
Hsi
ng U
nive
rsity
on
120
420
14 1
036
16
View Article OnlineDOI 101039C4TA01057D
16
Figure 3 1
2
0 100 200 300 400 500 60040
50
60
70
80
90
100
5GOY
Y2O
3
GO
We
igh
t
Temperature oC
3
4
Page 17 of 24 Journal of Materials Chemistry A
Jour
nalo
fMat
eria
lsC
hem
istr
yA
Acc
epte
dM
anus
crip
t
Publ
ishe
d on
26
Mar
ch 2
014
Dow
nloa
ded
by N
atio
nal C
hung
Hsi
ng U
nive
rsity
on
120
420
14 1
036
16
View Article OnlineDOI 101039C4TA01057D
17
Figure 4 1
2
3
4
5
6
7
8
9
10
11
12
13
14
15
16
17
18
19
20
21
22
23
24
25
26
27
28
29
30
31
32
33
34
35
36
37
38
39
40
41
Page 18 of 24Journal of Materials Chemistry A
Jour
nalo
fMat
eria
lsC
hem
istr
yA
Acc
epte
dM
anus
crip
t
Publ
ishe
d on
26
Mar
ch 2
014
Dow
nloa
ded
by N
atio
nal C
hung
Hsi
ng U
nive
rsity
on
120
420
14 1
036
16
View Article OnlineDOI 101039C4TA01057D
18
Figure 5 1
2
3
1200 1000 800 600 400 200 0
Y 3d
C 1s
20 GOY
5 GOY
Y2O
3
Inte
ns
ity
a
u
Binding Energy eV
GO
O 1s
A
150 155 160 165 170 175
Inte
ns
ity
a
u
Binding Energy eV
Y 3d32
BY 3d
52
4
5
6
526 528 530 532 534 536
Inte
ns
ity
a
u
Binding Energy eV
O 1sC
282 284 286 288 290 292
Inte
ns
ity
a
u
Binding Energy eV
C-C
C-OC=O O-C=O
DC 1s
7
8
Page 19 of 24 Journal of Materials Chemistry A
Jour
nalo
fMat
eria
lsC
hem
istr
yA
Acc
epte
dM
anus
crip
t
Publ
ishe
d on
26
Mar
ch 2
014
Dow
nloa
ded
by N
atio
nal C
hung
Hsi
ng U
nive
rsity
on
120
420
14 1
036
16
View Article OnlineDOI 101039C4TA01057D
19
1
Figure 6 2
3
00
02
04
06
08
10
12
Y2O
3
20GOY
50GOY
10GOY
5GOYCo
nv
ers
ion
Photocatalysts
MO
MB
GO
4
5
6
7
8
Page 20 of 24Journal of Materials Chemistry A
Jour
nalo
fMat
eria
lsC
hem
istr
yA
Acc
epte
dM
anus
crip
t
Publ
ishe
d on
26
Mar
ch 2
014
Dow
nloa
ded
by N
atio
nal C
hung
Hsi
ng U
nive
rsity
on
120
420
14 1
036
16
View Article OnlineDOI 101039C4TA01057D
20
Figure 7 1
2
-5 0 5 10 15 20 25 30 35 40060
070
080
090
Co
nv
ers
ion
Time min
5 mg
6 mg
7 mg
8 mg
9 mg
10 mg
A100
-5 0 5 10 15 20 25 30 35 40
060
070
080
090
Co
nv
ers
ion
Time min
200 mg L-1
225 mg L-1
250 mg L-1
275 mg L-1
300 mg L-1
B100
3
4
-5 0 5 10 15 20 25 30 35 40
110
050
060
070
080
090
Co
nv
ers
ion
Time min
pH 303
pH 418
pH 519
pH 630
100
C
5
6
7
8
9
Page 21 of 24 Journal of Materials Chemistry A
Jour
nalo
fMat
eria
lsC
hem
istr
yA
Acc
epte
dM
anus
crip
t
Publ
ishe
d on
26
Mar
ch 2
014
Dow
nloa
ded
by N
atio
nal C
hung
Hsi
ng U
nive
rsity
on
120
420
14 1
036
16
View Article OnlineDOI 101039C4TA01057D
21
1
2
Figure 8 3
4
5
6
7
02 00 -02 -04
0
5
10
15
20j
A
cm
-2
E V (vs SCE)
Y2O
3
GO
5GOY
02 01 00 -01 -02 -0300
05
10
15
20
25
30
35
j A
cm
-2
E V (vs SCE)
Uv
Vis
Dark
5GOY
Page 22 of 24Journal of Materials Chemistry A
Jour
nalo
fMat
eria
lsC
hem
istr
yA
Acc
epte
dM
anus
crip
t
Publ
ishe
d on
26
Mar
ch 2
014
Dow
nloa
ded
by N
atio
nal C
hung
Hsi
ng U
nive
rsity
on
120
420
14 1
036
16
View Article OnlineDOI 101039C4TA01057D
22
1
2
Figure 9 3
4
400 450 500 550 600 650 700 750 800
Inte
ns
ity
a
u
Wavelength nm
20 GOY
5 GOY
Y2O
3
5
6
7
Page 23 of 24 Journal of Materials Chemistry A
Jour
nalo
fMat
eria
lsC
hem
istr
yA
Acc
epte
dM
anus
crip
t
Publ
ishe
d on
26
Mar
ch 2
014
Dow
nloa
ded
by N
atio
nal C
hung
Hsi
ng U
nive
rsity
on
120
420
14 1
036
16
View Article OnlineDOI 101039C4TA01057D
23
1
Figure 10 2
3
4
5
6
Page 24 of 24Journal of Materials Chemistry A
Jour
nalo
fMat
eria
lsC
hem
istr
yA
Acc
epte
dM
anus
crip
t
Publ
ishe
d on
26
Mar
ch 2
014
Dow
nloa
ded
by N
atio
nal C
hung
Hsi
ng U
nive
rsity
on
120
420
14 1
036
16
View Article OnlineDOI 101039C4TA01057D
13
Figure captions 1
2
Figure 1 FT-IR spectra of GO Y2O3 and 5 GOY composites 3
Figure 2 XRD patterns of GO Y2O3 and 5 GOY composites 4
Figure 3 TGA curves of GO Y2O3 and 5 GOY composites 5
Figure 4 FESEM images of (A) Y2O3 (Insert low magnification) (B) GO (C) 5 GOY and 6
(D) 20 GOY composites (Insert EDS spectrum of 20 GOY sample) (E) and (F) 7
HRTEM images of 5 GOY taken after intense ultrasonic dispersion in ethanol for 30 8
min 9
Figure 5 XPS spectra (A) full survey spectra of GO Y2O3 and GOY nanocomposite (B) Y 10
3d of 5 GOY (C) O 1s of 5 GOY (D) C 1s of 5 GOY 11
Figure 6 Comparison of photodegradation efficiency using as-synthesized GO Y2O3 and 12
GOY composites 13
Figure 7 (A) Effect of dosage on MB conversion MB concentration 25 ppm pH = 41 (B) 14
Effect of MB concentration on the degradation Dosage 10 mg pH = 41 (C) Effect of 15
solution pH on MB conversion MB concentration 25 ppm Dosage 10 mg 16
Figure 8 Photocurrent responses of GO Y2O3 and 5 GOY photoelectrodes under UV 17
illumination Insert Photocurrent responses of 5 GOY under different illumination 18
conditions Scan rate 50 mVs The electrolyte solution was 05 M NaCl 19
Figure 9 PL spectra of Y2O3 5 GOY and 20 GOY samples (λex = 258 nm) 20
Figure 10 Proposed mechanism for the photodegradation of MB on GOY composite21
Page 14 of 24Journal of Materials Chemistry A
Jour
nalo
fMat
eria
lsC
hem
istr
yA
Acc
epte
dM
anus
crip
t
Publ
ishe
d on
26
Mar
ch 2
014
Dow
nloa
ded
by N
atio
nal C
hung
Hsi
ng U
nive
rsity
on
120
420
14 1
036
16
View Article OnlineDOI 101039C4TA01057D
14
Figure 1 1
2
3
4
500 1000 1500 2000 2500 3000 3500 4000
1657
Tra
ns
mit
tan
ce
Wavenumber cm-1
1657
1550
1564 17211223
1436
1436
GO
Y2O
3
5GOY
5
6
Page 15 of 24 Journal of Materials Chemistry A
Jour
nalo
fMat
eria
lsC
hem
istr
yA
Acc
epte
dM
anus
crip
t
Publ
ishe
d on
26
Mar
ch 2
014
Dow
nloa
ded
by N
atio
nal C
hung
Hsi
ng U
nive
rsity
on
120
420
14 1
036
16
View Article OnlineDOI 101039C4TA01057D
15
Figure 2 1
2
3
10 20 30 40 50 60 70
5GOY2O
3
Inte
ns
ity
a
u
2degree
GO
Y2O
3
4
5
6
Page 16 of 24Journal of Materials Chemistry A
Jour
nalo
fMat
eria
lsC
hem
istr
yA
Acc
epte
dM
anus
crip
t
Publ
ishe
d on
26
Mar
ch 2
014
Dow
nloa
ded
by N
atio
nal C
hung
Hsi
ng U
nive
rsity
on
120
420
14 1
036
16
View Article OnlineDOI 101039C4TA01057D
16
Figure 3 1
2
0 100 200 300 400 500 60040
50
60
70
80
90
100
5GOY
Y2O
3
GO
We
igh
t
Temperature oC
3
4
Page 17 of 24 Journal of Materials Chemistry A
Jour
nalo
fMat
eria
lsC
hem
istr
yA
Acc
epte
dM
anus
crip
t
Publ
ishe
d on
26
Mar
ch 2
014
Dow
nloa
ded
by N
atio
nal C
hung
Hsi
ng U
nive
rsity
on
120
420
14 1
036
16
View Article OnlineDOI 101039C4TA01057D
17
Figure 4 1
2
3
4
5
6
7
8
9
10
11
12
13
14
15
16
17
18
19
20
21
22
23
24
25
26
27
28
29
30
31
32
33
34
35
36
37
38
39
40
41
Page 18 of 24Journal of Materials Chemistry A
Jour
nalo
fMat
eria
lsC
hem
istr
yA
Acc
epte
dM
anus
crip
t
Publ
ishe
d on
26
Mar
ch 2
014
Dow
nloa
ded
by N
atio
nal C
hung
Hsi
ng U
nive
rsity
on
120
420
14 1
036
16
View Article OnlineDOI 101039C4TA01057D
18
Figure 5 1
2
3
1200 1000 800 600 400 200 0
Y 3d
C 1s
20 GOY
5 GOY
Y2O
3
Inte
ns
ity
a
u
Binding Energy eV
GO
O 1s
A
150 155 160 165 170 175
Inte
ns
ity
a
u
Binding Energy eV
Y 3d32
BY 3d
52
4
5
6
526 528 530 532 534 536
Inte
ns
ity
a
u
Binding Energy eV
O 1sC
282 284 286 288 290 292
Inte
ns
ity
a
u
Binding Energy eV
C-C
C-OC=O O-C=O
DC 1s
7
8
Page 19 of 24 Journal of Materials Chemistry A
Jour
nalo
fMat
eria
lsC
hem
istr
yA
Acc
epte
dM
anus
crip
t
Publ
ishe
d on
26
Mar
ch 2
014
Dow
nloa
ded
by N
atio
nal C
hung
Hsi
ng U
nive
rsity
on
120
420
14 1
036
16
View Article OnlineDOI 101039C4TA01057D
19
1
Figure 6 2
3
00
02
04
06
08
10
12
Y2O
3
20GOY
50GOY
10GOY
5GOYCo
nv
ers
ion
Photocatalysts
MO
MB
GO
4
5
6
7
8
Page 20 of 24Journal of Materials Chemistry A
Jour
nalo
fMat
eria
lsC
hem
istr
yA
Acc
epte
dM
anus
crip
t
Publ
ishe
d on
26
Mar
ch 2
014
Dow
nloa
ded
by N
atio
nal C
hung
Hsi
ng U
nive
rsity
on
120
420
14 1
036
16
View Article OnlineDOI 101039C4TA01057D
20
Figure 7 1
2
-5 0 5 10 15 20 25 30 35 40060
070
080
090
Co
nv
ers
ion
Time min
5 mg
6 mg
7 mg
8 mg
9 mg
10 mg
A100
-5 0 5 10 15 20 25 30 35 40
060
070
080
090
Co
nv
ers
ion
Time min
200 mg L-1
225 mg L-1
250 mg L-1
275 mg L-1
300 mg L-1
B100
3
4
-5 0 5 10 15 20 25 30 35 40
110
050
060
070
080
090
Co
nv
ers
ion
Time min
pH 303
pH 418
pH 519
pH 630
100
C
5
6
7
8
9
Page 21 of 24 Journal of Materials Chemistry A
Jour
nalo
fMat
eria
lsC
hem
istr
yA
Acc
epte
dM
anus
crip
t
Publ
ishe
d on
26
Mar
ch 2
014
Dow
nloa
ded
by N
atio
nal C
hung
Hsi
ng U
nive
rsity
on
120
420
14 1
036
16
View Article OnlineDOI 101039C4TA01057D
21
1
2
Figure 8 3
4
5
6
7
02 00 -02 -04
0
5
10
15
20j
A
cm
-2
E V (vs SCE)
Y2O
3
GO
5GOY
02 01 00 -01 -02 -0300
05
10
15
20
25
30
35
j A
cm
-2
E V (vs SCE)
Uv
Vis
Dark
5GOY
Page 22 of 24Journal of Materials Chemistry A
Jour
nalo
fMat
eria
lsC
hem
istr
yA
Acc
epte
dM
anus
crip
t
Publ
ishe
d on
26
Mar
ch 2
014
Dow
nloa
ded
by N
atio
nal C
hung
Hsi
ng U
nive
rsity
on
120
420
14 1
036
16
View Article OnlineDOI 101039C4TA01057D
22
1
2
Figure 9 3
4
400 450 500 550 600 650 700 750 800
Inte
ns
ity
a
u
Wavelength nm
20 GOY
5 GOY
Y2O
3
5
6
7
Page 23 of 24 Journal of Materials Chemistry A
Jour
nalo
fMat
eria
lsC
hem
istr
yA
Acc
epte
dM
anus
crip
t
Publ
ishe
d on
26
Mar
ch 2
014
Dow
nloa
ded
by N
atio
nal C
hung
Hsi
ng U
nive
rsity
on
120
420
14 1
036
16
View Article OnlineDOI 101039C4TA01057D
23
1
Figure 10 2
3
4
5
6
Page 24 of 24Journal of Materials Chemistry A
Jour
nalo
fMat
eria
lsC
hem
istr
yA
Acc
epte
dM
anus
crip
t
Publ
ishe
d on
26
Mar
ch 2
014
Dow
nloa
ded
by N
atio
nal C
hung
Hsi
ng U
nive
rsity
on
120
420
14 1
036
16
View Article OnlineDOI 101039C4TA01057D
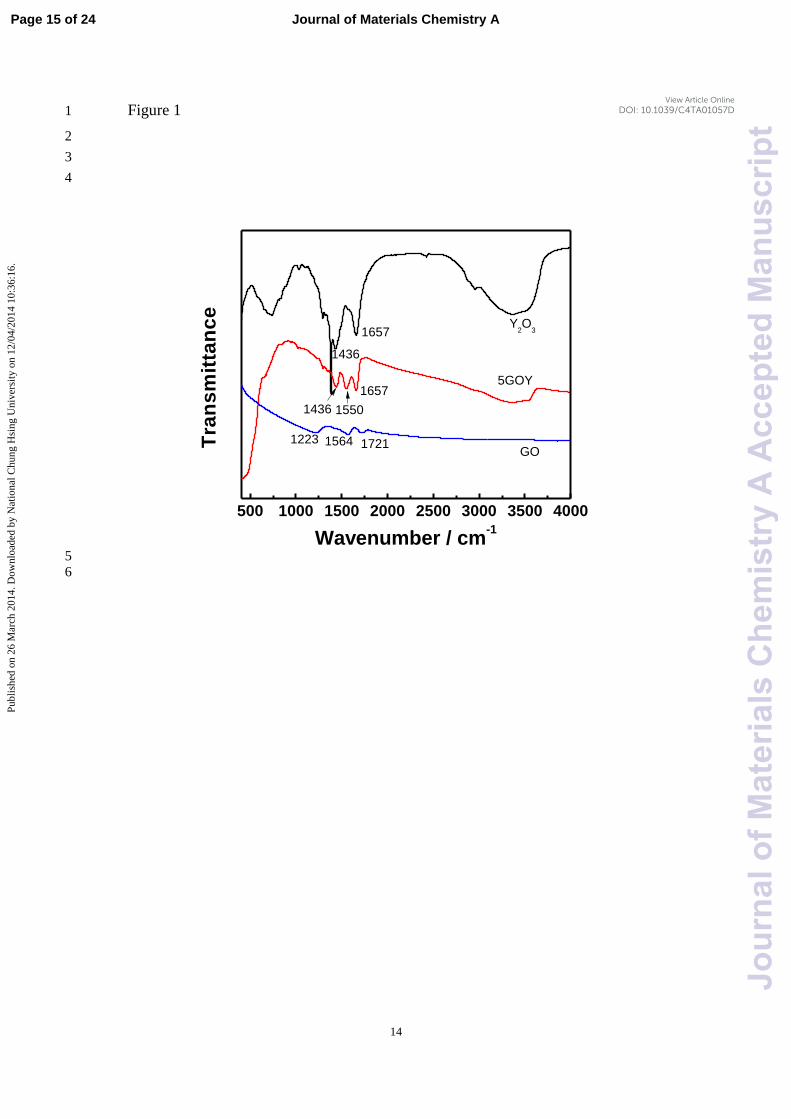
14
Figure 1 1
2
3
4
500 1000 1500 2000 2500 3000 3500 4000
1657
Tra
ns
mit
tan
ce
Wavenumber cm-1
1657
1550
1564 17211223
1436
1436
GO
Y2O
3
5GOY
5
6
Page 15 of 24 Journal of Materials Chemistry A
Jour
nalo
fMat
eria
lsC
hem
istr
yA
Acc
epte
dM
anus
crip
t
Publ
ishe
d on
26
Mar
ch 2
014
Dow
nloa
ded
by N
atio
nal C
hung
Hsi
ng U
nive
rsity
on
120
420
14 1
036
16
View Article OnlineDOI 101039C4TA01057D
15
Figure 2 1
2
3
10 20 30 40 50 60 70
5GOY2O
3
Inte
ns
ity
a
u
2degree
GO
Y2O
3
4
5
6
Page 16 of 24Journal of Materials Chemistry A
Jour
nalo
fMat
eria
lsC
hem
istr
yA
Acc
epte
dM
anus
crip
t
Publ
ishe
d on
26
Mar
ch 2
014
Dow
nloa
ded
by N
atio
nal C
hung
Hsi
ng U
nive
rsity
on
120
420
14 1
036
16
View Article OnlineDOI 101039C4TA01057D
16
Figure 3 1
2
0 100 200 300 400 500 60040
50
60
70
80
90
100
5GOY
Y2O
3
GO
We
igh
t
Temperature oC
3
4
Page 17 of 24 Journal of Materials Chemistry A
Jour
nalo
fMat
eria
lsC
hem
istr
yA
Acc
epte
dM
anus
crip
t
Publ
ishe
d on
26
Mar
ch 2
014
Dow
nloa
ded
by N
atio
nal C
hung
Hsi
ng U
nive
rsity
on
120
420
14 1
036
16
View Article OnlineDOI 101039C4TA01057D
17
Figure 4 1
2
3
4
5
6
7
8
9
10
11
12
13
14
15
16
17
18
19
20
21
22
23
24
25
26
27
28
29
30
31
32
33
34
35
36
37
38
39
40
41
Page 18 of 24Journal of Materials Chemistry A
Jour
nalo
fMat
eria
lsC
hem
istr
yA
Acc
epte
dM
anus
crip
t
Publ
ishe
d on
26
Mar
ch 2
014
Dow
nloa
ded
by N
atio
nal C
hung
Hsi
ng U
nive
rsity
on
120
420
14 1
036
16
View Article OnlineDOI 101039C4TA01057D
18
Figure 5 1
2
3
1200 1000 800 600 400 200 0
Y 3d
C 1s
20 GOY
5 GOY
Y2O
3
Inte
ns
ity
a
u
Binding Energy eV
GO
O 1s
A
150 155 160 165 170 175
Inte
ns
ity
a
u
Binding Energy eV
Y 3d32
BY 3d
52
4
5
6
526 528 530 532 534 536
Inte
ns
ity
a
u
Binding Energy eV
O 1sC
282 284 286 288 290 292
Inte
ns
ity
a
u
Binding Energy eV
C-C
C-OC=O O-C=O
DC 1s
7
8
Page 19 of 24 Journal of Materials Chemistry A
Jour
nalo
fMat
eria
lsC
hem
istr
yA
Acc
epte
dM
anus
crip
t
Publ
ishe
d on
26
Mar
ch 2
014
Dow
nloa
ded
by N
atio
nal C
hung
Hsi
ng U
nive
rsity
on
120
420
14 1
036
16
View Article OnlineDOI 101039C4TA01057D
19
1
Figure 6 2
3
00
02
04
06
08
10
12
Y2O
3
20GOY
50GOY
10GOY
5GOYCo
nv
ers
ion
Photocatalysts
MO
MB
GO
4
5
6
7
8
Page 20 of 24Journal of Materials Chemistry A
Jour
nalo
fMat
eria
lsC
hem
istr
yA
Acc
epte
dM
anus
crip
t
Publ
ishe
d on
26
Mar
ch 2
014
Dow
nloa
ded
by N
atio
nal C
hung
Hsi
ng U
nive
rsity
on
120
420
14 1
036
16
View Article OnlineDOI 101039C4TA01057D
20
Figure 7 1
2
-5 0 5 10 15 20 25 30 35 40060
070
080
090
Co
nv
ers
ion
Time min
5 mg
6 mg
7 mg
8 mg
9 mg
10 mg
A100
-5 0 5 10 15 20 25 30 35 40
060
070
080
090
Co
nv
ers
ion
Time min
200 mg L-1
225 mg L-1
250 mg L-1
275 mg L-1
300 mg L-1
B100
3
4
-5 0 5 10 15 20 25 30 35 40
110
050
060
070
080
090
Co
nv
ers
ion
Time min
pH 303
pH 418
pH 519
pH 630
100
C
5
6
7
8
9
Page 21 of 24 Journal of Materials Chemistry A
Jour
nalo
fMat
eria
lsC
hem
istr
yA
Acc
epte
dM
anus
crip
t
Publ
ishe
d on
26
Mar
ch 2
014
Dow
nloa
ded
by N
atio
nal C
hung
Hsi
ng U
nive
rsity
on
120
420
14 1
036
16
View Article OnlineDOI 101039C4TA01057D
21
1
2
Figure 8 3
4
5
6
7
02 00 -02 -04
0
5
10
15
20j
A
cm
-2
E V (vs SCE)
Y2O
3
GO
5GOY
02 01 00 -01 -02 -0300
05
10
15
20
25
30
35
j A
cm
-2
E V (vs SCE)
Uv
Vis
Dark
5GOY
Page 22 of 24Journal of Materials Chemistry A
Jour
nalo
fMat
eria
lsC
hem
istr
yA
Acc
epte
dM
anus
crip
t
Publ
ishe
d on
26
Mar
ch 2
014
Dow
nloa
ded
by N
atio
nal C
hung
Hsi
ng U
nive
rsity
on
120
420
14 1
036
16
View Article OnlineDOI 101039C4TA01057D
22
1
2
Figure 9 3
4
400 450 500 550 600 650 700 750 800
Inte
ns
ity
a
u
Wavelength nm
20 GOY
5 GOY
Y2O
3
5
6
7
Page 23 of 24 Journal of Materials Chemistry A
Jour
nalo
fMat
eria
lsC
hem
istr
yA
Acc
epte
dM
anus
crip
t
Publ
ishe
d on
26
Mar
ch 2
014
Dow
nloa
ded
by N
atio
nal C
hung
Hsi
ng U
nive
rsity
on
120
420
14 1
036
16
View Article OnlineDOI 101039C4TA01057D
23
1
Figure 10 2
3
4
5
6
Page 24 of 24Journal of Materials Chemistry A
Jour
nalo
fMat
eria
lsC
hem
istr
yA
Acc
epte
dM
anus
crip
t
Publ
ishe
d on
26
Mar
ch 2
014
Dow
nloa
ded
by N
atio
nal C
hung
Hsi
ng U
nive
rsity
on
120
420
14 1
036
16
View Article OnlineDOI 101039C4TA01057D
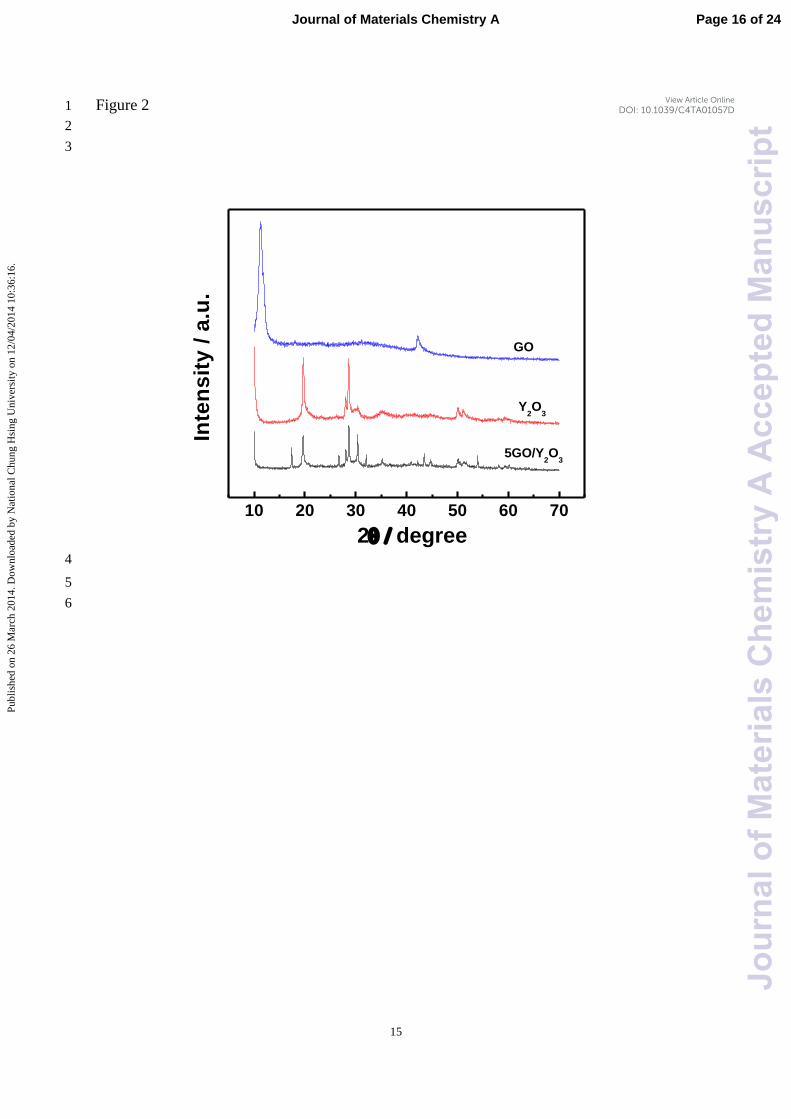
15
Figure 2 1
2
3
10 20 30 40 50 60 70
5GOY2O
3
Inte
ns
ity
a
u
2degree
GO
Y2O
3
4
5
6
Page 16 of 24Journal of Materials Chemistry A
Jour
nalo
fMat
eria
lsC
hem
istr
yA
Acc
epte
dM
anus
crip
t
Publ
ishe
d on
26
Mar
ch 2
014
Dow
nloa
ded
by N
atio
nal C
hung
Hsi
ng U
nive
rsity
on
120
420
14 1
036
16
View Article OnlineDOI 101039C4TA01057D
16
Figure 3 1
2
0 100 200 300 400 500 60040
50
60
70
80
90
100
5GOY
Y2O
3
GO
We
igh
t
Temperature oC
3
4
Page 17 of 24 Journal of Materials Chemistry A
Jour
nalo
fMat
eria
lsC
hem
istr
yA
Acc
epte
dM
anus
crip
t
Publ
ishe
d on
26
Mar
ch 2
014
Dow
nloa
ded
by N
atio
nal C
hung
Hsi
ng U
nive
rsity
on
120
420
14 1
036
16
View Article OnlineDOI 101039C4TA01057D
17
Figure 4 1
2
3
4
5
6
7
8
9
10
11
12
13
14
15
16
17
18
19
20
21
22
23
24
25
26
27
28
29
30
31
32
33
34
35
36
37
38
39
40
41
Page 18 of 24Journal of Materials Chemistry A
Jour
nalo
fMat
eria
lsC
hem
istr
yA
Acc
epte
dM
anus
crip
t
Publ
ishe
d on
26
Mar
ch 2
014
Dow
nloa
ded
by N
atio
nal C
hung
Hsi
ng U
nive
rsity
on
120
420
14 1
036
16
View Article OnlineDOI 101039C4TA01057D
18
Figure 5 1
2
3
1200 1000 800 600 400 200 0
Y 3d
C 1s
20 GOY
5 GOY
Y2O
3
Inte
ns
ity
a
u
Binding Energy eV
GO
O 1s
A
150 155 160 165 170 175
Inte
ns
ity
a
u
Binding Energy eV
Y 3d32
BY 3d
52
4
5
6
526 528 530 532 534 536
Inte
ns
ity
a
u
Binding Energy eV
O 1sC
282 284 286 288 290 292
Inte
ns
ity
a
u
Binding Energy eV
C-C
C-OC=O O-C=O
DC 1s
7
8
Page 19 of 24 Journal of Materials Chemistry A
Jour
nalo
fMat
eria
lsC
hem
istr
yA
Acc
epte
dM
anus
crip
t
Publ
ishe
d on
26
Mar
ch 2
014
Dow
nloa
ded
by N
atio
nal C
hung
Hsi
ng U
nive
rsity
on
120
420
14 1
036
16
View Article OnlineDOI 101039C4TA01057D
19
1
Figure 6 2
3
00
02
04
06
08
10
12
Y2O
3
20GOY
50GOY
10GOY
5GOYCo
nv
ers
ion
Photocatalysts
MO
MB
GO
4
5
6
7
8
Page 20 of 24Journal of Materials Chemistry A
Jour
nalo
fMat
eria
lsC
hem
istr
yA
Acc
epte
dM
anus
crip
t
Publ
ishe
d on
26
Mar
ch 2
014
Dow
nloa
ded
by N
atio
nal C
hung
Hsi
ng U
nive
rsity
on
120
420
14 1
036
16
View Article OnlineDOI 101039C4TA01057D
20
Figure 7 1
2
-5 0 5 10 15 20 25 30 35 40060
070
080
090
Co
nv
ers
ion
Time min
5 mg
6 mg
7 mg
8 mg
9 mg
10 mg
A100
-5 0 5 10 15 20 25 30 35 40
060
070
080
090
Co
nv
ers
ion
Time min
200 mg L-1
225 mg L-1
250 mg L-1
275 mg L-1
300 mg L-1
B100
3
4
-5 0 5 10 15 20 25 30 35 40
110
050
060
070
080
090
Co
nv
ers
ion
Time min
pH 303
pH 418
pH 519
pH 630
100
C
5
6
7
8
9
Page 21 of 24 Journal of Materials Chemistry A
Jour
nalo
fMat
eria
lsC
hem
istr
yA
Acc
epte
dM
anus
crip
t
Publ
ishe
d on
26
Mar
ch 2
014
Dow
nloa
ded
by N
atio
nal C
hung
Hsi
ng U
nive
rsity
on
120
420
14 1
036
16
View Article OnlineDOI 101039C4TA01057D
21
1
2
Figure 8 3
4
5
6
7
02 00 -02 -04
0
5
10
15
20j
A
cm
-2
E V (vs SCE)
Y2O
3
GO
5GOY
02 01 00 -01 -02 -0300
05
10
15
20
25
30
35
j A
cm
-2
E V (vs SCE)
Uv
Vis
Dark
5GOY
Page 22 of 24Journal of Materials Chemistry A
Jour
nalo
fMat
eria
lsC
hem
istr
yA
Acc
epte
dM
anus
crip
t
Publ
ishe
d on
26
Mar
ch 2
014
Dow
nloa
ded
by N
atio
nal C
hung
Hsi
ng U
nive
rsity
on
120
420
14 1
036
16
View Article OnlineDOI 101039C4TA01057D
22
1
2
Figure 9 3
4
400 450 500 550 600 650 700 750 800
Inte
ns
ity
a
u
Wavelength nm
20 GOY
5 GOY
Y2O
3
5
6
7
Page 23 of 24 Journal of Materials Chemistry A
Jour
nalo
fMat
eria
lsC
hem
istr
yA
Acc
epte
dM
anus
crip
t
Publ
ishe
d on
26
Mar
ch 2
014
Dow
nloa
ded
by N
atio
nal C
hung
Hsi
ng U
nive
rsity
on
120
420
14 1
036
16
View Article OnlineDOI 101039C4TA01057D
23
1
Figure 10 2
3
4
5
6
Page 24 of 24Journal of Materials Chemistry A
Jour
nalo
fMat
eria
lsC
hem
istr
yA
Acc
epte
dM
anus
crip
t
Publ
ishe
d on
26
Mar
ch 2
014
Dow
nloa
ded
by N
atio
nal C
hung
Hsi
ng U
nive
rsity
on
120
420
14 1
036
16
View Article OnlineDOI 101039C4TA01057D
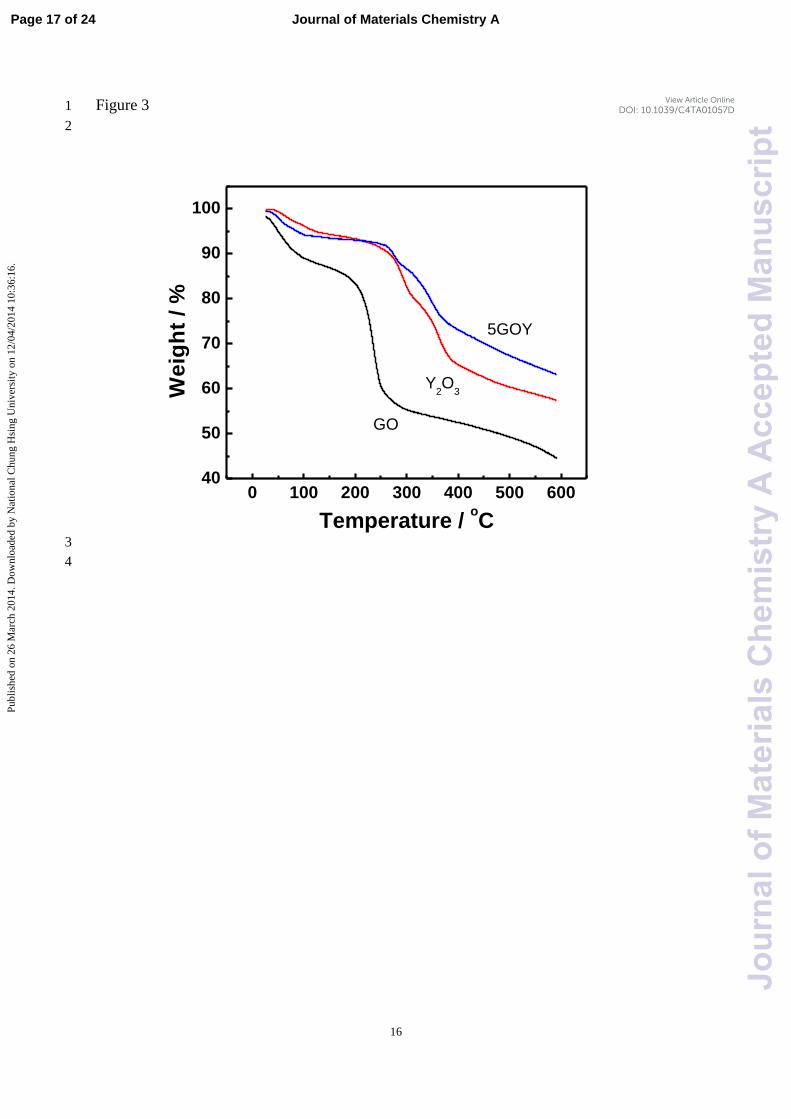
16
Figure 3 1
2
0 100 200 300 400 500 60040
50
60
70
80
90
100
5GOY
Y2O
3
GO
We
igh
t
Temperature oC
3
4
Page 17 of 24 Journal of Materials Chemistry A
Jour
nalo
fMat
eria
lsC
hem
istr
yA
Acc
epte
dM
anus
crip
t
Publ
ishe
d on
26
Mar
ch 2
014
Dow
nloa
ded
by N
atio
nal C
hung
Hsi
ng U
nive
rsity
on
120
420
14 1
036
16
View Article OnlineDOI 101039C4TA01057D
17
Figure 4 1
2
3
4
5
6
7
8
9
10
11
12
13
14
15
16
17
18
19
20
21
22
23
24
25
26
27
28
29
30
31
32
33
34
35
36
37
38
39
40
41
Page 18 of 24Journal of Materials Chemistry A
Jour
nalo
fMat
eria
lsC
hem
istr
yA
Acc
epte
dM
anus
crip
t
Publ
ishe
d on
26
Mar
ch 2
014
Dow
nloa
ded
by N
atio
nal C
hung
Hsi
ng U
nive
rsity
on
120
420
14 1
036
16
View Article OnlineDOI 101039C4TA01057D
18
Figure 5 1
2
3
1200 1000 800 600 400 200 0
Y 3d
C 1s
20 GOY
5 GOY
Y2O
3
Inte
ns
ity
a
u
Binding Energy eV
GO
O 1s
A
150 155 160 165 170 175
Inte
ns
ity
a
u
Binding Energy eV
Y 3d32
BY 3d
52
4
5
6
526 528 530 532 534 536
Inte
ns
ity
a
u
Binding Energy eV
O 1sC
282 284 286 288 290 292
Inte
ns
ity
a
u
Binding Energy eV
C-C
C-OC=O O-C=O
DC 1s
7
8
Page 19 of 24 Journal of Materials Chemistry A
Jour
nalo
fMat
eria
lsC
hem
istr
yA
Acc
epte
dM
anus
crip
t
Publ
ishe
d on
26
Mar
ch 2
014
Dow
nloa
ded
by N
atio
nal C
hung
Hsi
ng U
nive
rsity
on
120
420
14 1
036
16
View Article OnlineDOI 101039C4TA01057D
19
1
Figure 6 2
3
00
02
04
06
08
10
12
Y2O
3
20GOY
50GOY
10GOY
5GOYCo
nv
ers
ion
Photocatalysts
MO
MB
GO
4
5
6
7
8
Page 20 of 24Journal of Materials Chemistry A
Jour
nalo
fMat
eria
lsC
hem
istr
yA
Acc
epte
dM
anus
crip
t
Publ
ishe
d on
26
Mar
ch 2
014
Dow
nloa
ded
by N
atio
nal C
hung
Hsi
ng U
nive
rsity
on
120
420
14 1
036
16
View Article OnlineDOI 101039C4TA01057D
20
Figure 7 1
2
-5 0 5 10 15 20 25 30 35 40060
070
080
090
Co
nv
ers
ion
Time min
5 mg
6 mg
7 mg
8 mg
9 mg
10 mg
A100
-5 0 5 10 15 20 25 30 35 40
060
070
080
090
Co
nv
ers
ion
Time min
200 mg L-1
225 mg L-1
250 mg L-1
275 mg L-1
300 mg L-1
B100
3
4
-5 0 5 10 15 20 25 30 35 40
110
050
060
070
080
090
Co
nv
ers
ion
Time min
pH 303
pH 418
pH 519
pH 630
100
C
5
6
7
8
9
Page 21 of 24 Journal of Materials Chemistry A
Jour
nalo
fMat
eria
lsC
hem
istr
yA
Acc
epte
dM
anus
crip
t
Publ
ishe
d on
26
Mar
ch 2
014
Dow
nloa
ded
by N
atio
nal C
hung
Hsi
ng U
nive
rsity
on
120
420
14 1
036
16
View Article OnlineDOI 101039C4TA01057D
21
1
2
Figure 8 3
4
5
6
7
02 00 -02 -04
0
5
10
15
20j
A
cm
-2
E V (vs SCE)
Y2O
3
GO
5GOY
02 01 00 -01 -02 -0300
05
10
15
20
25
30
35
j A
cm
-2
E V (vs SCE)
Uv
Vis
Dark
5GOY
Page 22 of 24Journal of Materials Chemistry A
Jour
nalo
fMat
eria
lsC
hem
istr
yA
Acc
epte
dM
anus
crip
t
Publ
ishe
d on
26
Mar
ch 2
014
Dow
nloa
ded
by N
atio
nal C
hung
Hsi
ng U
nive
rsity
on
120
420
14 1
036
16
View Article OnlineDOI 101039C4TA01057D
22
1
2
Figure 9 3
4
400 450 500 550 600 650 700 750 800
Inte
ns
ity
a
u
Wavelength nm
20 GOY
5 GOY
Y2O
3
5
6
7
Page 23 of 24 Journal of Materials Chemistry A
Jour
nalo
fMat
eria
lsC
hem
istr
yA
Acc
epte
dM
anus
crip
t
Publ
ishe
d on
26
Mar
ch 2
014
Dow
nloa
ded
by N
atio
nal C
hung
Hsi
ng U
nive
rsity
on
120
420
14 1
036
16
View Article OnlineDOI 101039C4TA01057D
23
1
Figure 10 2
3
4
5
6
Page 24 of 24Journal of Materials Chemistry A
Jour
nalo
fMat
eria
lsC
hem
istr
yA
Acc
epte
dM
anus
crip
t
Publ
ishe
d on
26
Mar
ch 2
014
Dow
nloa
ded
by N
atio
nal C
hung
Hsi
ng U
nive
rsity
on
120
420
14 1
036
16
View Article OnlineDOI 101039C4TA01057D
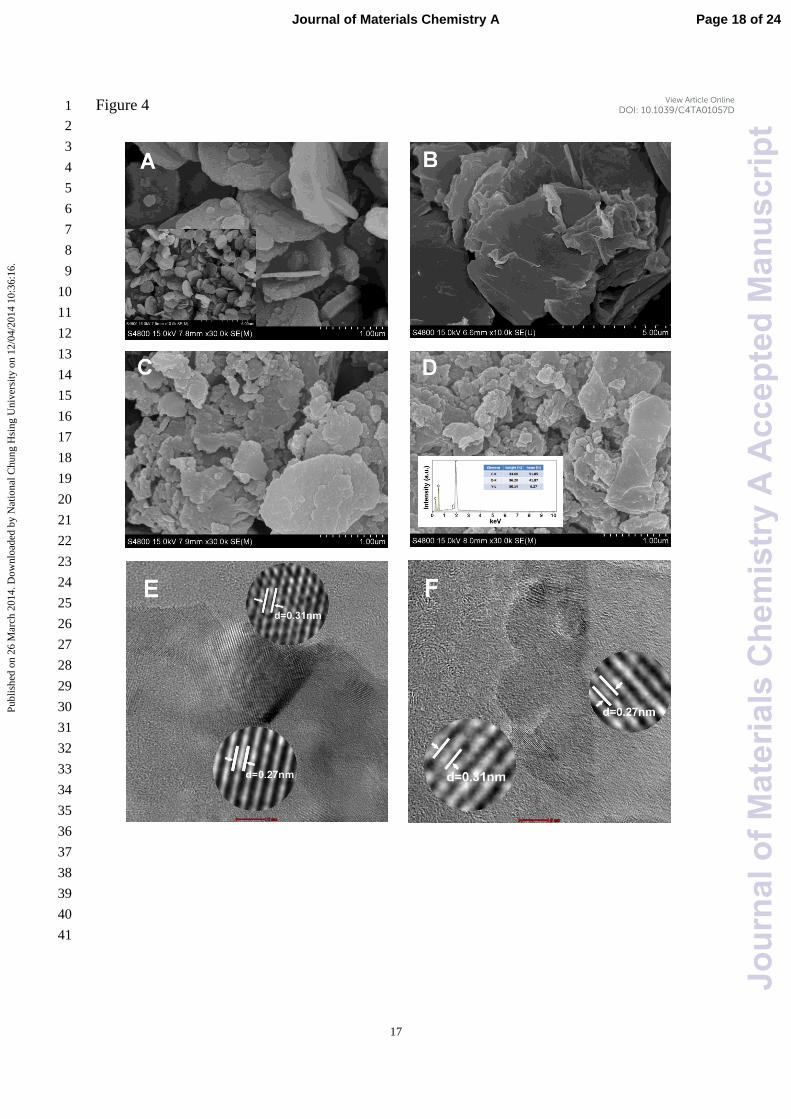
17
Figure 4 1
2
3
4
5
6
7
8
9
10
11
12
13
14
15
16
17
18
19
20
21
22
23
24
25
26
27
28
29
30
31
32
33
34
35
36
37
38
39
40
41
Page 18 of 24Journal of Materials Chemistry A
Jour
nalo
fMat
eria
lsC
hem
istr
yA
Acc
epte
dM
anus
crip
t
Publ
ishe
d on
26
Mar
ch 2
014
Dow
nloa
ded
by N
atio
nal C
hung
Hsi
ng U
nive
rsity
on
120
420
14 1
036
16
View Article OnlineDOI 101039C4TA01057D
18
Figure 5 1
2
3
1200 1000 800 600 400 200 0
Y 3d
C 1s
20 GOY
5 GOY
Y2O
3
Inte
ns
ity
a
u
Binding Energy eV
GO
O 1s
A
150 155 160 165 170 175
Inte
ns
ity
a
u
Binding Energy eV
Y 3d32
BY 3d
52
4
5
6
526 528 530 532 534 536
Inte
ns
ity
a
u
Binding Energy eV
O 1sC
282 284 286 288 290 292
Inte
ns
ity
a
u
Binding Energy eV
C-C
C-OC=O O-C=O
DC 1s
7
8
Page 19 of 24 Journal of Materials Chemistry A
Jour
nalo
fMat
eria
lsC
hem
istr
yA
Acc
epte
dM
anus
crip
t
Publ
ishe
d on
26
Mar
ch 2
014
Dow
nloa
ded
by N
atio
nal C
hung
Hsi
ng U
nive
rsity
on
120
420
14 1
036
16
View Article OnlineDOI 101039C4TA01057D
19
1
Figure 6 2
3
00
02
04
06
08
10
12
Y2O
3
20GOY
50GOY
10GOY
5GOYCo
nv
ers
ion
Photocatalysts
MO
MB
GO
4
5
6
7
8
Page 20 of 24Journal of Materials Chemistry A
Jour
nalo
fMat
eria
lsC
hem
istr
yA
Acc
epte
dM
anus
crip
t
Publ
ishe
d on
26
Mar
ch 2
014
Dow
nloa
ded
by N
atio
nal C
hung
Hsi
ng U
nive
rsity
on
120
420
14 1
036
16
View Article OnlineDOI 101039C4TA01057D
20
Figure 7 1
2
-5 0 5 10 15 20 25 30 35 40060
070
080
090
Co
nv
ers
ion
Time min
5 mg
6 mg
7 mg
8 mg
9 mg
10 mg
A100
-5 0 5 10 15 20 25 30 35 40
060
070
080
090
Co
nv
ers
ion
Time min
200 mg L-1
225 mg L-1
250 mg L-1
275 mg L-1
300 mg L-1
B100
3
4
-5 0 5 10 15 20 25 30 35 40
110
050
060
070
080
090
Co
nv
ers
ion
Time min
pH 303
pH 418
pH 519
pH 630
100
C
5
6
7
8
9
Page 21 of 24 Journal of Materials Chemistry A
Jour
nalo
fMat
eria
lsC
hem
istr
yA
Acc
epte
dM
anus
crip
t
Publ
ishe
d on
26
Mar
ch 2
014
Dow
nloa
ded
by N
atio
nal C
hung
Hsi
ng U
nive
rsity
on
120
420
14 1
036
16
View Article OnlineDOI 101039C4TA01057D
21
1
2
Figure 8 3
4
5
6
7
02 00 -02 -04
0
5
10
15
20j
A
cm
-2
E V (vs SCE)
Y2O
3
GO
5GOY
02 01 00 -01 -02 -0300
05
10
15
20
25
30
35
j A
cm
-2
E V (vs SCE)
Uv
Vis
Dark
5GOY
Page 22 of 24Journal of Materials Chemistry A
Jour
nalo
fMat
eria
lsC
hem
istr
yA
Acc
epte
dM
anus
crip
t
Publ
ishe
d on
26
Mar
ch 2
014
Dow
nloa
ded
by N
atio
nal C
hung
Hsi
ng U
nive
rsity
on
120
420
14 1
036
16
View Article OnlineDOI 101039C4TA01057D
22
1
2
Figure 9 3
4
400 450 500 550 600 650 700 750 800
Inte
ns
ity
a
u
Wavelength nm
20 GOY
5 GOY
Y2O
3
5
6
7
Page 23 of 24 Journal of Materials Chemistry A
Jour
nalo
fMat
eria
lsC
hem
istr
yA
Acc
epte
dM
anus
crip
t
Publ
ishe
d on
26
Mar
ch 2
014
Dow
nloa
ded
by N
atio
nal C
hung
Hsi
ng U
nive
rsity
on
120
420
14 1
036
16
View Article OnlineDOI 101039C4TA01057D
23
1
Figure 10 2
3
4
5
6
Page 24 of 24Journal of Materials Chemistry A
Jour
nalo
fMat
eria
lsC
hem
istr
yA
Acc
epte
dM
anus
crip
t
Publ
ishe
d on
26
Mar
ch 2
014
Dow
nloa
ded
by N
atio
nal C
hung
Hsi
ng U
nive
rsity
on
120
420
14 1
036
16
View Article OnlineDOI 101039C4TA01057D
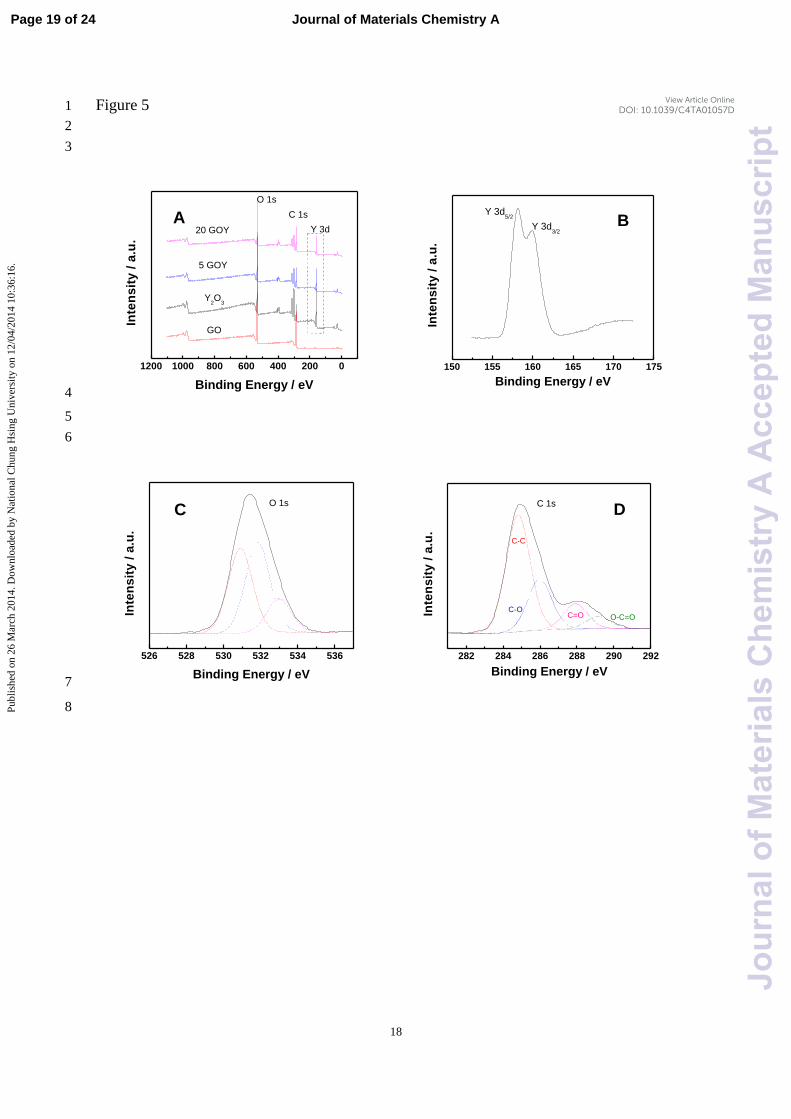
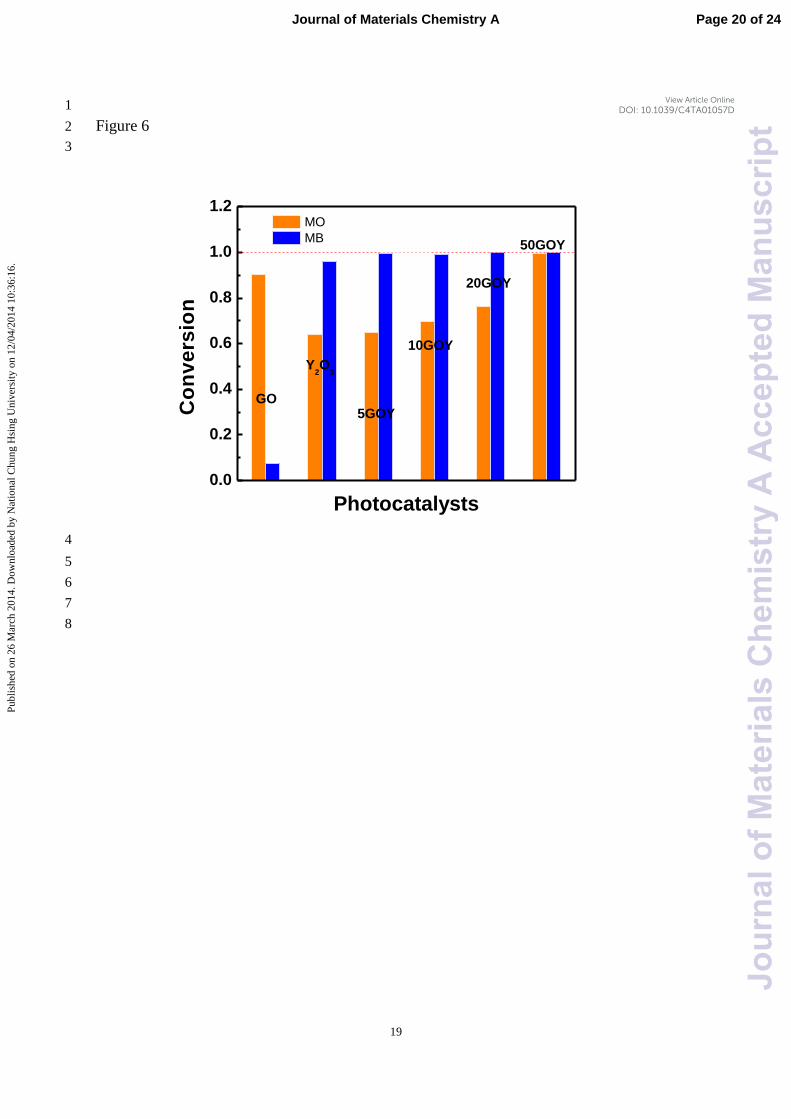
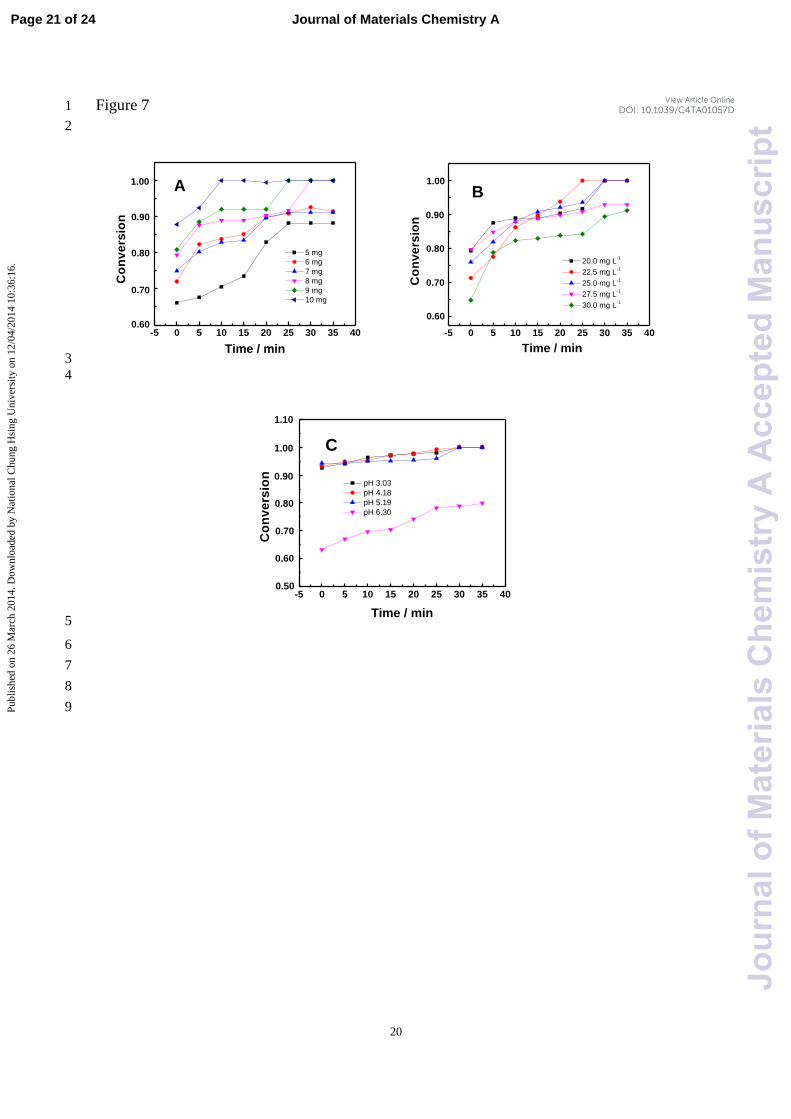
20
Figure 7 1
2
-5 0 5 10 15 20 25 30 35 40060
070
080
090
Co
nv
ers
ion
Time min
5 mg
6 mg
7 mg
8 mg
9 mg
10 mg
A100
-5 0 5 10 15 20 25 30 35 40
060
070
080
090
Co
nv
ers
ion
Time min
200 mg L-1
225 mg L-1
250 mg L-1
275 mg L-1
300 mg L-1
B100
3
4
-5 0 5 10 15 20 25 30 35 40
110
050
060
070
080
090
Co
nv
ers
ion
Time min
pH 303
pH 418
pH 519
pH 630
100
C
5
6
7
8
9
Page 21 of 24 Journal of Materials Chemistry A
Jour
nalo
fMat
eria
lsC
hem
istr
yA
Acc
epte
dM
anus
crip
t
Publ
ishe
d on
26
Mar
ch 2
014
Dow
nloa
ded
by N
atio
nal C
hung
Hsi
ng U
nive
rsity
on
120
420
14 1
036
16
View Article OnlineDOI 101039C4TA01057D
21
1
2
Figure 8 3
4
5
6
7
02 00 -02 -04
0
5
10
15
20j
A
cm
-2
E V (vs SCE)
Y2O
3
GO
5GOY
02 01 00 -01 -02 -0300
05
10
15
20
25
30
35
j A
cm
-2
E V (vs SCE)
Uv
Vis
Dark
5GOY
Page 22 of 24Journal of Materials Chemistry A
Jour
nalo
fMat
eria
lsC
hem
istr
yA
Acc
epte
dM
anus
crip
t
Publ
ishe
d on
26
Mar
ch 2
014
Dow
nloa
ded
by N
atio
nal C
hung
Hsi
ng U
nive
rsity
on
120
420
14 1
036
16
View Article OnlineDOI 101039C4TA01057D
22
1
2
Figure 9 3
4
400 450 500 550 600 650 700 750 800
Inte
ns
ity
a
u
Wavelength nm
20 GOY
5 GOY
Y2O
3
5
6
7
Page 23 of 24 Journal of Materials Chemistry A
Jour
nalo
fMat
eria
lsC
hem
istr
yA
Acc
epte
dM
anus
crip
t
Publ
ishe
d on
26
Mar
ch 2
014
Dow
nloa
ded
by N
atio
nal C
hung
Hsi
ng U
nive
rsity
on
120
420
14 1
036
16
View Article OnlineDOI 101039C4TA01057D
23
1
Figure 10 2
3
4
5
6
Page 24 of 24Journal of Materials Chemistry A
Jour
nalo
fMat
eria
lsC
hem
istr
yA
Acc
epte
dM
anus
crip
t
Publ
ishe
d on
26
Mar
ch 2
014
Dow
nloa
ded
by N
atio
nal C
hung
Hsi
ng U
nive
rsity
on
120
420
14 1
036
16
View Article OnlineDOI 101039C4TA01057D
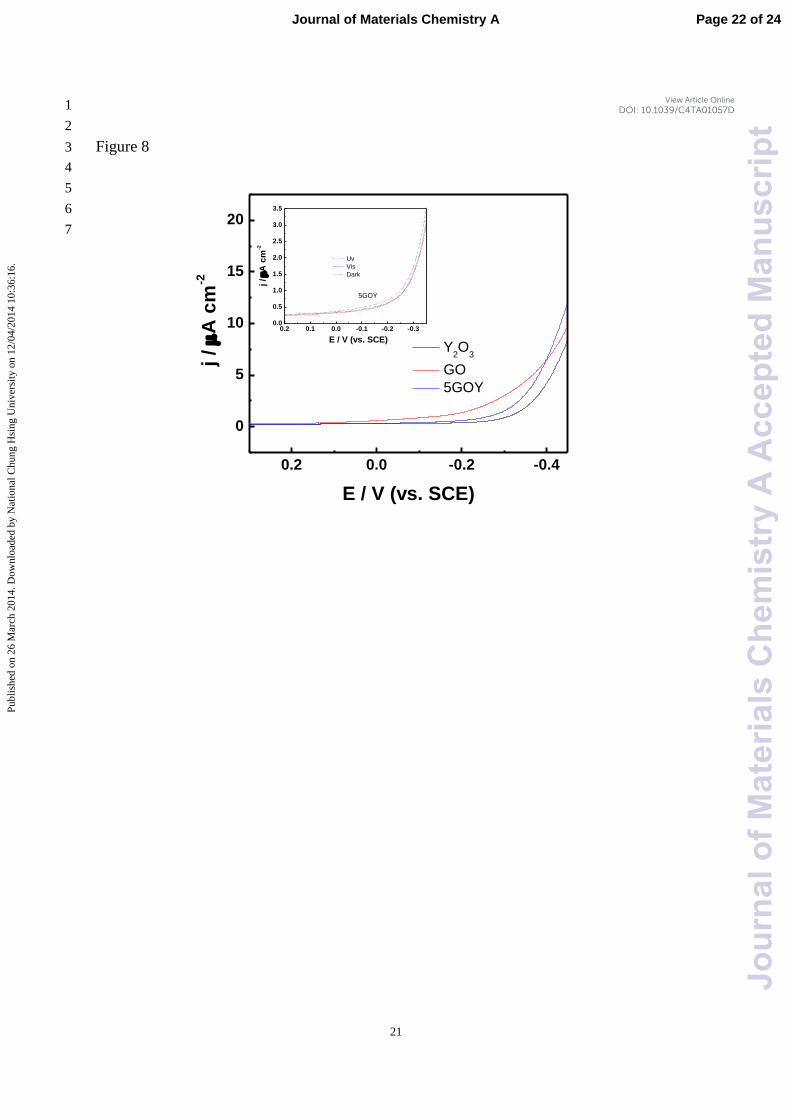
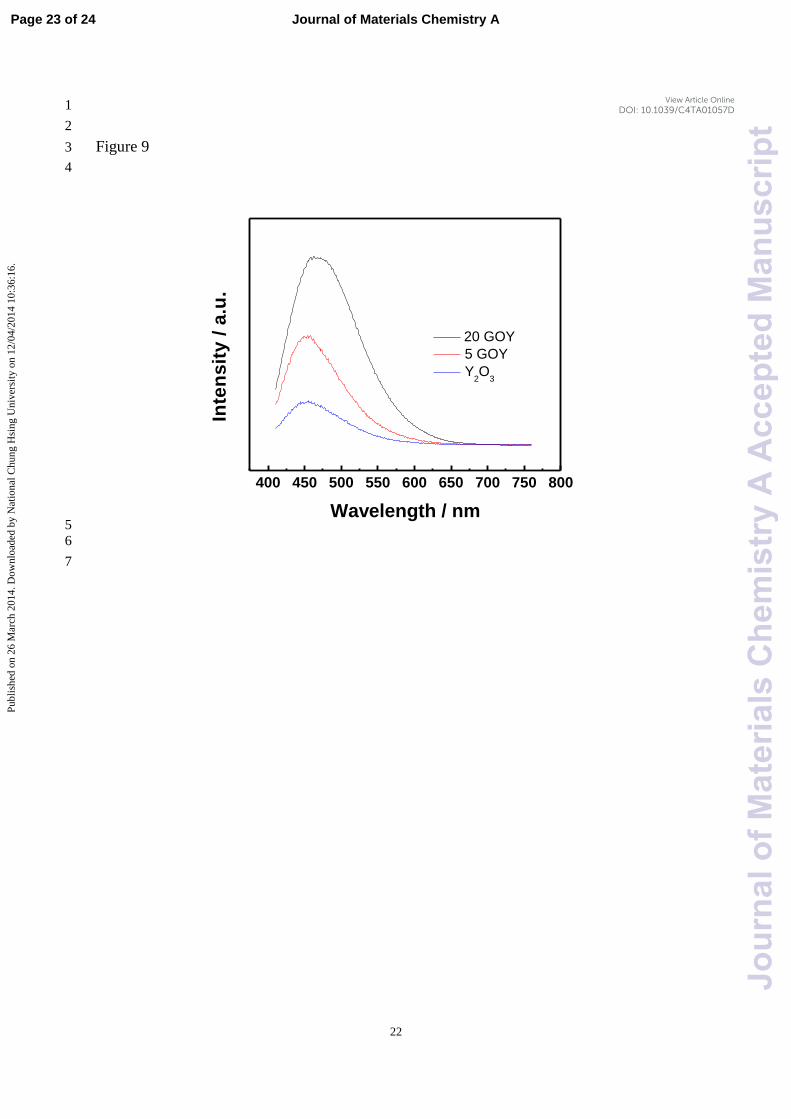
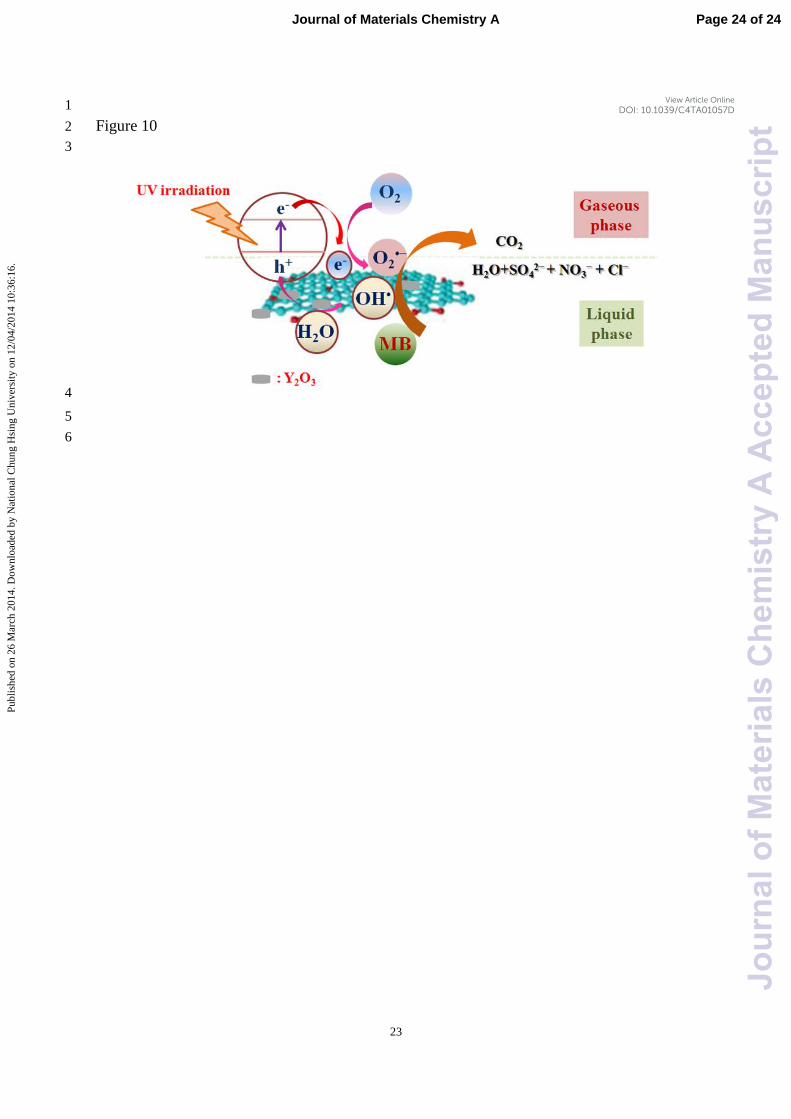
23
1
Figure 10 2
3
4
5
6
Page 24 of 24Journal of Materials Chemistry A
Jour
nalo
fMat
eria
lsC
hem
istr
yA
Acc
epte
dM
anus
crip
t
Publ
ishe
d on
26
Mar
ch 2
014
Dow
nloa
ded
by N
atio
nal C
hung
Hsi
ng U
nive
rsity
on
120
420
14 1
036
16
View Article OnlineDOI 101039C4TA01057D