synthesis and application of different nano-sized imprinted
TRANSCRIPT
Int. J. Electrochem. Sci., 7 (2012) 7655 - 7674
International Journal of
ELECTROCHEMICAL
SCIENCE www.electrochemsci.org
Synthesis and Application of Different Nano-Sized Imprinted
Polymers for the Preparation of Promethazine Membrane
Electrodes and Comparison of Their Efficiencies
Taher Alizadeh1, Mohammad Reza Ganjali
2,*, Maedeh Akhoundian
1 Department of Applied Chemistry, Faculty of Science, University of Mohaghegh Ardabili, Ardabil,
Iran 2
Center of Excellence in Electrochemistry, Faculty of Chemistry, University of Tehran, Tehran, Iran *E-mail: [email protected]
Received: 28 June 2012 / Accepted: 16 July 2012 / Published: 1 August 2012
In this work, two kinds of potentiometric sensors, based on the nano-sized molecularly imprinted
polymer (MIP), were introduced for high selective determination of promethazine. The MIP
nanoparticles were prepared by using two different methods including microemulsion polymerization
and suspension polymerization in silicon oil, regarded as nano-MIP(1) and nano-MIP(2), respectively.
Scatchard plots and the results of the rebinding experiments indicated that the binding sites of the nano-MIP(2) had more affinity to target molecules, compared to those of the nano-MIP(1). The MIP
nanoparticles were used in fabrication of the potentiometric membrane electrodes. The selectivity of the sensors was tested respect to some organic and inorganic species. The nano-MIP(2) based sensor,
showed higher selectivity and sensitivity, compared to the nano-MIP(1) based electrode. The former sensor, exhibited a Nernstian response (31.25±0.8 mVdecade−1) in a concentration range of 1.0×10⁻⁸ to
1.0×10⁻²
M with a lower detection limit of 7.0×10⁻⁹
M, whereas the later sensor showed a Nernstian response (31.97±0.6 mVdecade−1) in a concentration range of 1.0×10⁻⁷ to 1.0×10⁻² M with a lower
detection limit of 8.0×10⁻⁸
M. Both electrodes demonstrated a response time of 5 s, a high
performance and a satisfactory long-term stability. The electrodes were applied for PMZ determination
in syrup and serum samples.
Keywords: Promethazine; Molecularly imprinted polymer nanoparticles; Membrane electrode;
suspension polymerization; Microemulsion polymerization
1. INTRODUCTION
Molecular imprinting is one of the most efficient strategies to provide the artificial recognition
materials by a template polymerization technique. Imprinted polymers have attracted considerable
Int. J. Electrochem. Sci., Vol. 7, 2012
7656
efforts due to their importance in separation, sensor field and catalysis. Despite the fact that MIPs have
molecular recognition ability similar to that of biological receptors, traditional bulky MIP materials
usually exhibit a low binding capacity and slow binding kinetics to the target species. Moreover, the
MIP materials lack the signal-output response to analyte binding events, when used as recognition
elements in chemo/biosensors or bioassays [1].
The molecular imprinting nanotechnologies are expected to considerably increase the
molecular affinity of MIP materials, and thus provide a wider range of applications approaching to
biological receptors [2]. In the nano-structured, imprinted materials most of imprinted sites are situated
at the surface or in the proximity of surface. Therefore, the forms of imprinted materials are expected
to greatly improve the binding capacity and kinetics and site accessibility of imprinted materials.
Compared with the imprinted films and surface-imprinted materials, the imprinted nanomaterials have
shown a higher affinity and sensitivity to target analyte and a more homogeneous distribution of
recognition sites [2,3].
Potentiometry is one of the simplest electrochemical techniques that maybe found.
Potentiometric sensors provide an exciting and achievable opportunity to perform biomedical,
environmental and industrial analyses away from a centralized laboratory since these make it possible
to combine the ease of use and portability with simple and inexpensive fabrication techniques [4].
Recently, several potentiometric sensors based on the MIP, have been reported for reliable and
selective determination of various analytes such as levamisole hydrochloride [5], Cetirizine [6]
Methylphosphonic acid [7], atrazine [8] melamine [9] and promethazine [10]. In these works, the MIP
has been used in the form of micro-sized or bulky shape particles. Although these works have opened a
new horizon in order to design high selective potentiometric sensors for molecular ions, it is evident
that there are considerable drawbacks with these sensors because of what mentioned above.
Promethazine is widely used for its antihistaminic, sedative, antipsychotic, analgesic and
anticholinergic properties. However, promethazine hydrochloride can cause adverse effects in humans,
such as endocrinal, cardiac and reproductive alterations. Therefore, its determination in commercial
formulations and biological samples is extremely important [11]. Several analytical techniques such as
titrimetric procedures [12–14], spectrophotometric methods [15], spectrofluorometry [16], high
performance liquid chromatography [17] and voltammetry [18,19] have been employed for
promethazine (PMZ) determination.
We developed a potentiometric sensor for promethazine, based on the bulky MIP particles in
our previous work [10]. In that work, we investigated on the effect of MIP formulation and it was
found that the vinylbenzen-divinylbenzene structure is more proper than the methacrylicacid-
ethylenglycoldimethacrylate formulation to prepare a potentiometric sensor for promethazine. In the
present work, we aimed to test the nano-sized MIP particles in the potentiometric sensor field. Thus,
the nanoparticles of molecularly imprinted polymer containing recognition sites of promethazine were
prepared by two different methods and then the polymers were used for the fabrication of
promethazine selective potentiometric sensors. It was found that the MIP size had explicit effect on the
potentiometric sensor performance. It was also found that the type of the technique, used for the
preparation of MIP nanoparticles, influenced the potentiometric membrane sensor performance.
Int. J. Electrochem. Sci., Vol. 7, 2012
7657
2. EXPERIMENTAL
2.1. Reagents
Promethazine and chlorpromethazine were from (Fluka, Switzerlands). Salbutamol,
methochlorpramide and methylen blue were from (Aldrich, USA). Methacrylicacid(MAA), 4-
vinylpyridine (VB), divinylbenzene (DVB), ethyleneglycoldimethacrylate (EGDMA), 2,2-
azobisisobutyronitrile (AIBN), 2-nitrophenyloctylether (NPOE), di-n-octylphthalate (DOP), di-
butylphthalate (DBP), bis(2-ethylhexyl) sebacate (BEHS), hexadecane, sodium dodecylsulphate (SDS)
and high molecular mass poly(vinyl chloride) (PVC) were purchased from (Aldrich, USA). Benzyl
acetate (BA) and acetophenon (AP) were purchased from (Merck, Germany). All other chemicals were
of analytical reagent grade and obtained from (Merck, Germany). Deionized water was used
throughout. Drug free human serum was obtained from the Iranian blood transfusion service (Ardabil,
Iran) and stored at −20 C until use after gentle thawing.
2.2. Preparation of PMZ imprinted polymer nanoparticles by microemulsion polymerization
PMZ imprinted polymer nanoparticles were prepared by microemulsion polymerization
according to the work reported by A.S. Belmont and coworkers [20]. Briefly, the organic phase
containing 0.38 mmol of promethazine, dissolved in 1 mL of tetrachloroethane, 1.52 mmol of VB,
7.6 mmol of DVB, 80 µL of hexadecane and 50 mg of AIBN was ultrasonicated for 1 min to help the
dissolving of the template molecule prior to the addition of the aqueous phase (38.5 mg of SDS in
18 ml of water). The pre-polymerization mixture was then sonicated in an ultrasonic bath for 1 min
and purged with nitrogen gas for 5 min. Polymerization was carried out for 18 h at 65 °C in a water
bath. The polymer was dialyzed three times against water to remove the SDS. Template molecules
were extracted by incubating six times (for 2 h) in methanol, followed by centrifugation steps. The size
of the particles was determined by scanning electron microscopy. Non-imprinted polymer (NIP)
particles were prepared analogously without the addition of PMZ during polymer material preparation.
The nano-MIP, prepared by this method, was regarded as nano-MIP(1).
2.3. Preparation of nanosized-imprinted polymers by suspension polymerization in silicon oil
In order to prepare MIP nanoparticles by suspension polymerization in silicon oil, 0.5 mmol of
PMZ, 2 mmol of VB, 10 mmol of DVB and 0.05 g of azobisisobutyronitrile (AIBN) were dissolved in
5 mL of acetonitrile. Then, 80 mL of silicon oil was purged with a stream of nitrogen gas for 15 min.
The pre-polymerization mixture was added to the treated silicon oil and then dispersed at 800 rpm for
5 min. Next, the mixture was further mixed by ultrasonic mixer in order to break the polymerizable
suspensions into the smaller droplets. Then, the resulting mixture was placed in the water bath, fixed at
65 °C, for 12 h. The synthesized particles were filtered and washed with petroleum ether and toluene
several times. To extract PMZ and the remaining monomers from the polymer networks, the particles
were washed with MeOH. Finally, the particles were dried in vacuum at 50°C overnight. The non-

Int. J. Electrochem. Sci., Vol. 7, 2012
7658
imprinted polymer nanoparticles were prepared and treated in the same manner without PMZ. The
nano-MIP, prepared by this method was regarded as nano-MIP (2).
2.4. EIS measurements
Square wave voltammetry experiments were carried out by using a three-electrode system via a
potentiostat/galvanostat model PGSTAT302, Metrohm. A glassy carbon electrode was used as the
working electrodes. A platinum wire and an Ag/AgCl electrode were used as the counter and reference
electrodes, respectively.
The aforementioned AUTOLAB PGSTAT 302 electrochemical analysis system and GPES 4.9
software package (Eco Chemie, Netherlands) was used for the electrochemical impedance
spectroscopy. The electrodes were conditioned for 2 days in 10−3 M PMZ solution before
measurement; the same molarity of bathing solution was used while recording the spectra. Impedance
measurements were performed at open-circuit dc-potential (frequency range=5 mHz–500 kHz, ∆Eac=
50 mV). The measurements were performed in a three electrode system: counter electrode (platinum),
reference electrode (silver–silver chloride wire), and working electrode (investigated conventional
electrodes).
2.5. Rebinding experiment
In order to obtain the Scatchard plot, 0.05 g of MIPs was immersed into 5.0 mL of a known
concentration of promethazine solution (in acetonitrile) in a container. The container was continuously
mixed at 25°C for 7 h. The mixture was centrifuged and promethazine concentration in supernatant
solution was analyzed by square wave voltametry. For this aim, the supernatant acetonitrile solution
was evaporated completely by using the flow of nitrogen gas and then 10 mL of phosphate buffer
solution (0.2 M) was added to the container to fix the solution pH=7. A glassy carbon electrode was
used as the working electrode. The potential range of 0.2-1.0 V with the amplitude of 50 mV and
frequency of 50 Hz, was used for square wave voltammetry experiment. The oxidation peak of PMZ
was applied for the determination of PMZ.
The amount of promethazine, bound to the MIP, was calculated by subtracting the
concentration of the free substrate from the initial concentration.
In order to evaluate the adsorption characteristics of the MIP in aqueous solution, 0.05 g of the
MIP was immersed in the known concentration of promethazine or chlorpromethazine (in water) in the
proper containers. The containers were shaken continuously for 2 h. The mixture was then centrifuged
and promethazine/chlorpromethazine concentrations in supernatant solutions were analyzed by the
described square wave voltametry technique. The amount of promethazine, bound to the MIP, was
calculated by subtracting the concentration of the free substrate from the initial concentration.
Int. J. Electrochem. Sci., Vol. 7, 2012
7659
2.6. Fabrication of the PMZ sensor
The PVC membrane sensors were fabricated by following the general procedure, mentioned
below. Promethazine imprinted or non-imprinted polymer nanoparticles were dispersed in 0.2 ml
NPOE (DOP or BEHS or DBP) and were added to 2.5 ml of THF containing PVC. The resulting
solution was homogenized in a sonicator and then poured in a Teflon mould. The THF was allowed to
evaporate at room temperature. The polymer membranes thus obtained have a thickness of ∼0.5 mm.
The membranes were glued to one end of a Pyrex glass tube. The tube was then filled with an internal
filling solution of 10−3
M of PMZ (fixed at pH=2.5). The sensor was kept in air when not in use.
2.7. Analytical procedure
The sensor was conditioned in 25 ml of 0.1 M buffer with pH 2.5 for 3 h. The response of the
sensor was examined by measuring the potential of the following electrochemical cell: Ag-AgCl|
internal solution (1.0×10⁻³
M PMZ) | PVC-MIP membrane | sample solution | Hg-Hg2Cl2, KCl (sat.).
The potential response of the sample solution containing varying amounts of PMZ in 50ml of 0.1 M
buffer (pH 2.5) was measured. The EMF was plotted as a function of PMZ concentration.
2.8. Syrup sample preparation and determination
Syrup containing 5 mg mL-1
of promethazine–HCl was diluted with distilled water. An aliquot
containing 1×10⁻⁶–1×10⁻² M was taken, the above procedure was followed and the membrane
potentials were measured. The standard addition method was used for PMZ determination in syrup
sample. The quantity of promethazine–HCl per mL of syrup was calculated from the standard
calibration graph.
2.9. Preparation of serum sample and extraction procedure
In order to prepare the serum standard solutions, 1 mL of PMZ aqueous solution was
transferred in to a 5 mL volumetric flask and then the solution was diluted to the mark with serum and
vortexed for 1min. The solution was adjusted to pH 10 by the concentrated sodium hydroxide and then
2ml of dichloromethane was added to 1ml of the prepared serum sample and vortexed for 2min. The
mixture was then centrifuged at 1000 rpm for 4 min to separate the aqueous and organic phases. After
removal of the organic layer the extraction was repeated on the residual aqueous layer. The
dichloromethane phases were pooled and dried at 40 C under a gentle stream of nitrogen. After
drying, samples were reconstituted with 15 mL of buffer (pH=2.5). Then the analysis was followed up
as indicated in the general analytical procedure. The calibration curve for serum samples was also
prepared using buffer solution.
Int. J. Electrochem. Sci., Vol. 7, 2012
7660
3. RESULTS AND DISCUSSION
3.1. Characterization of MIP particles obtained by different methods
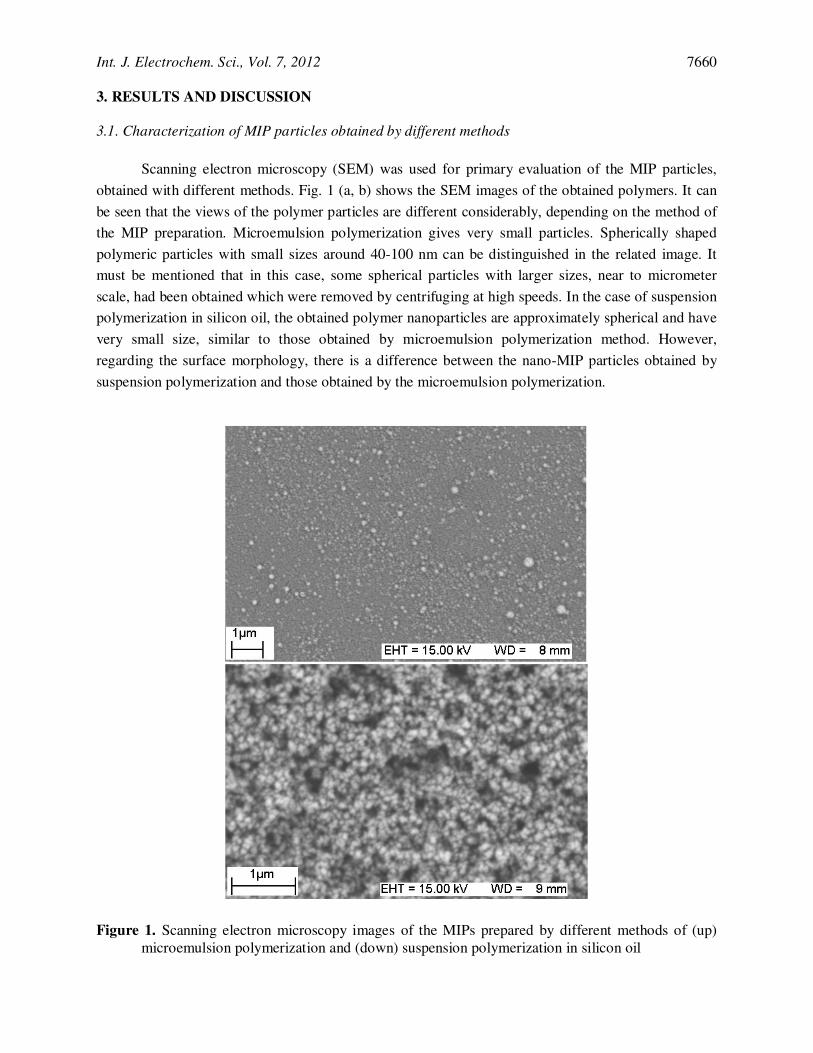
Scanning electron microscopy (SEM) was used for primary evaluation of the MIP particles,
obtained with different methods. Fig. 1 (a, b) shows the SEM images of the obtained polymers. It can
be seen that the views of the polymer particles are different considerably, depending on the method of
the MIP preparation. Microemulsion polymerization gives very small particles. Spherically shaped
polymeric particles with small sizes around 40-100 nm can be distinguished in the related image. It
must be mentioned that in this case, some spherical particles with larger sizes, near to micrometer
scale, had been obtained which were removed by centrifuging at high speeds. In the case of suspension
polymerization in silicon oil, the obtained polymer nanoparticles are approximately spherical and have
very small size, similar to those obtained by microemulsion polymerization method. However,
regarding the surface morphology, there is a difference between the nano-MIP particles obtained by
suspension polymerization and those obtained by the microemulsion polymerization.
Figure 1. Scanning electron microscopy images of the MIPs prepared by different methods of (up)
microemulsion polymerization and (down) suspension polymerization in silicon oil
Int. J. Electrochem. Sci., Vol. 7, 2012
7661
3.2. Influence of the MIP preparation method on their performance
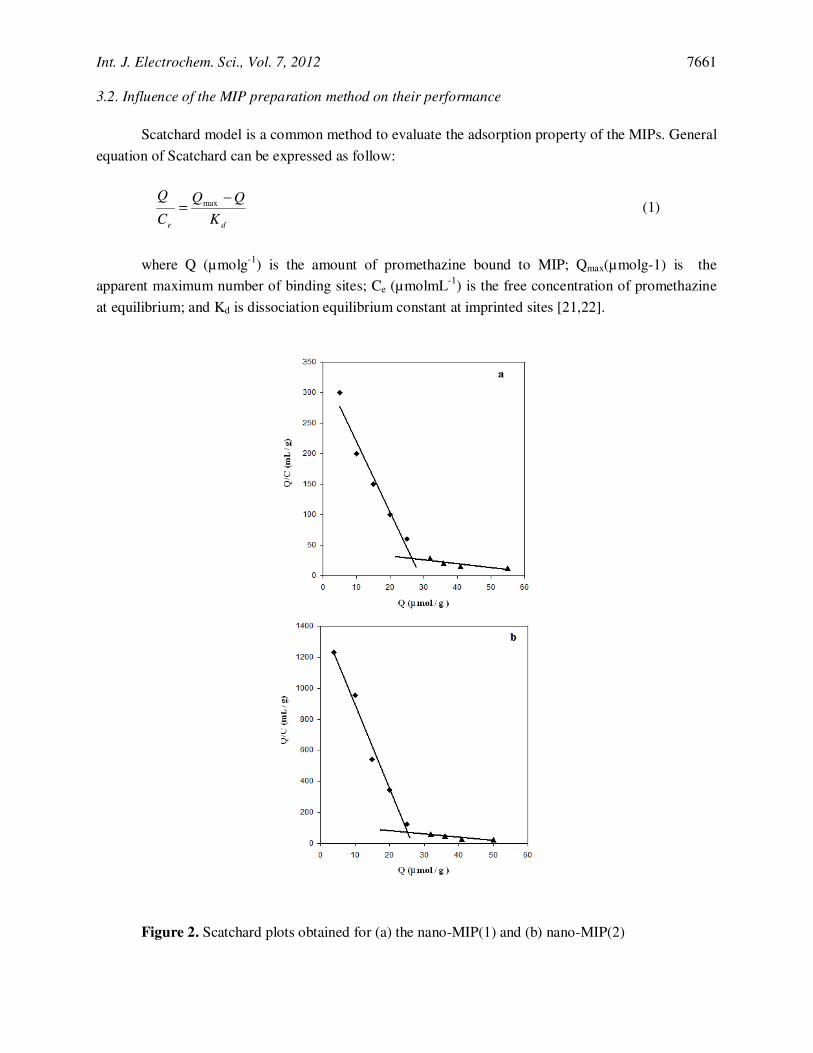
Scatchard model is a common method to evaluate the adsorption property of the MIPs. General
equation of Scatchard can be expressed as follow:
de K
C
Q −=
max (1)
where Q (µmolg-1
) is the amount of promethazine bound to MIP; Qmax(µmolg-1) is the
apparent maximum number of binding sites; Ce (µmolmL-1
) is the free concentration of promethazine
at equilibrium; and Kd is dissociation equilibrium constant at imprinted sites [21,22].
Figure 2. Scatchard plots obtained for (a) the nano-MIP(1) and (b) nano-MIP(2)
Int. J. Electrochem. Sci., Vol. 7, 2012
7662
However, Scatchard plots, depicted in Fig. 2 (a) and (b), show double lines for both nano-MIP
(1) and nano-MIP (2). This indicates that the binding sites in the imprinted polymers are heterogeneous
in respect to promethazine, and there are, at least, two kinds of binding sites in both MIPs. The steeper
lines are related to the high affinity sites (specific binding sites) and the flatter line measures the low
affinity sites (non-specific binding sites). Accordingly, the equation (1) can be written as equation (2).
2
22max
1
11max
dde K
K
C
Q −
+−
= (2)
In this equation, Q1, Qmax1 and Kd1 belong to high affinity sites and Q2, Qmax2 and Kd2 describe
the low affinity sites.
According to the Scatchard plot, depicted in Fig. 2 (a), the equilibrium dissociation constant
and the apparent maximum number for the high affinity sites of nano-MIP (1) were calculated to be
0.05 µmol mL-1 and 15.6 µmol g-1, respectively. On the other hand, for the low affinity binding sites of
this MIP, Kd and Qmax were calculated to be 1.56 µmol mL-1
and 53.8 µmol g-1
, respectively.
From the slopes of the Scatchard plot (Fig. 2(b)), depicted for nano-MIP (2), the equilibrium
dissociation constant (Kd) of the high and low affinity binding sites of the MIP were obtained as 0.013
and 0.48 µmol mL-1, respectively. Also, the apparent maximum numbers of these binding sites were
calculated to be 18.8 and 41.08 µmol g-1
, respectively. These results indicate that, the affinity of the
specific binding sites of nano-MIP(2) is about 3.8 times as much as that of the nano-MIP(2) particles.
Furthermre, the number of the specific binding sites of nano-MIP(2) is slightly higher than that of
nano-MIP(1).
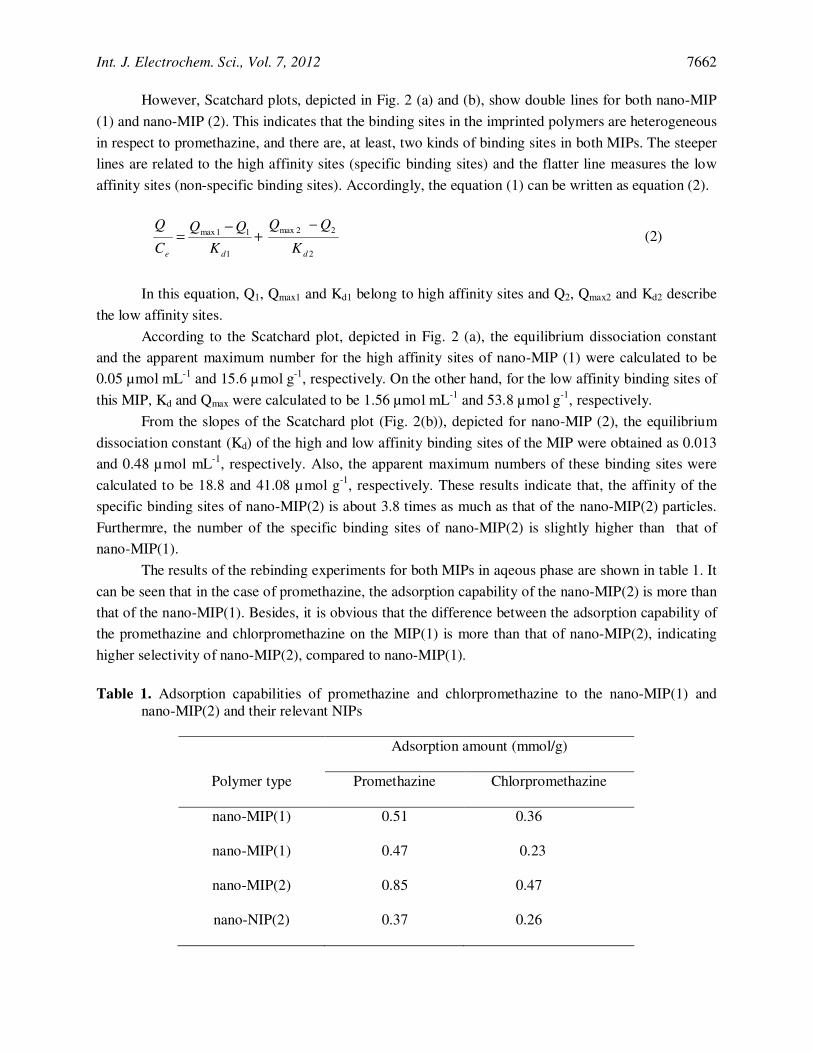
The results of the rebinding experiments for both MIPs in aqeous phase are shown in table 1. It
can be seen that in the case of promethazine, the adsorption capability of the nano-MIP(2) is more than
that of the nano-MIP(1). Besides, it is obvious that the difference between the adsorption capability of
the promethazine and chlorpromethazine on the MIP(1) is more than that of nano-MIP(2), indicating
higher selectivity of nano-MIP(2), compared to nano-MIP(1).
Table 1. Adsorption capabilities of promethazine and chlorpromethazine to the nano-MIP(1) and
nano-MIP(2) and their relevant NIPs
Adsorption amount (mmol/g)
Polymer type Promethazine Chlorpromethazine
nano-MIP(1) 0.51 0.36
nano-MIP(1) 0.47 0.23
nano-MIP(2) 0.85 0.47
nano-NIP(2) 0.37 0.26
Int. J. Electrochem. Sci., Vol. 7, 2012
7663
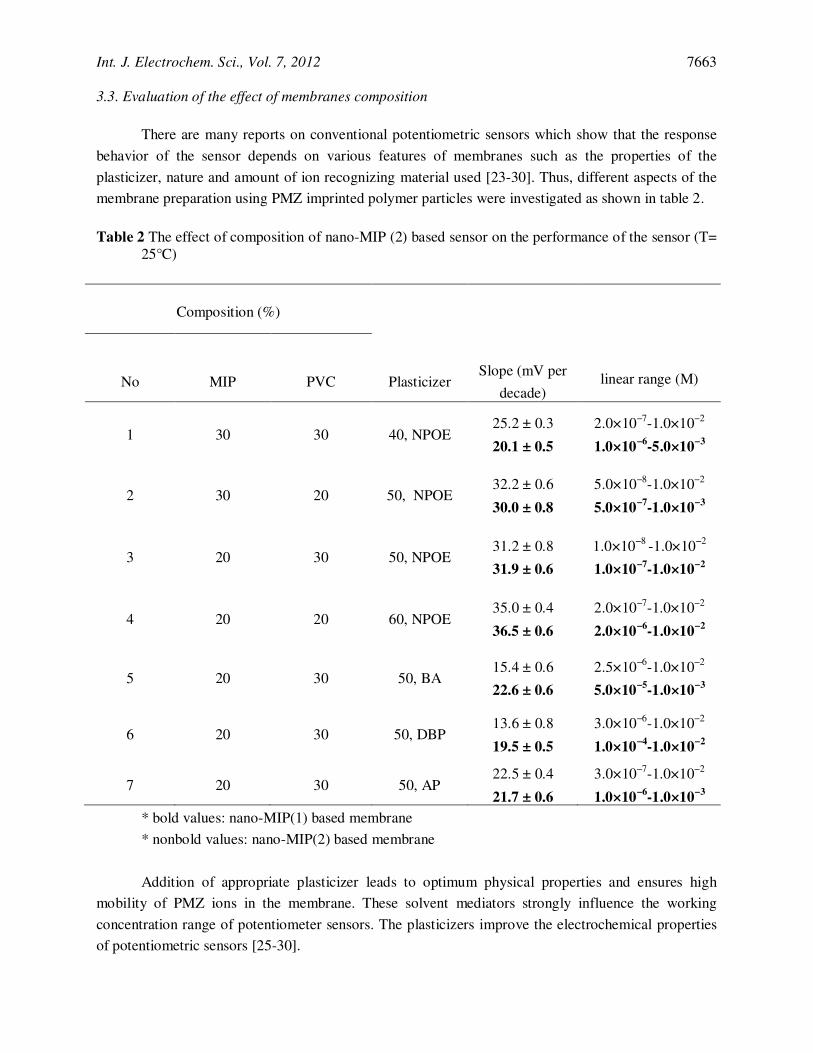
3.3. Evaluation of the effect of membranes composition
There are many reports on conventional potentiometric sensors which show that the response
behavior of the sensor depends on various features of membranes such as the properties of the
plasticizer, nature and amount of ion recognizing material used [23-30]. Thus, different aspects of the
membrane preparation using PMZ imprinted polymer particles were investigated as shown in table 2.
Table 2 The effect of composition of nano-MIP (2) based sensor on the performance of the sensor (T=
25°C)
Composition (%)
No MIP PVC Plasticizer Slope (mV per
decade) linear range (M)
1 30 30 40, NPOE 25.2 ± 0.3
20.1 ± 0.5
2.0×10⁻⁷-1.0×10⁻²
1.0×10⁻⁶
-5.0×10⁻³
2 30 20 50, NPOE 32.2 ± 0.6
30.0 ± 0.8
5.0×10⁻⁸-1.0×10⁻²
5.0×10⁻⁷
-1.0×10⁻³
3 20 30 50, NPOE 31.2 ± 0.8
31.9 ± 0.6
1.0×10⁻⁸
-1.0×10⁻²
1.0×10⁻⁷-1.0×10⁻²
4 20 20 60, NPOE 35.0 ± 0.4
36.5 ± 0.6
2.0×10⁻⁷-1.0×10⁻²
2.0×10⁻⁶
-1.0×10⁻²
5 20 30 50, BA 15.4 ± 0.6
22.6 ± 0.6
2.5×10⁻⁶
-1.0×10⁻²
5.0×10⁻⁵
-1.0×10⁻³
6 20 30 50, DBP 13.6 ± 0.8
19.5 ± 0.5
3.0×10⁻⁶-1.0×10⁻²
1.0×10⁻⁴
-1.0×10⁻²
7 20 30 50, AP 22.5 ± 0.4
21.7 ± 0.6
3.0×10⁻⁷-1.0×10⁻²
1.0×10⁻⁶
-1.0×10⁻³
* bold values: nano-MIP(1) based membrane
* nonbold values: nano-MIP(2) based membrane
Addition of appropriate plasticizer leads to optimum physical properties and ensures high
mobility of PMZ ions in the membrane. These solvent mediators strongly influence the working
concentration range of potentiometer sensors. The plasticizers improve the electrochemical properties
of potentiometric sensors [25-30].

Int. J. Electrochem. Sci., Vol. 7, 2012
7664
The effect of different plasticizers on the performance of both nano-MIP(1) and nano-MIP(2)-
based PMZ sensors was investigated. In both cases the membrane with NPOE offered higher
sensitivity with the proper Nernstian response. In this condition, the potential response of the
membrane, prepared by nano-MIP(1) exhibits a linear behavior over the range of 1×10⁻⁷ to 1×10⁻² M
with a Nernstian slope of 31.97 mV and lower detection limit of 8×10⁻⁸
. On the other hand, the
potential response of the membrane, prepared by nano-MIP(2) exhibits a linear behavior over the range
of 1×10⁻⁸
to 1×10⁻²
M with a Nernstian slope of 31.25 mV and lower detection limit of 7×10⁻⁹
. These
results were found for the sensors having 50% NPOE in its composition. The better results obtained in
the case of NPOE, compared to other types of tested plasticizers, can be directly related to the higher
dielectric constant of the plasticizer NPOE [26-32].
It has been shown that the ratio of ionophore to PVC influences the working concentration
range, slope and response time in case of conventional ionophore-based sensors [26-33] and imprinted
polymer based ion selective electrodes [25,34].
We observed that the ratio of PVC to imprinted polymer particles played a key role in the
efficiency of both sensors since the amount of imprinted polymer particles determines the number of
binding sites available for recognition. From the presented results (table 2), it is clear that in both cases
(nano-MIP(1) and nano-MIP(2)) the membranes having MIP particles to PVC ratio of 2:3 give the best
response.
3.4. Effect of test solution pH
Figure 3. The effect of pH on the potential responses of the membrane electrodes prepared by using
the nano-MIP(1) and nano-MIP(2)
The effect of pH of the solution on the performance of PMZ sensors was studied by varying the
pH in the range 1.0–9.0. The results are illustrated in Fig. 3. As can be seen, the potentials keep
constant in the range of 2.0–5.0 for both nano-MIP(1) and nano-MIP(2)-based electrodes. This is
Int. J. Electrochem. Sci., Vol. 7, 2012
7665
reasonable because, both MIPs have the same chemical structure. The observed potential drift at lower
pH values may be attributed to the membrane response to H+ and at higher pH values (pH > 5) may be
due to the change of promethazine ionic charge. Therefore pH of 2.5, fixed with monochloroacetic
acid based buffer, was adopted for adjusting the pH of the solutions.
3.5. Response time
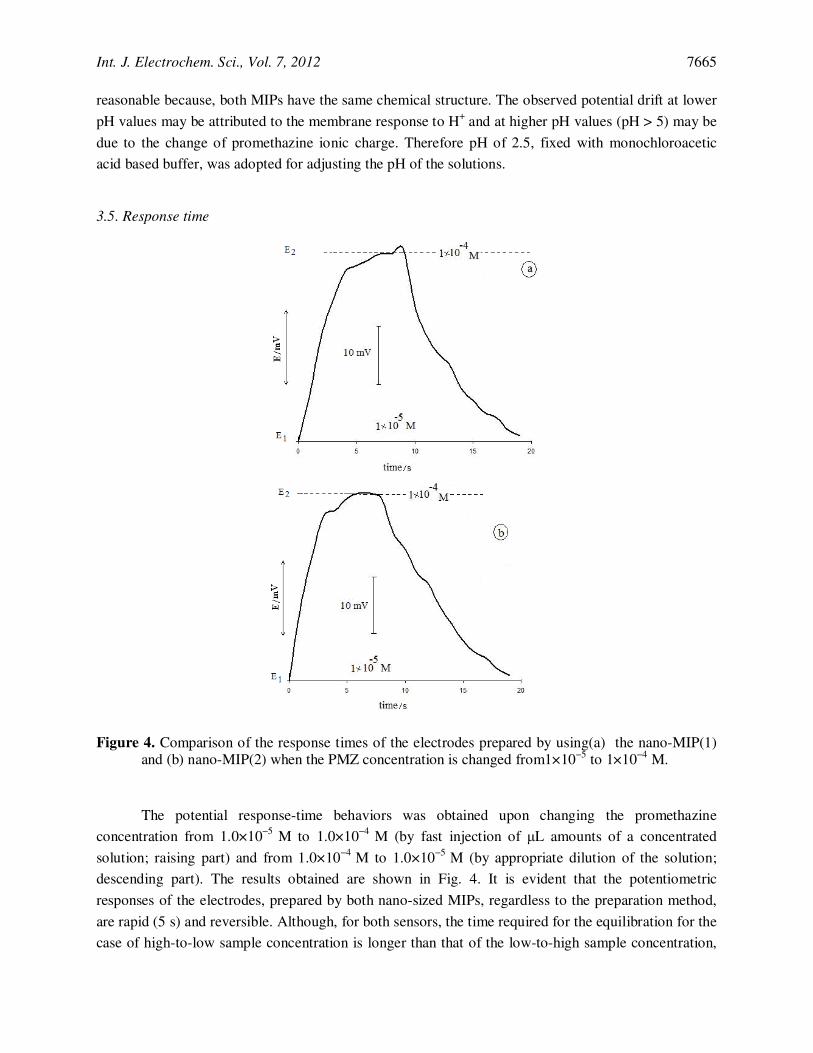
Figure 4. Comparison of the response times of the electrodes prepared by using(a) the nano-MIP(1) and (b) nano-MIP(2) when the PMZ concentration is changed from1×10−5 to 1×10⁻⁴ M.
The potential response-time behaviors was obtained upon changing the promethazine
concentration from 1.0×10⁻⁵
M to 1.0×10⁻⁴
M (by fast injection of µL amounts of a concentrated
solution; raising part) and from 1.0×10⁻⁴
M to 1.0×10⁻⁵
M (by appropriate dilution of the solution;
descending part). The results obtained are shown in Fig. 4. It is evident that the potentiometric
responses of the electrodes, prepared by both nano-sized MIPs, regardless to the preparation method,
are rapid (5 s) and reversible. Although, for both sensors, the time required for the equilibration for the
case of high-to-low sample concentration is longer than that of the low-to-high sample concentration,
Int. J. Electrochem. Sci., Vol. 7, 2012
7666
because of filling the cavity in imprinted polymer with the target molecule. However, the
measurements, performed in the sequence of high to low concentration, indicate that the response of
the MIP based electrodes were reversible. The shorter response time of nano-MIP based sensors,
compared to the previously reported MIP based membrane electrode [10], is attributed to the fact that
the recognitions sites are located in the surface of the MIP nanoparticles and thus, target molecules can
easily penetrate in the mentioned sites.
3.6. Sensitivity and detection limit
Imprinted nanoparticles, obtained from suspension polymerization in silicon oil, and those
synthesized by using microemulsion polymerizatio were used for membrane sensor preparation at
optimized composition. Then, the prepared sensors were used for promethazine determination under
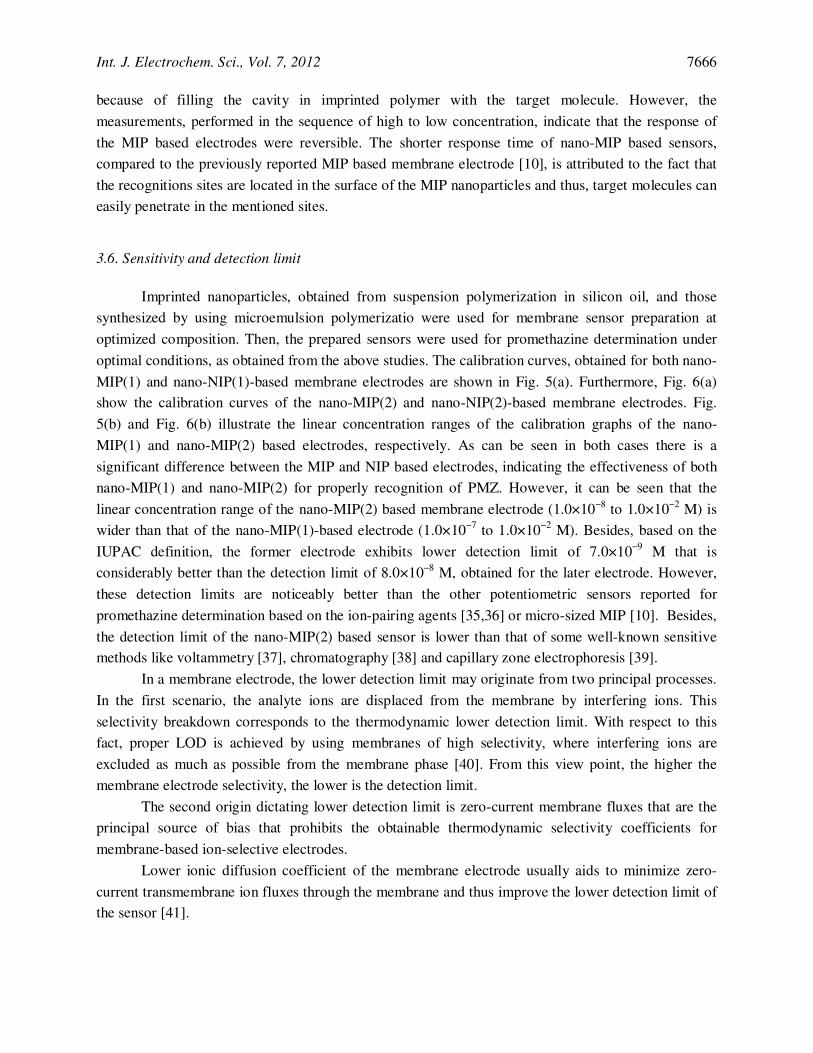
optimal conditions, as obtained from the above studies. The calibration curves, obtained for both nano-
MIP(1) and nano-NIP(1)-based membrane electrodes are shown in Fig. 5(a). Furthermore, Fig. 6(a)
show the calibration curves of the nano-MIP(2) and nano-NIP(2)-based membrane electrodes. Fig.
5(b) and Fig. 6(b) illustrate the linear concentration ranges of the calibration graphs of the nano-
MIP(1) and nano-MIP(2) based electrodes, respectively. As can be seen in both cases there is a
significant difference between the MIP and NIP based electrodes, indicating the effectiveness of both
nano-MIP(1) and nano-MIP(2) for properly recognition of PMZ. However, it can be seen that the
linear concentration range of the nano-MIP(2) based membrane electrode (1.0×10⁻⁸ to 1.0×10⁻² M) is
wider than that of the nano-MIP(1)-based electrode (1.0×10⁻⁷
to 1.0×10⁻²
M). Besides, based on the
IUPAC definition, the former electrode exhibits lower detection limit of 7.0×10⁻⁹
M that is
considerably better than the detection limit of 8.0×10⁻⁸ M, obtained for the later electrode. However,
these detection limits are noticeably better than the other potentiometric sensors reported for
promethazine determination based on the ion-pairing agents [35,36] or micro-sized MIP [10]. Besides,
the detection limit of the nano-MIP(2) based sensor is lower than that of some well-known sensitive
methods like voltammetry [37], chromatography [38] and capillary zone electrophoresis [39].
In a membrane electrode, the lower detection limit may originate from two principal processes.
In the first scenario, the analyte ions are displaced from the membrane by interfering ions. This
selectivity breakdown corresponds to the thermodynamic lower detection limit. With respect to this
fact, proper LOD is achieved by using membranes of high selectivity, where interfering ions are
excluded as much as possible from the membrane phase [40]. From this view point, the higher the
membrane electrode selectivity, the lower is the detection limit.
The second origin dictating lower detection limit is zero-current membrane fluxes that are the
principal source of bias that prohibits the obtainable thermodynamic selectivity coefficients for
membrane-based ion-selective electrodes.
Lower ionic diffusion coefficient of the membrane electrode usually aids to minimize zero-
current transmembrane ion fluxes through the membrane and thus improve the lower detection limit of
the sensor [41].

Int. J. Electrochem. Sci., Vol. 7, 2012
7667
Figure 5. Calibration graph obtained for (a) nano-MIP(2) and nano-NIP(2); (b) linear concentration
range of the nano-MIP(2) based electrode (Ecell=31.25(±0.8)C+116.6, C=log[PMZ]/M)
Int. J. Electrochem. Sci., Vol. 7, 2012
7668
Figure 6. Calibration graph obtained for (a) nano-MIP(1) and nano-NIP(1); (b) linear concentration
range of the nano-MIP(1)based electrode(Ecell=31.97(±0.6)C+100.37, C=log[PMZ]/M)
On the other hand, a decrease in the primary ion concentration gradient across the membrane
hinders such fluxes. When the concentration of analyte at the membrane side facing the sample is kept
constant the concentration gradients across the membrane during sample changes is minimized. Thus,
Int. J. Electrochem. Sci., Vol. 7, 2012
7669
in addition to the low ionic diffusion coefficient high selectivity of membrane can provide such a
preference.
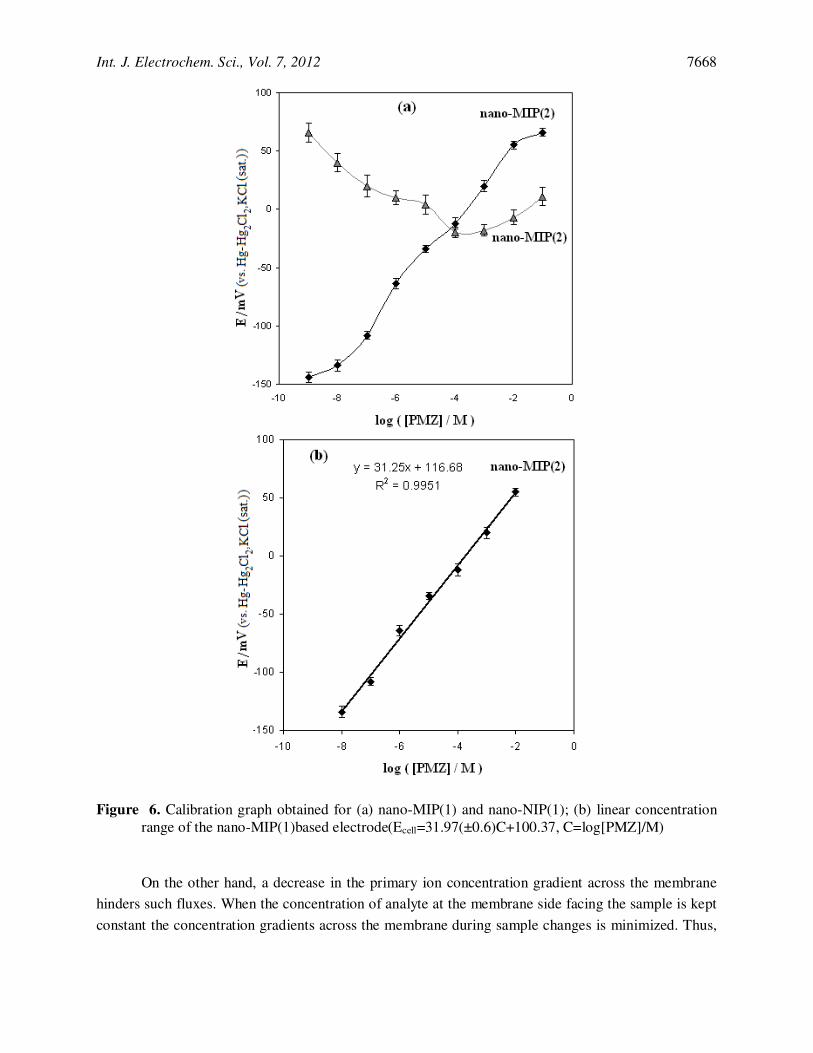
Electrochemical impedance spectroscopy experiment was applied to inspect the difference
between the membranes with various matrixes and also to find the right reason for the observed better
LOD of nano-MIP(2) based electrode, compared to that of the electrode prepared by the nano-MIP(1).
The impedance spectra of the electrodes are shown in Fig. 7. The high-frequency semicircles show that
the bulk resistance of the membranes prepared nano-MIP (1) and nano-MIP (2) are approximately 4.25
and 2.60 (MΩ), respectively. On the other hand, the geometric capacitances of these electrodes are
calculated as about 0.28 and 0.25 pF, respectively. These data can give the estimates of the dielectric
constants of the aimed membranes (assuming that the film thickness and area are the same for both
membranes).
Figure 7. Electrochemical impedance spectroscopy diagram (Nyquist plot) for different membranes
containing nano-MIP (1) and nano-MIP (2)
From these results it can be concluded that the observed better LOD of the nano-MIP(2) based
electrode is not related to the lowered ion fluxes phenomenon, because this membrane electrode has
partly higher ion mobility, compared to the other tested electrode. Therefore, it seems that the better
LOD of the nano-MIP(2) (compared to the nano-MIP(1) based electrode) can be assigned only to the
higher affinities of the recognition sites of the nano-MIP(2) based electrode, as it was proven via
Scatchard analysis, described previously in this work. As mentioned above, high selective membrane
provides lower selectivity coefficients for interfering ions, excluding them from the membrane. Also,
such membrane keeps constant the primary ion concentration near the membrane surface that
Int. J. Electrochem. Sci., Vol. 7, 2012
7670
decreases the primary ion concentration gradient. This can inhibit the ion fluxes through the membrane
electrode and thus improve the LOD of the electrode. As described before, the synthesis of the nano-
MIP (2) is carried out in the non polar media, whereas the nano-MIP (1) is prepared in water
containing media. Presumably, This can be a proof for the lower affinity of the recognition sites of the
nano-MIP(1), compared to the nano-MIP(2).
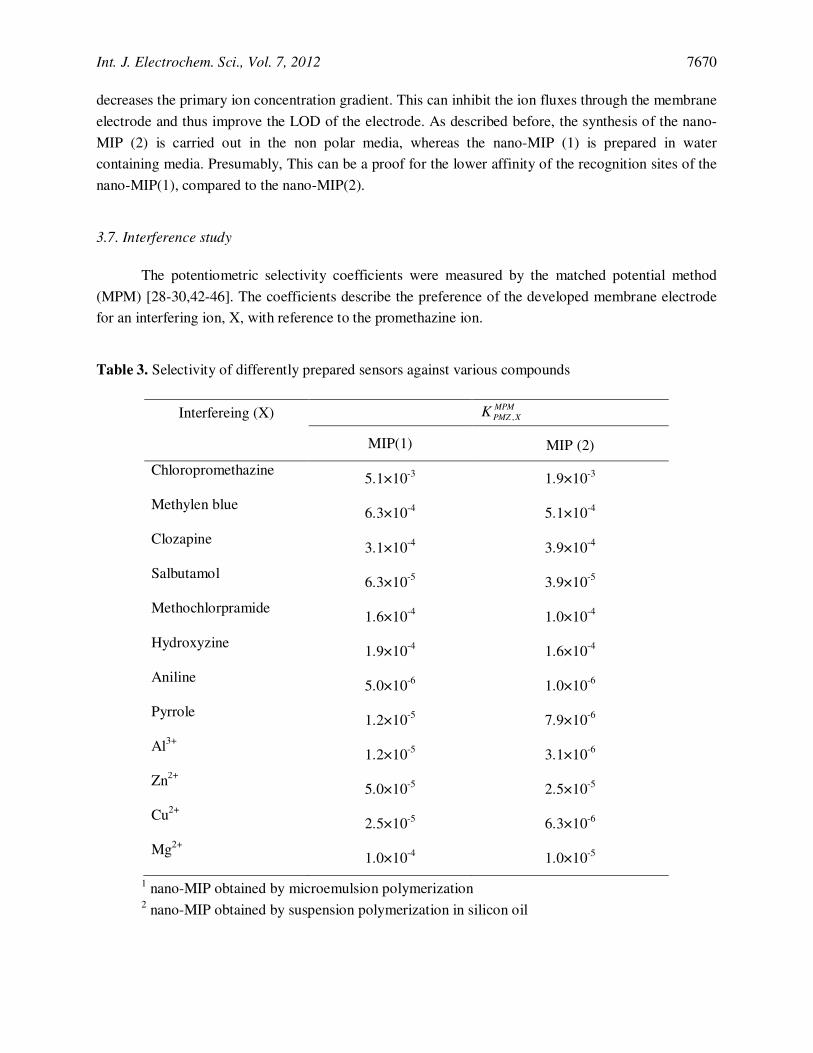
3.7. Interference study
The potentiometric selectivity coefficients were measured by the matched potential method
(MPM) [28-30,42-46]. The coefficients describe the preference of the developed membrane electrode
for an interfering ion, X, with reference to the promethazine ion.
Table 3. Selectivity of differently prepared sensors against various compounds
Interfereing (X) MPM
XPMZK ,
MIP(1) MIP (2)
Chloropromethazine
5.1×10⁻³ 1.9×10⁻³
Methylen blue
6.3×10⁻⁴ 5.1×10⁻⁴
Clozapine
3.1×10
-4 3.9×10
-4
Salbutamol
6.3×10
-5 3.9×10
-5
Methochlorpramide
1.6×10
-4 1.0×10
-4
Hydroxyzine
1.9×10⁻⁴
1.6×10⁻⁴
Aniline
5.0×10⁻⁶
1.0×10⁻⁶
Pyrrole
1.2×10⁻⁵
7.9×10⁻⁶
Al3+
1.2×10⁻⁵
3.1×10⁻⁶
Zn2+
5.0×10⁻⁵ 2.5×10⁻⁵
Cu2+
2.5×10⁻⁵ 6.3×10⁻⁶
Mg2+
1.0×10⁻⁴ 1.0×10⁻⁵
1 nano-MIP obtained by microemulsion polymerization 2 nano-MIP obtained by suspension polymerization in silicon oil
Int. J. Electrochem. Sci., Vol. 7, 2012
7671
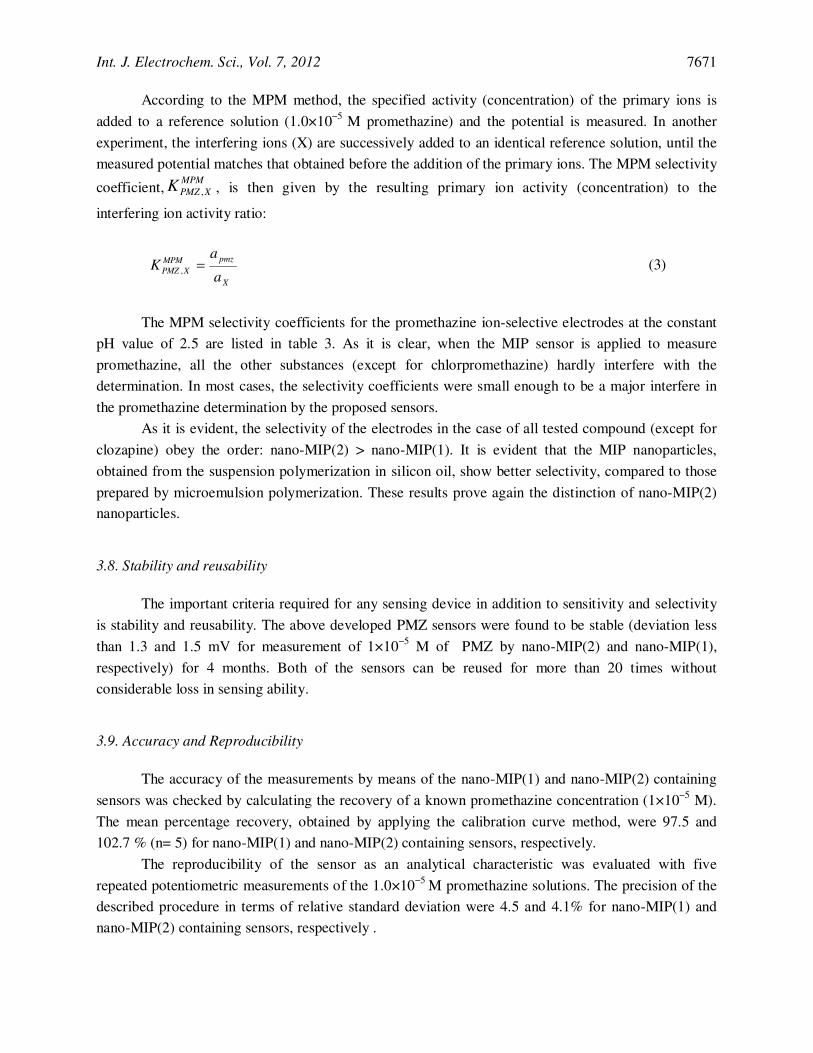
According to the MPM method, the specified activity (concentration) of the primary ions is
added to a reference solution (1.0×10⁻⁵
M promethazine) and the potential is measured. In another
experiment, the interfering ions (X) are successively added to an identical reference solution, until the
measured potential matches that obtained before the addition of the primary ions. The MPM selectivity
coefficient,MPM
XPMZK , , is then given by the resulting primary ion activity (concentration) to the
interfering ion activity ratio:
X
pmzMPM
XPMZa
aK =,
(3)
The MPM selectivity coefficients for the promethazine ion-selective electrodes at the constant
pH value of 2.5 are listed in table 3. As it is clear, when the MIP sensor is applied to measure
promethazine, all the other substances (except for chlorpromethazine) hardly interfere with the
determination. In most cases, the selectivity coefficients were small enough to be a major interfere in
the promethazine determination by the proposed sensors.
As it is evident, the selectivity of the electrodes in the case of all tested compound (except for
clozapine) obey the order: nano-MIP(2) > nano-MIP(1). It is evident that the MIP nanoparticles,
obtained from the suspension polymerization in silicon oil, show better selectivity, compared to those
prepared by microemulsion polymerization. These results prove again the distinction of nano-MIP(2)
nanoparticles.
3.8. Stability and reusability
The important criteria required for any sensing device in addition to sensitivity and selectivity
is stability and reusability. The above developed PMZ sensors were found to be stable (deviation less
than 1.3 and 1.5 mV for measurement of 1×10⁻⁵
M of PMZ by nano-MIP(2) and nano-MIP(1),
respectively) for 4 months. Both of the sensors can be reused for more than 20 times without
considerable loss in sensing ability.
3.9. Accuracy and Reproducibility
The accuracy of the measurements by means of the nano-MIP(1) and nano-MIP(2) containing
sensors was checked by calculating the recovery of a known promethazine concentration (1×10⁻⁵
M).
The mean percentage recovery, obtained by applying the calibration curve method, were 97.5 and
102.7 % (n= 5) for nano-MIP(1) and nano-MIP(2) containing sensors, respectively.
The reproducibility of the sensor as an analytical characteristic was evaluated with five
repeated potentiometric measurements of the 1.0×10⁻⁵
M promethazine solutions. The precision of the
described procedure in terms of relative standard deviation were 4.5 and 4.1% for nano-MIP(1) and
nano-MIP(2) containing sensors, respectively .
Int. J. Electrochem. Sci., Vol. 7, 2012
7672
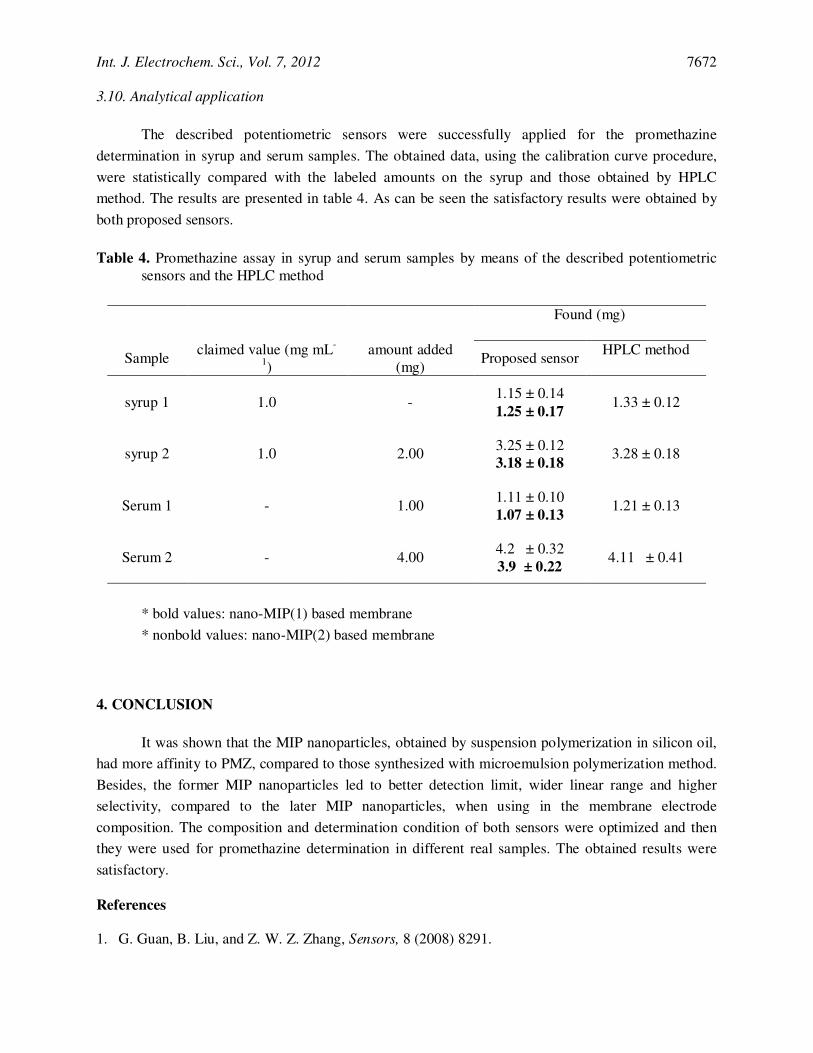
3.10. Analytical application
The described potentiometric sensors were successfully applied for the promethazine
determination in syrup and serum samples. The obtained data, using the calibration curve procedure,
were statistically compared with the labeled amounts on the syrup and those obtained by HPLC
method. The results are presented in table 4. As can be seen the satisfactory results were obtained by
both proposed sensors.
Table 4. Promethazine assay in syrup and serum samples by means of the described potentiometric
sensors and the HPLC method
Found (mg)
Sample claimed value (mg mL
-
1)
amount added
(mg) Proposed sensor
HPLC method
syrup 1
1.0 - 1.15 ± 0.14
1.25 ± 0.17 1.33 ± 0.12
syrup 2
1.0 2.00 3.25 ± 0.12
3.18 ± 0.18 3.28 ± 0.18
Serum 1
- 1.00 1.11 ± 0.10
1.07 ± 0.13 1.21 ± 0.13
Serum 2
- 4.00 4.2 ± 0.32
3.9 ± 0.22 4.11 ± 0.41
* bold values: nano-MIP(1) based membrane
* nonbold values: nano-MIP(2) based membrane
4. CONCLUSION
It was shown that the MIP nanoparticles, obtained by suspension polymerization in silicon oil,
had more affinity to PMZ, compared to those synthesized with microemulsion polymerization method.
Besides, the former MIP nanoparticles led to better detection limit, wider linear range and higher
selectivity, compared to the later MIP nanoparticles, when using in the membrane electrode
composition. The composition and determination condition of both sensors were optimized and then
they were used for promethazine determination in different real samples. The obtained results were
satisfactory.
References
1. G. Guan, B. Liu, and Z. W. Z. Zhang, Sensors, 8 (2008) 8291.
Int. J. Electrochem. Sci., Vol. 7, 2012
7673
2. N. A. Connor, D. A. Paisner, D. Huryn, and K. J. Shea, J. Am. Chem. Soc., 130 (2008) 1680.
3. C. Xie, B. Liu, Z. Wang, D. Gao, G. Guan, and Z. Zhang, Anal. Chem., 80 (2008) 437.
4. F. Faridbod, M. R. Ganjali, R. Dinarvand, and P. Norouzi, Comb. Chem. High throughput Scr., 10
(2007) 527.
5. S. Sadeghi, F. Fathi, and J. Abbasifar, Sens. Actuators B, 122 (2007) 158.
6. M. Javanbakht, S. E. Fard, M. Abdouss, A. Mohammadi, M. R. Ganjali, P. Norouzi, and L. Safaraliee, Electroanalysis, 20 (2008) 2023.
7. P. Prathish, K. Prasad, T. P. Rao, and M. V. S. Suryanarayana, Talanta 71 (2007) 1976. 8. K. Prasad, K. P. Prathish, J. M. Gladis, G. R. K. Naidu, and T. P. Raoa, Sens. Actuators B, 123
(2007) 65. 9. R. Liang, R. Zhang, and W. Qin, Sens. Actuators B, 141 (2009) 544.
10. T. Alizadeh, and M. Akhoundian, Electrochim. Acta, 55 (2010) 3477. 11. D. Daniel, and I. G. R. Gutz, Anal. Chim. Acta, 494 (2003) 215.
12. A. S. Issa, and M. S. Mahous, Talanta, 31(1984) 287.
13. A. M. Taha, N. A. El-Rabbat, and M. E. El-Kommas, Analyst, 108 (1983) 1500.
14. M. I. Walsh, F. Belal, and F. A. Aly, Talanta, 35 (1988) 320.
15. M. M. El-Kerdway, S. M. Hassan, and S. M. El-Ashy, Mikrochim. Acta, 108 (1992) 323.
16. F. A. Mohamed, Anal. Lett., 28 (1995) 2491.
17. D. D. Orsi, L. Gagliardi, and D. Tonelli, J. Pharm. Biomed. Anal., 14 (1996) 1635.
18. Y. Ni, L. Wanga, and S. Kokot, Anal. Chim. Acta, 439 (2001) 159.
19. T. Alizadeh, and M. Akhoundian, Electrochim. Acta, 55 (2010) 5867.
20. A. S. Belmont, S. Jaeger, D. Knopp, R. Niessner, G. Gauglitz, and K. Haupt, Biosens. Bioelectron.,
22 (2007) 3267.
21. X. Songa, J. Wanga, and J. Zhuc, Mater. Research, 12 (2009) 299.
22. H. Cao, J. B. Xiao, M. Xu, Macromolecular Research, 14 (2006) 324.
23. P. Prathish, K. Prasad, T. P. Rao, M. V. S. Suryanarayana, Talanta, 71 (2007) 1976. 24. V. K. Gupta, R. Mangla, U. Khurana, and P. Kumar, Electroanalysis, 11 (1999) 573.
25. K. Prasad, R. Kala, T. P. Rao, and G. R. K. Naidu, Anal. Chim. Acta., 566 (2006) 69. 26. M. R. Ganjali, P. Norouzi, T. Alizadeh, and M. Adib, Anal. Chim. Acta, 576 (2006) 275.
27. F. Faridbod, M. R. Ganjali, B. Larijani, P. Norouzi, S. Riahi, and F. S. Mirnaghi, Sensors 7 (2007) 3119.
28. M. R. Ganjali, Z. Memari, F. Faridbod, and P. Norouzi, Int. J. Electrochem. Sci., 3 (2008) 1169. 29. F. Faridbod, M. R. Ganjali, B. Larijani, E. Nasli-Esfahani, S. Riahi, and P. Norouzi, Int. J.
Electrochem. Sci., 5 (2010) 653.
30. F. Faridbod, M. R. Ganjali, L. Safaraliee, S. Riahi, M. Hosseini and P. Norouzi, Int. J.
Electrochem. Sci., 4 (2009) 1419.
31. M. R. Ganjali, R. Kiani-Anbouhi, M. Shamsipur, T. Poursaberi, M. Salavati-Niasari, Z. Talebpour,
and M. Emami, Electroanalysis 16 (2004) 1002. 32. M. R. Ganjali, R. Nemati, F. Faridbod, P. Norouzi, and F. Darviche, Int. J. Electrochem. Sci. 3
(2008) 1288.
33. M. R. Ganjali. P. Norouzi. T. Alizadeh, A. Tajarodi, and Y. Hanifehpour, Sens. Actuators B, 120
(2007) 487.
34. G. Dagostino, G. Alberti, R. Biesuz, and M. Pesavento, Biosen. Bioelectron., 22 (2006) 145.
35. M. R. Ganjali, B. Vesimohammadi, S. Riahi, and P. Norouzi, Int. J. Electrochem. Sci., 4 (2009)
740.
36. M. M. Zareh, R. E. Shohiab, and M. A. Fatah, Turk. J. Chem., 30 (2006) 307. 37. P. Xiao, W. Wu, J. Yu, and F. Zhao, Int. J. Electrochem. Sci., 2 (2007) 149.
38. J. E. Wallace, E. A. Shimek, S. C. Harris, S. Stavchansky, Clin. Chem., 27 (1981) 253. 39. F. J. Lara, A. M. G. Campana, F. A. Barrero, and J. M. B. Sendra, Anal. Chim. Acta, 535 (2005)
1011.
Int. J. Electrochem. Sci., Vol. 7, 2012
7674
40. E. Bakker, and E. Pretsch, Trends. Anal. Chem., 24 (2005) 199.
41. A. Radu, S. Peper, E. Bakker, and D. Diamond, Electroanalysis, 19 (2007) 144.
42. M. R. Ganjali, S. Rasoolipour, M. Rezapour, P. Norouzi, A. Tajarodi, and Y. Hanifehpour,
Electroanalysis 17 (2005) 1534.
43. M. R. Ganjali, P. Norouzi, M. Adib, and A. Ahmadalinezhad, Anal. Lett. 39 (2006) 1075.
44. H. A. Zamani, M. R. Ganjali, P. Norouzi, and M. Adib, Mater. Sci. Eng. C, 28 (2008) 157. 45. H. A. Zamani, M. R. Ganjali, P. Norouzi, A. Tadjarodi, and E. Shahsavani, Mater. Sci. Eng. C, 28
(2008) 1489. 46. M. R. Abedi, H. A. Zamani, M. R. Ganjali, and P. Norouzi, Sensor Lett., 5 (2007) 516.
© 2012 by ESG (www.electrochemsci.org)