synergetic pretreatment of sewage sludge by microwave irradiation in presence of h2o2 for enhanced...
TRANSCRIPT
w a t e r r e s e a r c h 4 2 ( 2 0 0 8 ) 4 6 7 4 – 4 6 8 2
Avai lab le at www.sc iencedi rect .com
journa l homepage : www.e lsev i er . com/ loca te /wat res
Synergetic pretreatment of sewage sludge by microwaveirradiation in presence of H2O2 for enhanced anaerobicdigestion
Cigdem Eskicioglua,*, Audrey Prorotb, Juan Marinc, Ronald L. Drostec, Kevin J. Kennedyc
aSchool of Engineering, University of British Columbia Okanagan, Kelowna, BC V1V 1V7, CanadabEcole Nationale Superieure d’Ingenieurs de Limoges, Universite de Limoges, FrancecDepartment of Civil Engineering, University of Ottawa, Ottawa, ON K1N 6N5, Canada
a r t i c l e i n f o
Article history:
Received 21 April 2008
Received in revised form
7 August 2008
Accepted 8 August 2008
Published online 19 August 2008
Keywords:
Microwave
Hydrogen peroxide
Pretreatment
Oxidation
WAS
Anaerobic biodegradability
* Corresponding author. Tel.: þ1 250 807 854E-mail address: [email protected]
0043-1354/$ – see front matter ª 2008 Elsevidoi:10.1016/j.watres.2008.08.010
a b s t r a c t
A microwave-enhanced advanced hydrogen peroxide oxidation process (MW/H2O2-AOP)
was studied in order to investigate the synergetic effects of MW irradiation on H2O2 treated
waste activated sludges (WAS) in terms of mineralization (permanent stabilization), sludge
disintegration/solubilization, and subsequent anaerobic biodegradation as well as dew-
aterability after digestion. Thickened WAS sample pretreated with 1 g H2O2/g total solids
(TS) lost 11–34% of its TS, total chemical oxygen demand (COD) and total biopolymers
(humic acids, proteins and sugars) via advanced oxidation. In a temperature range of
60–120 �C, elevated MW temperatures (>80 �C) further increased the decomposition of H2O2
into OH� radicals and enhanced both oxidation of COD and solubilization of particulate
COD (>0.45 micron) of WAS indicating that a synergetic effect was observed when both
H2O2 and MW treatments were combined. However, at all temperatures tested, MW/H2O2
treated samples had lower first-order mesophilic (33� 2 �C) biodegradation rate constants
and ultimate (after 32 days of digestion) methane yields (mL per gram sample) compared to
control and MW irradiated WAS samples, indicating that synergistically (MW/H2O2-AOP)
generated soluble organics were slower to biodegrade or more refractory than those
generated during MW irradiation.
ª 2008 Elsevier Ltd. All rights reserved.
1. Introduction biphenyls, polycyclic aromatic hydrocarbons or dioxins. New
In Canada, approximately 670,000 tons of dry sewage sludge
(biosolids) is produced yearly and existing wastewater treat-
ment plants (WWTPs) are expanding to serve the demands of
growing cities, which will result in an increase of sludge
production in the future (Renzetti, 2005). Furthermore, the
quality of waste sludge is worsening as a result of the presence
of anthropogenic micropollutants, such as heavy metals,
personal care products, endocrine disrupters, polychlorinated
4; fax: þ1 250 807 9850.(C. Eskicioglu).
er Ltd. All rights reserved
and practical WWTP sludge reduction approaches would not
only reduce the operational and capital costs associated with
sludge management and disposal, but also result in the
production of less biosolids and fewer deleterious environ-
mental effects when sent to landfill or agricultural land.
Concomitantly, there is world-wide interest in three main
sludge reduction strategies, applied: (a) in the wastewater line
(energy uncouplers and alternating stream exposure to oxic
and anoxic environments), (b) in the sludge line [physical,
.
w a t e r r e s e a r c h 4 2 ( 2 0 0 8 ) 4 6 7 4 – 4 6 8 2 4675
chemical, thermal or combination pretreatments for
enhanced hydrolysis before anaerobic digestion (AD)], and (c)
in the final waste line (incineration and pyrolysis).
Mesophilic AD (MAD) of excess sewage sludge is an
economic and environmentally friendly approach for meeting
the legislative requirements and to reduce the volume of
sludge to be disposed or land applied. However, MAD has
several limitations: (a) reduction of fecal coliforms does not
meet required standards, and (b) the extent of solids
destruction is limited. Many different pretreatment technol-
ogies were previously investigated to overcome these limita-
tions. Previous studies indicated that sludge line pretreatment
processes such as mechanical (Muller et al., 2003), ultrasonic
(Bougrier et al., 2006), steam explosion (Dereix et al., 2006),
microwave (MW) irradiation (Hong, 2002; Eskicioglu et al.,
2008), chemical (Chiu et al., 1997) and enzymatic (Barjenbruch
and Kopplow, 2003) methods could disrupt extracellular
polymeric substances (EPS) and divalent cation network and
increase the extent of WAS biodegradability through
enhanced hydrolysis. Unfortunately, some of these tech-
niques require intense operational conditions of high pressure
and temperature making the process expensive and
increasing safety concerns. However, several studies sug-
gested that combining the techniques mentioned above can
achieve better or similar results under more acceptable
operating conditions.
In the past, several oxidants with disinfecting power such
as ozone, hydrogen peroxide, chlorine, and chlorine dioxide
have been applied to disintegrate the sewage sludge, although
only few have been combined with anaerobic post-treatments
(Weemaes et al., 2000; Bougrier et al., 2006). Hydrogen
peroxide (H2O2) is one of the most powerful oxidizers known.
From the thermodynamic point of view, it is stronger than
chlorine (Cl2) and chlorine dioxide (ClO2) as standard redox
potential of H2O2 is greater than Cl2 and ClO2. However, its
activity or rate of decomposition is dependent on the
temperature and at room temperature is usually catalyzed by
transition materials such as Ag or Mo; therefore it is much
slower than other two oxidants. H2O2 is also used as a geno-
toxic agent which causes breakage of DNA strands by
generation of hydroxyl radicals (OH�) close to a DNA molecule
according to the Fenton reaction (Imlay et al., 1988). Exposure
of DNA to oxidative stress leads to more than 20 different
types of base damage, producing oxidized and ring-fermented
nitrogen bases (Slupphaug et al., 2003) as well as causing
permeabilization of cell membranes (Alvarez et al., 1987) and
changes in membrane fluidity and induction of apoptosis
(Griveau and LeLannou, 1997). Through catalysis, H2O2 can be
converted into OH� radicals (with an oxidation potential of
2.8 V) that are much more reactive than H2O2 and O3 with
oxidation potentials of 1.8 and 2.1 V, respectively. Therefore,
the oxidation power of H2O2 can be enhanced via a number of
treatment scenarios including O3/H2O2, UV/H2O2, H2O2/ultra-
sound and H2O2/thermal process. When H2O2 is added to the
system with O3, the decomposition of O3 into OH� radicals is
accelerated, shifting the process entirely to an advanced
oxygen process (AOP). Similarly, when H2O2 and UV are
combined, H2O2 absorbs the UV light and breaks down into
OH� radicals which degrade the contaminants in the sample
(Rosenfeldt et al., 2006). Furthermore, heating will also
increase decomposition of H2O2 into OH� radicals and there-
fore enhance the oxidation process when H2O2 is applied
simultaneously with conventional or microwave (MW)
heating.
In the field of bacteriology, synergistic killing of bacterial
spores by UV or MW radiation combined with H2O2 has been
previously observed (Hartman and Eisenstark, 1978; Bayliss
and Waites, 1979; Kuchma et al., 1990). In the field of envi-
ronmental engineering, the application of MW irradiation
(a closed-vessel MW digestion system, 2450 MHz, 1000 W) in
combination with H2O2 for sewage sludge treatment has been
recently developed as a novel microwave-enhanced advanced
oxidation process (MW/H2O2-AOP) (Wong et al., 2006a,b; Yin
et al., 2007; Chan et al., 2007). Their research focused on the
investigation of combined effects of MW/H2O2-AOP and MW/
H2O2/O3-AOP to solubilize and then recover the nutrients
(ammonia, ortho-phosphate) from a secondary aerobic sludge
for the purpose of magnesium ammonium phosphate (stru-
vite) crystallization. In a temperature range of 60–120 �C,
addition of H2O2 [2.6 and 5.4 g H2O2/g total solid (TS)]
enhanced ammonia release and resulted in a significant
decrease in PO4:NH3 ratio, an important parameter controlling
the struvite formation (Wong et al., 2006b). In terms of COD,
ammonia and ortho-phosphate solubilization, H2O2 was
a better oxidant than O3 when combined with MW alone (MW/
H2O2-AOP or MW/O3-AOP) and there was an advantage of
using a combination of three agents (MW/H2O2/O3-AOP) (Yin
et al., 2007). None of these studies included anaerobic post-
treatment of sludge after MW/H2O2-AOP before final disposal;
however, it is postulated that attaining very high COD solu-
bilization would greatly improve the efficiency of subsequent
AD with enhanced methane production.
This is the first study that evaluates the synergetic effects
of a MW/H2O2-AOP process for a thickened waste activated
sludge (TWAS) in terms of: (a) oxidation, (b) disintegration and
solubilization, (c) MAD and (d) dewaterability after MAD.
2. Materials and methods
2.1. Thickened waste activated sludge (TWAS)
Raw TWAS was obtained from the thickener centrifuge at the
Robert O. Pickard Environmental Center (ROPEC) located in Glou-
cester, (ON, Canada). ROPEC has preliminary and primary
treatment followed by a conventional aerobic activated sludge
unit operated at an average sludge retention time (SRT) of 5 d.
Ferric chloride is added to WAS for P removal prior to WAS
thickening. TWAS and primary sludge (PS) are blended in
a 58:42 (v/v) ratio and undergo mesophilic anaerobic sludge
digestion to produce a stabilized biosolids product for
disposal. For feed characterization, raw TWAS was sampled
from ROPEC and its general characteristics are displayed in
Table 1 along with the changes in its characterization during
the pretreatments before the anaerobic tests. In the labora-
tory, the TWAS collected from ROPEC in different buckets was
mixed a few times in a larger bucket to ensure homogeneity
and each sample used for pretreatments or characterization
was obtained upon thorough mixing a bucket with a stirring
rod. Raw TWAS was characterized as young sludge based on
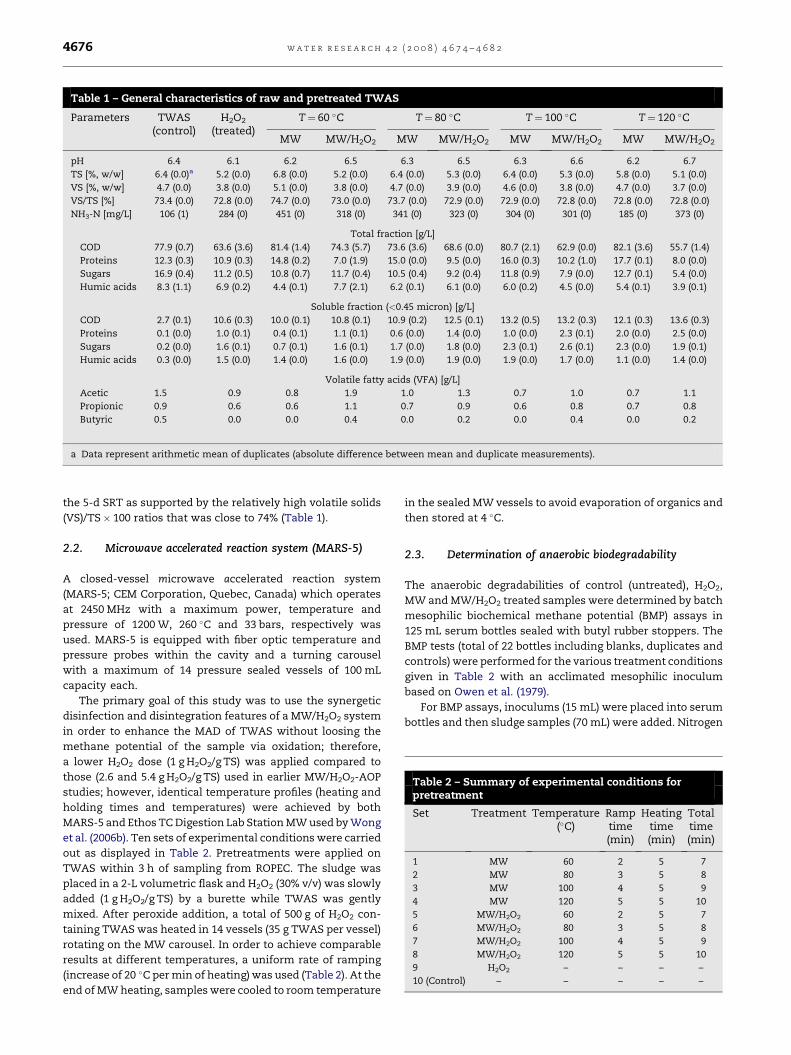
Table 1 – General characteristics of raw and pretreated TWAS
Parameters TWAS(control)
H2O2
(treated)T¼ 60 �C T¼ 80 �C T¼ 100 �C T¼ 120 �C
MW MW/H2O2 MW MW/H2O2 MW MW/H2O2 MW MW/H2O2
pH 6.4 6.1 6.2 6.5 6.3 6.5 6.3 6.6 6.2 6.7
TS [%, w/w] 6.4 (0.0)a 5.2 (0.0) 6.8 (0.0) 5.2 (0.0) 6.4 (0.0) 5.3 (0.0) 6.4 (0.0) 5.3 (0.0) 5.8 (0.0) 5.1 (0.0)
VS [%, w/w] 4.7 (0.0) 3.8 (0.0) 5.1 (0.0) 3.8 (0.0) 4.7 (0.0) 3.9 (0.0) 4.6 (0.0) 3.8 (0.0) 4.7 (0.0) 3.7 (0.0)
VS/TS [%] 73.4 (0.0) 72.8 (0.0) 74.7 (0.0) 73.0 (0.0) 73.7 (0.0) 72.9 (0.0) 72.9 (0.0) 72.8 (0.0) 72.8 (0.0) 72.8 (0.0)
NH3-N [mg/L] 106 (1) 284 (0) 451 (0) 318 (0) 341 (0) 323 (0) 304 (0) 301 (0) 185 (0) 373 (0)
Total fraction [g/L]
COD 77.9 (0.7) 63.6 (3.6) 81.4 (1.4) 74.3 (5.7) 73.6 (3.6) 68.6 (0.0) 80.7 (2.1) 62.9 (0.0) 82.1 (3.6) 55.7 (1.4)
Proteins 12.3 (0.3) 10.9 (0.3) 14.8 (0.2) 7.0 (1.9) 15.0 (0.0) 9.5 (0.0) 16.0 (0.3) 10.2 (1.0) 17.7 (0.1) 8.0 (0.0)
Sugars 16.9 (0.4) 11.2 (0.5) 10.8 (0.7) 11.7 (0.4) 10.5 (0.4) 9.2 (0.4) 11.8 (0.9) 7.9 (0.0) 12.7 (0.1) 5.4 (0.0)
Humic acids 8.3 (1.1) 6.9 (0.2) 4.4 (0.1) 7.7 (2.1) 6.2 (0.1) 6.1 (0.0) 6.0 (0.2) 4.5 (0.0) 5.4 (0.1) 3.9 (0.1)
Soluble fraction (<0.45 micron) [g/L]
COD 2.7 (0.1) 10.6 (0.3) 10.0 (0.1) 10.8 (0.1) 10.9 (0.2) 12.5 (0.1) 13.2 (0.5) 13.2 (0.3) 12.1 (0.3) 13.6 (0.3)
Proteins 0.1 (0.0) 1.0 (0.1) 0.4 (0.1) 1.1 (0.1) 0.6 (0.0) 1.4 (0.0) 1.0 (0.0) 2.3 (0.1) 2.0 (0.0) 2.5 (0.0)
Sugars 0.2 (0.0) 1.6 (0.1) 0.7 (0.1) 1.6 (0.1) 1.7 (0.0) 1.8 (0.0) 2.3 (0.1) 2.6 (0.1) 2.3 (0.0) 1.9 (0.1)
Humic acids 0.3 (0.0) 1.5 (0.0) 1.4 (0.0) 1.6 (0.0) 1.9 (0.0) 1.9 (0.0) 1.9 (0.0) 1.7 (0.0) 1.1 (0.0) 1.4 (0.0)
Volatile fatty acids (VFA) [g/L]
Acetic 1.5 0.9 0.8 1.9 1.0 1.3 0.7 1.0 0.7 1.1
Propionic 0.9 0.6 0.6 1.1 0.7 0.9 0.6 0.8 0.7 0.8
Butyric 0.5 0.0 0.0 0.4 0.0 0.2 0.0 0.4 0.0 0.2
a Data represent arithmetic mean of duplicates (absolute difference between mean and duplicate measurements).
Table 2 – Summary of experimental conditions forpretreatment
Set Treatment Temperature(�C)
Ramptime(min)
Heatingtime(min)
Totaltime(min)
1 MW 60 2 5 7
2 MW 80 3 5 8
3 MW 100 4 5 9
4 MW 120 5 5 10
5 MW/H2O2 60 2 5 7
6 MW/H2O2 80 3 5 8
7 MW/H2O2 100 4 5 9
8 MW/H2O2 120 5 5 10
9 H2O2 – – – –
10 (Control) – – – – –
w a t e r r e s e a r c h 4 2 ( 2 0 0 8 ) 4 6 7 4 – 4 6 8 24676
the 5-d SRT as supported by the relatively high volatile solids
(VS)/TS� 100 ratios that was close to 74% (Table 1).
2.2. Microwave accelerated reaction system (MARS-5)
A closed-vessel microwave accelerated reaction system
(MARS-5; CEM Corporation, Quebec, Canada) which operates
at 2450 MHz with a maximum power, temperature and
pressure of 1200 W, 260 �C and 33 bars, respectively was
used. MARS-5 is equipped with fiber optic temperature and
pressure probes within the cavity and a turning carousel
with a maximum of 14 pressure sealed vessels of 100 mL
capacity each.
The primary goal of this study was to use the synergetic
disinfection and disintegration features of a MW/H2O2 system
in order to enhance the MAD of TWAS without loosing the
methane potential of the sample via oxidation; therefore,
a lower H2O2 dose (1 g H2O2/g TS) was applied compared to
those (2.6 and 5.4 g H2O2/g TS) used in earlier MW/H2O2-AOP
studies; however, identical temperature profiles (heating and
holding times and temperatures) were achieved by both
MARS-5 and Ethos TC Digestion Lab Station MW used by Wong
et al. (2006b). Ten sets of experimental conditions were carried
out as displayed in Table 2. Pretreatments were applied on
TWAS within 3 h of sampling from ROPEC. The sludge was
placed in a 2-L volumetric flask and H2O2 (30% v/v) was slowly
added (1 g H2O2/g TS) by a burette while TWAS was gently
mixed. After peroxide addition, a total of 500 g of H2O2 con-
taining TWAS was heated in 14 vessels (35 g TWAS per vessel)
rotating on the MW carousel. In order to achieve comparable
results at different temperatures, a uniform rate of ramping
(increase of 20 �C per min of heating) was used (Table 2). At the
end of MW heating, samples were cooled to room temperature
in the sealed MW vessels to avoid evaporation of organics and
then stored at 4 �C.
2.3. Determination of anaerobic biodegradability
The anaerobic degradabilities of control (untreated), H2O2,
MW and MW/H2O2 treated samples were determined by batch
mesophilic biochemical methane potential (BMP) assays in
125 mL serum bottles sealed with butyl rubber stoppers. The
BMP tests (total of 22 bottles including blanks, duplicates and
controls) were performed for the various treatment conditions
given in Table 2 with an acclimated mesophilic inoculum
based on Owen et al. (1979).
For BMP assays, inoculums (15 mL) were placed into serum
bottles and then sludge samples (70 mL) were added. Nitrogen
w a t e r r e s e a r c h 4 2 ( 2 0 0 8 ) 4 6 7 4 – 4 6 8 2 4677
sparging was applied to batch reactors when TWAS and
inoculum were mixed to prevent exposure to air. Serum
bottles (120 mL) were sealed after addition of a mixture con-
taining equal parts of NaHCO3 and KHCO3 to achieve an
alkalinity of 4000 mg/L (as CaCO3). Serum bottles were kept in
a darkened temperature controlled incubator shaker moving
at 90 rpm in a temperature controlled room at 33� 2 �C until
they stopped producing biogas. Daily biogas produced was
measured by inserting a needle attached to a manometer.
2.4. Mesophilic inoculum acclimation
Mesophilic inoculum used in BMP assays was originally taken
from the effluent line of the anaerobic sludge digesters (SRT of
15–20 d) treating a mixture of TWAS and PS [58:42 (v/v)] at
ROPEC. Before setting up the BMP assays, ROPEC inoculum
was acclimated to MW irradiated TWAS. For acclimation, one
5-L anaerobic semi-continuous reactor with ROPEC inoculum,
fed with MW irradiated ROPEC-TWAS, was run at an SRT of
approximately 20 d over a year. MW toxicity effect on
secondary sludge digestion was expected to increase with MW
temperature (Hong, 2002; Eskicioglu et al., 2007a); therefore,
a severe MW pretreatment temperature (room temperature to
175 �C by MARS-5 @20 �C/min with zero hold time) was used to
pretreat the sludge fed to the acclimation reactor. The accli-
mated inoculum had the following characteristics: TS: 1.8%
(w/w), VS: 0.9% (w/w), VS/TS�100: 51.5%, pH: 7.72, total vola-
tile fatty acids (summation of acetic, propionic and butyric
acids): 397 mg/L.
2.5. Analysis
All sample analyses were performed for control and pre-
treated samples at room temperature. Total and volatile solids
were determined based on Standard Methods procedure
2540G (APHA, 1995). For ammonia-N determination, centrifu-
gation [for 20 min at 5856 relative centrifugal force (RCF) in
a Dupont instruments Sorvall SS-3 automatic centrifuge] was
used and ammonia-N measurements were performed using
an ORION Model 95-12 ammonia gas sensing electrode con-
nected to a Fisher Accumet pH meter model 750. The analysis
was conducted according to Standard Methods 4500D proce-
dure (APHA, 1995) and reported as ammonia-N. Colorimetric
COD measurements were performed based on Standard
Methods procedure 5250D (APHA, 1995) with a Coleman Per-
kin–Elmer spectrophotometer Model 295 at 600 nm light
absorbance. Before soluble COD determination, sludge
samples were centrifuged (for 20 min at 5856 RCF) and filtered
through membrane disc filters first with 1.2 mm (Whatman-
Glass Microfiber, Catalog no: 1822 070) and then with 0.45 mm
(Fisher-Nitrocellulose, Catalog no: 09-719-555) pore sizes.
Reactor pH, total volatile fatty acids (VFAs; summation of
acetic, propionic and butyric acids) and biogas composition
(nitrogen, methane and carbon dioxide percentage) were
monitored weekly during the batch AD. Total VFAs were
measured by injecting supernatants into an HP 5840A GC with
glass packed column (Chromatographic Specialties Inc.,
Brockville, ON, Canada, Chromosorb 101, packing mesh size:
80/100, column length� ID: 3.05 m� 2.1 mm) and a flame
ionization detector (oven, inlet and outlet temperatures: 180,
250 and 350 �C, respectively, carrier gas flowrate: 25 mL
helium/min) equipped with HP 7672A autosampler (van
Huyssteen, 1967). Biogas composition was determined with an
HP 5710A GC with metal packed column (Chromatographic
Specialties Inc., Brockville, ON, Canada, Porapak T, packing
mesh size: 50/80, column length�OD: 3.05 m� 6.35 mm) and
thermal conductivity detector (oven, inlet and outlet temper-
atures: 70, 100 and 150 �C, respectively) using helium as the
carrier gas (flowrate: 25 mL/min) (Ackman, 1972). The protein
and humic acid concentrations in both total and soluble
(<0.45 mm) fractions were measured by the modified Lowry
method (Frolund et al., 1995) using bovine serum albumin
(BSA) and humic acid sodium salt (H16752, Sigma–Aldrich
Canada Ltd.) as protein and humic acid standards, respec-
tively. Concentrations of total and soluble sugars were
measured according to the method of Dubois et al. (1956) with
glucose stock solution used as the sugar standard.
Dewaterability of WAS at the end of digestion was tested by
a Capillary Suction Timer [Model 440, Fann Instrument
Company, TX, USA] based on Standard Methods Procedure
2710G (APHA, 1995). The method consists of injecting a sludge
sample to a small cylinder placed on a sheet of chromatog-
raphy paper. While the paper extracts liquid from the sludge
by capillary suction, water released from sludge travels
between two contact points on the chromatography paper and
then the travel time or capillary suction time (CST in seconds)
is recorded by a digital timer. In this project, sludge temper-
ature and volume were kept constant (22� 1 �C and 5 mL,
respectively) since variations in temperature and sample
volume can affect CST results. At the end of experiments, CST
values indicated by the timer were divided by TS concentra-
tion of sludge samples in order to prevent bias among samples
with different solid concentrations.
3. Results and discussion
3.1. Oxidation and disintegration effects of MW, H2O2
and MW/H2O2 treatments
Hydrogen peroxide, as a strong oxidizer, converts some of the
sensitive organic compounds to CO2 and water in addition to
many others oxidized to other organics containing stable
functional groups; therefore it will provide some level of
permanent stabilization. Table 1 indicates the effects of MW
and MW/H2O2 treatments on total organic matter composition
of ROPEC-TWAS in terms of TS, total COD, total proteins, total
sugars, total humic acids as well as supernatant NH3–N
concentrations. In this study, hydrogen peroxide oxidized
a portion of sludge in H2O2 and MW/H2O2 treated samples and
caused reductions in the total organic solids and biopolymers.
The TWAS sample, treated with H2O2 (1 g H2O2/g TS), lost
19� 0, 18� 5, 11� 3, 34� 3 and 16� 2% of TS, COD, proteins,
sugars and humic acid concentrations, respectively, through
oxidation compared to controls (Table 1). The concentration of
organic compounds present in the TWAS samples decreased
further when H2O2 was combined with MW irradiation espe-
cially at temperatures above 80 �C. At a MW temperature of
120 �C, MW/H2O2 samples experienced additional 2, 12, 27, 52
and 45% reductions in their TS, COD, proteins, sugars and
w a t e r r e s e a r c h 4 2 ( 2 0 0 8 ) 4 6 7 4 – 4 6 8 24678
humic acids concentrations, respectively, compared to the
H2O2 treated sample. The level of permanent stabilizations in
similar samples (MW/H2O2 at 120 �C) were 20� 0%, 28� 2%,
35� 0%, 68� 0% and 53� 1% for TS, COD, proteins, sugars and
humic acids compared to the original raw TWAS (control)
sample. It is possible that the elevated MW temperatures
increased the decomposition of H2O2 into OH� radicals and
enhanced the oxidation process when both MW and H2O2 are
applied. Among organic substances studied, the sugars and
humic acids experienced the highest level of reductions after
H2O2 (16–34%) and MW/H2O2 (53–68%) treatments at 120 �C
(Table 1).
The concentration of NH3–N in the supernatant of TWAS
before and after MW, H2O2 and MW/H2O2 treatments were
also shown in Table 1. All pretreatment scenarios contained
higher NH3–N in their supernatants compared to that of
control. Both H2O2 treatment and MW irradiation resulted in
significant (2–4 fold) ammonia release into solution over the
control. These results are in agreement with previous studies
which concluded that both MW and MW/H2O2 treatments
enhance the release of ammonia depending on the MW
temperature and H2O2 concentration (Wong et al., 2006b; Yin
et al., 2007). Among the pretreatment temperatures tested, the
TWAS sample pretreated at 60 �C contained the highest
ammonia concentration which was 451 mg/L. The other
TWAS samples pretreated at 80, 100 and 120 �C had NH3–N
concentrations of 341, 304 and 185 mg/L, respectively (Table 1).
The reason for the reductions in the NH3–N concentrations of
TWAS samples near boiling point MW temperatures (without
presence of H2O2) is currently unknown but has been
previously observed in other studies by both household
(Eskicioglu et al., 2007a) and closed-vessel type MW units
(Wong et al., 2006b; Eskicioglu et al., 2007b).
The combined effects of MW/H2O2 to disintegrate the
complex floc structure of WAS and to solubilize the intra- and
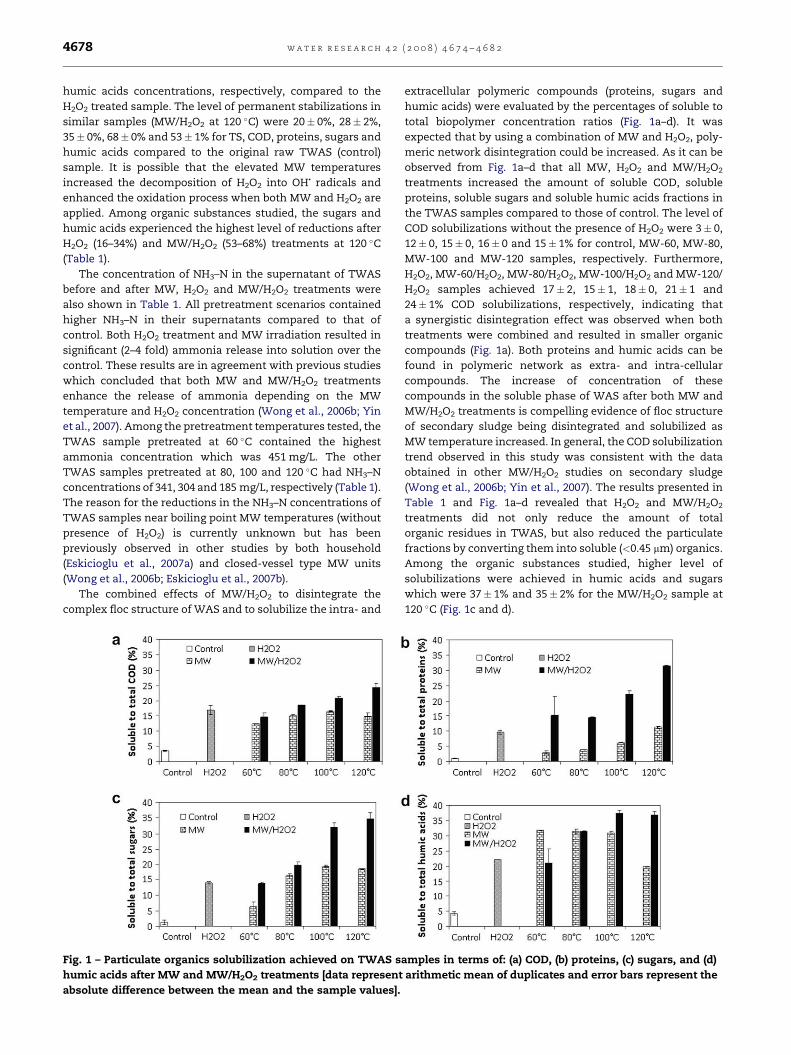
Fig. 1 – Particulate organics solubilization achieved on TWAS s
humic acids after MW and MW/H2O2 treatments [data represent
absolute difference between the mean and the sample values].
extracellular polymeric compounds (proteins, sugars and
humic acids) were evaluated by the percentages of soluble to
total biopolymer concentration ratios (Fig. 1a–d). It was
expected that by using a combination of MW and H2O2, poly-
meric network disintegration could be increased. As it can be
observed from Fig. 1a–d that all MW, H2O2 and MW/H2O2
treatments increased the amount of soluble COD, soluble
proteins, soluble sugars and soluble humic acids fractions in
the TWAS samples compared to those of control. The level of
COD solubilizations without the presence of H2O2 were 3� 0,
12� 0, 15� 0, 16� 0 and 15� 1% for control, MW-60, MW-80,
MW-100 and MW-120 samples, respectively. Furthermore,
H2O2, MW-60/H2O2, MW-80/H2O2, MW-100/H2O2 and MW-120/
H2O2 samples achieved 17� 2, 15� 1, 18� 0, 21� 1 and
24� 1% COD solubilizations, respectively, indicating that
a synergistic disintegration effect was observed when both
treatments were combined and resulted in smaller organic
compounds (Fig. 1a). Both proteins and humic acids can be
found in polymeric network as extra- and intra-cellular
compounds. The increase of concentration of these
compounds in the soluble phase of WAS after both MW and
MW/H2O2 treatments is compelling evidence of floc structure
of secondary sludge being disintegrated and solubilized as
MW temperature increased. In general, the COD solubilization
trend observed in this study was consistent with the data
obtained in other MW/H2O2 studies on secondary sludge
(Wong et al., 2006b; Yin et al., 2007). The results presented in
Table 1 and Fig. 1a–d revealed that H2O2 and MW/H2O2
treatments did not only reduce the amount of total
organic residues in TWAS, but also reduced the particulate
fractions by converting them into soluble (<0.45 mm) organics.
Among the organic substances studied, higher level of
solubilizations were achieved in humic acids and sugars
which were 37� 1% and 35� 2% for the MW/H2O2 sample at
120 �C (Fig. 1c and d).
amples in terms of: (a) COD, (b) proteins, (c) sugars, and (d)
arithmetic mean of duplicates and error bars represent the
w a t e r r e s e a r c h 4 2 ( 2 0 0 8 ) 4 6 7 4 – 4 6 8 2 4679
It is also necessary to emphasize that so far, different MW
pretreatment studies achieved different soluble to total COD
ratios at similar MW temperatures depending on the ramp,
heating/holding times, MW units used (kitchen or closed-
vessel) as well as the characteristics of secondary sludge
being pretreated (moisture content, SRT of the activated
sludge process, and chemicals added for thickening or
nutrient removal at the WWTP). In another study, for an
anaerobically digested biocake sample, in a ramp range of
1.95–7.8 �C/min, increasing the ramp rate (shorter exposure
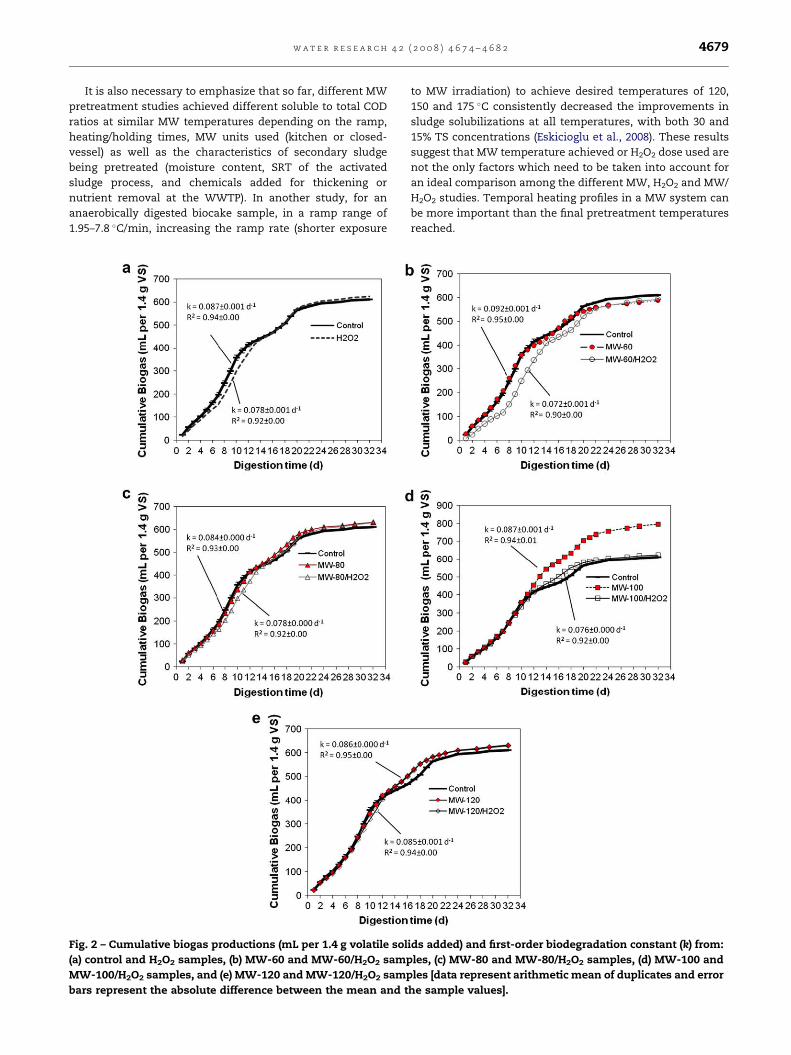
Fig. 2 – Cumulative biogas productions (mL per 1.4 g volatile sol
(a) control and H2O2 samples, (b) MW-60 and MW-60/H2O2 samp
MW-100/H2O2 samples, and (e) MW-120 and MW-120/H2O2 samp
bars represent the absolute difference between the mean and t
to MW irradiation) to achieve desired temperatures of 120,
150 and 175 �C consistently decreased the improvements in
sludge solubilizations at all temperatures, with both 30 and
15% TS concentrations (Eskicioglu et al., 2008). These results
suggest that MW temperature achieved or H2O2 dose used are
not the only factors which need to be taken into account for
an ideal comparison among the different MW, H2O2 and MW/
H2O2 studies. Temporal heating profiles in a MW system can
be more important than the final pretreatment temperatures
reached.
ids added) and first-order biodegradation constant (k) from:
les, (c) MW-80 and MW-80/H2O2 samples, (d) MW-100 and
les [data represent arithmetic mean of duplicates and error
he sample values].
w a t e r r e s e a r c h 4 2 ( 2 0 0 8 ) 4 6 7 4 – 4 6 8 24680
3.2. Anaerobic biodegradability and dewaterability afterMW, H2O2 and MW/H2O2 treatments
Anaerobic biodegradability or BMP of control and pretreated
WAS samples was tested at mesophilic temperature
(33� 2 �C) in 125-mL serum bottles. The BMP assays were
designed in a way to reveal valuable information on both
initial methane production (biodegradation rate and toxicity
relative to control) and cumulative final methane production
(ultimate biodegradability). Comparing the sample charac-
terizations after pretreatments indicated significant
reductions in the total organics remaining after H2O2 and MW/
H2O2 treatments (Table 1); therefore, organic loading adjust-
ments were required during the initial BMP set-up. To be able
to compare the biodegradation rates in different samples
properly, initial organic loadings were adjusted to 1.42 g VS in
each BMP bottle and daily biogas productions were then
monitored. Fig. 2a–e indicates the first-order anaerobic
biodegradation constants (k, d�1) as well as the coefficient of
determination (R2), which is used as the primary discriminator
to evaluate the adequacy of fit between measured and pre-
dicted cumulative biogas productions. It was interesting to
observe that although H2O2 and MW/H2O2 treated samples
contained significant amounts of higher soluble organics
(proteins, sugars, humic acids, etc.) compared to control and
MW treated samples (Table 1 and Fig. 1a–d), these soluble
fractions were not metabolized more rapidly than others, and
therefore did not yield conclusive differences in the anaerobic
biodegradation rates (k). In fact, H2O2 and MW/H2O2 samples
yielded slightly lower k constants at all tested MW tempera-
tures compared to control and MW irradiated samples indi-
cating that some products were formed during H2O2 addition
and digested at a slower rate (Fig. 2a–e). Toxicity of both
conventionally heated (CH) and MW irradiated samples at 45,
65 and 100 �C have been previously studied and compared to
untreated samples by other researchers as well. In another
study (Hong, 2002), among three different sludge samples
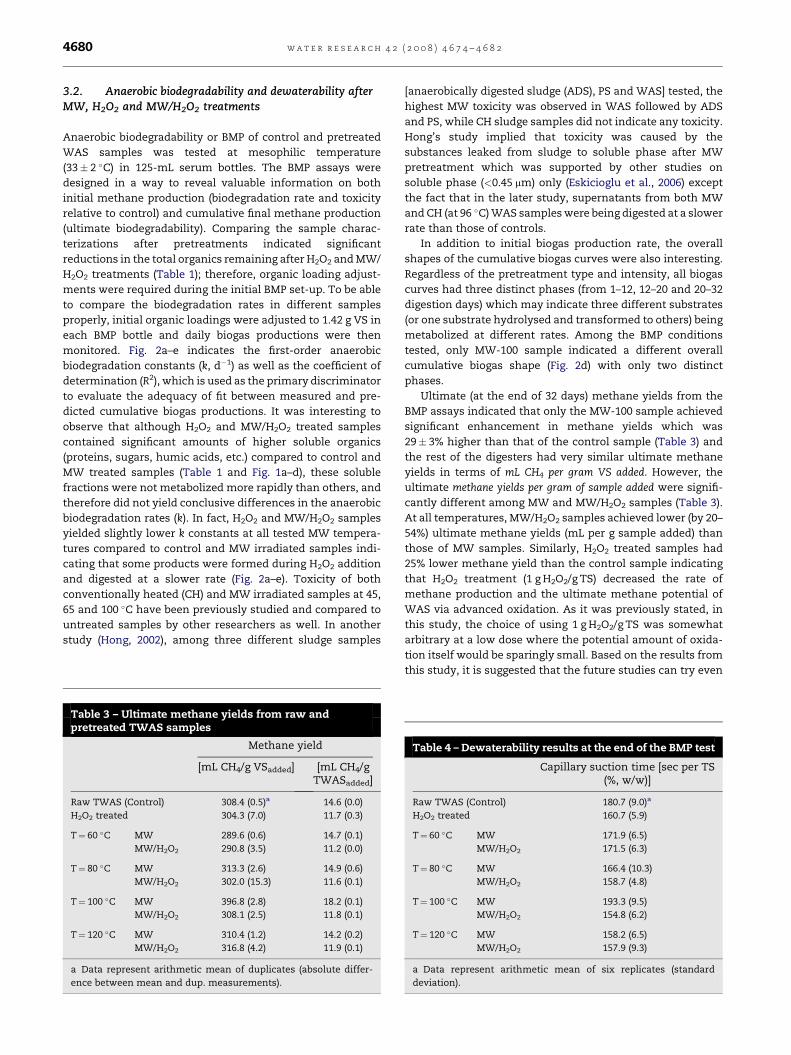
Table 3 – Ultimate methane yields from raw andpretreated TWAS samples
Methane yield
[mL CH4/g VSadded] [mL CH4/gTWASadded]
Raw TWAS (Control) 308.4 (0.5)a 14.6 (0.0)
H2O2 treated 304.3 (7.0) 11.7 (0.3)
T¼ 60 �C MW 289.6 (0.6) 14.7 (0.1)
MW/H2O2 290.8 (3.5) 11.2 (0.0)
T¼ 80 �C MW 313.3 (2.6) 14.9 (0.6)
MW/H2O2 302.0 (15.3) 11.6 (0.1)
T¼ 100 �C MW 396.8 (2.8) 18.2 (0.1)
MW/H2O2 308.1 (2.5) 11.8 (0.1)
T¼ 120 �C MW 310.4 (1.2) 14.2 (0.2)
MW/H2O2 316.8 (4.2) 11.9 (0.1)
a Data represent arithmetic mean of duplicates (absolute differ-
ence between mean and dup. measurements).
[anaerobically digested sludge (ADS), PS and WAS] tested, the
highest MW toxicity was observed in WAS followed by ADS
and PS, while CH sludge samples did not indicate any toxicity.
Hong’s study implied that toxicity was caused by the
substances leaked from sludge to soluble phase after MW
pretreatment which was supported by other studies on
soluble phase (<0.45 mm) only (Eskicioglu et al., 2006) except
the fact that in the later study, supernatants from both MW
and CH (at 96 �C) WAS samples were being digested at a slower
rate than those of controls.
In addition to initial biogas production rate, the overall
shapes of the cumulative biogas curves were also interesting.
Regardless of the pretreatment type and intensity, all biogas
curves had three distinct phases (from 1–12, 12–20 and 20–32
digestion days) which may indicate three different substrates
(or one substrate hydrolysed and transformed to others) being
metabolized at different rates. Among the BMP conditions
tested, only MW-100 sample indicated a different overall
cumulative biogas shape (Fig. 2d) with only two distinct
phases.
Ultimate (at the end of 32 days) methane yields from the
BMP assays indicated that only the MW-100 sample achieved
significant enhancement in methane yields which was
29� 3% higher than that of the control sample (Table 3) and
the rest of the digesters had very similar ultimate methane
yields in terms of mL CH4 per gram VS added. However, the
ultimate methane yields per gram of sample added were signifi-
cantly different among MW and MW/H2O2 samples (Table 3).
At all temperatures, MW/H2O2 samples achieved lower (by 20–
54%) ultimate methane yields (mL per g sample added) than
those of MW samples. Similarly, H2O2 treated samples had
25% lower methane yield than the control sample indicating
that H2O2 treatment (1 g H2O2/g TS) decreased the rate of
methane production and the ultimate methane potential of
WAS via advanced oxidation. As it was previously stated, in
this study, the choice of using 1 g H2O2/g TS was somewhat
arbitrary at a low dose where the potential amount of oxida-
tion itself would be sparingly small. Based on the results from
this study, it is suggested that the future studies can try even
Table 4 – Dewaterability results at the end of the BMP test
Capillary suction time [sec per TS(%, w/w)]
Raw TWAS (Control) 180.7 (9.0)a
H2O2 treated 160.7 (5.9)
T¼ 60 �C MW 171.9 (6.5)
MW/H2O2 171.5 (6.3)
T¼ 80 �C MW 166.4 (10.3)
MW/H2O2 158.7 (4.8)
T¼ 100 �C MW 193.3 (9.5)
MW/H2O2 154.8 (6.2)
T¼ 120 �C MW 158.2 (6.5)
MW/H2O2 157.9 (9.3)
a Data represent arithmetic mean of six replicates (standard
deviation).
w a t e r r e s e a r c h 4 2 ( 2 0 0 8 ) 4 6 7 4 – 4 6 8 2 4681
a lower dose (w0.5 g H2O2/g TS) in order to minimize further
loss of methane potential via advanced oxidation.
As a first MW/H2O2-AOP study to enhance WAS biodegra-
dation, these results are in agreement with other sludge
pretreatment studies which combined conventional heating
(in a mechanically stirred autoclave at 140 �C) with alkali
addition (in a range of 0–26 g NaOH/L) and observed reduc-
tions in the biodegradation performance when NaOH
concentrations exceeded 10 g/L (Penaud et al., 1999). Similarly,
Valo et al. (2004) studied a thermo-chemical (150 mmol H2O2/
dm3 dose and autoclave heating at 90 �C) pretreatment on
WAS and compared the results with those from thermally
pretreated WAS only at 130 �C. In their research, although
both samples achieved similar level of COD solubilization
(w30%), the biogas production from thermo-chemically
treated sample (H2O2þ 90 �C) was lower than that obtained
after thermal at 130 �C, indicating that a portion of the soluble
organics generated after thermo-chemical treatment was
refractory. On the other hand, Kim et al. (2003) reported that
among four different pretreatment methods [autoclave
(121 �C for 30 min), chemical (7 g NaOH/L), ultrasonic (42 kHz
for 120 min) and thermo-chemical (121 �C for 30 min, 7 g
NaOH/L)] tested, the thermo-chemical method achieved the
highest level of biogas production which was w38% higher
than the control. It seems that initial sludge characteristics,
dose, type and intensity of chemical and heating applied may
influence final pretreatment outcomes so that general state-
ments of performance cannot always be made.
The capillary suction time (CST)-dewaterability method
provides a quantitative measure, reported in seconds, of how
readily a sludge releases its water. The method requires
a minimum of five replicate injections from each sample
(APHA, 1995). In this study, the CSTs of three replicates from
each BMP bottle (six replicates for each pretreatment scenario)
were measured and reported in Table 4 along with standard
deviations of six replicate injections. Although, the results did
not exhibit any district trends among MW treated samples, in
general H2O2 and MW/H2O2 treated samples resulted in
slightly faster dewaterabilities compared to control and MW
treated samples.
4. Conclusions
Based on the experimental data and analysis the following
conclusions are drawn.
(1) In a temperature range of 60–120 �C, the microwave-
enhanced advanced hydrogen peroxide process (MW/
H2O2-AOP) tested on WAS for enhanced solubilization and
methane production caused significant level of permanent
stabilization via oxidation before digestion.
(2) Elevated MW temperatures (>80 �C) increased the
decomposition of H2O2 into OH� radicals and enhanced
both oxidation and particulate COD disintegration of WAS
samples.
(3) However, at all temperatures tested, MW/H2O2 treated
samples had lower first-order biodegradation rate
constants (k) and ultimate methane yields (mL per gram
sample added ) compared to control and MW irradiated
WAS samples, indicating that synergistically (MW/H2O2-
AOP) generated soluble organics were slower to biodegrade
than those generated during MW irradiation.
Acknowledgments
The authors thank NSERC, BIOCAP Canada and Environ-
mental Waste International Corporation for financial support.
r e f e r e n c e s
Ackman, R.G., 1972. Porous polymer bead packing and formic acidvapor in GLC of volatile fatty acids. J. Chromatogr. Sci. 10,560–565.
Alvarez, J.G., Touchstone, J.C., Blasco, L., Storey, B.T., 1987.Spontaneous lipid peroxidation and production of hydrogenperoxide and superoxide in human spermatozoa. J. Androl. 8(5), 338–347.
APHA, 1995. In: Standard Methods for the Examination of Waterand Wastewater, 19th ed. American Public Health Association,Washington, DC, USA.
Barjenbruch, M., Kopplow, O., 2003. Enzymatic, mechanical andthermal pre-treatment of surplus sludge. Adv. Environ. Res. 7,715–720.
Bayliss, C.E., Waites, W.M., 1979. The synergistic killing of sporesof Bacillus subtilis by hydrogen peroxide and ultra-violet lightirradiation. FEMS Microbiol. Lett. 5, 331–333.
Bougrier, C., Albasi, C., Delgenes, J.P., Carrere, H., 2006. Effect ofultrasonic, thermal and ozone pre-treatments on wasteactivated sludge solubilization and anaerobicbiodegradability. Chem. Eng. Process. 45, 711–718.
Chan, W.I., Wong, W.T., Liao, P.H., Lo, K.V., 2007. Sewage sludgenutrient solubilization using a single-stage microwavetreatment. J. Environ. Sci. Health Part A 42, 59–63.
Chiu, Y.C., Chang, C.N., Lin, J.G., Huang, S.J., 1997. Alkaline andultrasonic pretreatment of sludge before anaerobic digestion.Water Sci. Technol. 36 (11), 155–162.
Dereix, M., Parker, W., Kennedy, K., 2006. Steam explosionpretreatment for enhancing anaerobic digestion of municipalwastewater sludge. Water Environ. Res. 78 (5), 474–485.
Dubois, M.G., Gilles, K.A., Hamilton, J.A., Rebers, P.A., Smith, F.,1956. Colorimetric method for determination of sugars andrelated substances. Anal. Chem. 28, 330–356.
Eskicioglu, C., Kennedy, K.J., Droste, R.L., 2006. Characterizationof soluble organic matter of waste activated sludge before andafter thermal pretreatment. Water Res. 40, 3725–3736.
Eskicioglu, C., Kennedy, K.J., Droste, R.L., 2007a. Enhancement ofbatch waste activated sludge digestion by microwavepretreatment. Water Environ. Res. 79 (11), 2304–2317.
Eskicioglu, C., Terzian, N., Kennedy, K.J., Droste, R.L., Hamoda, M.,2007b. Athermal microwave effects for enhancing digestibilityof waste activated sludge. Water Res. 41, 2457–2466.
Eskicioglu, C., Kennedy, K.J., Droste, R.L., 2008. Initial examinationof microwave pretreatment on primary, secondary and mixedsludges before and after anaerobic digestion. Water Sci.Technol. 57 (3), 311–317.
Frolund, B., Griebe, T., Nielsen, P.H., 1995. Enzymatic activity inthe activated-sludge floc matrix. Microbiol. Biotechnol. 43 (4),755–761.
Griveau, J.F., LeLannou, D., 1997. Reactive oxygen species andhuman spermatozoa: physiology and pathology. Int. J. Androl.20 (2), 61–69.
w a t e r r e s e a r c h 4 2 ( 2 0 0 8 ) 4 6 7 4 – 4 6 8 24682
Hartman, P.S., Eisenstark, A., 1978. Synergistic killing ofEscherichia coli by near-UV radiation and hydrogen peroxide:distinction between recA-repairable and recA-nonrepairabledamage. J. Bacteriol. 133 (2), 768–774.
Hong, S.M., 2002. Enhancement of pathogen destruction andanaerobic digestibility using microwaves. Ph.D. Thesis,University of Wisconsin–Madison, USA.
van Huyssteen, J.J., 1967. Gas chromatographic separation ofanaerobic digester gases using porous polymer. Water Res. 1,237–242.
Imlay, J.A., Chin, S.M., Linn, S., 1988. Toxic DNA damage byhydrogen peroxide through the fenton reaction in vivo and invitro. Science 240 (4852), 640–642.
Kim, J., Park, C., Kim, T.-H., Lee, M., Kim, S., Kim, S.-W., Lee, J.,2003. Effects of various pretreatments for enhanced anaerobicdigestion with waste activated sludge. J. Biosci. Bioeng. 95 (3),271–275.
Kuchma, T.N., Konstantinova, N.D., Samoilenko, I.S., 1990. Thecombined action of microwave radiation and hydrogen peroxideon the viability and ultrastructure of Pseudomonas aeruginosacells. Zh. Mikrobiol. Epidemiol. Immunobiol. 9, 20–23.
Muller, C.D., Abu-Orf, M., Novak, J.T., 2003. The effect ofmechanical shear on mesophilic anaerobic digestion. In:WEFTEC, 76th Annual Conference & Exhibition: LosAngeles, USA.
Owen, W.F., Stuckey, D.C., Healy, J.B., Young, L.Y., McCarty, P.L.,1979. Bioassay for monitoring biochemical methane potentialand anaerobic toxicity. Water Res. 13, 485–492.
Penaud, V., Delgenes, J.P., Moletta, R., 1999. Thermo-chemicalpretreatment of a microbial biomass: influence of sodium
hydroxide addition on solubilization and anaerobicbiodegradability. Enzyme Microb. Technol. 25, 258–263.
Renzetti, S., 2005. Canadian agricultural water use andmanagement. The Economics of Natural and HumanResources in Agriculture. Springer, Amsterdam.
Rosenfeldt, E.J., Linden, K.G., Canonica, S., von Gunten, U., 2006.Comparison of the efficiency of �OH radical formation duringozonation and the advanced oxidation processes O3/H2O2 andUV/H2O2. Water Res. 40, 3695–3704.
Slupphaug, G., Kavli, B., Krokan, H.E., 2003. The interactingpathways for prevention and repair of oxidative DNA damage.Mutat. Res. – Fund. Mol. Mech. Mutag. 531, 231–251.
Valo, A., Carrere, H., Delgenes, J.P., 2004. Thermal, chemical andthermo-chemical pre-treatment of waste activated sludge foranaerobic digestion. J. Chem. Technol. Biotechnol. 79,1197–1203.
Weemaes, M., Grootaerd, H., Simoens, F., Verstraete, W., 2000.Anaerobic digestion of ozonized biosolids. Water Res. 34 (8),2330–2336.
Wong, W.T., Chan, W.I., Liao, P.H., Lo, K.V., 2006a. A hydrogenperoxide/microwave advanced oxidation process for sewagesludge treatment. J. Environ. Sci. Health Part A 41, 2623–2633.
Wong, W.T., Chan, W.I., Liao, P.H., Lo, K.V., Mavinic, D.S., 2006b.Exploring the role of hydrogen peroxide in the microwaveadvanced oxidation process: solubilization of ammonia andphosphates. J. Environ. Eng. Sci. 5, 459–465.
Yin, G., Liao, P.H., Lo, K.V., 2007. An ozone/hydrogen peroxide/microwave-enhanced advanced oxidation process forsewage sludge treatment. J. Environ. Sci. Health Part A 42,1177–1181.