symptom-driven visual storytellingcj82qk69n/... · 79 motivation for symptom-driven visual...
TRANSCRIPT
A Visual Model for Patient–Physician Exchange
Symptom-driven Visual Storytelling
Jin Wang


Symptom-driven Visual StorytellingA Visual Model for Patient–Physician Exchange
Thesis Presented
By
Jin Wang
to
The Department of Art + Design
In Partial Fulfillment of the Requirements for
the Degree of Master of Fine Arts in
Information Design and Visualization
Northeastern University
Boston, Massachusetts
Augest, 2016


ABSTRACT
Patients often want to know more about their symptoms in order to determine what disease they have and use their symptoms’ stories as method of communicating with their doctors. However, the ways they tell their symptoms’ stories fill in a few disadvantages. This thesis aims to find more effective ways to help patients share their symptoms’ stories with physicians. The thesis project investigates intersection of healthcare, data visualization and illustration. It explains some basic elements of healthcare, for example, what is symptom. And then introduces some visual storytelling methods in patient-physician exchange, and analyzes some existing visual storytelling as inspirations, knowledge from them. Specifically, this thesis focuses on gastritis, a stomach disease, proposing a sticker system to help patients record their symptoms, signs and daily life by sticking stickers on a body shape board each day, Additionally, it offers a concept for a data transformation app, transforming the patient’s daily body shape boards into a video to help physicians understand patient’s symptoms over time. It is helpful for patients to gather multiple types of information to make richer symptom-driven visual storytelling.
Keywords:symptom, visual storytelling, healthcare, patient–physician Exchange


Acknowledgment
This thesis could not have been finished without the participation and assistance of so many people.
First of all, I would like to thank Prof. Ann McDonald, who provided suggestions to help me revise my ideas and visual language. She helped me empathize with the needs and feeling of my audience, patients with chronic diseases. I also want to thank my thesis reader Prof. Paul Kahn, who also helped me with my text contents, and he gave a lot of worthy suggestions to my visual design. He helped me analyze how to make my work really effective work from his professional angle. He provided a lot of opportunities for me to learn my thesis topic from widely prespective. Many thanks to Prof. Thomas Starr, who revised my book layout and guide my design in my book, which might spend him a lot of time. Thanks to all other committee members from Information design and visualization department. My committee chair, Prof. Nathan FeldeProf. Dietmar Offenhuber, Prof. Douglass Scott, Prof. Kristian Kloeckl. I really appreciate their patient and important critiques about my project.
Many thanks to Katie McCurdy, her work is the inspiration of my whole thesis, it is pleasure to share my thesis with her and get useful feedback.
Finally I would thank all my colleague in IDV program and all my friends, who gave me a lot helps and useful suggestions about my thesis: Armin Akhavan, Aldo Viramontes, Jessica Hopkins, Xiangyi Fu, Kirsten Tanjutco, Lia Petronio, Mahima Pushkarna, Skye Moret, Yangdong Ye, Xuan Zhang, Xiaxin Chen, Fan Sun, Yahui Wang.

LIST OF VISUALS
Chapter 1
20 Figure 1
20 Figure 2
22 Figure 3
24 Figure 4
24 Figure 5
26 Figure 6
34 Figure 7
35 Figure 8
36 Figure 9
37 Figure 10
Chapter 5
83 Figure 20
84 Figure 21
86 Figure 22
88 Figure 23
90 Figure 24
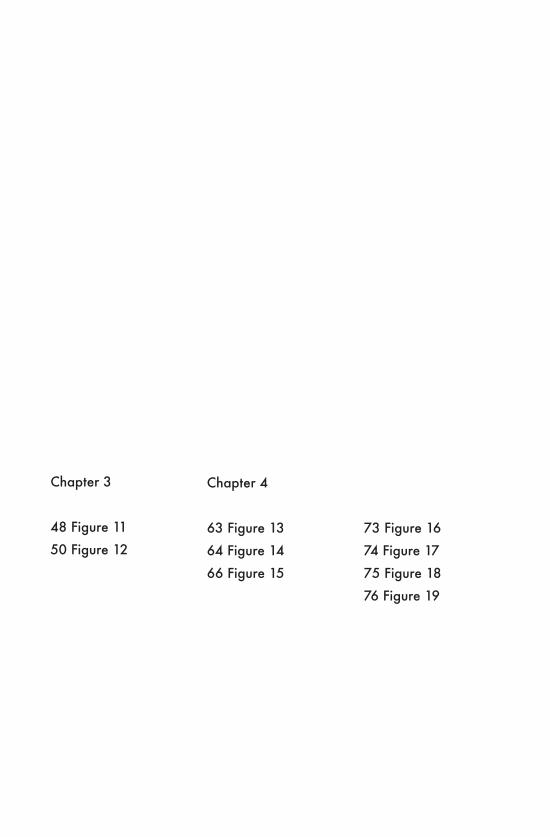
Chapter 3
48 Figure 11
50 Figure 12
Chapter 4
63 Figure 13
64 Figure 14
66 Figure 15
73 Figure 16
74 Figure 17
75 Figure 18
76 Figure 19

10
10 Table of Contents13 Introduction
Input Chapter 1: Visual Storytelling20 What is visual storytelling? 23 Visual storytelling in our lives34 Visual storytelling via information design techniques
Chapter 2: Symptom41 What is a symptom?
42 From sign to symptom43 Understanding a symptom in relation to others44 What are the patterns of symptoms, and what is a symptom journal? Chapter 3: Patient - Physician Exchange47 Patient’s mental model of a symptom53 Physicians’ illness scripts54 Diagnosis55 Narratives and feedback
56 Barriers to patient–physician exchange
CONTENTS

11
Chapter 4: Patient Visual Storytelling 58 Patient-generated health data and quantified self data 61 Patients’ stories 64 Case studies and examples (Katie McCurdy) 70 Information design for the medical field 79 Motivation for symptom-driven visual storytelling
Output Chapter 5:Daily Gastritis Tracker 82 What is daily gastritis tracker? 83 Stickers and body shape board 88 Data transformation app Chapter 6: Conclusions
95 Bibliography

12
“Hey, Doc, I’m a story, not just a symptom.”
Cathryn Wellner
13
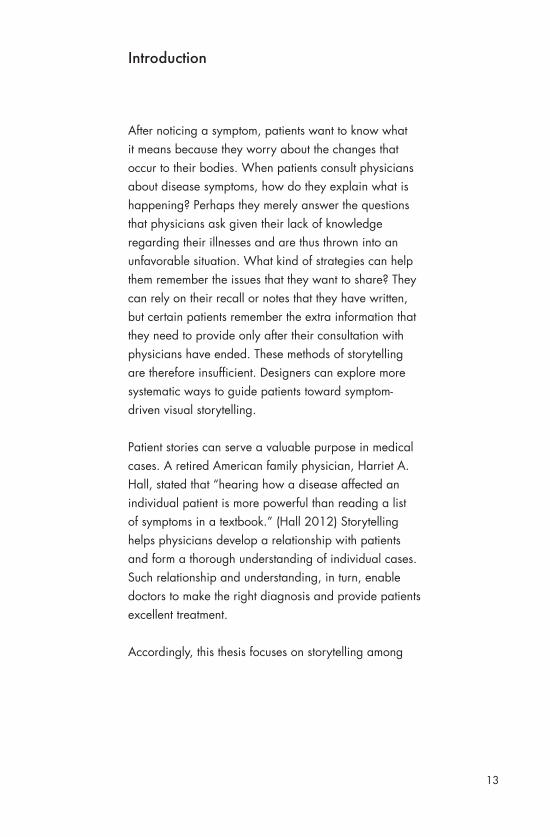
After noticing a symptom, patients want to know what it means because they worry about the changes that occur to their bodies. When patients consult physicians about disease symptoms, how do they explain what is happening? Perhaps they merely answer the questions that physicians ask given their lack of knowledge regarding their illnesses and are thus thrown into an unfavorable situation. What kind of strategies can help them remember the issues that they want to share? They can rely on their recall or notes that they have written, but certain patients remember the extra information that they need to provide only after their consultation with physicians have ended. These methods of storytelling are therefore insufficient. Designers can explore more systematic ways to guide patients toward symptom-driven visual storytelling.
Patient stories can serve a valuable purpose in medical cases. A retired American family physician, Harriet A. Hall, stated that “hearing how a disease affected an individual patient is more powerful than reading a list of symptoms in a textbook.” (Hall 2012) Storytelling helps physicians develop a relationship with patients and form a thorough understanding of individual cases. Such relationship and understanding, in turn, enable doctors to make the right diagnosis and provide patients excellent treatment.
Accordingly, this thesis focuses on storytelling among
Introduction

14
patients and presents visual storytelling techniques for communicating information during patient–physicianexchange. From this thesis, patients will find ways to express themselves visually, develop an improved understanding of their health, and know more about themselves. The findings of this work are expected to change the manner by which patients care for themselves. Physicians may also benefit from this research because they will learn how to read the visual stories shared by patients and effectively understand these individuals.
In a recent interview on the growing disconnect between information and meaning in the age of data, a legendary inventor and futurist, George Dyson, indicated that “we now live in a world where information is potentially unlimited. Information is cheap, but meaning is expensive. Where is the meaning? Only human beings can tell you where it is. We are extracting meaning from our minds and our own lives.” (Dyson 2011) Visual storytelling is a new language for the information age. Some patients are now attempting to use storytelling as a means of information exchange with physicians. Its effectiveness lies in the fact that it enables physicians to comprehensively engage with patients regarding their conditions given the clear and direct information elicited from the narratives. Other patients have been using visual prompts during visits to physicians to help them
accurately explain their experiences.
15
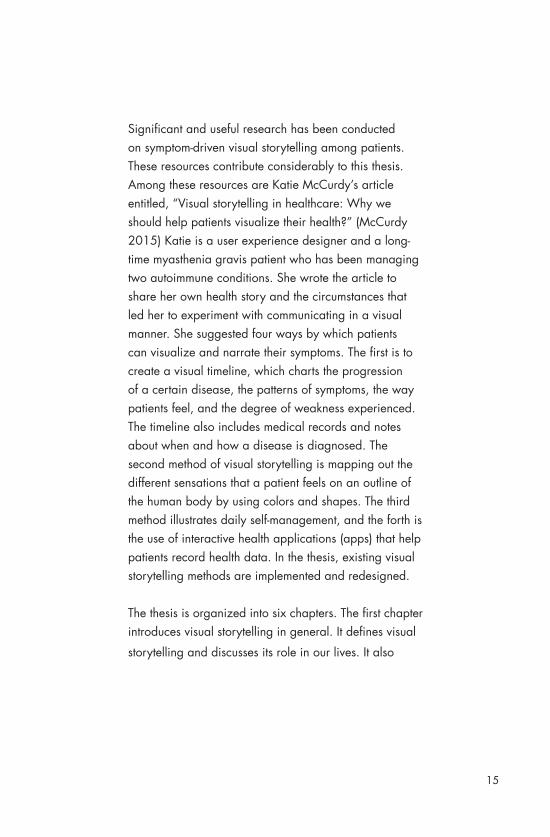
Significant and useful research has been conducted on symptom-driven visual storytelling among patients. These resources contribute considerably to this thesis. Among these resources are Katie McCurdy’s article entitled, “Visual storytelling in healthcare: Why we should help patients visualize their health?” (McCurdy 2015) Katie is a user experience designer and a long-time myasthenia gravis patient who has been managing two autoimmune conditions. She wrote the article to share her own health story and the circumstances that led her to experiment with communicating in a visual manner. She suggested four ways by which patients can visualize and narrate their symptoms. The first is to create a visual timeline, which charts the progression of a certain disease, the patterns of symptoms, the way patients feel, and the degree of weakness experienced. The timeline also includes medical records and notes about when and how a disease is diagnosed. The second method of visual storytelling is mapping out the different sensations that a patient feels on an outline of the human body by using colors and shapes. The third method illustrates daily self-management, and the forth is the use of interactive health applications (apps) that help patients record health data. In the thesis, existing visual storytelling methods are implemented and redesigned.
The thesis is organized into six chapters. The first chapter introduces visual storytelling in general. It defines visual
storytelling and discusses its role in our lives. It also
16
presents examples of visual storytelling in daily life and information design techniques. These techniques are analyzed so that readers can use them to create their own visual narratives.The second chapter introduces the term “symptom,” defines this term, and discusses different categories of symptoms. This chapter is designed to communicate the importance of understanding one symptom in relation to other symptoms. It illuminates the patterns that underlie symptoms and presents a tool called the symptom journal. Finally, the chapter discusses the differences between a sign and a symptom. The third chapter focuses on patient–physician exchange and explains the process by which a patient’s mental model of a symptom is formed. A concept map of the process was created for this thesis. Included in the concept map are the barriers to patient–physician exchange and the illness scripts crafted by physicians. The concept map also introduces how a patient narrates his or her story to physicians, how he or she collects feedback and diagnostic information from physicians, and how he or she combines all the information to form a mental model of a symptom. This mental model plays an important role when patients tell their symptom-driven visual stories. The fourth chapter provides an examination of Katie McCurdy’s case and other medical information design works. It likewise explains patient-generated health data (PGHD), quantified self data, and the role of patient stories in accurate diagnosis, effective treatment, patient–physician exchange. The fifth chapter explains

17
how a daily tracker for gastritis works. The daily tracker features stickers that represent symptoms and signs, a body shape board, and a data transform app. I designed each component of the daily tracker. This chapter mainly lists each design work and informs gastritis patients how to use the daily tracker to ensure that it functions appropriately. The sixth chapter concludes the thesis.
The visual storytelling of patients acts as a conversation and cognitive aid during visits to physicians. It illuminates major issues that can change the way patients care for themselves. As a student with a background in information design and visualization, I have the ability and opportunities to offer information design methods that help patients effectively exchange stories with physicians. I integrated my background knowledge on related research to contribute suggestions for patient–physician exchange.

18

Chapter 1: Visual Storytelling

20
Visual storytelling dates back to the period when cavemen drew on cave walls, with its ultimate goal being to “show, not tell” to effectively express and represent the content of a narrative even without the use of words. As George Dyson said, “we now live in a world where information is potentially unlimited. We are extracting meaning from our minds and our own lives.” (Dyson 2011) Visual storytelling helps us transform extracted meaning into a new language that people can use to communicate in the information age. A visual narrative relates a story through visual media, such as graphic designs, videos, infographics, illustrations, and photography, thereby conveying information in an informative, graceful, and entertaining way. (Popova 2011) It enhances a story because of the use of music, voice files, and audio files. Visual storytelling genres range from information design stories, news, and advertisements to entertainment narratives. In short, visual storytelling tells any kind of story in a visual manner. It is a combination of pictures, narration, and design. The essence of visual storytelling is the combination of emotional reaction and narrative information. (Klanten, Ehmann and Schulze 2011) From this perspective, visual storytelling is a good method of creating patient narratives because it contains a patient’s feelings and information on his or her symptoms.
Visual storytelling is a persuasive story with a point of view. It can be used to generalize and summarize
1.1 What is visual storytelling?

21
1.1 What is visual storytelling?
a story’s viewpoint, which is key to helping readers understand the narrative. Visual storytelling transforms a story through the use of high-quality images, whether these are still or moving pictures. It also addresses a subject matter with pressing social, environmental, or spiritual value by any social media, newspaper, website, etc.

22
Figure 2
The background of the landing page is a loop video, the video can show how the tornado Joplin looks like and we chose to use the dynamic video, readers will feel experience tornado themselves.
Figure 1
Carl Kleiner’s ‘Homemade Is Best’ IKEA cookbook
23
1.2 Visual storytelling in our lives
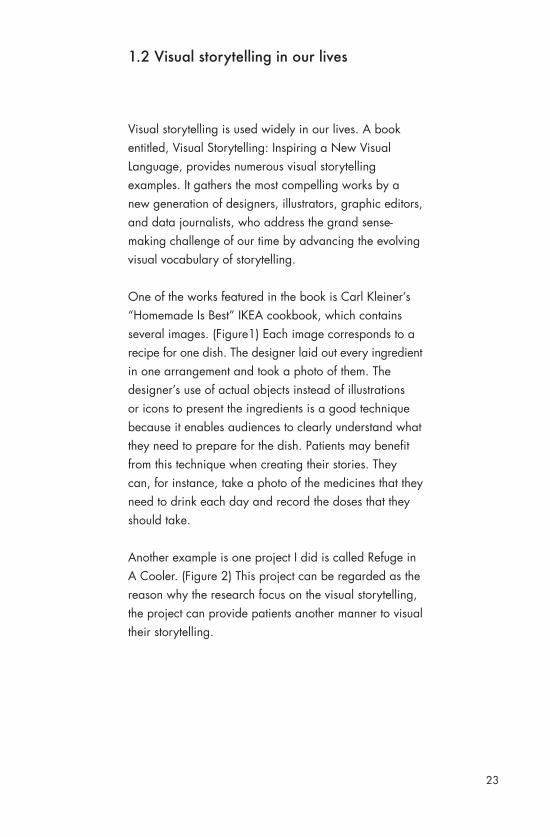
Visual storytelling is used widely in our lives. A book entitled, Visual Storytelling: Inspiring a New Visual Language, provides numerous visual storytelling examples. It gathers the most compelling works by a new generation of designers, illustrators, graphic editors, and data journalists, who address the grand sense-making challenge of our time by advancing the evolving visual vocabulary of storytelling.
One of the works featured in the book is Carl Kleiner’s “Homemade Is Best” IKEA cookbook, which contains several images. (Figure1) Each image corresponds to a recipe for one dish. The designer laid out every ingredient in one arrangement and took a photo of them. The designer’s use of actual objects instead of illustrations or icons to present the ingredients is a good technique because it enables audiences to clearly understand what they need to prepare for the dish. Patients may benefit from this technique when creating their stories. They can, for instance, take a photo of the medicines that they need to drink each day and record the doses that they should take.
Another example is one project I did is called Refuge in A Cooler. (Figure 2) This project can be regarded as the reason why the research focus on the visual storytelling, the project can provide patients another manner to visual their storytelling.
24
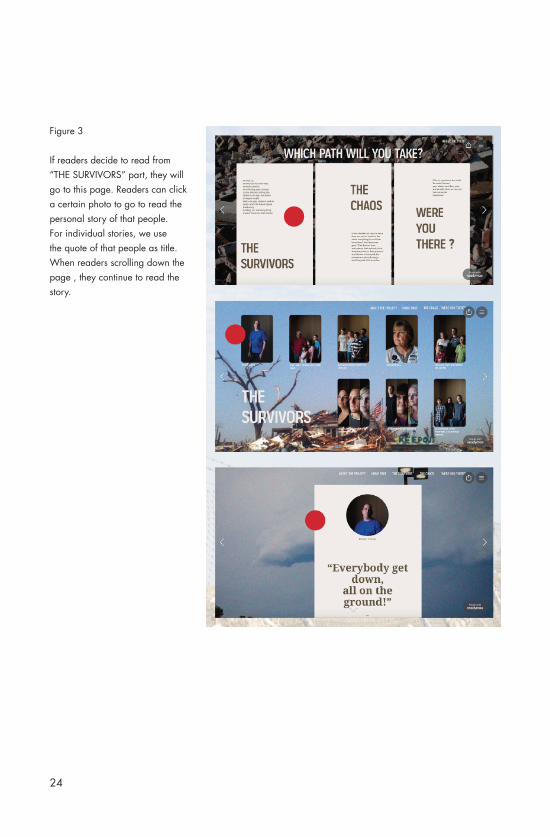
Figure 3
If readers decide to read from“THE SURVIVORS” part, they will go to this page. Readers can click a certain photo to go to read the personal story of that people.For individual stories, we use the quote of that people as title. When readers scrolling down the page , they continue to read the story.

25
We combined a variety of ways to tell the story. The project is a visual enhancement of Luke Dittrich's story on the Joplin tornado of 2011 featured in Esquire Magazine. It is an inter¬active online experience that provides the viewer with the op¬portunity of selecting the content they would like to see. They can explore the personal stories of the survivors on Luke Dittrich’s story on the 2011 Joplin Tornado, the cha¬os in the cooler as the tornado passed by or other submitted personal experiences from this event.
In May 2011, freelance writer Luke Dittrich arrived in Joplin, Missouri, to begin research on the devastation of a Category F-5 tornado, which had ravaged the town one week earlier. In St. Louis to begin work on an unrelated story, Luke phoned his editor to alert him to the change in plans. He rented a car, made the nearly 300 miles trip southwest across Missouri, and was stunned by the destruction he encountered.
Luke’s story hinges on the personal stories of 23 survivors who sought refuge in the cooler of a convenience store. There are many anecdotes of the people who arrived independently to escape the tornado and he deftly builds the suspense throughout the piece. His piece sections off your introduction to the survivors, one person or group of people at a time, leading off with Ruben, the clerk at the store. None of those who seek refuge at the store
have anything in common except a friendly relationship

26
Figure 4
The layout of “THE CHAOS” part is similar with the individual stories. It also includes two photo galleries with images from the author and photographer of the aftermath in Joplin.
Figure 5
For “WERE YOU THERE?” part, readers can see other survivors experience through personally uploaded photographs or media. They could essentially add media of their own regarding this event.

27
with Ruben. That is the thread woven throughout thepiece. They learn to lean on each other - both literally and figuratively - as the tornado bears down but the story closes with each group going their separate ways as they pull themselves out of the cooler.
Our largest impediment was finding the proper path to re-conceptualize the story. After initially deciding to include complementary pieces like maps, stories and other pieces that had some commonality but were only loosely related, the project took a 90-degree turn when Luke supplied photos and videos he had taken during his trip to Joplin. They were so integral to the piece that we knew had to include them. That forced us to reassess the project and come to the realization that the best presentation was to allow the story to stand on its own, but rework the approach to the text. The result was the extraction of the personal stories into a category we called “The Survivors” (Figure 3) and the description of the time spent in the cooler being called “The Chaos”.(Figure 4)
The project is appealing to those interested in tales of survival. It could attract be people with no direct connection to the incident but an interest in learning more about it (the large majority of visitors), but could also include those who have a personal connection to these types of disasters. To that end, we added an interactive, crowd-sourcing element to the project in its

28
Figure 6
Flooding, Power Failures, Rainfall and Damage From Hurricane IreneNew York Times August 31,2011By Joe Burgess, Amanda Cox, Alicia Parlapiano, Archie Tse, Lisa Waananen and Tim Wallace
29
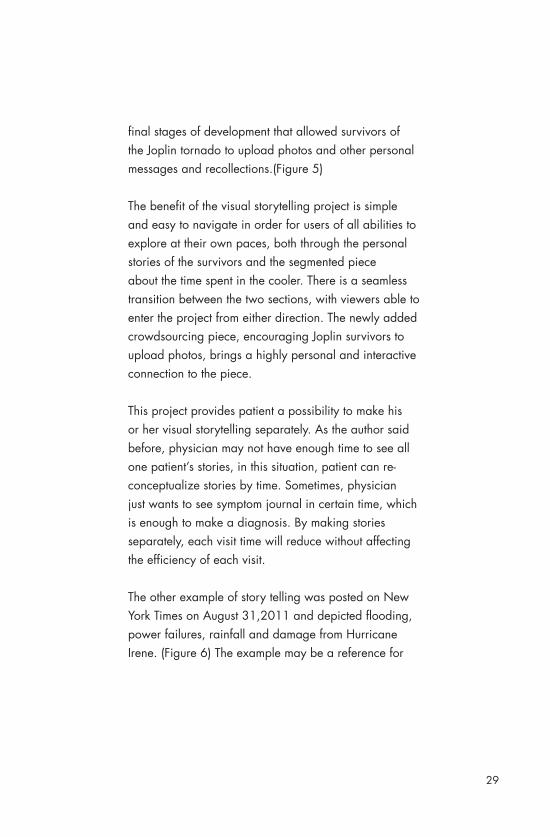
final stages of development that allowed survivors of the Joplin tornado to upload photos and other personal messages and recollections.(Figure 5)
The benefit of the visual storytelling project is simple and easy to navigate in order for users of all abilities to explore at their own paces, both through the personal stories of the survivors and the segmented piece about the time spent in the cooler. There is a seamless transition between the two sections, with viewers able to enter the project from either direction. The newly added crowdsourcing piece, encouraging Joplin survivors to upload photos, brings a highly personal and interactive connection to the piece.
This project provides patient a possibility to make his or her visual storytelling separately. As the author said before, physician may not have enough time to see all one patient’s stories, in this situation, patient can re-conceptualize stories by time. Sometimes, physician just wants to see symptom journal in certain time, which is enough to make a diagnosis. By making stories separately, each visit time will reduce without affecting the efficiency of each visit.
The other example of story telling was posted on New York Times on August 31,2011 and depicted flooding, power failures, rainfall and damage from Hurricane Irene. (Figure 6) The example may be a reference for

30
patients that want to show their symptom-driven visual storytelling in an interactive way.
This map includes graduated symbol maps and choropleth maps. It just showed the east part of American, because East Coast had serious damage. From the map, we can see Hurricane Irene arrived the land from Cape Lookout at 8 a.m. on Saturday. And then it moved toward to north along the shore. Hurricane brought very huge influence to wide area of the East Coast.
There is a convenient function the thesis wants to point out, this map is really very long, at the same time, because it was posted on internet, if readers want to see the whole map and compare all areas on the map, they have to glide the screen again and again. However, the map provides them a key on the upper left, it is called “Scroll to Location”. With this key, readers reach the area they want to learn quickly and directly. When readers click New York, the screen will scroll to New York automatically. It is very necessary for residents that living in certain area to know their locations situation well. This method provides patient an idea of make some keys that can help physicians reach certain part of patients’ visual storytelling directly.
And it is very cool that we can change map to show different maps with different situation. From first one

31
readers see river gauges where buildings and roads have flooded. Circles represent the percentage above a moderate flood level. The biggest circles point out the flood level is one hundred percentages above a moderate flood level, middle ones mean the flood level is fifty percentages above a moderate flood level and smallest ones present the flood level is ten percentages above a moderate flood level. Then readers can change to the second one, second one tell them how often a rainfall event equaling the amount of rain produced by Hurricane Irene is expected to occur. The designer uses six colors to explain times and the color becomes deeper along with year increase. Wilmington, Raleigh, Durham, Fayetteville, Richmond, Boston and Providence will spend less time equaling the amount of rain produced by Hurricane Irene. Washington, New Ben, Baltimore, Massachusetts, Pennsylvania and New Jersey will spend any time equaling the amount of rain. Albany Vermont, New York City, Norfolk will spend long time reaching the amount of rain. Third one counted the number of the customers with power on Sunday afternoon by county. Be the same with the calculation method of first map, in this map, the biggest circles mean the biggest number. The biggest circles present 300,000 people, the middle ones mean 100,000 people and the smallest ones stand for 10,000 people. People live in the areas that near the Atlantic were affected by Hurricane Irene seriously. The forth one tells readers total rainfall from the storm, the bigger the rainfall is, the deeper the blue is. Areas that

32
approach the center of hurricane rained more than other areas. These maps show patients how to use colors and circles in their visual storytelling.
33
“We now live in a world where
information is potentially unlimited.
Information is cheap, but meaning
is expensive. Where is the meaning?
Only human beings can tell you
where it is. We’re extracting
meaning from our minds and our
own lives.”
George Dyson

34
In the information age, an increasing amount of data are being collected given that we can now accumulate information at any time from anywhere. The challenge is how to extract the most useful and most valuable news and findings from the huge amount of information that is available to us. Information designers, graphic designers, journalists and other media professionals, and data workers are responsible for addressing this challenge. The new generation of designers, illustrators, data journalists, and graphic editors use the creative scope of existing information design techniques in visual storytelling.
Information design is the practice of presenting information in a way that fosters the efficient and effective understanding of it. It is closely related to data visualization.
The colors, typography, style, balance, and format of an image can generate that first instinctive smile from audiences, who have the power to decide whether to read a visual story or not. A designer aims to maintain a sense of continuity among a color scheme, a typography, and the tone of information; at other times, he or she may attempt to invoke contradictory emotional reactions to a piece's visual language and the nature of its content to shock or delight a viewer. The skill, cultural background, personal experience, and current state of
1.3 Making Visual Storytelling by using Information Design Techniques
35
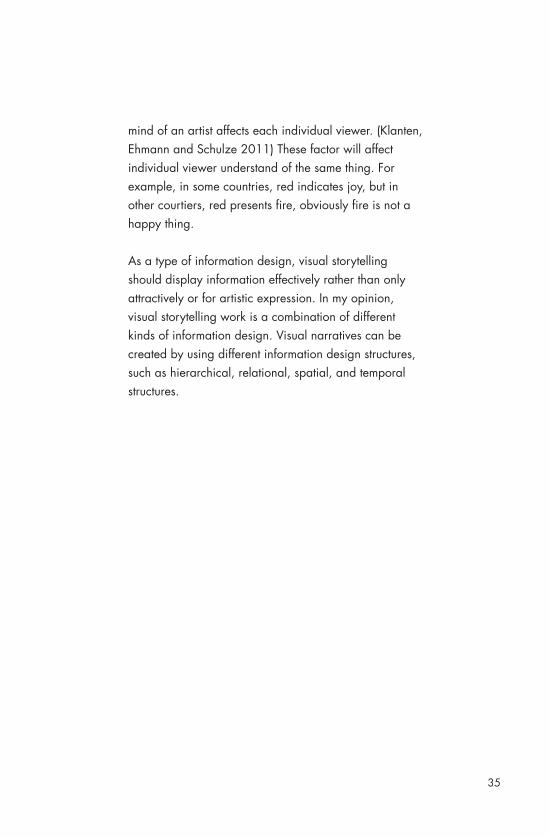
mind of an artist affects each individual viewer. (Klanten, Ehmann and Schulze 2011) These factor will affect individual viewer understand of the same thing. For example, in some countries, red indicates joy, but in other courtiers, red presents fire, obviously fire is not a happy thing.
As a type of information design, visual storytelling should display information effectively rather than only attractively or for artistic expression. In my opinion, visual storytelling work is a combination of different kinds of information design. Visual narratives can be created by using different information design structures, such as hierarchical, relational, spatial, and temporal structures.
36
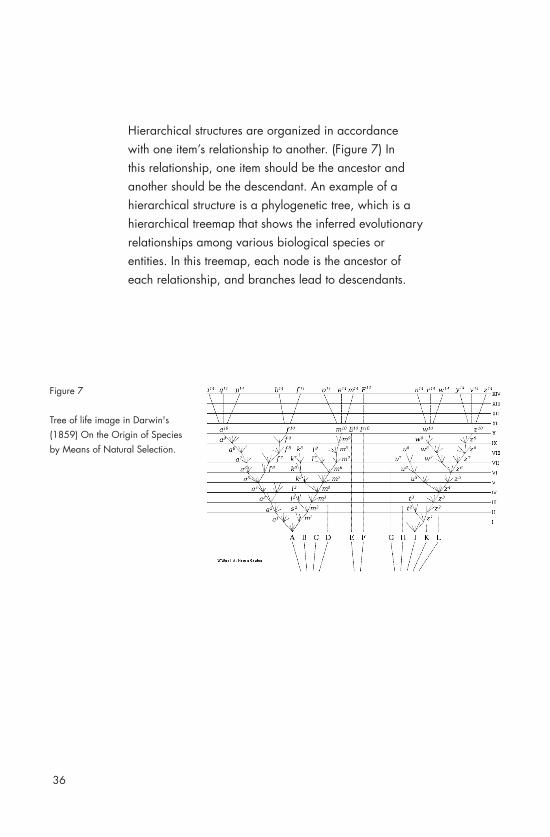
Hierarchical structures are organized in accordance with one item’s relationship to another. (Figure 7) In this relationship, one item should be the ancestor and another should be the descendant. An example of a hierarchical structure is a phylogenetic tree, which is a hierarchical treemap that shows the inferred evolutionary relationships among various biological species or entities. In this treemap, each node is the ancestor of each relationship, and branches lead to descendants.
Figure 7
Tree of life image in Darwin's (1859) On the Origin of Species by Means of Natural Selection.
37
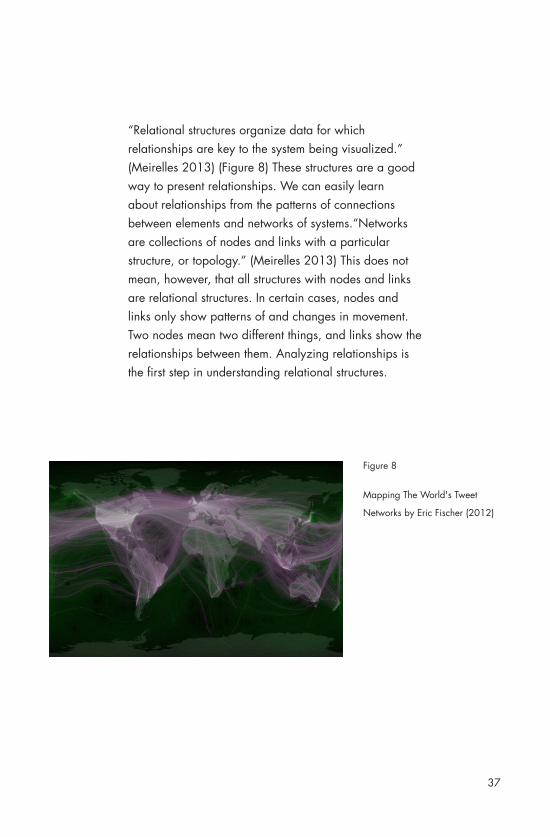
Figure 8
Mapping The World's Tweet
Networks by Eric Fischer (2012)
“Relational structures organize data for which relationships are key to the system being visualized.” (Meirelles 2013) (Figure 8) These structures are a good way to present relationships. We can easily learn about relationships from the patterns of connections between elements and networks of systems.“Networks are collections of nodes and links with a particular structure, or topology.” (Meirelles 2013) This does not mean, however, that all structures with nodes and links are relational structures. In certain cases, nodes and links only show patterns of and changes in movement. Two nodes mean two different things, and links show the relationships between them. Analyzing relationships is the first step in understanding relational structures.

38
Many maps are characterized by a spatial structure.(Figure 9) A map or the act of mapping in diverse fields of knowledge all present data that reflect spatial distributions. “Spatial structures exist, because geographical space is not constituted by a set of unique places, occupying random locations”. (Meirelles 2013)
Temporal structures (Figure 10) are defined as a patterned organization of time, used by humans to help them manage, comprehend or coordinate their use of time. Temporal structures are organized around the dichotomy between linear and cyclical times. Events show in timelines. For spatio–temporal structures, it shows data belonging to both space and time.
Figure 9
German railroads: destination of
freight traffic by traffic districts
(1937)

39
Figure 10
David Rumsey Historical Map
Collection: Fascial chart of the
United State (1874)
Author: Francis Amasa Walker
United States.
Census Office
Scale: 39 * 52
Image No :3566033
Information designers are adept infographics creators. As elements that contribute to the power of visual storytelling, infographics are neither illustrations nor art. They constitute a form of visual journalism and must be governed by the same ethical standards that apply to other disciplines. Infographics always present related information on one page and convey varied and colorful stories.

40
Chapter 2: Symptom

41
2.1 What is a symptom?
A symptom is a subjective evidence of a disease. It reflects the presence of an unusual state or illness. It is a feeling that is observed and detected by a patient, but it cannot be measured directly. Some symptoms can be misleading to patients or the physicians who care for them. A necessary requirement, therefore, is to understand a symptom in relation to others. The three main types of symptoms are chronic, relapsing, and remitting symptoms. Symptoms may also progressively worsen or improve.
There are three main types of symptoms. They are chronic symptoms, relapsing symptoms and remitting symptoms. Symptoms may also progressively get worse, or better. Diseases and conditions can also be described as: asymptomatic diseases/conditions, symptomatic diseases/ conditions, constitutional symptoms, presenting symptoms and cardinal symptoms.
42
2.2 From sign to symptom
Distinguishing between a sign and a symptom is important. A sign is objectively observable and directly measurable, and symptoms become signs when they lead to an interpretation. Some symptoms occur in a wide range of disease processes, whereas others are specific to a narrow range of illnesses. As previously stated, certain symptoms can be misleading to patients or the medical practitioners who care for them.
Let us take a skin allergy as an example. A skin allergy occurs because of an allergen that triggers an immune system response. This condition causes changes to the skin, such as itching, hives, redness, and swelling. Among these changes, itching is a symptom of a skin allergy because a patient can feel this sensation, but others cannot determine what the patient feels by observation. Hives, which are red bumps or welts appearing on the body; redness; and swelling are signs of a skin allergy because they are a direct response of the body. Physicians detect a disease by studying a sign’s size and color. Sometimes, symptoms reflect signs, symptoms can be represented by signs. When creating symptom-driven visual stories, patients can draw small diagrams that describe signs to ensure that physicians understand the individual circumstances that surround a disease.

43
2.3 Understanding a symptom in relation to others
To understand the disease that is reflected by a symptom, patients need to learn to comprehend the other symptoms associated with it. That is, patients should learn to grasp the other symptoms caused by the initially identified symptom. Sometimes, diagnosing a disease on the basis of a single symptom is difficult because many diseases can exhibit the same symptom. Physicians should thoroughly familiarize themselves with patient information, and similar to patients, they should understand other symptoms that are associated with an initially detected symptom. For example, abdominal pain may result in stomach gastritis, diarrhea, or more seriously, stomach cancer. If physicians are to effectively evaluate what kind of disease a patient has, they should understand what other symptoms accompany the first symptom that they detect. If abdominal pain is accompanied with stomach pain and vomiting, the condition will be diagnosed as gastritis. If a patient experiences a sense of urgency with defecation, anal discomfort, incontinence, and other related symptoms, the condition will be diagnosed as diarrhea. If pain is accompanied with weight loss, the illness is likely cancer. To enable physicians to adequately understand a patient’s condition and provide an accurate diagnosis, patients should try their best to set out all symptoms in their visual narratives.
44
2.4 What are the pattern of symptom and the journal of symptom?
A symptom journal is a kind of diary that is a simple tool that patients can use to record their symptoms or activities in an organized manner over a given period. The information contained in a journal can advance diagnostic and treatment processes. The patient is the author of a symptom diary, whose objective is to include as much information regarding an illness as possible. The key features of a symptom diary include symptom timing and duration, associated symptoms, triggers, alleviating factors, and lifestyle considerations. Six benefits can be derived from symptom diaries. (Hodge 2013) The first is patient management and control. (Hodge 2013) Keeping a symptom diary affords a patient a sense of control and direct involvement in his or her treatment plan. For some patients, the process of writing out their symptoms, experiences, and emotions constitutes a treatment benefit. The second benefit is time saving. (Hodge 2013) The amount of time that a physician spends in reviewing a one-page diary is substantially less than the time it takes to interview a patient for information. This does not mean that no interviews are conducted during patient–physician exchange, but this work argues that a symptom diary can explain some professional information more clearly. The third benefit is that symptom diaries focus on information gathering. (Hodge 2013) A diary can be used to organize a patient’s history for meaningful clinical interpretation, and patients can use collected information to create visualizations. Visual images and
45
Visual images and numbers are always easily interpretable by people. The fourth benefit is that a diary can help physicians identify the nuances of symptoms within a disease process and can directly lead to activity modification and lifestyle changes that optimize overall functioning. (Hodge 2013) The fifth benefit is related to visual assessment. (Hodge 2013) Visual learners can quickly scan a diary and digest the information in it. The final benefit is cost saving. (Hodge 2013) Symptom diaries can create a more thorough history, which has the potential to limit unnecessary laboratory and radiographic testing.
Patients’ experiences can be documented on paper or recorded over Internet and mobile applications. Simple paper handouts are effective and can be returned during or prior to a coming visit. Alternatively, electronic diaries feature sophisticated designs for collecting and organizing information, and mobile applications offer convenience in showing symptoms. Mobile applications, however, often come with a fee. Patients can select the format that suits them best, and they can base their decisions on time constraints, health literacy, and computer skills, among other factors.

46
Chapter 3: Patient - Physicians Exchange

47
Chapter 3: Patient - Physicians Exchange
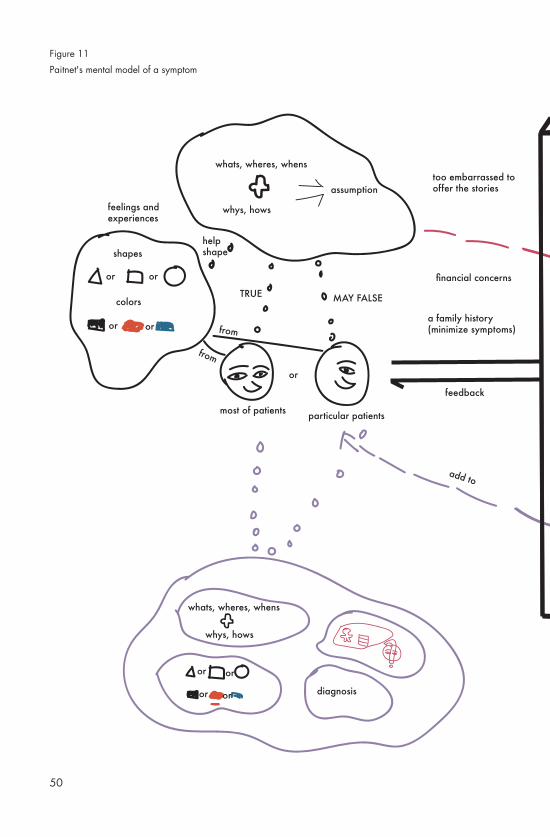
3.1 Patient’s mental model of a symptom
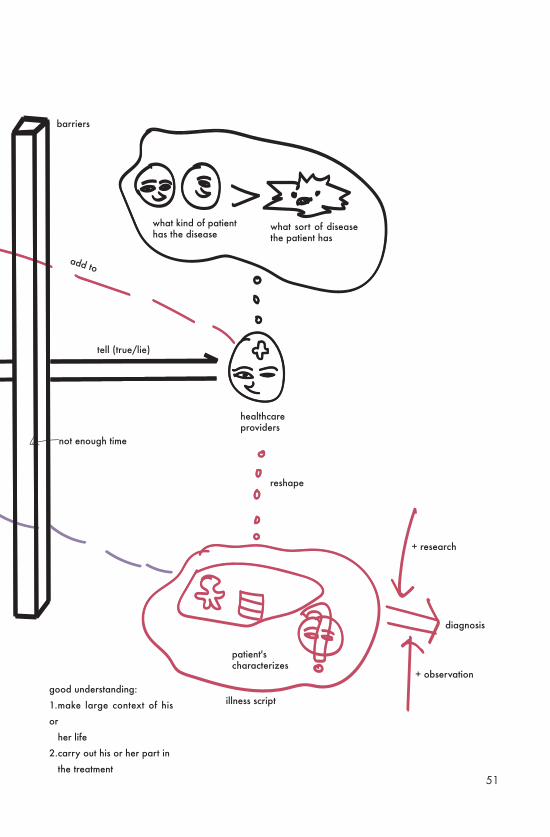
A patient has a mental model of his or her story. A metal model of a symptom (Figure 10) is formed by noting down feelings, experiences, and assumptions regarding a symptom. (Sanders 2010) Such assumptions include basic information on a patient’s symptom, such as what the symptom is, where the symptom occurred, when the patient detected the symptom, why the patient exhibits this symptom, and how the patient feels. These assumptions help the patient shape his or her feelings and experiences. Different patients’ feelings and experiences have different characteristics, it can be understood as some physical objects, such as shapes and colors. After this first step, that is, forming an initial mental model of a symptom, patients can then visit physicians. After patients discuss their feelings and experiences, physicians categorize these individuals into different groups and determine the diseases from which they suffer. An issue worth noting here is that physicians should recognize the importance of determining what kind of patient has a given disease as opposed to ascertaining the type of disease that a patient has. (Sanders 2010) Because different patients may have different symptoms in the same disease. Physicians reshape a patient’s characteristics in accordance with their knowledge. After observing a patient, they make a diagnosis and communicate such diagnosis and disease characteristics to the patient. The patient then adds this information to his or her initial mental model. A complete mental model of a symptom should comprise four

48
components: the what, when, where, why, and how of the symptom; the patient’s feelings and experiences; the patient’s characteristics; and the diagnosis. Incorporating these aspects into the model ensures the patient a good understanding of his or her symptom, represents the larger context of his or her life, and enables him or her to carry out his or her part of the treatment. These aspects are equally important in visual storytelling.

49
50
feelings and experiences
shapes
colors
or or
or or
whats, wheres, whens
most of patients
whys, hows
assumption
help shape
or
particular patients
TRUE MAY FALSE
from
from
whats, wheres, whens
whys, hows
or or
or or diagnosis
add to
feedback
too embarrassed to offer the stories
financial concerns
a family history (minimize symptoms)
Figure 11
Paitnet's mental model of a symptom
51
add to
feedback
too embarrassed to offer the stories
financial concerns
a family history (minimize symptoms)
what kind of patient has the disease
what sort of disease the patient has
healthcare providers
patient's characterizes
illness script
reshape
+ research
+ observation
diagnosis
tell (true/lie)
barriers
not enough time
add to
good understanding:
1.make large context of his
or
her life
2.carry out his or her part in
the treatment

52
Figure 12
An example of illness script

53
3.2 Physicians’ illness scripts
An illness script (Figure 12) is a previously acquired network of relevant knowledge and experience anchored by a sign or a symptom and enriched by a scenario of events that occur in a certain order. According to Feltovich and Barrows (1984), an illness script is a general frame used by medical experts to construct a cognitive representation of a particular patient problem; they are hypothesized as general knowledge structures that consist of three components: enabling conditions, a fault, and consequences. Enabling conditions are contextual and patient background factors that influence the probability that an individual will contract a disease. These conditions may contribute to a fault, which is a pathophysiological malfunctioning that constitutes the biomedical core of a disease. This fault may give rise to certain consequences, such as complaints, signs, and symptoms.
Components of an IS• Chief Complaint• Working hypotheses• Predisposing condition• Pathophysiological insult• Clinical consequences or distinguishing features• Defining features• Problem representation

54
3.3 Diagnosis
In the medical field, a diagnosis “is the process of determining which disease or condition explains a person’s symptom and signs.” Physicians collect a patient’s medical history and physical examination records because these are necessary to providing a diagnosis. Many signs and symptoms are nonspecific, thereby presenting difficulties in making a diagnosis.
In the learning process, physicians learn to classify patients into groups with similar signs and symptoms. (Wen and Kosowsky 2013) They adhere to cookbook medicine, which is a kind of medical algorithm. Similar to an algorithm, cookbook medicine is a process wherein physicians rely entirely on rules rather than on a comprehensive individual approach to the medical needs of a patient. This method may not be an appropriate reference for clinical judgment. The key to diagnosis lies in a patient and his or her story, not in a “recipe” that reduces a patient to a symptom or two. Each patient’s story should be considered on its own terms before a physician diagnosis and treatment.

55
3.4 Narratives and feedback
Physicians should encourage patients to serve as partners in the most important aspect of their health care. Patient–physician exchange requires both narratives and feedback. A patient’s story is the main part of a narrative, whereas a physician’s illness script is the core component of feedback. These elements facilitate patient–physician exchange. Patients express their feelings and describe their symptom, and physicians provide feedback.

56
3.5 Barriers to patient–physician exchange
Many barriers exist between patients and physicians. Patients may be too embarrassed to share their stories or they may provide an incomplete account of their experiences. These result in the loss of important points that patients deliberately conceal and cause physicians to carry out an incorrect diagnosis.
Financial concerns are another barrier to patient–physician exchange. Patients who do not have enough money always worry over more issues than others. Patients believe that communicating all the symptoms and problems that they experience automatically translates to expensive treatments. When family history minimizes a given symptom, a patient deliberately determines his or her health conditions on the basis of such history. This tendency is harmful to exchange.
57
Chapter 4: Patient Visual Storytelling

58
4.1 Patient-generated health data and quantified self data
According to the National eHealth Collaborative Technical Expert Panel, PGHD “are health-related data created, recorded, or gathered by or from patients (or family members or other caregivers) to help address a health concern.” Aside from recording health data manually, patients can collect such data by using various PGHD-recording tools, including mobile apps and online monitoring equipment. In recent years, Web-based applications have provided different ways to store, display, and share medical observations. (Andry et al. 2009) PGHD differ completely from traditional clinical data, which include vital signs, problem lists, and prescriptions. PGHD are distinct from data generated in clinical settings and through encounters with providers in two important ways: First, patients, not physicians, are primarily responsible for recording or capturing these data. Second, patients can choose how to share the data with physicians or other individuals. Physicians obtain complete information regarding an individual patient’s health from PGHD. Especially during medical visits, PGHD are usually gathered on an ongoing basis rather than only at one point. Such data provide significant information about how patients are doing and therefore ensure an accurate diagnosis. Physicians can also use PGHD to remotely monitor patients and reduce office and emergency room visits.
PGHD generally include a patient’s health history, treatment history, biometric data, symptoms, and lifestyle

59
choices. After obtaining PGHD from patients, physicians need processes and time to evaluate this information, in order to determine whether these should be incorporated into patient records. These data can provide patients with information on how to select tracking equipment; patients follow a physician’s guide to choosing the equipment that they want to use.
Depending on a patient’s education, health literacy, and similar factors, however, some patients can record symptom patterns manually. For example, they can monitor symptoms and other data on a daily basis by using spreadsheets. PGHD play an important role in visual storytelling, regardless of the data recording method used. Patients should use these data as bases in crafting their visual narratives. They can use the data to create timelines, bar charts, and diagrams to ensure direct awareness of their health conditions. This approach also enables physicians to accurately understand a patient, provide an accurate diagnosis, and deliver sufficient treatment.

60
“More than just the facts and patient may tell lie.”

61
4.2 Patients’ stories
Patient stories have universal appeal because they dominate our culture in terms of personal reminiscences, literature, movies, and the media. Stories in medicine also stimulate fascination and inspiration among patients and physicians. A story melds understanding of why things happen and who is affected when they do. In The Power of Patient Stories: Learning Moments in Medicine, Paul F. Griner mentioned that physician afford patients opportunities to talk about family, sports, and politics. Perhaps, the topics that patients and physicians talk about is unimportant. What is significant is the chance for a patient to temporarily disengage from the concerns brought forth by a terrible disease. It is a chance for human interaction on an intensely personal level.
A patient’s story often provides not only the what, where, and when extracted in an interview but also the why and how. In accordance with the extracted story, physicians formulate patient-related assumptions, which may be true for most people but not necessarily for a particular individual. Physicians understand what kind of patients suffer from a given disease by listening to their stories. As emphasized earlier, a more important goal is to determine what kind of patients have a disease than what type of disease a person has. Illness is much more than a series of symptoms. It is connected to the stories regarding issues that may have caused symptoms, such as a patient’s habits and his or her family history.
62
Every Patient Tells a Story: Medical Mysteries and the Art of Diagnosis explains that “the experience of being sick is frequently interlaced with feelings and meanings that shape and color a patient’s experience and perception of a disease in ways that are unimaginable and unanticipated by the doctor.” (Sanders 2010) A patient’s story embeds more personal and particular meaning into patient–physician exchange. Health care providers cannot derive this meaning from only a description of symptoms and an observation of signs. This meaning also advances diagnosis.
When patients tell their stories, they evaluate the narratives that they want to share from many perspectives and are concerned about many narrative features. A family history and financial concerns may likewise affect how patients convey their stories. For example, a family history of heart disease or care may drive a patient to minimize a symptom. Some patients may be too embarrassed to share certain stories. Patients’ stories consist of their original narratives and the feedback story provided by physicians. The patients narrate the stories about their symptoms and illness to the physicians, who then reshape the elements of the stories into medical form and make a diagnosis with the help of the narratives. The patients obtain feedback from the physicians and begin to understand what happens to their bodies. The greater the patients’ understanding of their illnesses and their treatments, the more likely they

63
will be able to perform their roles in the treatment. The patients incorporate the feedback into the larger stories of their lives, and the knowledge from such feedback will help them make sense of the larger context that surrounds their lives.
This thesis presents a few guidelines for telling a good patient story. First, patients should talk about what they know, such as personal experiences with another patient or as a patient. Second, they should use specific details and names whenever possible. Third, they should introduce their stories with the key takeaway message. Fourth, they should keep their stories short. These tips make a patient story more specific and more detail, physicians can build a particular model for the patient. It is good for diagnosis and treatment.

64
4.3 Case studies and examples (Katie McCurdy)
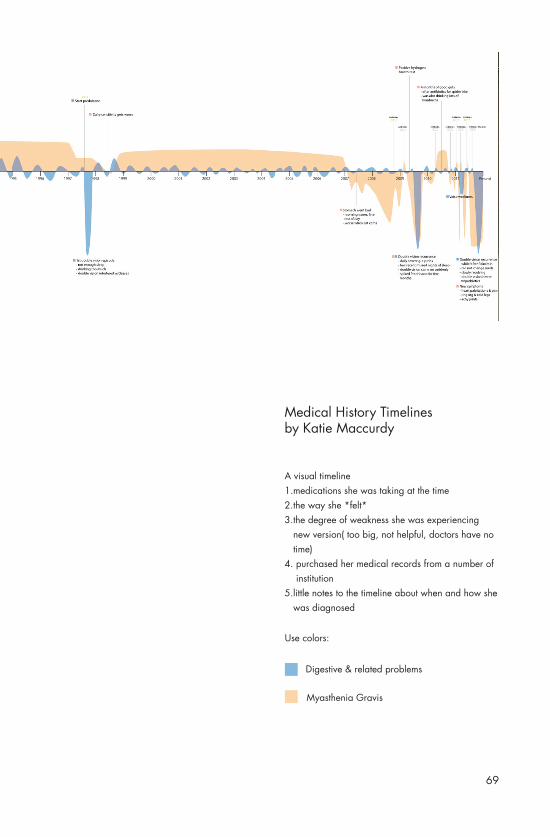
Katie McCurdy, an experienced designer, is managing two autoimmune conditions: her long-time myasthenia gravis and her stomach problem. She said she uses design, empathy, and love to empower patients and improve health care. She assigned herself a task wherein she is required to visualize her own medical history and symptoms and create a timeline that records her medical history beginning from 1978. Her work is the inspiration of my thesis. In her medical history timeline, she pointed out the medications that she was taking, the way she felt, the degree of weakness that she was experiencing, and notes about when and how she was diagnosed. She redrew the timeline (Figure 15) about two times because after communicating with her physicians, she found the timeline to have an excessively large scope. It was unhelpful, and her physicians had no time to read all of the information that it contained. So she improved her work after each visit, each medical visit gave her inspiration for her work. She knew more about her disease because of the perfect visualization that she implemented.
She also drew some pictures (Figure 13,14) to illustrate symptoms and their contexts. As we know, symptoms are invisible, but Katie McCurdy made these visible by illustrating them and using her drawings to explain her feelings to her husband, co-workers, doctors, and friends. She wrote down some of these sensations so that she can better communicate what she is feeling to her doctors in the future.

65
Figure 13

66
Figure 14
67
She recommended four methods of visualization. Patients can (1) create a visual timeline that charts the progression of a disease, the patterns of certain symptoms, the way patients feel, the degree of weakness experienced, medical records, and notes regarding when and how a disease was diagnosed. Patients can also (2) map out the different sensations that they feel on an outline of the human body by using colors and shapes. They can (3) illustrate daily self-management and (4) use interactive health apps to record their health data. As mentioned previously, existing visual storytelling methods are implemented and redesigned in the current research. An advantage of the redesign in this thesis is that it provides all the steps necessary in visual storytelling.

68
Figure 15
69
Use colors:
Digestive & related problems
Myasthenia Gravis
Medical History Timelines by Katie Maccurdy
A visual timeline1.medications she was taking at the time2.the way she *felt*3.the degree of weakness she was experiencing new version( too big, not helpful, doctors have no time)4. purchased her medical records from a number of institution5.little notes to the timeline about when and how she was diagnosed

70
4.4 Information design for the medical field
Information design techniques are widely used in different kinds of medical diagrams, especially in the past, because at that time, technology was minimally developed. Physicians diagnosed patients without the help of modern innovations. In the past, no microscope, stethoscope, and other medical equipment were available. The tools used to facilitate diagnosis are hand-drawn diagrams. When using past medical diagrams, an important requirement is to arrange the information on these diagrams by using basic information design techniques.
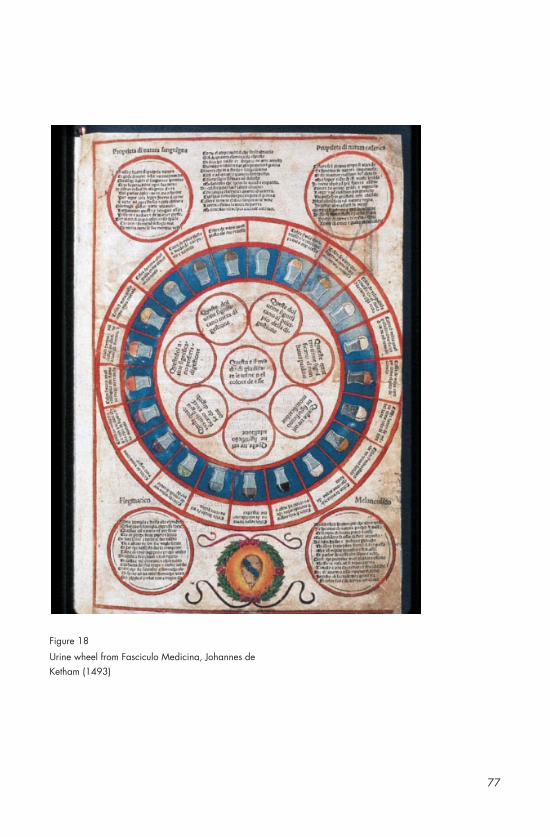
The first information design used in the field of medicine is the urine wheel (Figure 16,17,18,19). First appearing in the early 16th century, the urine wheel was used to diagnose diseases on the basis of the smell, color, and taste of a patient’s urine. It was designed to help physicians create a sensory map of a patient’s urine. Human metabolism is affected by many diseases, and many changes to metabolism can be detected in urine. Changes in urine color are the most easily perceptible symptoms. Understanding urine’s varying colors from a chemistry perspective, I found that alterations to color “are due to an assortment of different inorganic salts and organic compounds that the body excretes as soluble waste.” Urine color can be a symptom of certain health issues. In the 16th century, physicians could determine a patient’s problem by simply tasting and/or looking at urine samples. They then compared the feelings and

71
sensation that they observed with the urine wheel to determine the disease that a patient has contracted.I observed that, in general, the urine wheel is a kind of diagram that connects the color of urine to certain diseases. It usually contains 20 different urine flasks that reflect urine of different colors and fall within the circular diagram. The flasks are aligned around the outer border of the circle, and descriptions of different diseases line the inner boundary of the circle. Each flask has a line that connects it to a description of a disease. Physicians regard this diagram as a reference for understanding disease on the basis of urine. By 1881, disease diagnosis via the urine wheel was replaced by chemical analysis, which remains an applied diagnostic method to this day.
That people categorize and arrange information such as color, smell, and flavor into wheels or other diagrams is interesting, but an important consideration is that these methods affect our perceptions and even the diagnosis of doctors. Because the urine wheel is used to diagnose diseases on the basis of urine color, the flasks in the urine wheel reflect the actual colors of urine. It serves as inspiration for drawing the actual symptoms and signs in a patient’s symptom journal.
In some ways, the urine wheel is colorful; it also offers suggestions on the use of color as basis for diagnosis. Generally, however, the use of color in other contexts

72
differs from the way it is used in the urine wheel, we use color to explain abstract ideas. In the medical field, for example, color codes are used to help patients accurately identify the roles of hospital staff. A special hospital emergency code system is used in hospitals to alert staff to various emergencies. “Hospital emergency codes may denote different events at different hospitals.” (Hospital emergency codes 2011) Every hospital or institution has its own codes. In this thesis, California’s Health Care Emergency Code is used as an example. This code system is defined with the help of the Hospital Association of Southern California Security and Safety Committee and AllHealth Security Services. The committee adopted the system in July 2000, and the standardized code names still have influence today, they used as bases in improving codes. A hospital emergency code is used primarily to convey the type of emergencies that confront hospitals: RED stands for fire, BLUE for adult medical emergencies, WHITE for pediatric medical emergencies, PINK for infant abduction, PURPLE for child abduction, YELLOW for bomb threats, GRAY for the presence of a combative person, SILVER for the presence of a person with a weapon and/or an active shooter and/or a hostage situation, ORANGE for hazardous material spill/release, and GREEN for patient elopement. Although useful, these codes appear to be unrelated to a symptom journal. From a code system, patients learn what color physicians feel comfortable with and are accustomed to using. For example, physicians are
73
familiar with red; in a hospital emergency code system, red stands for fire, but in a symptom journal, red can be used to indicate a very uncomfortable situation. A fire and an uncomfortable situation share one characteristic: they are both urgent.familiar with red; in a hospital emergency code system, red stands for fire, but in a symptom journal, red can be used to indicate a very uncomfortable situation. A fire and an uncomfortable situation share one characteristic: they are both urgent.When physicians see red in a patient’s journal, they are conscious of the seriousness of a problem. In my opinion, physicians prefer red and blue codes because arteries are blue and veins are red. They are types of blood vessels that run through the human body, pumping blood to ensure normal functioning. When patients use color codes in visual storytelling, a favorable approach is to regard hospital emergency code systems or other medical color systems as a reference so that they can identify the colors that physicians always encounter and are familiar with. Patients can create their own color code system in their visual storytelling. This will help physicians sufficiently understand patients’ narratives. Color has power, and people use it express or change mood. Color is also a language. People from different regions can communicate with color. Additionally, because physicians and hospital employees around the world communicate with color, the use of a color code diminishes misunderstanding between physicians and
staff. To reduce confusion among physicians and
74
employees, a uniform hospital emergency code system should be used. A patient can then create a symptom journal that sufficiently provides information by following the hospital emergency code system. This strategy can reduce misunderstanding in patient–physician exchange.
Many diagrams, such as organ diagrams, trigger point diagrams, and foot reflexology and ear reflexology diagrams, are still being used today. Physicians are familiar with these diagrams. Small illustrations of organs help them understand a patient’s symptoms and disease conditions.

75
Figure 16
The urine wheel for diagnosing metabolic diseases, from Epiphanie Medicorum by Ullrich Pinder(1506)

76
Figure 17
77
Figure 18
Urine wheel from Fasciculo Medicina, Johannes de Ketham (1493)

78
Figure 19
Ulrich Pinder (d. ca. 1510 or 1519), a Nuremberg physician, wrote this richly annotated practical medical handbook that contains sections on uroscopy, the heart and pulse, and classification of fevers.

79
The principal motivation of patients in exercising visual storytelling is to find ways to express themselves visually, obtain a new understanding of their health, and derive help from findings. These will change the ways in which they care for themselves. Another benefit contributed by this thesis is that they will realize that the process of visual storytelling is enjoyable.
In general, some patients with certain diseases need to spend a considerable time at home. They can use this time to write symptom diaries and visualize their situations. During the crafting process, they familiarize themselves with their illnesses and put forward more opinions regarding their diseases. This process is also helpful in patient–physician exchange. Patients have other experiences, not only pain, during their treatment. They may also regard certain tasks of visual storytelling as interesting, such as illustrating miniature versions of the human body. Other tasks, such as the recording of symptoms, may be uninteresting to patients, but they will realize that these exercises improve their understanding of their illnesses; it is a route to healing and pleasure. This kind of enjoyment can motivate patients to persevere in visual storytelling.
Physicians may learn how to read their patients’ visual stories and form a better understanding of these individuals. Because visual storytelling captures the attention of physicians, they will be interested in
4.5 Motivation for symptom-driven visual storytelling
80
the meaning of each part of a narrative. Learning more means physicians will be able to give an accurate diagnosis and high-quality treatment to patients. The ultimate goal of patient–physician exchange is to cure patients; in participating in visual storytelling, patients in turn help physicians achieve this goal. Given these considerations, visual storytelling is a worthwhile endeavor.

81
Chapter 5: Daily Gastritis Tracker

82
5.1 What is a daily gastritis tracker?
A daily gastritis tracker is a system that can help patients record their symptoms, signs, feeling levels, medications, and daily diets and activities. Once patients have recorded their gastritis conditions, they can use this information that can share with physicians many times throughout a day. The daily gastritis tracker works with two parts, the first part includes a body shape board (Figure 20) and different stickers (Figure 21). The second part includes one data transform app. The first parts is used by patient, and the second part is used to communicate with physicians.One benefit offered by the daily gastritis tracker is that it is an enjoyable tool that encourages patients to consistently incorporate entries into their symptom diaries.

83
5.2 Stickers and body shape board
Gastritis patients stick different icons on a body shape board to record their symptoms, feeling levels, signs, medications, and daily diets and activities. The body shape board can be used repeatedly, and it can be used to record symptoms in a journal each time patients feel better or worse.
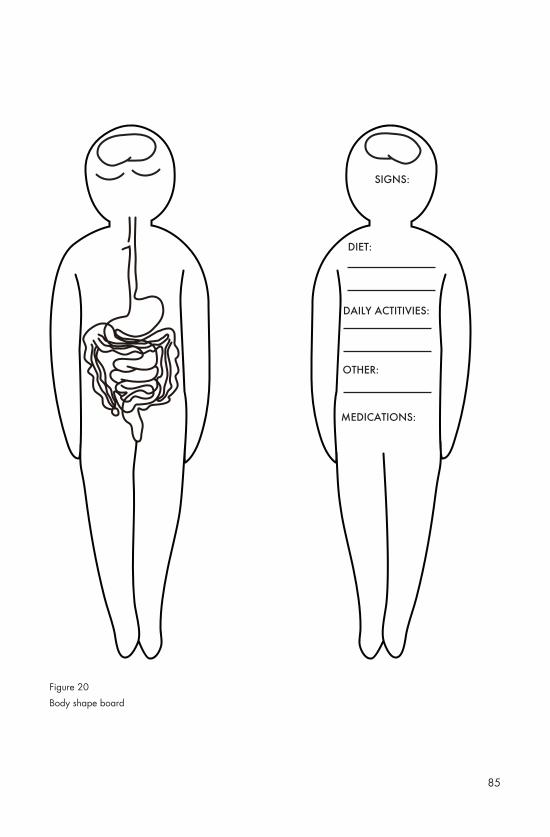
The front of the body board is for symptom stickers. Symptoms are usually internal and can cause digestive lesions in different locations. To help patients show their symptoms clearly, the digestive system is drawn on the front of the body board. The back side of the body board is used for sign stickers. Patients can also remark on their daily diets, daily activities, and other feelings experienced on a given day. Why do patients need to comment on these issues instead of using the stickers? After considerable research, I found that the varieties of symptoms and signs are fixed. A patient suffering from stomach problems, for instance, exhibits one of the symptoms or signs that are reflected in the stickers that I drew for them. For daily activities and diets and other feelings, however, different patients have completely varying experiences. Remarking on these issues is a more favorable approach. At the bottom of the back side of body board, a space is allotted for patients to place stickers regarding the medicines that they take each day. This part is necessary because physicians can detect which medicine is useful on the basis of the efficacy of each medication. They can then decide on whether to change the medicine immediately to ensure better treatment.
84
whether to change the medicine immediately to ensure better treatment.
Steps:1. Patient sticks symptom icons experienced that day on the front side of the body shape board.2. Patient sticks sign icons experienced that day on the backside of the body shape board.3. Patient remarks daily diets, daily activities and other feelings experienced that day. 4. Patient checks off any medications he or she takes that day.
85
SIGNS:
DIET:
MEDICATIONS:
DAILY ACTITIVIES:
OTHER:
Figure 20
Body shape board

86
VomitingHiccups
Symptoms:
Signs:
Loss of appetite Abdominal pain Indigestion Buring or grawingfeeling in the stomach
Abdominal bloating Headache
Figure 21
Stickers

87
Buring or grawingfeeling in the stomach
Very Mild Tolerable Distressing Very Distressing
Intense Very IntenseUtterly Horrible
Excruciating Unbearable
Unimaginable Unspeakable
Discomforting
1 2 3 4 5
6 7 8 9 10
Feeling level:
Medications:
TRIMOX Alka-Seltzer
Rolaids
ZantacClarithromycin Prilosec
moxatag
AMOXICILLIN
Pepcid
Nexium

88
5.3 Data transformation app
Gastritis patients can scan their completed body shape board each day by using the data transformation app, which can read the locations of symptoms and the feeling levels associated with them. It can also read signs and medications. After the app has read the data, it automatically creates a video, from which physicians can learn about a patient’s symptoms, signs, medications, and changes in symptoms and feelings over time. These changes can then be used as bases in determining the usefulness of medications. The video functionality allows the collection and storage of one month-long data.
Steps:5. Patient takes a photo of his or her finished body shape board, the app will read the QRcodes (Figure 23) behind each sticker and put the transformed information into video. 6. Patient types extra remarks about his or her daily diets, daily activities, stress and others.
Figure 22
QRcode

89

90
2016.03.05
Loss of appetite
Burning and gnawing feeling in the stomach between meals or at nigh
Abdominal bloating
Headache
left
right
Indigestion
Abdominal pain
11
11
1
2
2
WORSENORMALBETTER
DATE DATE DATE
Feeling at that day:
the number of symptom: 1-2 3-45 -10
feeling level: 4-10
Figure 23
The interface of a video

91
right

92
Figure 24
Symptom-driven Visual Storytelling
103.16 03.17 03.18 03.19 03.20 03.21 03.22 03.23 03.24 03.25 03.26 03.27 03.28 03.29 03.30 03.31

93
Chapter 6: Conclusion

94
Overview the thesis, making symptom-driven visual storytelling is a new visual model in patient-physician exchange, visual storytelling use visual ways to exchange information. Patient memories are strongly enhanced by stories and they will retain the information shared through a story than information presented through detail points itself.
The thesis points out the function of visual storytelling in patient-physician exchange, researches the ways that be used to present visual storytelling, and find how to include them in visual storytelling. It finds some examples of making visual storytelling. In the future, the research can explore the relationship between the data that get from some symptom tracking apps and patient hand-record symptom data, what is the different between them. Additionally, the research can find the stories out of data. And one thing the research can explore is how do designer get these types of tools into more patients’ and families hands so that they can start telling better more effective stories.
There are many potential questions can be probed and answered in symptom-driven visual storytelling.

95
Bibliography
96
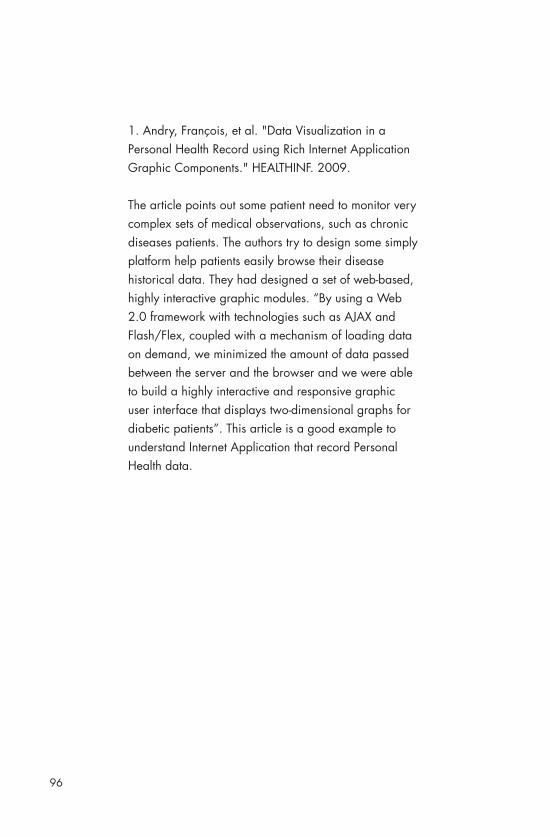
1. Andry, François, et al. "Data Visualization in a Personal Health Record using Rich Internet Application Graphic Components." HEALTHINF. 2009.
The article points out some patient need to monitor very complex sets of medical observations, such as chronic diseases patients. The authors try to design some simply platform help patients easily browse their disease historical data. They had designed a set of web-based, highly interactive graphic modules. “By using a Web 2.0 framework with technologies such as AJAX and Flash/Flex, coupled with a mechanism of loading data on demand, we minimized the amount of data passed between the server and the browser and we were able to build a highly interactive and responsive graphic user interface that displays two-dimensional graphs for diabetic patients”. This article is a good example to understand Internet Application that record Personal Health data.

97
2. Drew, Sarah E., Rony E. Duncan, and Susan M. Sawyer. "Visual storytelling: A beneficial but challenging method for health research with young people." Qualitative Health Research 20.12 (2010): 1677-1688.
The article treats visual storytelling as a new research approach that drawing on established methods of photo voice and photo elicitation. The authors determine young people as audiences. They use it during a study of chronic disease self-management in adolescents by the help of visual storytelling way. They interview with 68 participants, ask them the value of visual storytelling and analyze the answers from participants. Among the values, promoting self-understanding and promoting expression communication are two of the important effects in healthcare, in patient-physician exchange.
3. Dyson, George. "Information Is Cheap, Meaning Is Expensive." The European. October 10, 2011. http://www.theeuropean-magazine.com/352-dyson-george/353-evolution-and-innovation.

98
4. Griner, Paul F. The Power of Patient Stories: Learning Moments in Medicine. CreateSpace Independent Publishing Platform, 2012
Doctor Griner, as a prominent physician, writes this book to help students and the public better understand patient care through insights gained from his real- life stories. He describes a series of medical cases he has encountered in his six-decade medical career, the cases illustrate the importance of careful communication and observation, the value of listening closely to what patient say. He poses some questions in the end of each cases, the questions provoke readers think deeply. It is good to be used as teaching tool and to be read by general public simply.
5. Hall, Harriet. "Storytelling in Medicine." Science-Based Medicine. December 18, 2012. https://www.sciencebasedmedicine.org/storytelling-in-medicine/.
6. Hodge, Bryan. "The Use of Symptom Diaries in Outpatient Care. “Family Practice Management. May-June, 2013. http://www.aafp.org/fpm/2013/0500/p24.html.
7. Hospital emergency codes-wikipedia.May,2011,from https://en.wikipedia.org/wiki/Hospital_emergency_ codes
99
8. Kearns, Sarah. “Storytelling in Healthcare Enhances Experience for Patients and Providers.” HealthLeaders Media. 2009.
The journal describes how amount of facilities in the United States and the United Kingdom use storytelling to enhance the information that comes out of the patient history taken by a care provider. This journal offers a suggestion that storytelling is often used to get a better sense of how to treat the patient. Storytelling also helps providers develop a relationship with the patient and form a better understanding of an individual case.
9. Klanten, Robert, Ehmann, Sven, and Schulze, Floyd. Visual storytelling: Inspiring a new visual language. Gestalten, 2011.
“A new visual language that is both informative and entertaining is emerging at the nexus of information graphics, illustration, and tactile design.” This book collects works from designers, illustrators and data journalists, they develop amount of new visualization to illustrate information that can be classified as visual storytelling. Visual storytelling is a new language for the information age. Today, visual storytelling is being used widely in newspaper, websites, advertising and other mediums. The cases in this book are interactive, inspiring, they depict the creation process of some other mediums. The cases in this book are interactive, inspiring, they depict the creation process of some infographics by using images and hand draw draft. People who are doing information design work should read this book.

100
10. McCurdy, Katie. "Visual storytelling in healthcare: Why we should help patients visualize their health." Information Visualization (2015): 1473871615592255.
This article is written by Katie McCurdy, she is a user experience designer and long-time Myasthenia Gravis patient, she would like to write the article to tell about her own health story and the circumstances that led her to experiment with communicating in a more visual manner. In the article, she suggests four used ways of visualizing patients’ symptom-driven visual storytelling. Katie make a health visualization timeline as an example to guide patients how to make a symptom-driven visual storytelling.
11.Popova, Maria. "Visual Storytelling: New Language for the Information Age" brainpickings. October 25, 2011. https://www.brainpickings.org/2011/10/25/visual-storytelling-gestalten/.
12. Rose, C.; Parker, A.; Jefferson, B.; Cartmell, E. (2015). "The Characterization of Feces and Urine: A Review of the Literature to Inform Advanced Treatment Technology". Critical Reviews in Environmental Science and Technology 45 (17): 1827–1879. doi:10.1080/10643389.2014.1000761. ISSN 1064-3389
101
13. Sanders, Lisa. Every patient tells a story: medical mysteries and the art of diagnosis. Random House LLC, 2010.
Yale School of Medicine physician Dr. Lisa Sanders, who is the author of the monthly New York Times Magazine column “Diagnosis,” and the inspiration for the hit Fox TV series House, M.D, writes the book. She presents many dramatic stories of patients that mostly include every illness and diagnosis whether correct or not. She exposes the uncertain that physicians face when diagnose patients who are sick. Sanders depict the necessity and difficulties of getting patient’s story. Additionally, Sanders explains the pitfalls of using medical technology.
14. Scott, Shannon D., et al. "Protocol for a systematic review of the use of narrative storytelling and visual-arts-based approaches as knowledge translation tools in healthcare." Systematic reviews 2.1 (2013): 19.
Storytelling and visual art are powerful, they have the potential to create shared, embodied understandings through imparting knowledge. This study is the first to systematically identify and synthesize current research on narrative storytelling and visual art to translate and disseminate health research.
102
15. Wen, Leana, and Joshua Kosowsky. When doctors Don't listen: How to avoid misdiagnoses and unnecessary tests. Macmillan, 2013.
The book uses real patient stories to illustrate patient participation can prevent diagnosis mistake. Each horrifying example point out the pitfalls of training physicians not to listen to patients’ stories, and diagnose according different patients’ conditions. “Ruling in” diagnoses are not accurate. What’s more, the authors encourage patient to be their own best advocate for their health, they give tips about how you can approach your doctor. Inside tips include: • How to deal with a doctor who seems too busy to listen to you• 8-Pillars to a Better Diagnosis• How to tell the whole story of your illness?• Learning test risks and evaluating whether they’re worth it
16. Meirelles, Isabel. Design for information: an introduction to the histories, theories, and best practices behind effective information visualizations. Rockport publishers, 2013.