s.y. b.sc. (it) : sem. iv computer graphics and...
TRANSCRIPT
- 1 -
S.Y. B.Sc. (IT) : Sem. IV Computer Graphics and Animation
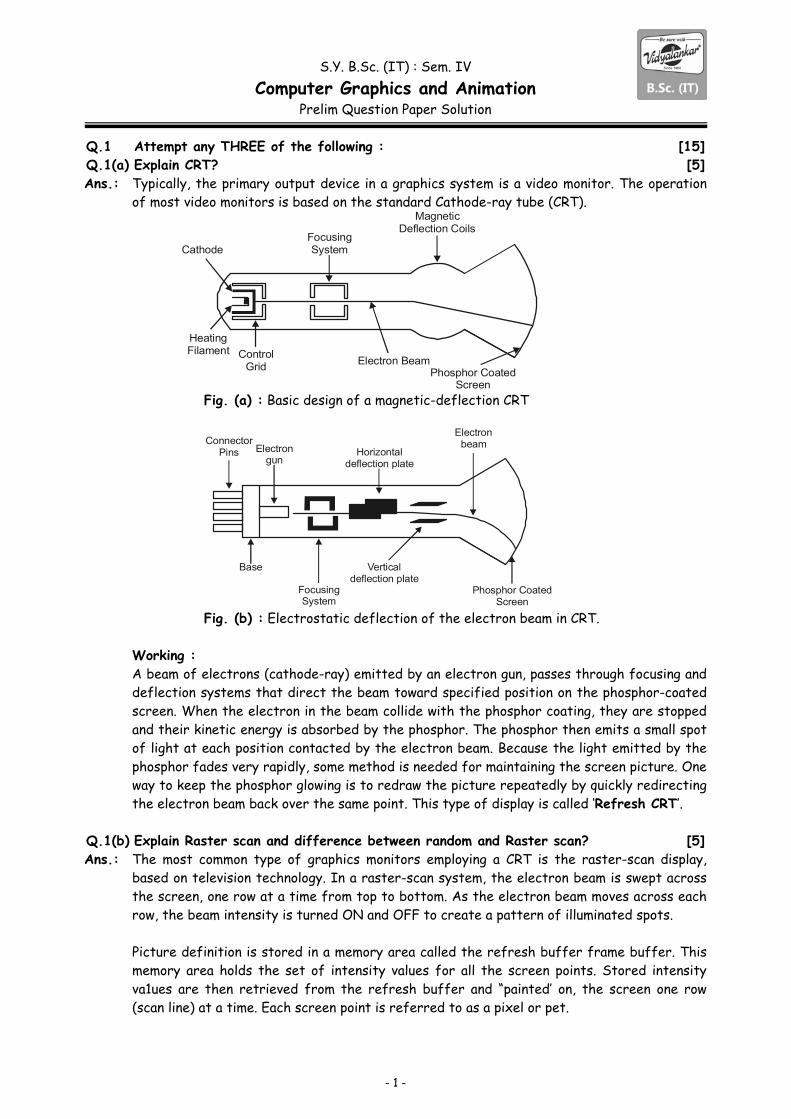
Prelim Question Paper Solution Q.1 Attempt any THREE of the following : [15]Q.1(a) Explain CRT? [5]Ans.: Typically, the primary output device in a graphics system is a video monitor. The operation
of most video monitors is based on the standard Cathode-ray tube (CRT).
FocusingSystem
Magnetic Deflection Coils
Electron BeamControl
Grid
Heating Filament
Cathode
Phosphor CoatedScreen
Fig. (a) : Basic design of a magnetic-deflection CRT
Horizontal deflection plate
Electron beam
Vertical deflection plate
Phosphor CoatedScreen
Electron gun
Base
Connector Pins
Focusing System
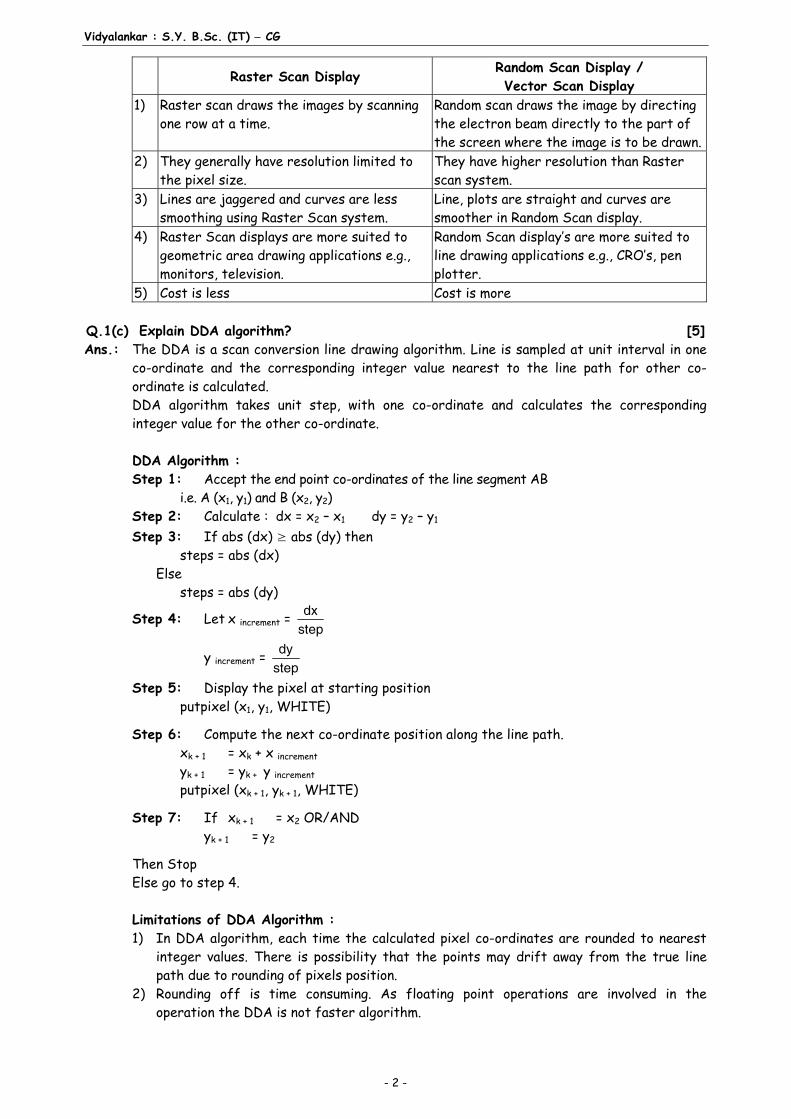
Fig. (b) : Electrostatic deflection of the electron beam in CRT. Working : A beam of electrons (cathode-ray) emitted by an electron gun, passes through focusing and
deflection systems that direct the beam toward specified position on the phosphor-coated screen. When the electron in the beam collide with the phosphor coating, they are stopped and their kinetic energy is absorbed by the phosphor. The phosphor then emits a small spot of light at each position contacted by the electron beam. Because the light emitted by the phosphor fades very rapidly, some method is needed for maintaining the screen picture. One way to keep the phosphor glowing is to redraw the picture repeatedly by quickly redirecting the electron beam back over the same point. This type of display is called ‘Refresh CRT’.
Q.1(b) Explain Raster scan and difference between random and Raster scan? [5]Ans.: The most common type of graphics monitors employing a CRT is the raster-scan display,
based on television technology. In a raster-scan system, the electron beam is swept across the screen, one row at a time from top to bottom. As the electron beam moves across each row, the beam intensity is turned ON and OFF to create a pattern of illuminated spots.
Picture definition is stored in a memory area called the refresh buffer frame buffer. This
memory area holds the set of intensity values for all the screen points. Stored intensity va1ues are then retrieved from the refresh buffer and “painted’ on, the screen one row (scan line) at a time. Each screen point is referred to as a pixel or pet.
Vidyalankar : S.Y. B.Sc. (IT) CG
- 2 -
Raster Scan Display Random Scan Display / Vector Scan Display
1) Raster scan draws the images by scanning one row at a time.
Random scan draws the image by directing the electron beam directly to the part of the screen where the image is to be drawn.
2) They generally have resolution limited to the pixel size.
They have higher resolution than Raster scan system.
3) Lines are jaggered and curves are less smoothing using Raster Scan system.
Line, plots are straight and curves are smoother in Random Scan display.
4) Raster Scan displays are more suited to geometric area drawing applications e.g., monitors, television.
Random Scan display’s are more suited to line drawing applications e.g., CRO’s, pen plotter.
5) Cost is less Cost is more Q.1(c) Explain DDA algorithm? [5]Ans.: The DDA is a scan conversion line drawing algorithm. Line is sampled at unit interval in one
co-ordinate and the corresponding integer value nearest to the line path for other co-ordinate is calculated.
DDA algorithm takes unit step, with one co-ordinate and calculates the corresponding integer value for the other co-ordinate.
DDA Algorithm : Step 1: Accept the end point co-ordinates of the line segment AB i.e. A (x1, y1) and B (x2, y2) Step 2: Calculate : dx = x2 – x1 dy = y2 – y1 Step 3: If abs (dx) ≥ abs (dy) then steps = abs (dx) Else steps = abs (dy)
Step 4: Let x increment = dxstep
y increment = dystep
Step 5: Display the pixel at starting position putpixel (x1, y1, WHITE)
Step 6: Compute the next co-ordinate position along the line path. xk + 1 = xk + x increment yk + 1 = yk + y increment putpixel (xk + 1, yk + 1, WHITE)
Step 7: If xk + 1 = x2 OR/AND yk + 1 = y2
Then Stop Else go to step 4. Limitations of DDA Algorithm : 1) In DDA algorithm, each time the calculated pixel co-ordinates are rounded to nearest
integer values. There is possibility that the points may drift away from the true line path due to rounding of pixels position.
2) Rounding off is time consuming. As floating point operations are involved in the operation the DDA is not faster algorithm.
Prelim Question Paper Solution
- 3 -
Q.1(d) Explain Mid-point circle drawing algorithm? [5]Ans.: Mid-Point Circle Algorithm: Step 1: Accept the radius r and center (xc, yc) of a circle. The first point of the
circumference of a circle with center as origine is (x0 , y0) = (0, r)
Step 2: Calculate the initial decision parameter as
P0 = 54
r ≈ 1 – r ( radius is integer value)
Step 3: At each xk position starting at k = 0 perform the following test. If Pk < 0 Then xk + 1 = xk + 1 yk + 1 = yk
Pk + 1 = Pk + 2xk + 3 Otherwise xk + 1 = xk + 1 yk + 1 = yk – 1 Pk + 1 = Pk + 2 (xk – yk) + 5
Step 4: Determine the symmetry points in other seven octants.
Step 5: Translate each calculated pixel position by T(xk, yk) and display the pixel. x = xk + 1 + xc y = yk + 1 + yc putpixel (x, y, WHITE)
Step 6: Repeat step 3 through 5 until x y.
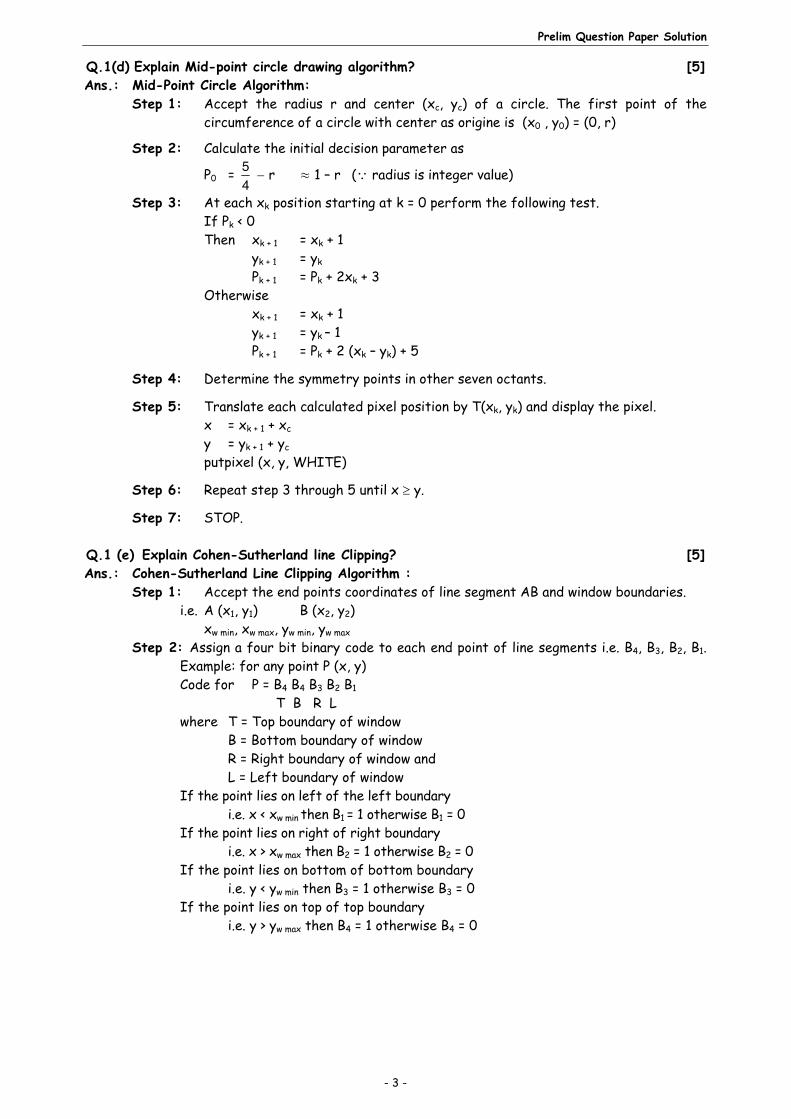
Step 7: STOP. Q.1 (e) Explain Cohen-Sutherland line Clipping? [5]Ans.: Cohen-Sutherland Line Clipping Algorithm : Step 1: Accept the end points coordinates of line segment AB and window boundaries. i.e. A (x1, y1) B (x2, y2) xw min, xw max, yw min, yw max Step 2: Assign a four bit binary code to each end point of line segments i.e. B4, B3, B2, B1.
Example: for any point P (x, y) Code for P = B4 B4 B3 B2 B1
T B R L where T = Top boundary of window B = Bottom boundary of window R = Right boundary of window and L = Left boundary of window If the point lies on left of the left boundary i.e. x < xw min then B1 = 1 otherwise B1 = 0 If the point lies on right of right boundary i.e. x > xw max then B2 = 1 otherwise B2 = 0 If the point lies on bottom of bottom boundary i.e. y < yw min then B3 = 1 otherwise B3 = 0 If the point lies on top of top boundary i.e. y > yw max then B4 = 1 otherwise B4 = 0
Vidyalankar : S.Y. B.Sc. (IT) CG
- 4 -
ywmax
ywmin
xwminxwmax
B B B B0 0 1 0
4 3 2 1
B B B B0 1 1 0
4 3 2 1B B B B0 1 0 0
4 3 2 1B B B B0 1 0 1
4 3 2 1
B B B B0 0 0 1
4 3 2 1
B B B B1 0 0 1
4 3 2 1 B B B B1 0 0 0
4 3 2 1 B B B B1 0 1 0
4 3 2 1
T
L R
B
B B B B0 0 0 0
4 3 2 1
Step 3: (a) Completely Inside: If both end point codes are 0000 then line segment is completely
INSIDE DISPLAY LINE STOP (b) If logical AND operation of both the end point code is NOT 0000. Then the line
segment is completely OUTSIDE. DISCARD IT STOP (c) If upper case (a) and (b) false then the line segment is a clipping candidate.
Step 4: Determine the intersecting boundary for any outside point P. (x, y). Let code P = B4 B3 B2 B1 T B R L
If bit B1 = 1 then line intersect with left intersection boundary and x = xw min If bit B2 = 1 line intersect with right intersection boundary and x = xw max If bit B3 = 1 line intersect with bottom intersection boundary and y = yw min If bit B4 = 1 line intersect with TOP intersection boundary and y = yw max
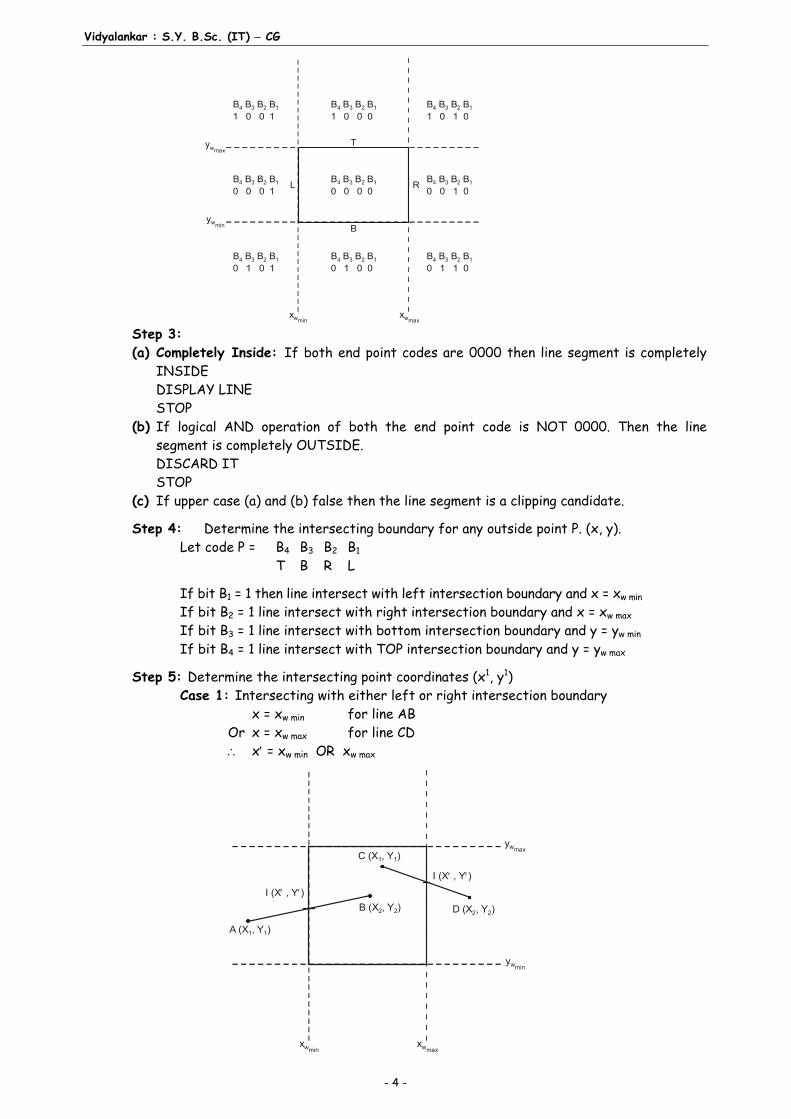
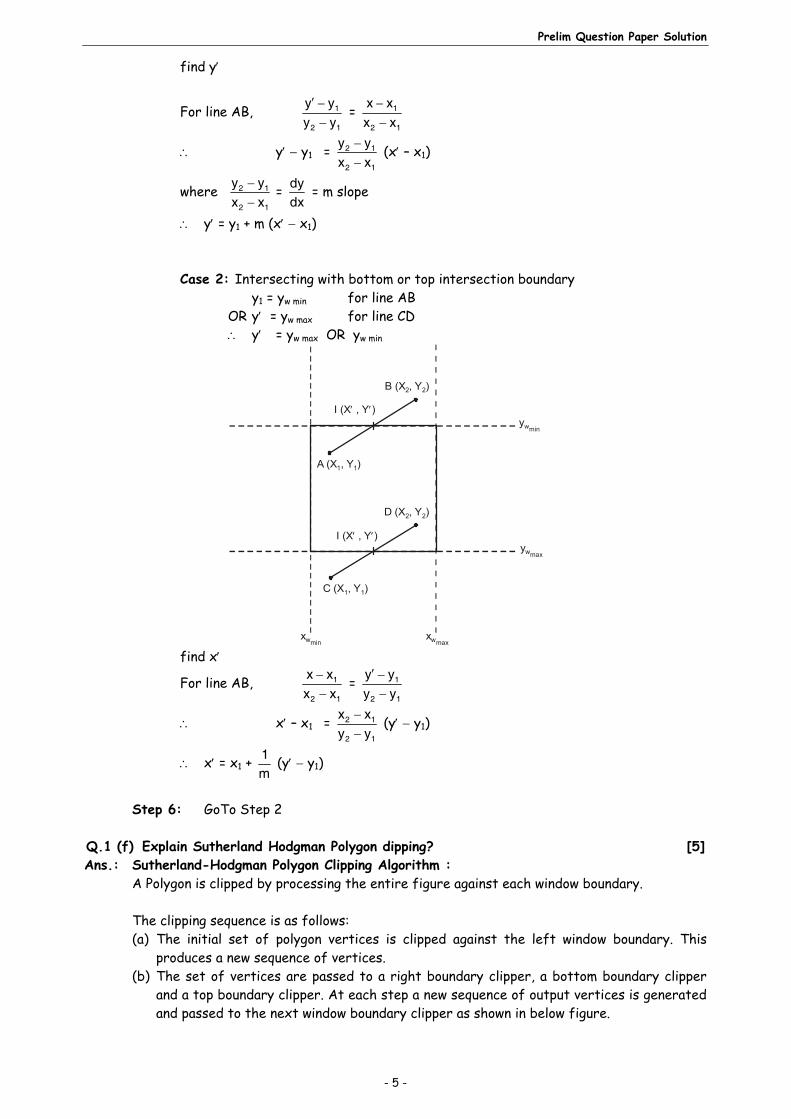
Step 5: Determine the intersecting point coordinates (x1, y1) Case 1: Intersecting with either left or right intersection boundary x = xw min for line AB Or x = xw max for line CD x = xw min OR xw max
ywmax
ywmin
xwminxwmax
A (X , Y )1 1
D (X , Y )2 2B (X , Y )2 2
C (X , Y )1 1
I (X , Y )
I (X , Y )
Prelim Question Paper Solution
- 5 -
find y
For line AB, 1
2 1
y yy y
= 1
2 1
x xx x
y y1 = 2 1
2 1
y yx x
(x – x1)
where 2 1
2 1
y yx x
= dydx
= m slope
y = y1 + m (x x1) Case 2: Intersecting with bottom or top intersection boundary y1 = yw min for line AB OR y = yw max for line CD y = yw max OR yw min
ywmin
ywmax
xwminxwmax
A (X , Y )1 1
D (X , Y )2 2
I (X , Y )
B (X , Y )2 2
I (X , Y )
C (X , Y )1 1
find x
For line AB, 1
2 1
x xx x
= 1
2 1
y yy y
x – x1 = 2 1
2 1
x xy y
(y y1)
x = x1 + 1m
(y y1)
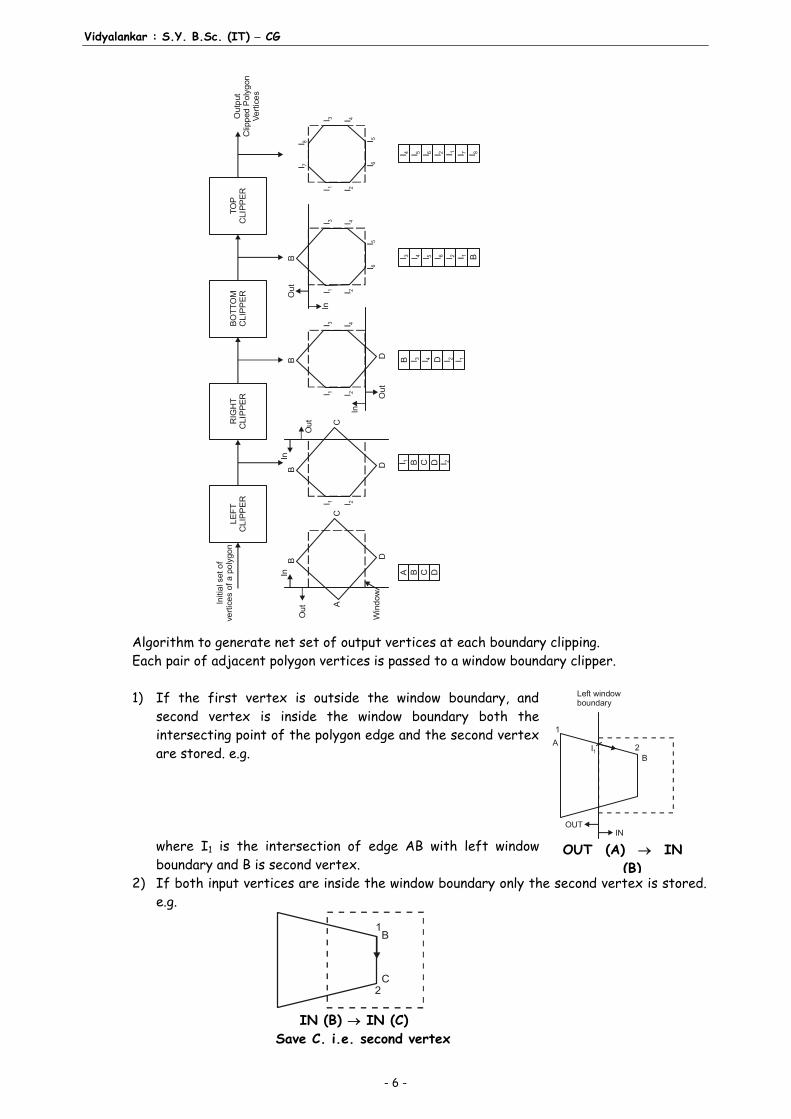
Step 6: GoTo Step 2 Q.1 (f) Explain Sutherland Hodgman Polygon dipping? [5]Ans.: Sutherland-Hodgman Polygon Clipping Algorithm : A Polygon is clipped by processing the entire figure against each window boundary. The clipping sequence is as follows: (a) The initial set of polygon vertices is clipped against the left window boundary. This
produces a new sequence of vertices. (b) The set of vertices are passed to a right boundary clipper, a bottom boundary clipper
and a top boundary clipper. At each step a new sequence of output vertices is generated and passed to the next window boundary clipper as shown in below figure.
Vidyalankar : S.Y. B.Sc. (IT) CG
- 6 -
LE
FT
C
LIP
PE
RR
IGH
T
CLI
PP
ER
BO
TT
OM
C
LIP
PE
RT
OP
C
LIP
PE
R
A
B
C
D
Ou
t
In
Win
dow
I 1 I 2
B
C
D
Ou
t
In
I 1 I 2
B DO
ut
InI 4I 3
I 1 I 2
BO
ut
In
I 4I 3
I 6I 5
I 1 I 2I 4I 3
I 6I 5I 8
I 7
Ou
tput
Clip
ped
Pol
ygon
Ve
rtic
es
Initi
al s
et o
f ve
rtic
es
of a
po
lygo
n
A B C D
I 1 B C D I 2
I 3B D
I 4 I 2 I 1
I 3 I 4 BI 5 I 6 I 2 I 1
I 4 I 5 I 6 I 2 I 1 I 7 I 8
Algorithm to generate net set of output vertices at each boundary clipping. Each pair of adjacent polygon vertices is passed to a window boundary clipper. 1) If the first vertex is outside the window boundary, and
second vertex is inside the window boundary both the intersecting point of the polygon edge and the second vertex are stored. e.g.
where I1 is the intersection of edge AB with left window
boundary and B is second vertex. 2) If both input vertices are inside the window boundary only the second vertex is stored.
e.g.
2
B
C
1
IN (B) IN (C) Save C. i.e. second vertex
Left window boundary
OUT IN
A
1
I1 2 B
OUT (A) IN(B)
Prelim Question Paper Solution
- 7 -
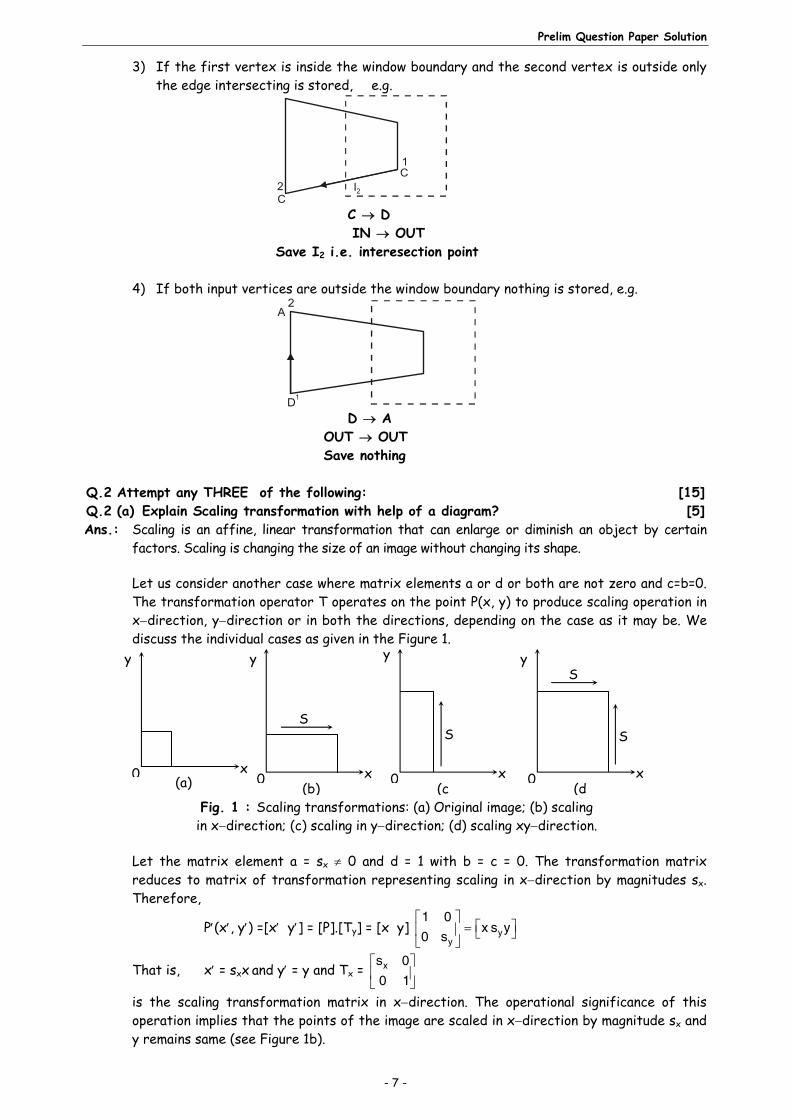
3) If the first vertex is inside the window boundary and the second vertex is outside only the edge intersecting is stored, e.g.
I2
C1
C2
C D IN OUT Save I2 i.e. interesection point 4) If both input vertices are outside the window boundary nothing is stored, e.g.
D1
A2
D A OUT OUT Save nothing Q.2 Attempt any THREE of the following: [15]Q.2 (a) Explain Scaling transformation with help of a diagram? [5]Ans.: Scaling is an affine, linear transformation that can enlarge or diminish an object by certain
factors. Scaling is changing the size of an image without changing its shape. Let us consider another case where matrix elements a or d or both are not zero and c=b=0.
The transformation operator T operates on the point P(x, y) to produce scaling operation in xdirection, ydirection or in both the directions, depending on the case as it may be. We discuss the individual cases as given in the Figure 1.
Let the matrix element a = sx 0 and d = 1 with b = c = 0. The transformation matrix
reduces to matrix of transformation representing scaling in xdirection by magnitudes sx. Therefore,
P(x, y) =[x y] = [P].[Ty] = [x y]
yy
1 0x s y
0 s
That is, x = sxx and y = y and Tx =
xs 00 1
is the scaling transformation matrix in xdirection. The operational significance of this operation implies that the points of the image are scaled in xdirection by magnitude sx and y remains same (see Figure 1b).
Fig. 1 : Scaling transformations: (a) Original image; (b) scaling in xdirection; (c) scaling in ydirection; (d) scaling xydirection.
(a) (b) (c0
y
x
S
S
(d0
y
x
S
0
y
x
S
0
y
x
Vidyalankar : S.Y. B.Sc. (IT) CG
- 8 -
Now let the matrix element a = 1 and d = sy 0 with b = c = 0. The transformation matrix reduces to matrix of transformation representing scaling in ydirection by magnitude sy (see Figure 1c). Therefore,
P(x, y) = [x y] = [P].[Ty] = [x y]
yy
1 0x s y
0 s
That is, x = x and y = syy and Ty = y
1 00 s
is the scaling transformation matrix in y direction. The operational significance of this operation implies that the points of the image are scaled in ydirection by magnitude sy and x remains same.
In general, if one wishes to produces scaling in both x and y simultaneously by magnitude sx in xdirection and sy in ydirection then the condition for such operation is a 1 = sx, d 1 = sy and b = c = 0 (see Figure 1d). Therefore, the matrix of transformation for scaling in xy is
Txy =
x
y
s 00 s
where a = sx and d = sy, sx, and sy are the scaling factors chosen in x and y directions respectively.
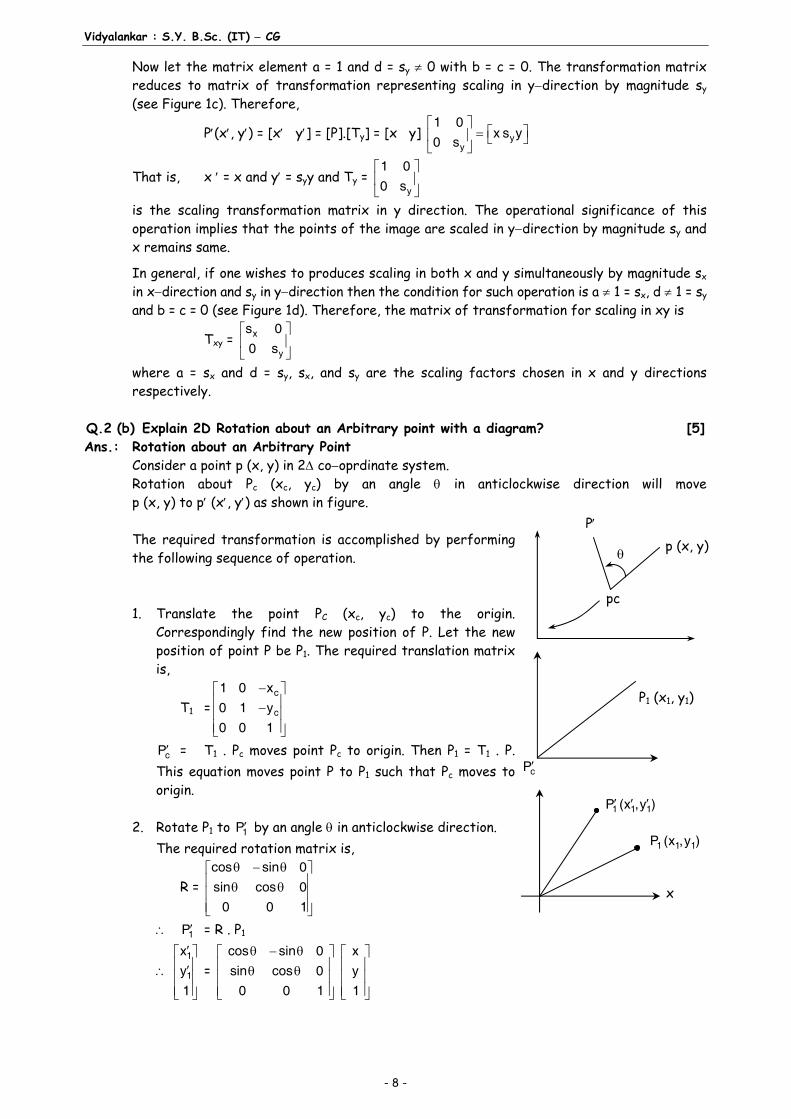
Q.2 (b) Explain 2D Rotation about an Arbitrary point with a diagram? [5]Ans.: Rotation about an Arbitrary Point Consider a point p (x, y) in 2 cooprdinate system. Rotation about Pc (xc, yc) by an angle in anticlockwise direction will move
p (x, y) to p (x, y) as shown in figure. The required transformation is accomplished by performing
the following sequence of operation. 1. Translate the point PC (xc, yc) to the origin.
Correspondingly find the new position of P. Let the new position of point P be P1. The required translation matrix is,
T1 =c
c
1 0 x0 1 y0 0 1
cP = T1 . Pc moves point Pc to origin. Then P1 = T1 . P. This equation moves point P to P1 such that Pc moves to origin.
2. Rotate P1 to 1P by an angle in anticlockwise direction. The required rotation matrix is,
R = cos sin 0sin cos 0
0 0 1
1P = R . P1
1
1
xy1
= cos sin 0 xsin cos 0 y
0 0 1 1
P1 (x1, y1)
cP
P
pc
p (x, y)
1 1 1P (x ,y )
1 1 1P (x ,y )
x
Prelim Question Paper Solution
- 9 -
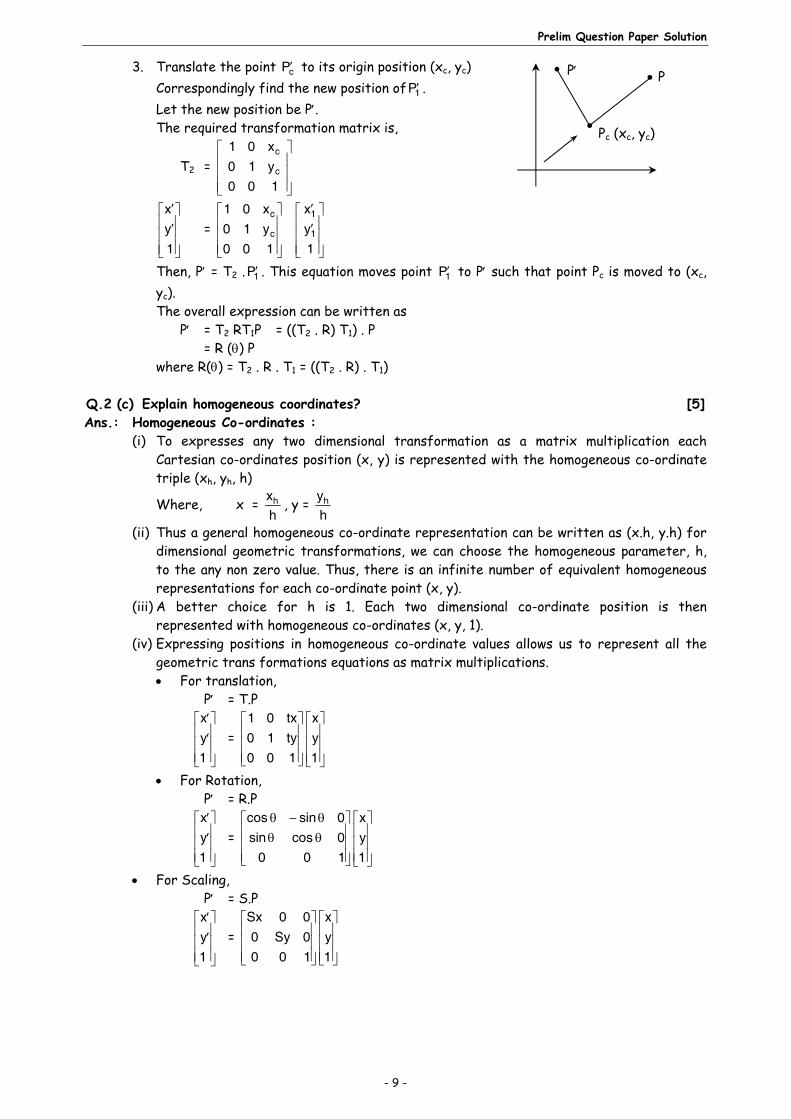
3. Translate the point cP to its origin position (xc, yc) Correspondingly find the new position of 1P . Let the new position be P. The required transformation matrix is,
T2 = c
c
1 0 x0 1 y0 0 1
xy1
= c
c
1 0 x0 1 y0 0 1
1
1
xy1
Then, P = T2 . 1P . This equation moves point 1P to P such that point Pc is moved to (xc, yc).
The overall expression can be written as P = T2 RT1P = ((T2 . R) T1) . P = R () P where R() = T2 . R . T1 = ((T2 . R) . T1) Q.2 (c) Explain homogeneous coordinates? [5]Ans.: Homogeneous Co-ordinates : (i) To expresses any two dimensional transformation as a matrix multiplication each
Cartesian co-ordinates position (x, y) is represented with the homogeneous co-ordinate triple (xh, yh, h)
Where, x = hxh
, y = hyh
(ii) Thus a general homogeneous co-ordinate representation can be written as (x.h, y.h) for dimensional geometric transformations, we can choose the homogeneous parameter, h, to the any non zero value. Thus, there is an infinite number of equivalent homogeneous representations for each co-ordinate point (x, y).
(iii) A better choice for h is 1. Each two dimensional co-ordinate position is then represented with homogeneous co-ordinates (x, y, 1).
(iv) Expressing positions in homogeneous co-ordinate values allows us to represent all the geometric trans formations equations as matrix multiplications.
For translation, P = T.P
xy1
= 1 0 tx x0 1 ty y0 0 1 1
For Rotation, P = R.P
xy1
= cos sin 0 xsin cos 0 y
0 0 1 1
For Scaling, P = S.P
xy1
= Sx 0 0 x0 Sy 0 y0 0 1 1
P P
Pc (xc, yc)
Vidyalankar : S.Y. B.Sc. (IT) CG
- 10 -
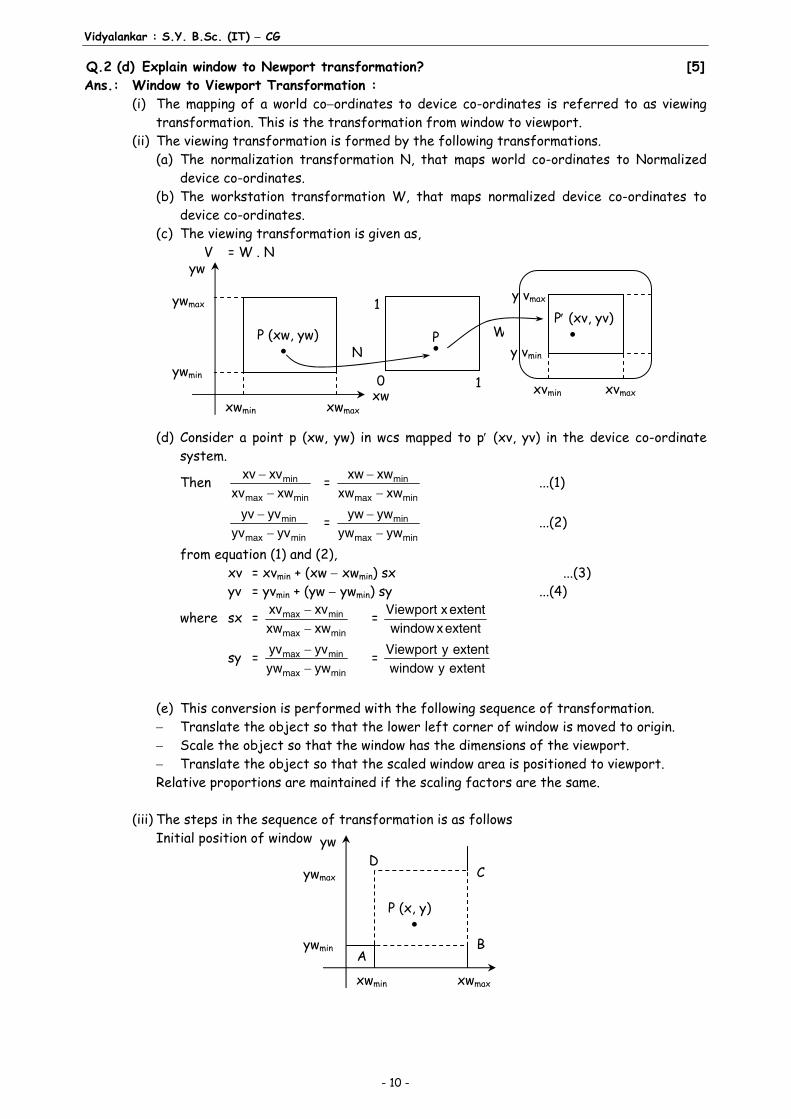
Q.2 (d) Explain window to Newport transformation? [5]Ans.: Window to Viewport Transformation : (i) The mapping of a world coordinates to device co-ordinates is referred to as viewing
transformation. This is the transformation from window to viewport. (ii) The viewing transformation is formed by the following transformations. (a) The normalization transformation N, that maps world co-ordinates to Normalized
device co-ordinates. (b) The workstation transformation W, that maps normalized device co-ordinates to
device co-ordinates. (c) The viewing transformation is given as, V = W . N (d) Consider a point p (xw, yw) in wcs mapped to p (xv, yv) in the device co-ordinate
system.
Then min
max min
xv xvxv xw
= min
max min
xw xwxw xw
...(1)
min
max min
yv yvyv yv
= min
max min
yw ywyw yw
...(2)
from equation (1) and (2), xv = xvmin + (xw xwmin) sx ...(3) yv = yvmin + (yw ywmin) sy ...(4)
where sx = max min
max min
xv xvxw xw
= Viewport xextentwindow xextent
sy = max min
max min
yv yvyw yw
= Viewport y extentwindow y extent
(e) This conversion is performed with the following sequence of transformation. Translate the object so that the lower left corner of window is moved to origin. Scale the object so that the window has the dimensions of the viewport. Translate the object so that the scaled window area is positioned to viewport. Relative proportions are maintained if the scaling factors are the same. (iii) The steps in the sequence of transformation is as follows Initial position of window
P (xw, yw)
ywmax
ywmin
xwmin xwmaxxw
yw
N
0 1
1P (xv, yv)
P W
y vmax
y vmin
xvmin xvmax
P (x, y)
ywmax
ywmin
xwmin xwmax
yw
B
CD
A
Prelim Question Paper Solution
- 11 -
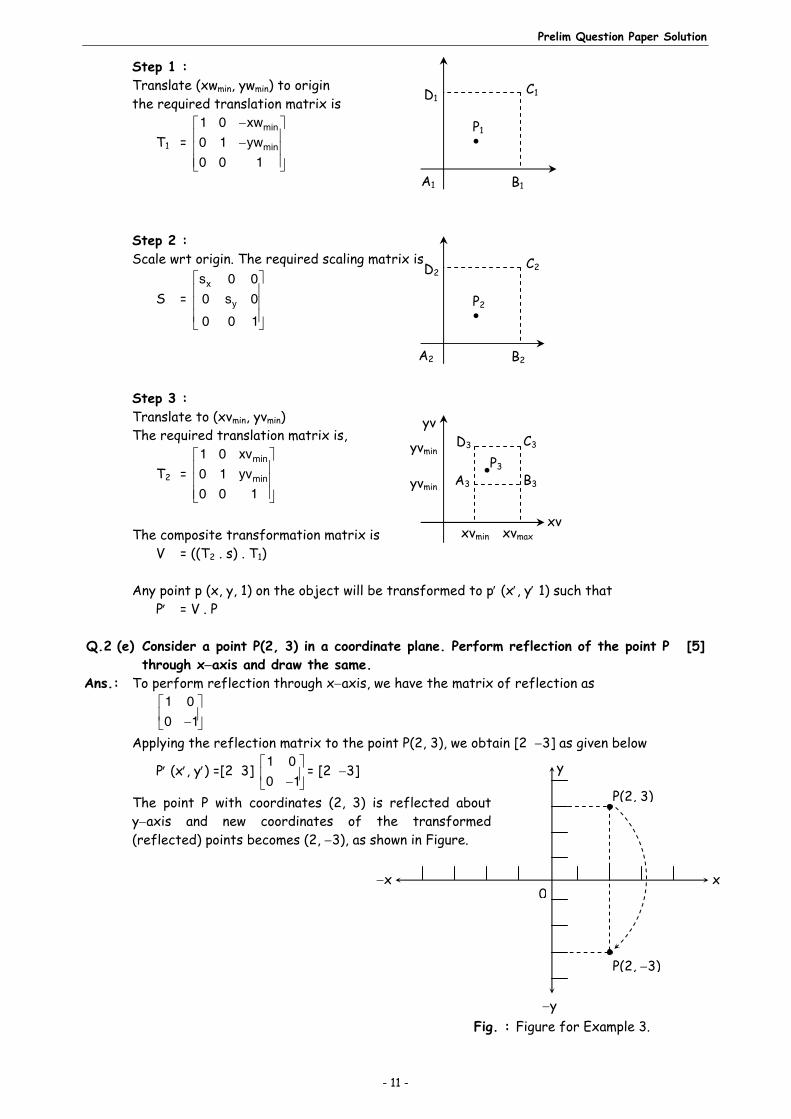
Step 1 : Translate (xwmin, ywmin) to origin the required translation matrix is
T1 = min
min
1 0 xw0 1 yw0 0 1
Step 2 : Scale wrt origin. The required scaling matrix is
S = x
y
s 0 00 s 0
0 0 1
Step 3 : Translate to (xvmin, yvmin) The required translation matrix is,
T2 = min
min
1 0 xv0 1 yv0 0 1
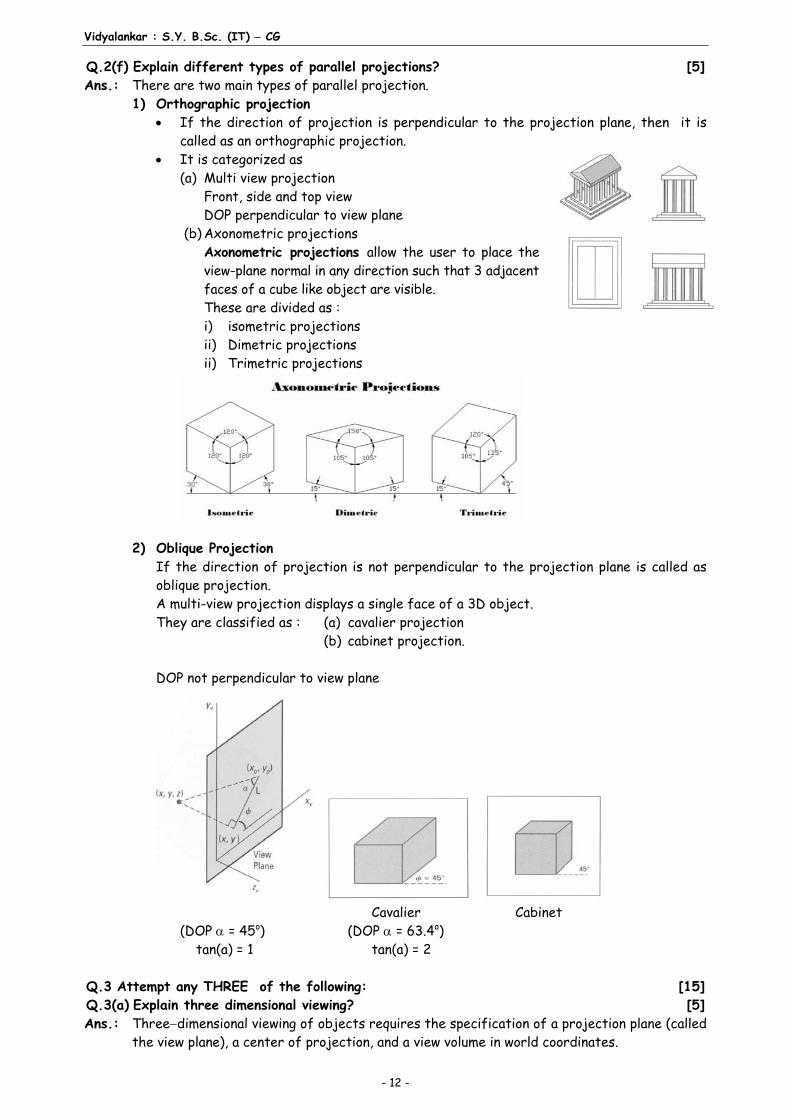
The composite transformation matrix is V = ((T2 . s) . T1) Any point p (x, y, 1) on the object will be transformed to p (x, y 1) such that P = V . P Q.2 (e) Consider a point P(2, 3) in a coordinate plane. Perform reflection of the point P
through xaxis and draw the same. [5]
Ans.: To perform reflection through xaxis, we have the matrix of reflection as
1 00 1
Applying the reflection matrix to the point P(2, 3), we obtain [2 3] as given below
P (x, y) =[2 3]
1 00 1
= [2 3]
The point P with coordinates (2, 3) is reflected about yaxis and new coordinates of the transformed (reflected) points becomes (2, 3), as shown in Figure.
C3
xvmin
P3
D3
B3A3
xvmaxxv
yvmin
yvmin
yv
C1
A1 B1
D1
P1
C2
A2 B2
D2
P2
0
P(2, 3)
P(2, 3)
y
y
x x
Fig. : Figure for Example 3.
Vidyalankar : S.Y. B.Sc. (IT) CG
- 12 -
Q.2(f) Explain different types of parallel projections? [5]Ans.: There are two main types of parallel projection. 1) Orthographic projection
If the direction of projection is perpendicular to the projection plane, then it is called as an orthographic projection.
It is categorized as (a) Multi view projection Front, side and top view DOP perpendicular to view plane (b) Axonometric projections
Axonometric projections allow the user to place the view-plane normal in any direction such that 3 adjacent faces of a cube like object are visible. These are divided as : i) isometric projections ii) Dimetric projections
ii) Trimetric projections
2) Oblique Projection If the direction of projection is not perpendicular to the projection plane is called as
oblique projection. A multi-view projection displays a single face of a 3D object. They are classified as : (a) cavalier projection (b) cabinet projection. DOP not perpendicular to view plane
Cavalier Cabinet (DOP = 45o) (DOP = 63.4o) tan(a) = 1 tan(a) = 2 Q.3 Attempt any THREE of the following: [15]Q.3(a) Explain three dimensional viewing? [5]Ans.: Threedimensional viewing of objects requires the specification of a projection plane (called
the view plane), a center of projection, and a view volume in world coordinates.
Prelim Question Paper Solution
- 13 -
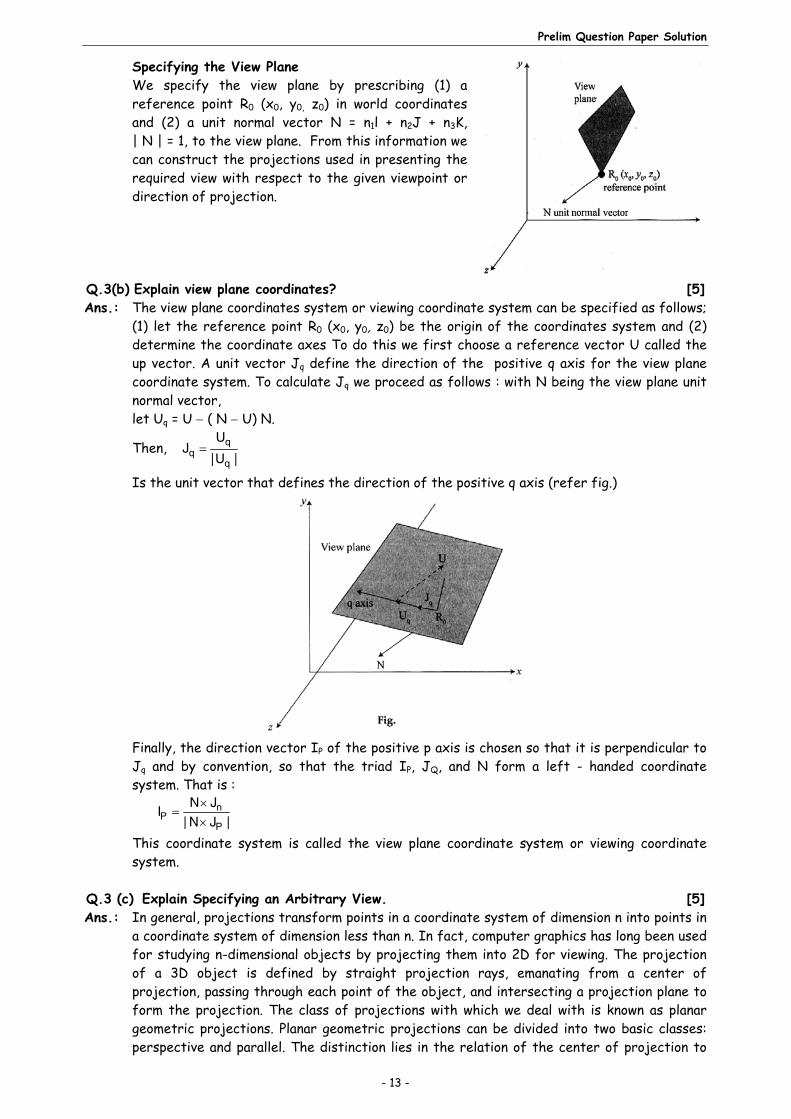
Specifying the View Plane We specify the view plane by prescribing (1) a reference point R0 (x0, y0, z0) in world coordinates and (2) a unit normal vector N = n1l + n2J + n3K, | N | = 1, to the view plane. From this information we can construct the projections used in presenting the required view with respect to the given viewpoint or direction of projection.
Q.3(b) Explain view plane coordinates? [5]Ans.: The view plane coordinates system or viewing coordinate system can be specified as follows;
(1) let the reference point R0 (x0, y0, z0) be the origin of the coordinates system and (2) determine the coordinate axes To do this we first choose a reference vector U called the up vector. A unit vector Jq define the direction of the positive q axis for the view plane coordinate system. To calculate Jq we proceed as follows : with N being the view plane unit normal vector,
let Uq = U ( N U) N.
Then, qq
q
UJ
|U |
Is the unit vector that defines the direction of the positive q axis (refer fig.)
Finally, the direction vector IP of the positive p axis is chosen so that it is perpendicular to Jq and by convention, so that the triad IP, JQ, and N form a left - handed coordinate system. That is :
nP
P
N JI
| N J |
This coordinate system is called the view plane coordinate system or viewing coordinate system.
Q.3 (c) Explain Specifying an Arbitrary View. [5]Ans.: In general, projections transform points in a coordinate system of dimension n into points in
a coordinate system of dimension less than n. In fact, computer graphics has long been used for studying n-dimensional objects by projecting them into 2D for viewing. The projection of a 3D object is defined by straight projection rays, emanating from a center of projection, passing through each point of the object, and intersecting a projection plane to form the projection. The class of projections with which we deal with is known as planar geometric projections. Planar geometric projections can be divided into two basic classes: perspective and parallel. The distinction lies in the relation of the center of projection to
Vidyalankar : S.Y. B.Sc. (IT) CG
- 14 -
1
2
the projection plane. If the distance from the one to the other is finite, then the projection is perspective, and if infinite the projection is parallel. When we define a perspective projection, we explicitly specify its center of projection; for a parallel projection, we give its direction of projection. The visual effect of a perspective projection is similar to that of photographic systems and of the human visual system, and is known as perspective foreshortening. The size of the perspective shortening of an object varies inversely with the distance of that object from the center of projection. Thus, although the perspective projection of objects tends to look realistic, it is not particularly useful for recording the exact shape and measurements of the objects; distances cannot be taken from the projection, angles are preserved on only those faces of the object parallel to the projection plane, and parallel lines do not in general project as parallel lines. The parallel projection is a less realistic view because perspective foreshortening is lacking, although there can be different constant foreshortenings along each axis. The projection can be used for exact measurements, and parallel lines do remain parallel. As in the perspective projection, angles are preserved only on faces of the object parallel to the projection plane.
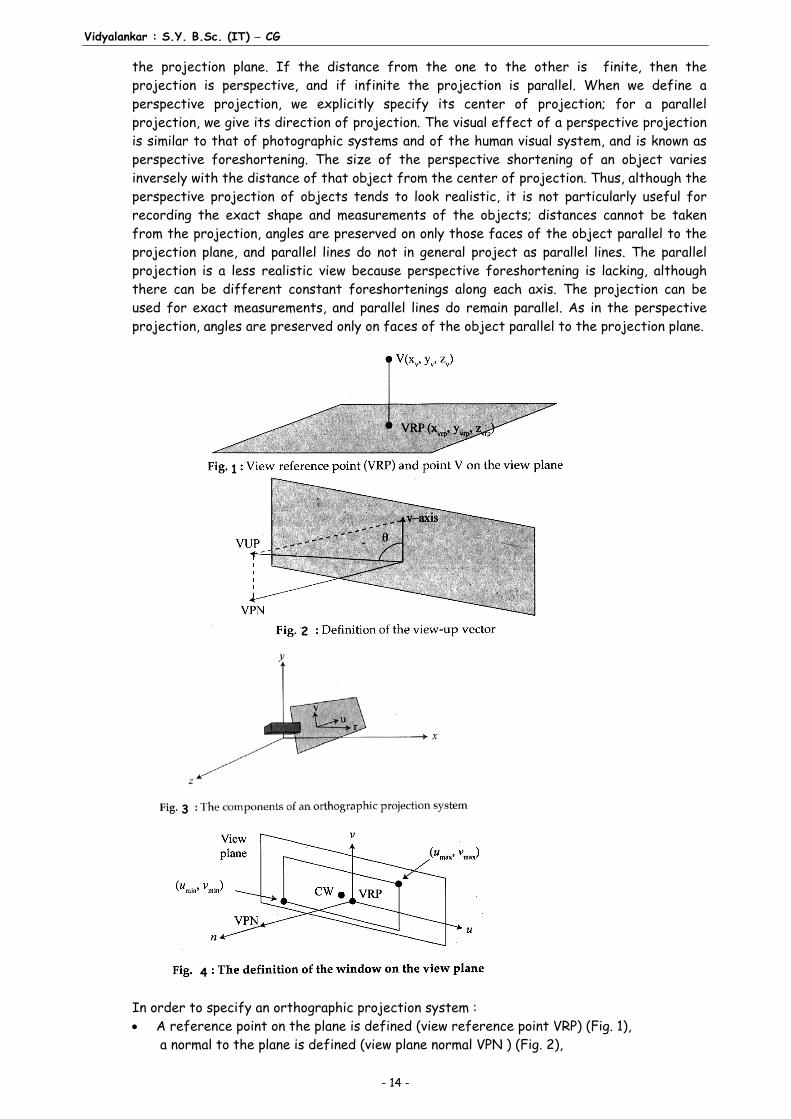
In order to specify an orthographic projection system :
A reference point on the plane is defined (view reference point VRP) (Fig. 1), a normal to the plane is defined (view plane normal VPN ) (Fig. 2),
3
4
Prelim Question Paper Solution
- 15 -
an up vector is defined (view-up vector VUP) (Fig. 2), using VRP and VPN, the view plane is calculated, the v-axis of the plane is calculated, the u-axis of the plane is calculated, (Fig. 3) and, a window on the plane is defined whose contents are mapped to the viewport for
visualization. (Fig. 4) Q.3 (d) Explain photometry? [5]Ans.: Photometry is the science of measuring visible light in units that are weighted according to
the sensitivity of the human eye. It is a quantitative science based on a statistical model of the human visual response to light -- that is, our perception of light -- under carefully controlled conditions.
The human visual system is a marvelously complex and highly nonlinear detector of electromagnetic radiation with wavelengths ranging from 380 to 770 nanometers (nm). We see light of different wavelengths as a continuum of colors ranging through the visible spectrum: 650 nm is red, 540 nm is green, 450 nm is blue, and so on. The sensitivity of the human eye to light varies with wavelength. A light source with a radiance of one watt/m2-steradian of green light, for example, appears much brighter than the same source with a radiance of one watt/m2 -steradian of red or blue light. In photometry, we do not measure watts of radiant energy. Rather, we attempt to measure the subjective impression produced by stimulating the human eye-brain visual system with radiant energy.
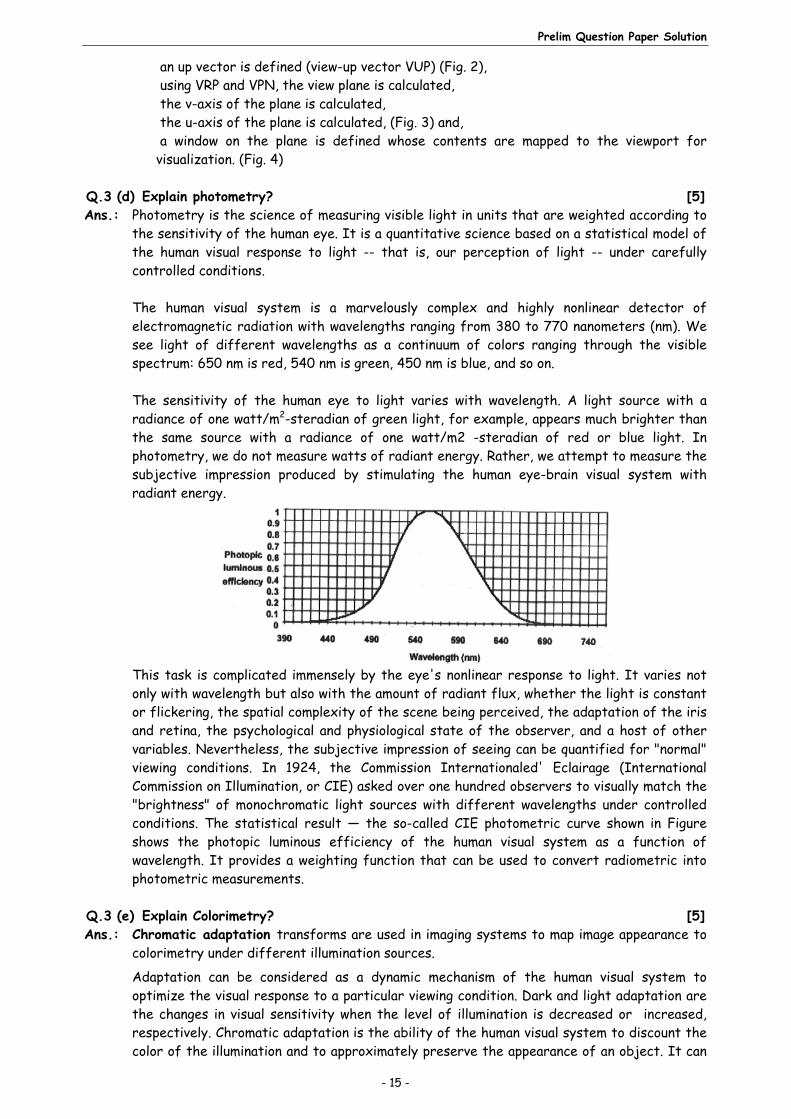
This task is complicated immensely by the eye's nonlinear response to light. It varies not only with wavelength but also with the amount of radiant flux, whether the light is constant or flickering, the spatial complexity of the scene being perceived, the adaptation of the iris and retina, the psychological and physiological state of the observer, and a host of other variables. Nevertheless, the subjective impression of seeing can be quantified for "normal" viewing conditions. In 1924, the Commission Internationaled' Eclairage (International Commission on Illumination, or CIE) asked over one hundred observers to visually match the "brightness" of monochromatic light sources with different wavelengths under controlled conditions. The statistical result — the so-called CIE photometric curve shown in Figure shows the photopic luminous efficiency of the human visual system as a function of wavelength. It provides a weighting function that can be used to convert radiometric into photometric measurements.
Q.3 (e) Explain Colorimetry? [5]Ans.: Chromatic adaptation transforms are used in imaging systems to map image appearance to
colorimetry under different illumination sources.
Adaptation can be considered as a dynamic mechanism of the human visual system to optimize the visual response to a particular viewing condition. Dark and light adaptation are the changes in visual sensitivity when the level of illumination is decreased or increased, respectively. Chromatic adaptation is the ability of the human visual system to discount the color of the illumination and to approximately preserve the appearance of an object. It can

Vidyalankar : S.Y. B.Sc. (IT) CG
- 16 -
be explained as independent sensitivity regulation of the three cone responses. Chromatic adaptation can be observed by examining a white object under different types of illumination, such as daylight and incandescent. Daylight is "bluer": it contains far more short-wavelength energy than incandescent. However, the white object retains its white appearance under both light sources, as long as the viewer is adapted to the light source. Image capturing systems, such as scanners and digital cameras, do not have the ability to adapt to an illumination source. Scanners usually have fluorescent light sources with correlated color temperatures around 4200 to 4800 Kelvin. Illumination sources captured by digital cameras vary according to the scene, and often within the scene. Additionally, images captured with these devices are viewed using a wide variety of light sources. Common white-point chromaticities for monitor viewing are D50, D65, and D93. Hardcopy output is usually evaluated using standard illuminant D50 simulators. To faithfully reproduce the appearance of image colors, it follows that all image processing systems need to apply a transform that converts the input colors captured under the input illuminant to the corresponding output colors under the output illuminant. This can be achieved by using a chromatic adaptation transform. Basically, applying a chromatic adaptation transform to the tristimulus values (X', Y', Z') of a color under one adapting light source predicts the corresponding color's tristimulus values (X", Y", Z") under another adapting light source.
Q.3 (f) Explain camera model and viewing pyramid? [5]Ans.: To understanding the rendering process, you must master the procedure that specifies a
camera and then constructs a transformation that projects a three-dimensional scene onto a two-dimensional screen. This procedure has two several components: First, the specification of a camera model; second, the conversion of the scene's coordinates from Cartesian space to the space of the camera; and finally the specification of a viewing transformation that projects that scene into image space.
The Camera Model We specify our initial camera model by identifying the following parameters :
1. A scene, consisting of polygonal elements each represented by their vertices, 2. A point that represents the camera position C = (xc, yc, zc), 3. A point that represents the "center-of-attention" of the camera (i.e. where the camera
is looking) A = (xa, ya, za) 4. A field-of-view angle, a, representing the angle subtended at the apex of the viewing
pyramid. 5. The specification of "near" and "far" bounding planes. These planes considered
perpendicular to the direction-of-view vector at a distance of n and f firom the camera, respectively.
The specification of C, A and a forms a viewing volume in the shape of a pyramid with the camera position C at the apex of the pyramid and the vector A-C forming the axis of the pyramid. This pyramid is commonly referred to as the viewing pyramid. The specification of the near and far planes forms a truncated viewing pyramid which gives the region of space which contains the primary portion of the scene to be viewed (We note that objects may extend outside the truncated pyramid. In many situations polygons will lie between the near plane and the camera, or, in distance, beyond the far plane.). The viewing transform, transforms this truncated pyramid onto the image space volume 1 x, y, z 1.
Q.4 Attempt any THREE of the following: [15]Q.4 (a) Explain Classification of Visible-Surface Detection Algorithms [5]Ans.: 1. Object-space Methods
Compare objects and parts of objects to each other within the scene definition to determine which surfaces, as a whole, we should label as visible: For each object in the scene do Begin
Prelim Question Paper Solution
- 17 -
2. Determine those part of the object whose view is unobstructed by other parts of it or any other object with respect to the viewing specification.
3. Draw those parts in the object color. End Compare each object with all other objects to determine the visibility of the object parts. If there are n objects in the scene, complexity =0(n2) Calculations are performed at the resolution in which the objects are defined (only
limited by the computation hardware). Process is unrelated to display resolution or the individual pixel in the image and the
result of the process is applicable to different display resolutions. Display is more accurate but computationally more expensive as compared to image
space methods because step 1 is typically more complex, eg. Due to the possibility of intersection between surfaces.
Suitable for scene with small number of objects and objects with simple relationship with each other.
Q.4 (b) Explain Back face dotation [5]Ans.: In a solid object, there are surfaces which are facing the viewer (front faces) and there
are surfaces which are opposite to the viewer (back faces).
These back faces contribute to approximately half of the total number of surfaces. Since we cannot see these surfaces anyway, to save processing time, we can remove them before the clipping process with a simple test.
Each surface has a normal vector. If this vector is pointing in the direction of the center of projection, it is a front face and can be seen by the viewer. If it is pointing away from the center of projection, it is a back face and cannot be seen by the viewer.
The test is very simple, if the z component of the normal vector is positive, then, it is a back face. If the z component of the vector is negative, it is a front face.
Note that this technique only caters well for non-overlapping convex polyhedra.
For other cases where there are concave polyhedra or overlapping objects, we still need to apply other methods to further determine where the obscured faces are partially or completely hidden by other objects (e.g. Using Depth-Buffer Method or Depth-sort Method).
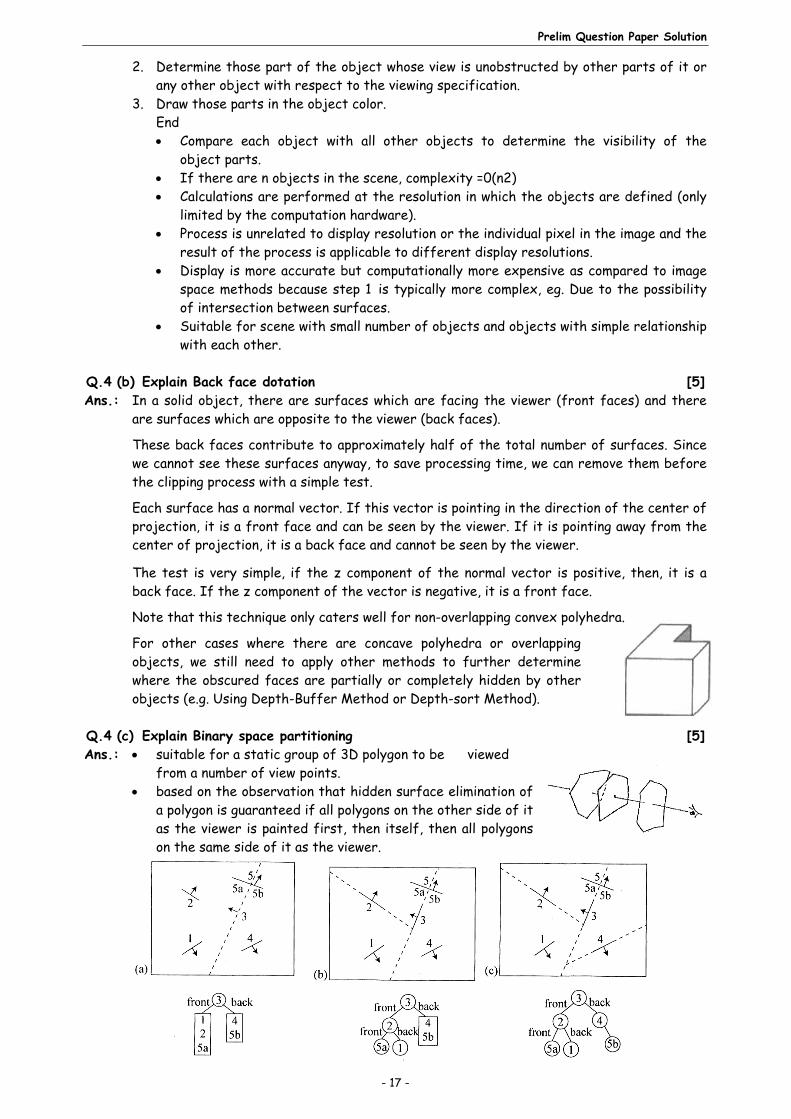
Q.4 (c) Explain Binary space partitioning [5]Ans.: suitable for a static group of 3D polygon to be viewed
from a number of view points. based on the observation that hidden surface elimination of
a polygon is guaranteed if all polygons on the other side of it as the viewer is painted first, then itself, then all polygons on the same side of it as the viewer.
Vidyalankar : S.Y. B.Sc. (IT) CG
- 18 -
1. The algorithm first build the BSP tree : • a root polygon is chosen (arbitrarily) which divides the region into 2 half-spaces (2
nodes => front and back). • a polygon in the front half-space is chosen which divides the half-space into another
2 half- spaces. • the subdivision is repeated until the half-space contains a single polygon (leaf node
of the tree). • the same is done for the back space of the polygon.
2. To display a BSP tree: • see whether the viewer is in the front or the back half-space of the rootpolygon. • if front half-space then first display back child (subtree) then itself, followed by
its front child / subtree. • the algorithm is applied recursively to the BSP tree.
Discussion • Back face removal is achieved by not displaying a polygon if the viewer is located in its
back half-space. • It is an object space algorithm (sorting and intersection calculations are done in object
space precision). • If the view point changes, the BSP needs only minorre-arrangement. • A new BSP tree is built if the scene changes. • The algorithm displays polygon back to front (cf.Depth-sort). BSP Algorithm Procedure DisplayBSP(tree: BSP_tree) Begin If tree is not empty then If viewer is in front of the root then Begin DisplayBSP(tree.back_child) displayPolygon(tree.root) DisplayBSP (tree. front_ child) End Else Begin DisplayBSP(tree.front_child)displayPolygon(tree.root) DisplayBSP(tree.back_child) End End
Q.4 (d) Explain parametric equatious of parabola [5]Ans.: Since every parabola is congruent to x2 = 4ay for some choice of a > 0, we can study the
geometry of every parabola by confining ourselves to this one. This shows the power of both coordinate geometry and transformations.
Imagine a particle moving in the plane along a curve C as shown.
The x and y coordinates of the particle can be thought of as functions of a new variable t, and so we can write, x = f(t), y = g(t), where f, g are functions of t. In some physical problems t is thought of as time.
Prelim Question Paper Solution
- 19 -
The equations, x = f(t) y = g(t)
called the parametric equations of the point P(x, y) and the variable t is called a parameter.
It is often very useful to take a cartesian equation y = F(x) and introduce a parameter t so that the x and y coordinates of any point on the curve can be expressed in terms of this parameter.
Here is a very simple example of a parametrisation. Suppose we begin with the line whose equation is Y = 3x 4. We can introduce a new variable tand write x=t. Then we have y = 3t 4. Thus we can rewrite the equation y = 3x 4 in parametric form as : x = t y = 3t 4.
Q.4 (e) Explain Bezier curves [5]Ans.: Bezier curves are used in computer graphics to produce curves which appear reasonably
smooth at all scales. This spline approximation method was developed by French engineer Pierre Bezier for automobile body design. Bezier spline was designed in such a manner that they are very useful and convenient for curve and surface design, and are easy to implement Curves are trajectories of moving points. We will specify them as functions assigning a location of that moving point (in 2D or 3D) to a parameter t, i.e., parametric curves.
Curves are useful in geometric modeling and they should have a shape which has a clear and intuitive relation to the path of the sequence of control points. One family of curves satisfying this requirement are Bezier curve. The Bezier curve require only two end points and other points that control the endpoint tangent vector. Bezier curve is defined by a sequence of N + 1 control points, P0 , P1, ... , Pn . We defined the Bezier curve using the algorithm (invented by DeCasteljeau), based on recursive splitting of the intervals joining the consecutive control points. A purely geometric construction for Bezier splines which does not rely on any polynomial formulation, and is extremely easy to understand. The DeCasteljeau method is an algorithm which performs repeated bi-linear interpolation to compute splines of any order.
Q.4 (f) Explain B-spline curves [5]Ans.: We have seen how Bezier curves offer well-behaved control within a convex hull for any
degree (number of control points) we choose. And from a computational point of view, it is a relatively simple matter to extend a Bezier curve by adding more control points because the computation of the new blending functions is straightforward.
However, we cannot easily control the curve locally. That is, any change to an individual
control point will cause changes in the curve along its full length. In addition, we cannot create a local cusp in the curve, that is, we cannot create a sharp corner unless we create it at the beginning or end of a curve where it joins another curve. Finally, it is not possible to keep the degree of the Bezier curve fixed while adding additional points; any additional points will automatically increase the degree of the curve. The so-called b-spline curve addresses each of these problems with the Bezier curve. It provides the most powerful and useful approach to curve design available today. However, the down side is that the bspline
Vidyalankar : S.Y. B.Sc. (IT) CG
- 20 -
curve is somewhat more complicated to compute compared to the Bezier curve, but as we shall see the two kinds of curves are closely related. In fact a b-spline curve degenerates into a Bezier curve when the order of the b-spline curve is exactly equal to the number of control points.
Q.5 Attempt any THREE of the following: [15]Q.5 (a) Explain animations and explain squash and stretch animation? [5]Ans.: In their 1981 book, The Illusion of Life, Disney animators Ollie Johnston and Frank Thomas
introduced the twelve principles of animation. The pair were part of Disney's "Nine Old Men," the core group of animators who were instrumental in creating Disney's animation style. The twelve principles have now become widely recognized as a theoretical bedrock for all artists working on animated video production. With the growing ubiquity of digital devices, moving interfaces and adapting technology, motion design has become an important part of a designers creative options. When a designer thinks of moving a graphic, various programs such as After Effects, Edge Animate or coding languages such as HTML5, CSS3 and jQuery come to mind. Mastery of tools does not always guarantee mastery of the craft. Understanding the grammar of what molds the craft and the reason why things are happening is key to creating a meaningful design. The grammar of motion has been around since long before designers had advanced tools, and it will continue to guide designers after the tools have evolved. An influential work on the grammar of motion is the 12 Basic Principles of Animation, first introduced in the book The Illusion of Life: Disney Animation. The Illusion of Life was written by Disney animators Ollie Johnston and Frank Thomas, two of the master animators referred to by Walt Disney as the "Nine Old Men." No matter the style of animation—be it hand drawn, 3D or experimental animation—the 12 principles can be seen in almost any motion-based design. While there is a clear difference between human character animation and motion design (or motion graphics), the 12 principles are still applicable across these processes. Designer and animator Cento Lodigiani describes the 12 Basic Principles of Animation in a series of short animations using a simple cube. This graphical examination is a perfect analogy demonstrating how the principles can be applied to motion design. The following is an examination of the 12 principles as they relate to motion design. While some principles relate closer than others, there are parallels in each one that can be related to the design realm. I will describe each principle as it relates to traditional animation and then (below the video), I will demonstrate a motion design parallel.
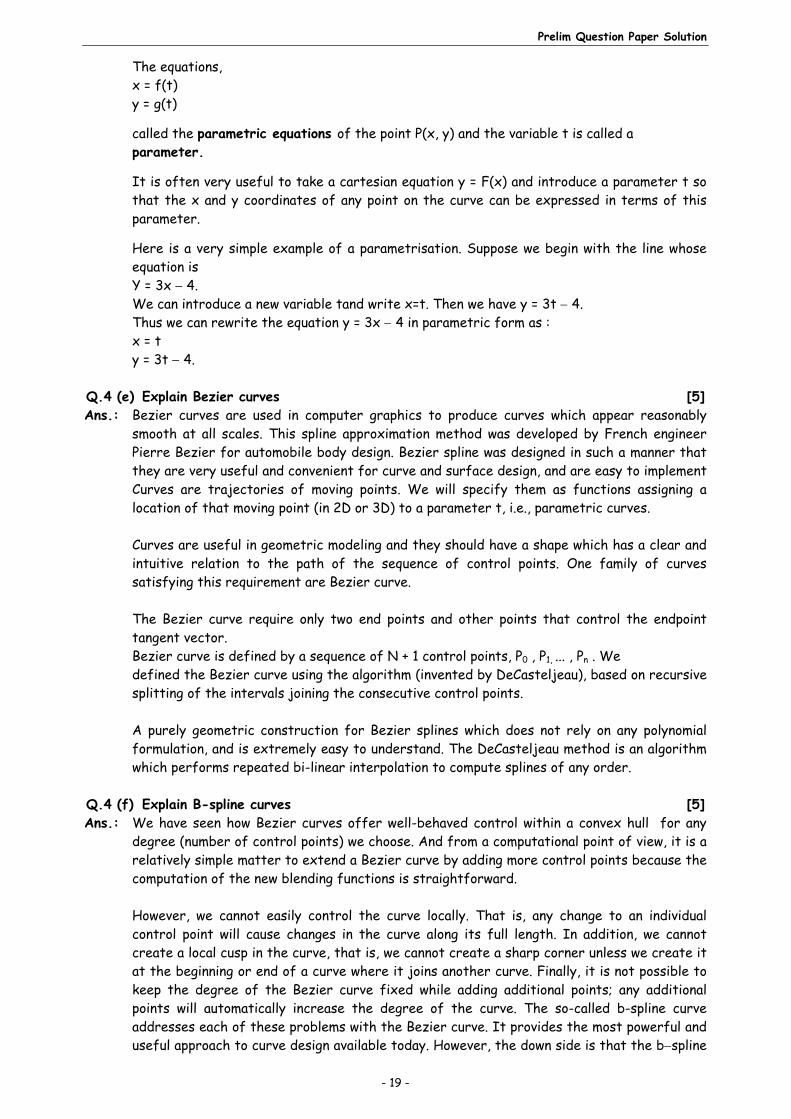
Squash and Stretch : Adding exaggeration to an object in motion gives it a greater sense of weight and volume. This principle is often demonstrated with a bouncing ball: the ball appears stretched when it is falling and squashed when it hits the ground. By squashing and stretching the ball, an animat gives a more realistic feel.
Q.5 (b) Explain deformation? [5]Ans.: Harmony Stage provides you with the deformation technology to deform bitmap and vector
drawings over a period of time. These deformers can be linked to create a hierarchy of deformation. This technology allows you to deform a character made out of one, or many, drawing or image layers and make it move as if it were a cut-out puppet. It also allows you to take an area in a single bitmap image and create animation by distortion.
About the Deformation Effect The Deformation Effect can be used to animate either bitmap or vector based graphics, it
even works on gradients and textures. The Deformation Effect acts as a skeleton in which
Prelim Question Paper Solution
- 21 -
you can manoeuver different articulations or bend it into a fluid curve. It can prove useful in many situations including cut-out animation. When paired with your creativity, the Deformation Effect can produce some stunning results.
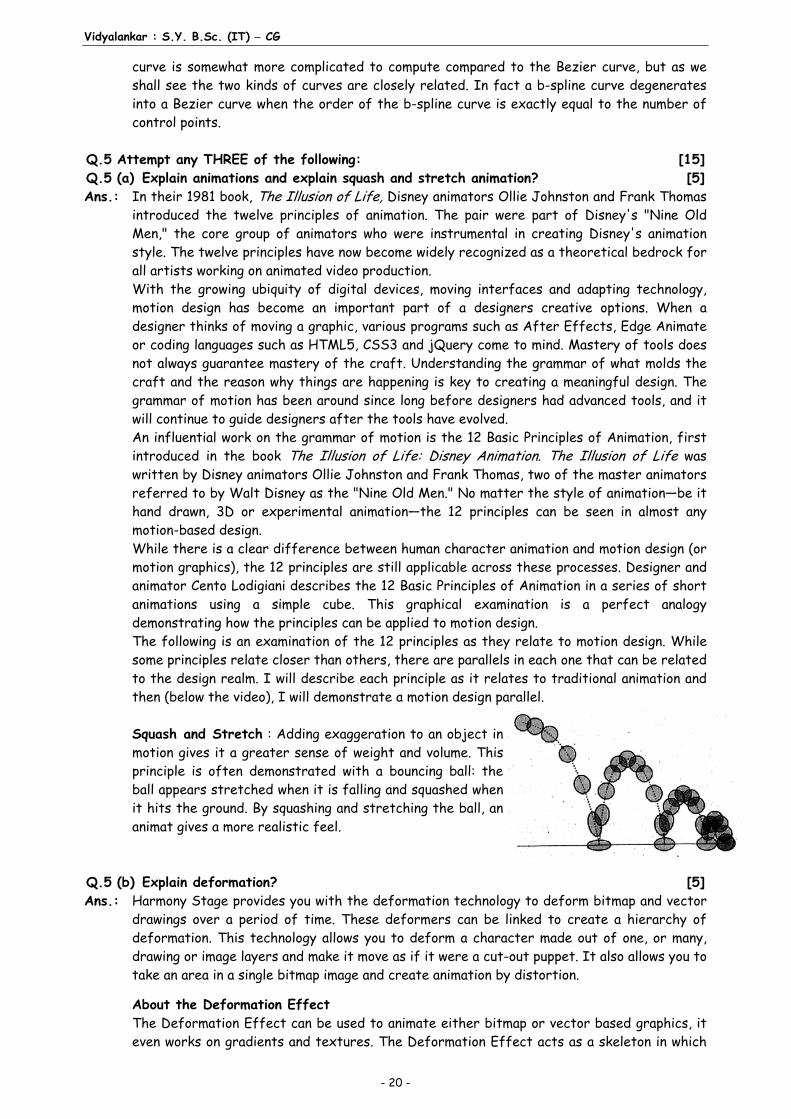
There are 2 main types of deformer : • Bone Deformer • Curve Deformer
All the Deformation Effect modules are available in the Module Library, under the Deformation tab.
The Bone Deformer allows you to create a basic or advanced skeleton structure in which the parent deformer will move the child deformers. The Bone Deformer is mostly used when animating the extremities of a character such as arms or legs and will add fluidity and a natural feel to the animation. The Bone effect can be manipulated to rotate a limb at an articulation joint and to also shorten or elongate the extremities of a limb. Every Bone module within a skeleton chain is linked together by an Articulation module.
The Curve Deformer has a hierarchy similar to that of the Bones Deformer and provides you with complete flexibility. For example, when editing curves, you can deform a straight line into an arc or a zig-zag with only a few clicks. Curve Deformers are mostly used to animate elements that do not have joints, for example hair or facial features. However, in some cases they can be used to animate limbs to create a specific animation genre, similar to the early rubber hose style of animation with typically simple, flowing curves, without articulation (no hinged wrists or elbows).
Q.5(c) Explain character animation? [5]Ans.: It is a specialized area of the animation process, which involves bringing animated
characters to life. The role of a Character Animator is analogous to that of a film or stage actor, and character animators are often said to be "actors with a pencil" (or a mouse). Character animators breathe life in their characters, creating the illusion of thought, emotion and personality. Character animation is often distinguished from creature animation, which involves bringing photo-realistic animals and creatures to life.
Character animation is generally defined as the art of making a particular character move in a two- or three-dimensional context. It is a process central to the concept of animation. Many associate early character animation with Walt Disney Studios, where cartoon artists created particular characters and presented them with particular traits and characteristics on screen. This requires combining a lot of technical drawing or animation with some top-
Fig. 1
Fig. 2
Fig. 3
Vidyalankar : S.Y. B.Sc. (IT) CG
- 22 -
level ideas about how the character moves, "thinks," behaves and otherwise appears consistently on screen. As primitive cartoon animation gave way to modern three-dimensional animation, character animation has evolved along with it. Today's character animation involves elements like character rigging and the creation of object-oriented frameworks for creating character sequences. At the same time, processes like voice dubbing by celebrities and advanced character profiles are doing the conceptual work of building that character's persona and background. One example is the early CGI Toy Story movies, where the careful creation of specialized on-screen characters has sold lots of merchandise and drivert the films to legacy blockbuster status.
Q.5 (d) Explain Physics based animation [5]Ans.: Physically based animation is an area of interest within computer graphics concerned with
the simulation of physically plausible behaviors at interactive rates. Advances in physically based animation are often motivated by the need to include complex, physically inspired behaviors in video games, interactive simulations, and movies. Although off-line simulation methods exist to solve most all of the problems studied in physically-based animation, these methods are intended for applications that necessitate physical accuracy and slow, detailed computations. In contrast to methods common in offline simulation, techniques in physically based animation are concerned with physical plausibility, numerical stability, and visual appeal over physical accuracy. Physically based animation is often limited to loose approximations of physical behaviors because of the strict time constraints imposed by interactive applications.
The target frame rate for interactive applications such as games and simulations is often
25-60 hertz, with only a small fraction of the time allotted to an individual frame remaining for physical simulation. Simplified models of physical behaviors are generally preferred if they are more efficient, easier to accelerate (through pre-computation, clever data structures, or SIMD / GPGPU), or satisfy desirable mathematical properties (such as unconditional stability or volume conservation when a soft body undergoes deformation). Fine details are not important when the overriding goal of a visualization is aesthetic appeal or the maintenance of player immersion since these details are often difficult for humans to notice or are otherwise impossible to distinguish at human scales.
Q.5 (e) Explain procedural based animation [5]Ans.: A procedural animation is a type of computer animation, used to automatically generate
animation in real-time to allow for a more diverse series of actions than could otherwise be created using predefined animations.
Procedural is used to simulate particle systems (smoke, fire, water), cloth and clothing, rigid body dynamics, and hair and fur dynamics, as well as character animation. In video games, it is often used for simple things like turning a character's head when a player looks around (as in Quake III Arena) and more complex things, like ragdoll physics, which is usually used for the death of a character in which the ragdoll will realistically fall to the floor. A ragdoll usually consists of a series of connected rigid bodies that are programmed to have Newtonian physics acting upon them; therefore, very realistic effects can be generated that would very hardly be possible with traditional animation. For example, a character can die slumped over a cliff and the weight of its upper-body can drag the rest of it over the edge. Even more complex examples of procedural animation can be found in the game Spore wherein User-created creatures will automatically be animated to all actions needed in the
Prelim Question Paper Solution
- 23 -
game from walking, to driving, to picking things up. In the game Unreal Tournament 3, bodies who have gone into ragdoll mode to fake death can arise from any position into which they have fallen and get back on their feet. The canceled Indiana Jones game from Lucas Arts shown at E3 2006 featured character motions that were animated entirely in real-time, with characters dodging, punching, and reacting to the environment based on an engine called Euphoria by NaturalMotion which has since been used in games such as Grand Theft Auto IV and Backbreaker. In a procedural animation objects are animated by a procedure ~ a set of rules ~ not by keyframing. The animator specifies rules and initial conditions and runs simulation. Rules are often based on physical rules of the real world expressed by mathematical equations?)
Q.5(f) Explain keytrames? [5]Ans.: Animation means giving life to any object in computer graphics. It has the power of
infecting energy and emotions into the most seemingly inanimate objects. Computer-assisted animation and computer-generated animation are two categories of computer animation. It can be presented via film or video.
The basic idea behind animation is to play back the recorded images at the rates fast enough to fool the human eye into interpreting them as continuous motion. Animation can make a series of dead images come alive. Animation can be used in many areas like entertainment, computer aided-design, scientific visualization, training, education, e-commerce, and computer art. In this technique, a storyboard is laid out and then the artists draw the major frames of the animation. Major frames are the ones in which prominent changes take place. They are the key points of animation. Keyframing requires that the animator specifies critical or key positions for the objects. The computer then automatically fills in the missing frames by smoothly interpolating between those positions.
Procedural In a procedural animation, the objects are animated by a procedure - a set of rules -not by keyframing. The animator specifies rules and initial conditions and runs simulation. Rules are often based on physical rules of the real world expressed by mathematical equations.
Behavioral In behavioral animation, an autonomous character determines its own actions, at least to a certain extent. This gives the character some ability to improvise, and frees the animator from the need to specify each detail of every character's motion. Performance Based (Motion Capture) Another technique is Motion Capture, in which magnetic or vision-based sensors record the actions of a human or animal object in three dimensions. A computer then uses these data to animate the object. This technology has enabled a number of famous athletes to supply the actions for characters in sports video games. Motion capture is pretty popular with the animators mainly because some of the commonplace human actions can be captured with relative ease. However, there can be serious discrepancies between the shapes or dimension^ of the subject and the graphical character and this may lead to problems of exact execution. Physically Based (Dynamics) Unlike key framing and motion picture, simulation uses the laws of physics to generate motion of pictures and other objects. Simulations can be easily used to produce slightly
Vidyalankar : S.Y. B.Sc. (IT) CG
- 24 -
different sequences while maintaining physical realism. Secondly, real-time simulations allow a higher degree of interactivity where the real person can maneuver the actions of the simulated character. In contrast the applications based on key-framing and motion select and modify motions form a pre-computed library of motions. One drawback that simulation suffers from is the expertise and time required to handcraft the appropriate controls systems. A keyframe is a frame where we define changes in animation. Every frame is a keyframe when we create frame by frame animation. When someone creates a 3D animation on a computer, they usually don't specify the exact position of any given object on every single frame. They create keyframes. Keyframes are important frames during which an object changes its size direction, shape or other properties. The computer then figures out all the in- between frames and saves an extreme amount of time for the animator. The following illustrations depict the frames drawn by user and the frames generated by computer.