switching hiv treatment in adults based on cd4 count versus
TRANSCRIPT
Switching HIV Treatment in Adults Based on CD4 CountVersus Viral Load Monitoring: A Randomized, Non-Inferiority Trial in ThailandGonzague Jourdain1,2,3, Sophie Le Cœur1,2,3,4, Nicole Ngo-Giang-Huong1,2,3, Patrinee Traisathit5,
Tim R. Cressey1,2,3, Federica Fregonese1, Baptiste Leurent1, Intira J. Collins1,3, Malee Techapornroong6,
Sukit Banchongkit7, Sudanee Buranabanjasatean8, Guttiga Halue9, Ampaipith Nilmanat10,
Nuananong Luekamlung11, Virat Klinbuayaem12, Apichat Chutanunta13, Pacharee Kantipong14,
Chureeratana Bowonwatanuwong15, Rittha Lertkoonalak16, Prattana Leenasirimakul17,
Somboon Tansuphasawasdikul18, Pensiriwan Sang-a-gad19, Panita Pathipvanich20,
Srisuda Thongbuaban21, Pakorn Wittayapraparat22, Naree Eiamsirikit23,
Yuwadee Buranawanitchakorn24, Naruepon Yutthakasemsunt25, Narong Winiyakul26, Luc Decker1,2,
Sylvaine Barbier1, Suporn Koetsawang27, Wasna Sirirungsi2, Kenneth McIntosh3,28,
Sombat Thanprasertsuk29, Marc Lallemant1,2,3*, PHPT-3 study team
1 Unite Mixte Internationale 174, Institut de Recherche pour le Developpement (IRD)-Programs for HIV Prevention and Treatment (PHPT), Chiang Mai, Thailand,
2 Department of Medical Technology, Faculty of Associated Medical Sciences, Chiang Mai University, Chiang Mai, Thailand, 3 Department of Immunology and Infectious
Diseases, Harvard School of Public Health, Boston, Massachusetts, United States of America, 4 Unite Mixte de Recherche 196, Centre Francais de la Population et du
Developpement, (INED-IRD-Paris V University), Paris, France, 5 Department of Statistics, Faculty of Science, Chiang Mai University, Chiang Mai, Thailand, 6 Prapokklao
Hospital, Ministry of Public Health, Chanthaburi, Thailand, 7 Rayong Hospital, Ministry of Public Health, Rayong, Thailand, 8 Mae Chan Hospital, Ministry of Public Health,
Chiang Rai, Thailand, 9 Phayao Provincial Hospital, Ministry of Public Health, Phayao, Thailand, 10 Hat Yai Hospital, Ministry of Public Health, Songkla, Thailand,
11 Lamphun Hospital, Ministry of Public Health, Lamphun, Thailand, 12 Sanpatong Hospital, Ministry of Public Health, Chiang Mai, Thailand, 13 Samutsakhon Hospital,
Ministry of Public Health, Samutsakhon, Thailand, 14 Chiangrai Prachanukroh Hospital, Ministry of Public Health, Chiang Rai, Thailand, 15 Chonburi Hospital, Ministry of
Public Health, Chonburi, Thailand, 16 Maharat Nakhon Ratchasima Hospital, Ministry of Public Health, Nakhon Ratchasima, Thailand, 17 Nakornping Hospital, Ministry of
Public Health, Chiang Mai, Thailand, 18 Buddhachinaraj Hospital, Ministry of Public Health, Pitsanuloke, Thailand, 19 Ratchaburi Hospital, Ministry of Public Health,
Ratchaburi, Thailand, 20 Lampang Hospital, Ministry of Public Health, Lampang, Thailand, 21 Mahasarakam Hospital, Ministry of Public Health, Mahasarakam, Thailand,
22 Bhuddasothorn Hospital, Ministry of Public Health, Chachoengsao, Thailand, 23 Samutprakarn Hospital, Ministry of Public Health, Samutprakarn, Thailand, 24 Chiang
Kham Hospital, Ministry of Public Health, Phayao, Thailand, 25 Nong Khai Hospital, Ministry of Public Health, Nong Khai, Thailand, 26 Regional Health Promotion Centre 6,
Ministry of Public Health, Khon Kaen, Thailand, 27 Family Health Research Center, Mahidol University, Bangkok, Thailand, 28 Children’s Hospital, Department of Pediatrics,
Harvard Medical School, Boston, Massachusetts, United States of America, 29 Ministry of Public Health, Nonthaburi, Thailand
Abstract
Background: Viral load (VL) is recommended for monitoring the response to highly active antiretroviral therapy (HAART) butis not routinely available in most low- and middle-income countries. The purpose of the study was to determine whether aCD4-based monitoring and switching strategy would provide a similar clinical outcome compared to the standard VL-basedstrategy in Thailand.
Methods and Findings: The Programs for HIV Prevention and Treatment (PHPT-3) non-inferiority randomized clinical trialcompared a treatment switching strategy based on CD4-only (CD4) monitoring versus viral-load (VL). Consentingparticipants were antiretroviral-naıve HIV-infected adults (CD4 count 50–250/mm3) initiating non-nucleotide reversetranscriptase inhibitor (NNRTI)-based therapy. Randomization, stratified by site (21 public hospitals), was performedcentrally after enrollment. Clinicians were unaware of the VL values of patients randomized to the CD4 arm. Participantsswitched to second-line combination with confirmed CD4 decline .30% from peak (within 200 cells from baseline) in theCD4 arm, or confirmed VL .400 copies/ml in the VL arm. Primary endpoint was clinical failure at 3 years, defined as death,new AIDS-defining event, or CD4 ,50 cells/mm3. The 3-year Kaplan-Meier cumulative risks of clinical failure were comparedfor non-inferiority with a margin of 7.4%. In the intent to treat analysis, data were censored at the date of death or at lastvisit. The secondary endpoints were difference in future-drug-option (FDO) score, a measure of resistance profiles, virologicand immunologic responses, and the safety and tolerance of HAART. 716 participants were randomized, 356 to VLmonitoring and 360 to CD4 monitoring. At 3 years, 319 participants (90%) in VL and 326 (91%) in CD4 were alive and onfollow-up. The cumulative risk of clinical failure was 8.0% (95% CI 5.6–11.4) in VL versus 7.4% (5.1–10.7) in CD4, and theupper-limit of the one-sided 95% CI of the difference was 3.4%, meeting the pre-determined non-inferiority criterion.Probability of switch for study criteria was 5.2% (3.2–8.4) in VL versus 7.5% (5.0–11.1) in CD4 (p = 0.097). Median time fromtreatment initiation to switch was 11.7 months (7.7–19.4) in VL and 24.7 months (15.9–35.0) in CD4 (p = 0.001). The medianduration of viremia .400 copies/ml at switch was 7.2 months (5.8–8.0) in VL versus 15.8 months (8.5–20.4) in CD4(p = 0.002). FDO scores were not significantly different at time of switch. No adverse events related to the monitoringstrategy were reported.
PLOS Medicine | www.plosmedicine.org 1 August 2013 | Volume 10 | Issue 8 | e1001494
Conclusions: The 3-year rates of clinical failure and loss of treatment options did not differ between strategies although thelonger-term consequences of CD4 monitoring would need to be investigated. These results provide reassurance to treatmentprograms currently based on CD4 monitoring as VL measurement becomes more affordable and feasible in resource-limitedsettings.
Trial registration: ClinicalTrials.gov NCT00162682
Please see later in the article for the Editors’ Summary.
Citation: Jourdain G, Le Cœur S, Ngo-Giang-Huong N, Traisathit P, Cressey TR, et al. (2013) Switching HIV Treatment in Adults Based on CD4 Count Versus ViralLoad Monitoring: A Randomized, Non-Inferiority Trial in Thailand. PLoS Med 10(8): e1001494. doi:10.1371/journal.pmed.1001494
Academic Editor: Andrew Carr, St. Vincent’s Hospital, Australia
Received January 6, 2013; Accepted June 27, 2013; Published August 6, 2013
Copyright: � 2013 Jourdain et al. This is an open-access article distributed under the terms of the Creative Commons Attribution License, which permitsunrestricted use, distribution, and reproduction in any medium, provided the original author and source are credited.
Funding: The study was funded by the Eunice Kennedy Shriver National Institute of Child Health and Human Development (NICHD), R01 HD-042964, USA; theMinistry of Public Health, Thailand; the Institut de Recherche pour le Developpement, France; the Institut National d’Etudes Demographiques, France; and theThailand International Development Cooperation Agency (TICA). Antiretroviral treatments and laboratory testing were partly funded by the Global Fund to FightAIDS, Tuberculosis and Malaria. The funders had no role in study design, data collection and analysis, decision to publish, or preparation of the manuscript.
Competing Interests: The authors have declared that no competing interests exist.
Abbreviations: ARV, antiretroviral; CDC, US Centers for Disease Control and Prevention; DSMB, Data and Safety Monitoring Board; FDO, future drug option;HAART, highly active antiretroviral therapy; IQR, interquartile range; NNRTI, non-nucleotide reverse transcriptase inhibitor; PHPT-3, Programs for HIV Preventionand Treatment; PI, protease inhibitor; ULN, upper limit of normal; VL, viral load
* E-mail: [email protected]
Introduction
Since the mid 1990s, highly active antiretroviral therapy
(HAART) has radically modified AIDS prognosis by suppressing
viral replication and thus allowing immune restoration [1–3].
Maximal and durable viral suppression is expected to impede the
development of drug resistance and to lead to the restoration of
immunological function, improvement of quality of life, and
reduction of HIV-related morbidity, mortality, and transmission.
Monitoring of viral load (VL) is central to this therapeutic
approach and to national guidelines in most resource-rich settings
and was recently recommended as part of the WHO 2013
consolidated guidelines [4,5].
However, in low- and middle-income countries, with limited
resources and restricted access to more costly second and third-line
drugs, the utility of this approach is debated [6–8]. Moreover, a
VL-based monitoring strategy may lead to more frequent
treatment changes, limiting future drug options. Three random-
ized trials compared clinical monitoring with clinical-plus-labora-
tory monitoring in adult patients in sub-Saharan Africa [9–11],
but none of them directly compared CD4-monitoring versus CD4
plus VL monitoring. We therefore designed this study to
determine whether, in therapy-naıve patients, monitoring by VL
is optimal for therapeutic decision making, or whether a CD4-
based strategy would lead to non-inferior clinical outcomes. The
purpose of the study was to test the non-inferiority of a CD4-based
monitoring and switching strategy compared to the standard VL-
based monitoring and switching strategy among antiretroviral
(ARV)-naive adults treated with non-nucleotide reverse transcrip-
tase inhibitor (NNRTI)-containing regimens in Thailand.
Methods
Trial DesignThis was a multicenter, randomized, non-inferiority trial
conducted in 21 public hospitals throughout Thailand (Clinical-
Trials.gov NCT00162682). The primary objective was to compare
the 3-y clinical outcomes of HIV-infected adults initiating
HAART, followed according to a monitoring-switching strategy
either based on CD4 cell count (CD4), or on VL. The secondary
objectives were (i) to compare future ARV treatment options,
taking into account the profile of resistance mutations; (ii) to assess
virologic and immunologic responses by arm; and (iii) to evaluate
the safety and tolerance of HAART.
ParticipantsConfirmed HIV-infected patients, 18 y or older, were eligible if
they could be followed at a study site and provided written
informed consent. Inclusion criteria included confirmed CD4-cell
count of 50–250 cells/mm3 and absence of prior ARV therapy
(except zidovudine during pregnancy or nevirapine during labor).
Exclusion criteria included pregnancy, opportunistic infection or
medical condition interfering with study participation, hepatitis B
or C co-infection, or any of the following: hemoglobin ,8.0 g/dl,
neutrophil count ,1,000 cells/mm3, alanine transaminase (ALT),
aspartate aminotransferase (AST), or total bilirubin .5.06upper
limit of normal (ULN), serum creatinine .1.06 ULN, platelet
count ,50,000/mm3, pancreatic amylase .2.06 ULN, or total
amylase .2.06ULN plus symptoms of pancreatitis.
Randomization and Switching CriteriaAfter treatment initiation, participants were randomly assigned
in blocks of four, stratified by site and CD4 level (6100 cells/
mm3), to one of two monitoring-switching strategies: (1) VL arm:
switch if confirmed decreased ,1 log at 3 mo or confirmed VL
above 400 copies/ml thereafter; (2) CD4 arm: switch if confirmed
CD4 count declined .30% from peak value (defined as the
highest average of two consecutive CD4 counts) unless CD4
remained .200 cells above baseline. Using a pseudorandom
number generator (Mersenne twister), a statistician produced the
randomization lists and encrypted them in a database before the
initiation of the study. Only the study statisticians were allowed to
access the randomization lists to maintain blinding of other
research staff. Randomization was performed centrally at the
study coordination center in Chiang Mai, by a research assistant.
The arm assigned to each patient was disclosed to the site
physician after randomization. Even though blinding was not
feasible, clinicians who were responsible for enrolling and
CD4 Versus Viral Load HIV Switching Strategies
PLOS Medicine | www.plosmedicine.org 2 August 2013 | Volume 10 | Issue 8 | e1001494
following-up with study participants were unaware of the VL
values of patients randomized to the CD4 arm.
Follow-upPatients were seen 2 wk after ARV initiation for a medical
examination and blood chemistry evaluation, to ensure adherence
and detect early toxicities. Patients were then seen monthly for
clinical evaluation, adherence assessment by pill count and self-
report questionnaire, safety and tolerance evaluation, and drug
refill. Cotrimoxazole and fluconazole prophylaxis was provided
per WHO guidelines [12]. Hematology, ALT, CD4 count, and
pregnancy tests and VL were performed at enrollment and then
every 3 mo. Creatinine, bilirubin, AST, glucose, triglycerides,
cholesterol, and amylase were measured every 6 mo. In case of
intolerance to one drug, that drug was replaced. Serious adverse
events (as defined by the International Conference on Harmoni-
zation, Good Clinical Practices [ICH GCP]) were reported to the
Ministry of Public Health. Adverse event grading was based on the
Division of AIDS, NIAID Table [13]. Patients were monitored
according to protocol until the last enrollee had been on study for
3 y.
Laboratory AssessmentsPlasma HIV RNA was measured using the Cobas Amplicor
HIV-1 Monitor kit (version 1.5, Roche Molecular Systems). HIV
genotypic resistance was performed retrospectively for all patients
who met the per-protocol switching criteria and had detectable VL
on the last sample available before switch using ViroSeq HIV-1
Genotyping system version 2.0 (Applied Biosystems). Both were
performed at the Faculty of Associated Medical Sciences, Chiang-
Mai University and quality assured by the Virology Quality
Assurance Proficiency Program (VQA). CD4 counts were
measured using a flow cytometer at each hospital laboratory with
quality control from the Center of Excellence for Flow Cytometry,
Mahidol University, Bangkok, Thailand and the United Kingdom
National External Quality Assessment Service (UKNEQAS).
Resistance mutations were identified using the 2009 International
AIDS Society (US) tables. Each mutation was assigned a penalty
score derived from the Stanford HIVdb Sequence Analysis
Programs (version 6.0.8) and ARV drug resistance was inferred
by adding the penalty scores of each mutation.
Antiretroviral TreatmentUpon enrollment, participants initiated a regimen containing
nevirapine or efavirenz, plus lamivudine with stavudine or
zidovudine. From April 2006, tenofovir plus emtricitabine
(Truvada) became available and was widely used in combination
with efavirenz. When switching criteria were reached, a protease
inhibitor (PI)-based regimen, usually indinavir/ritonavir or
lopinavir/ritonavir, depending on availability, was provided.
Before treatment switches, causes for viral rebound or immuno-
logical deterioration were investigated, with attention to adher-
ence, toxicities, and co-infections. Drug changes within class or
between classes for reasons of toxicity were not considered
‘‘protocol switches’’ in the analysis.
OutcomesThe primary endpoint was clinical failure defined as confirmed
CD4 ,50 cells/mm3, first or new AIDS-defining event, or death.
An independent committee reviewed and classified all AIDS-
defining events. The main secondary endpoint was the number of
drugs remaining available for treatment at the time of switch
(future drug options, denoted FDO), calculated from resistance
mutations [14]. Two FDO scores were calculated: FDO-1 based
on the number of drug classes with one or more drugs to which the
virus was susceptible (NC) with extra credit (0.3) for full
susceptibility in NRTI or PI classes; and FDO-2 calculated as
NC + the number of drugs to which the virus was susceptible (ND)
divided by the total number (19) of drugs available +1, i.e., NC +(ND/20). Other secondary endpoints were the rate of switch to
second-line regimens per protocol criteria, virologic response
(percent of subjects below 50 copies/ml at 3 y), immunological
status (CD4 cell count at 3 y), and serious adverse events.
Sample SizeOn the basis of a literature review at the time the study was
planned, the Kaplan-Meier cumulative 3-y risk of clinical failure
on VL monitoring was expected to be 5% per year, or 14% over
3 y [15–18]. For the primary analysis, a noninferiority margin
(delta) of 7.4%, corresponding to a hazard ratio of 1.6, was
considered acceptable in view of the expected benefit of the CD4
monitoring strategy. Using a one-sided confidence interval (CI)
approach, a sample size of 304 evaluable patients per arm ensured
80% power to rule out a difference greater than delta. Assuming
two interim analyses and 15% unevaluable, 350 patients per arm
were required.
Statistical MethodsThe primary analysis compared the CD4 versus VL arm based
on the Kaplan-Meier estimates of clinical/immunologic failure at
36 mo. All randomized patients were included in the final intent to
treat analysis. Participants who died, withdrew from the study, or
were lost to follow-up (defined as those who missed all visits for
over 6 mo and no contact) were included and data were censored
at date of death or at last visit. Participants who completed the
study schedule were censored on April 1, 2010. Distributions were
compared using the Fisher exact test and Wilcoxon rank-sum test.
Additional analyses studied baseline factors associated with clinical
failure using Log rank tests and Cox proportional hazards models
after testing that the Cox proportional hazards model assumptions
were met (covariate effects not changing over time, and flat slope
in the regression of time versus residuals).
Study MonitoringIn addition to the Data and Safety Monitoring Board (DSMB),
a Resistance Experts Committee was constituted to provide
expertise in support of the DSMB regarding resistance mutations
and their clinical implications. Outcomes, safety and resistance
profiles by arm, were presented during the two interim analyses.
The study protocol was approved by the Ethical Committees of
the Thai Ministry of Public Health, Chiang Mai University
Faculty of Associated Medical Sciences, Harvard School of Public
Health Institutional Review Board, and local hospitals when
applicable.
Results
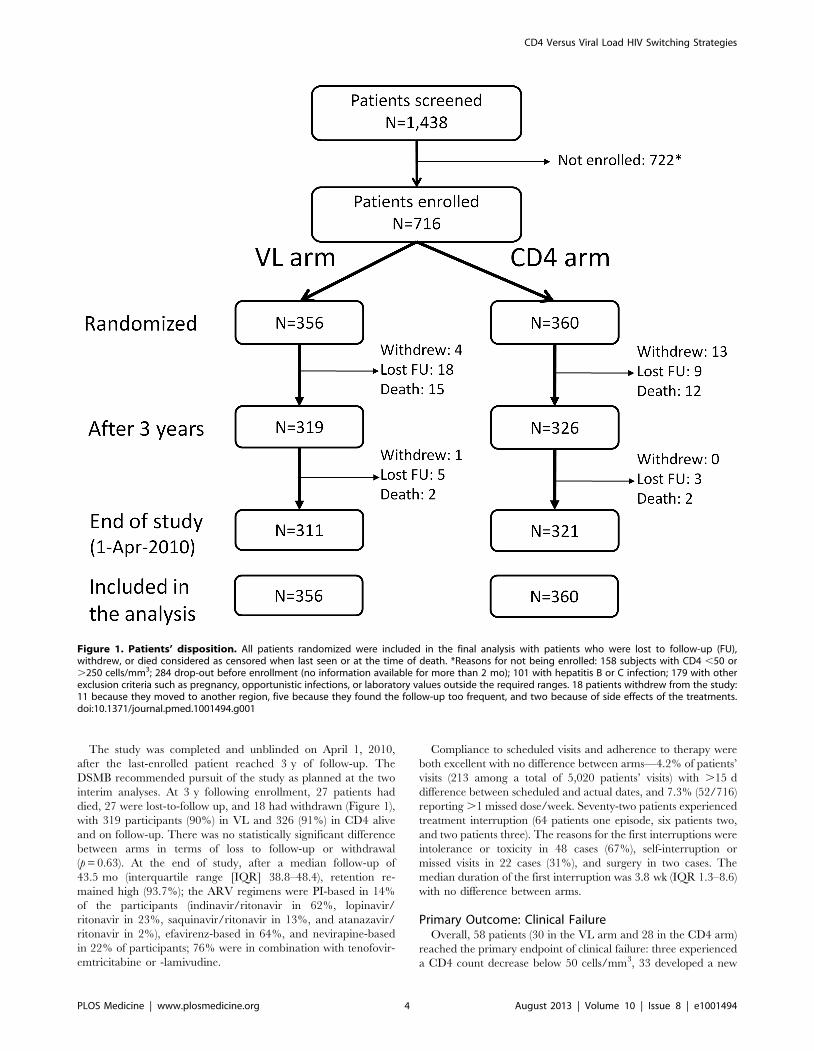
From May 2005 to April 2007, 716 participants were recruited
and randomized: 356 to the VL arm and 360 to the CD4 arm
(Figure 1). All participants were included in the analysis. Baseline
characteristics are provided in Table 1. The two arms were
balanced with respect to all baseline characteristics except sex
(58% female in the VL arm and 66% in the CD4 arm, p = 0.03).
Initial regimens were efavirenz-based in 65% and nevirapine-
based in 35% of participants; 66% were in combination with
tenofovir-emtricitabine and 34% with zidovudine or stavudine
plus lamivudine.
CD4 Versus Viral Load HIV Switching Strategies
PLOS Medicine | www.plosmedicine.org 3 August 2013 | Volume 10 | Issue 8 | e1001494
The study was completed and unblinded on April 1, 2010,
after the last-enrolled patient reached 3 y of follow-up. The
DSMB recommended pursuit of the study as planned at the two
interim analyses. At 3 y following enrollment, 27 patients had
died, 27 were lost-to-follow up, and 18 had withdrawn (Figure 1),
with 319 participants (90%) in VL and 326 (91%) in CD4 alive
and on follow-up. There was no statistically significant difference
between arms in terms of loss to follow-up or withdrawal
(p = 0.63). At the end of study, after a median follow-up of
43.5 mo (interquartile range [IQR] 38.8–48.4), retention re-
mained high (93.7%); the ARV regimens were PI-based in 14%
of the participants (indinavir/ritonavir in 62%, lopinavir/
ritonavir in 23%, saquinavir/ritonavir in 13%, and atanazavir/
ritonavir in 2%), efavirenz-based in 64%, and nevirapine-based
in 22% of participants; 76% were in combination with tenofovir-
emtricitabine or -lamivudine.
Compliance to scheduled visits and adherence to therapy were
both excellent with no difference between arms—4.2% of patients’
visits (213 among a total of 5,020 patients’ visits) with .15 d
difference between scheduled and actual dates, and 7.3% (52/716)
reporting .1 missed dose/week. Seventy-two patients experienced
treatment interruption (64 patients one episode, six patients two,
and two patients three). The reasons for the first interruptions were
intolerance or toxicity in 48 cases (67%), self-interruption or
missed visits in 22 cases (31%), and surgery in two cases. The
median duration of the first interruption was 3.8 wk (IQR 1.3–8.6)
with no difference between arms.
Primary Outcome: Clinical FailureOverall, 58 patients (30 in the VL arm and 28 in the CD4 arm)
reached the primary endpoint of clinical failure: three experienced
a CD4 count decrease below 50 cells/mm3, 33 developed a new
Figure 1. Patients’ disposition. All patients randomized were included in the final analysis with patients who were lost to follow-up (FU),withdrew, or died considered as censored when last seen or at the time of death. *Reasons for not being enrolled: 158 subjects with CD4 ,50 or.250 cells/mm3; 284 drop-out before enrollment (no information available for more than 2 mo); 101 with hepatitis B or C infection; 179 with otherexclusion criteria such as pregnancy, opportunistic infections, or laboratory values outside the required ranges. 18 patients withdrew from the study:11 because they moved to another region, five because they found the follow-up too frequent, and two because of side effects of the treatments.doi:10.1371/journal.pmed.1001494.g001
CD4 Versus Viral Load HIV Switching Strategies
PLOS Medicine | www.plosmedicine.org 4 August 2013 | Volume 10 | Issue 8 | e1001494
AIDS-defining event (including nine followed by death), and 22
died (Table 2). Nineteen of the 26 AIDS-defining events that
occurred in the first 6 mo were classified as possibly related to
immune reconstitution. The AIDS-defining events included 13
tuberculosis or mycobacterium infections (four fatal), seven
cryptococcal diseases (one fatal), five sepsis (four fatal), four
Pneumocystis jerovicii pneumonia, and four systemic Penicillium
marneffei infections.
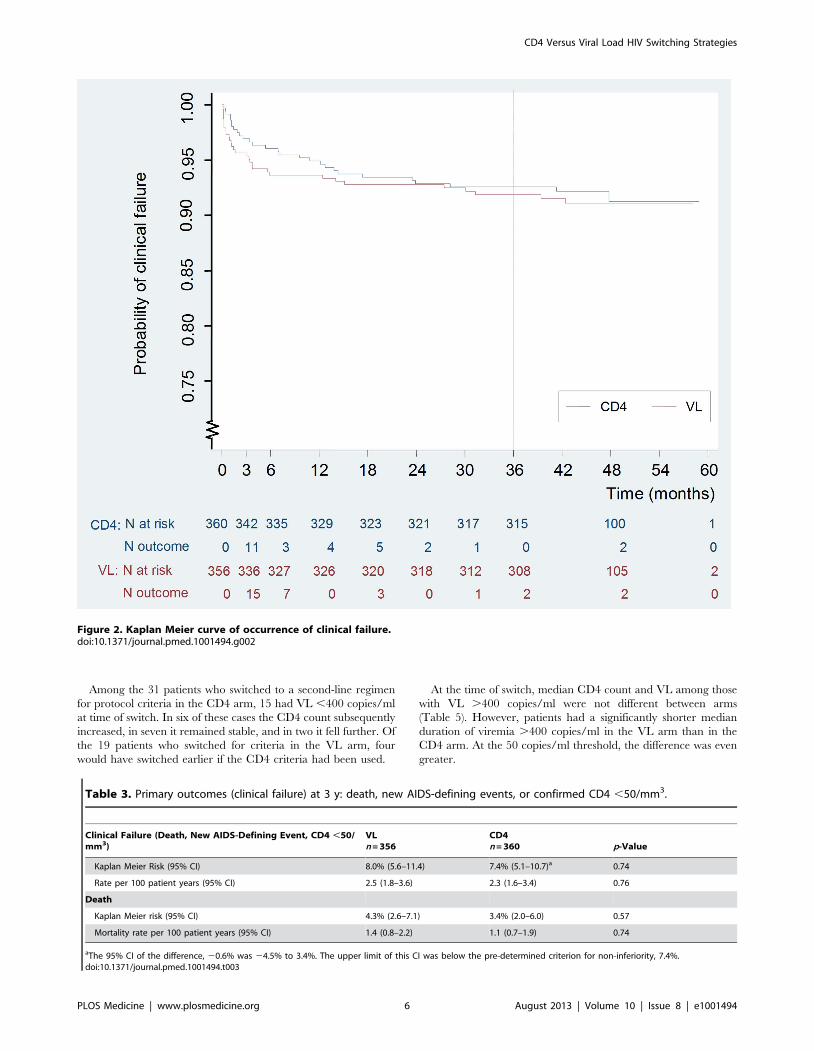
The Kaplan-Meier risk of clinical failure at 3-y was not
significantly different between the two arms: 8.0% (95% CI
5.6–11.4) in the VL versus 7.4% (5.1–10.7) in the CD4 arm
(p = 0.74) (Figure 2; Table 3). The 95% CI of the difference,
20.6%, was 24.5% to 3.4%. The upper limit of this CI was below
the pre-determined criterion for non-inferiority, 7.4%. The
corresponding hazard ratio was 0.92, and its 95% CI was 0.55–
1.53, also within the preset hazard ratio non-inferiority limit of 1.6.
Nearly half of the failures occurred during the first 3 mo of
therapy (15/30 and 11/28 in the VL and CD4 arms, respectively)
before the tested monitoring strategies could have any clinical
impact. At 3-y, the cumulative risk of death was 4.3% (2.6–7.1)
versus 3.4% (2.0–6.0), respectively (p = 0.57).
Baseline factors associated with clinical failure by univariate
analysis included US Centers for Disease Control and Prevention
(CDC) stage B or C, anemia (hemoglobin #10 g/dl), CD4 count
below median, i.e., 150 cells/mm3 (all p,0.001), VL above 5 log10
copies/ml (p = 0.001), and body mass index (BMI) below 18.5
(p = 0.002) (Table 4). Age, sex, initial ARV regimen, and switching
strategy were not associated with the primary outcome. Upon
multivariable analysis, factors independently associated with
clinical failure were baseline anemia (p = 0.001), CDC stage B or
C (p = 0.002), and low CD4 count (p = 0.04).
Secondary OutcomesSwitch for study criteria. Fifty of the 716 enrolled patients
(14%) were switched to second-line regimens as per protocol
criteria (19 in the VL arm and 31 in the CD4 arm). The 36-mo
probabilities of switch for protocol were not significantly different,
5.2% (3.2–8.4) in VL versus 7.5% (5.0–11.1) in CD4, p = 0.10.
However, the median time from enrollment to switch was
significantly shorter in the VL arm (11.7 versus 24.7 mo,
p = 0.001) (Table 5).
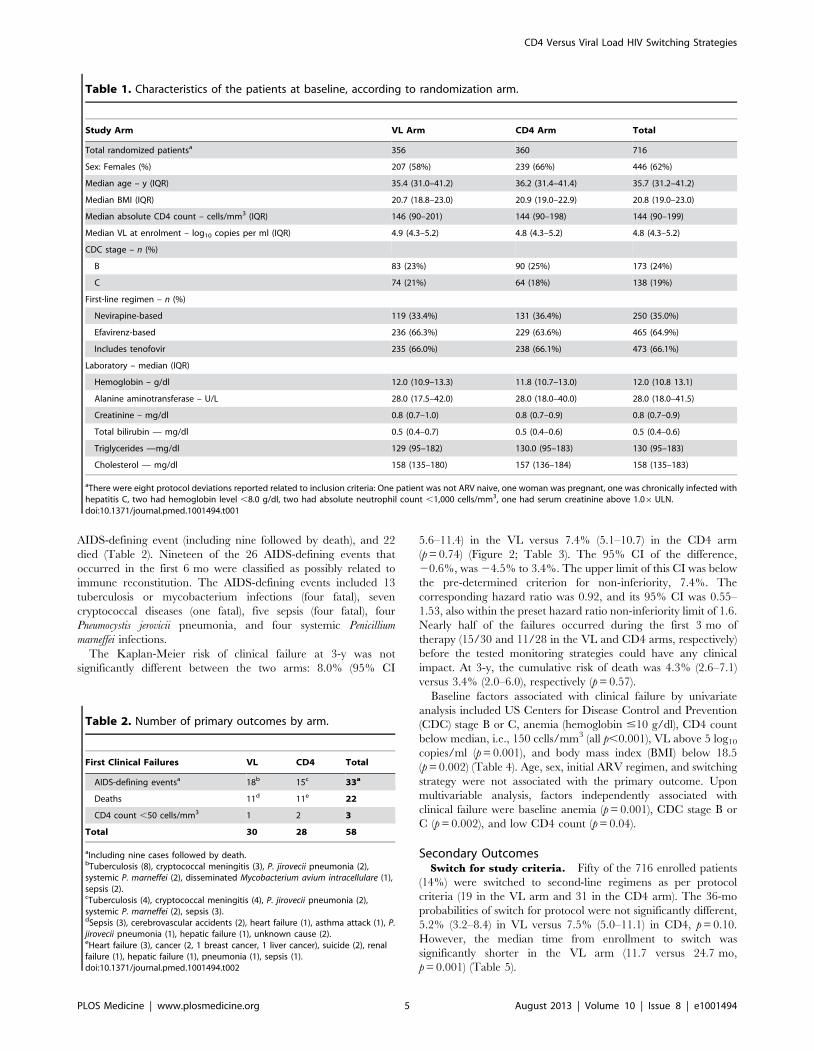
Table 1. Characteristics of the patients at baseline, according to randomization arm.
Study Arm VL Arm CD4 Arm Total
Total randomized patientsa 356 360 716
Sex: Females (%) 207 (58%) 239 (66%) 446 (62%)
Median age – y (IQR) 35.4 (31.0–41.2) 36.2 (31.4–41.4) 35.7 (31.2–41.2)
Median BMI (IQR) 20.7 (18.8–23.0) 20.9 (19.0–22.9) 20.8 (19.0–23.0)
Median absolute CD4 count – cells/mm3 (IQR) 146 (90–201) 144 (90–198) 144 (90–199)
Median VL at enrolment – log10 copies per ml (IQR) 4.9 (4.3–5.2) 4.8 (4.3–5.2) 4.8 (4.3–5.2)
CDC stage – n (%)
B 83 (23%) 90 (25%) 173 (24%)
C 74 (21%) 64 (18%) 138 (19%)
First-line regimen – n (%)
Nevirapine-based 119 (33.4%) 131 (36.4%) 250 (35.0%)
Efavirenz-based 236 (66.3%) 229 (63.6%) 465 (64.9%)
Includes tenofovir 235 (66.0%) 238 (66.1%) 473 (66.1%)
Laboratory – median (IQR)
Hemoglobin – g/dl 12.0 (10.9–13.3) 11.8 (10.7–13.0) 12.0 (10.8 13.1)
Alanine aminotransferase – U/L 28.0 (17.5–42.0) 28.0 (18.0–40.0) 28.0 (18.0–41.5)
Creatinine – mg/dl 0.8 (0.7–1.0) 0.8 (0.7–0.9) 0.8 (0.7–0.9)
Total bilirubin — mg/dl 0.5 (0.4–0.7) 0.5 (0.4–0.6) 0.5 (0.4–0.6)
Triglycerides —mg/dl 129 (95–182) 130.0 (95–183) 130 (95–183)
Cholesterol — mg/dl 158 (135–180) 157 (136–184) 158 (135–183)
aThere were eight protocol deviations reported related to inclusion criteria: One patient was not ARV naive, one woman was pregnant, one was chronically infected withhepatitis C, two had hemoglobin level ,8.0 g/dl, two had absolute neutrophil count ,1,000 cells/mm3, one had serum creatinine above 1.06ULN.doi:10.1371/journal.pmed.1001494.t001
Table 2. Number of primary outcomes by arm.
First Clinical Failures VL CD4 Total
AIDS-defining eventsa 18b 15c 33a
Deaths 11d 11e 22
CD4 count ,50 cells/mm3 1 2 3
Total 30 28 58
aIncluding nine cases followed by death.bTuberculosis (8), cryptococcal meningitis (3), P. jirovecii pneumonia (2),systemic P. marneffei (2), disseminated Mycobacterium avium intracellulare (1),sepsis (2).cTuberculosis (4), cryptococcal meningitis (4), P. jirovecii pneumonia (2),systemic P. marneffei (2), sepsis (3).dSepsis (3), cerebrovascular accidents (2), heart failure (1), asthma attack (1), P.jirovecii pneumonia (1), hepatic failure (1), unknown cause (2).eHeart failure (3), cancer (2, 1 breast cancer, 1 liver cancer), suicide (2), renalfailure (1), hepatic failure (1), pneumonia (1), sepsis (1).doi:10.1371/journal.pmed.1001494.t002
CD4 Versus Viral Load HIV Switching Strategies
PLOS Medicine | www.plosmedicine.org 5 August 2013 | Volume 10 | Issue 8 | e1001494
Among the 31 patients who switched to a second-line regimen
for protocol criteria in the CD4 arm, 15 had VL ,400 copies/ml
at time of switch. In six of these cases the CD4 count subsequently
increased, in seven it remained stable, and in two it fell further. Of
the 19 patients who switched for criteria in the VL arm, four
would have switched earlier if the CD4 criteria had been used.
At the time of switch, median CD4 count and VL among those
with VL .400 copies/ml were not different between arms
(Table 5). However, patients had a significantly shorter median
duration of viremia .400 copies/ml in the VL arm than in the
CD4 arm. At the 50 copies/ml threshold, the difference was even
greater.
Figure 2. Kaplan Meier curve of occurrence of clinical failure.doi:10.1371/journal.pmed.1001494.g002
Table 3. Primary outcomes (clinical failure) at 3 y: death, new AIDS-defining events, or confirmed CD4 ,50/mm3.
Clinical Failure (Death, New AIDS-Defining Event, CD4 ,50/mm3)
VLn = 356
CD4n = 360 p-Value
Kaplan Meier Risk (95% CI) 8.0% (5.6–11.4) 7.4% (5.1–10.7)a 0.74
Rate per 100 patient years (95% CI) 2.5 (1.8–3.6) 2.3 (1.6–3.4) 0.76
Death
Kaplan Meier risk (95% CI) 4.3% (2.6–7.1) 3.4% (2.0–6.0) 0.57
Mortality rate per 100 patient years (95% CI) 1.4 (0.8–2.2) 1.1 (0.7–1.9) 0.74
aThe 95% CI of the difference, 20.6% was 24.5% to 3.4%. The upper limit of this CI was below the pre-determined criterion for non-inferiority, 7.4%.doi:10.1371/journal.pmed.1001494.t003
CD4 Versus Viral Load HIV Switching Strategies
PLOS Medicine | www.plosmedicine.org 6 August 2013 | Volume 10 | Issue 8 | e1001494
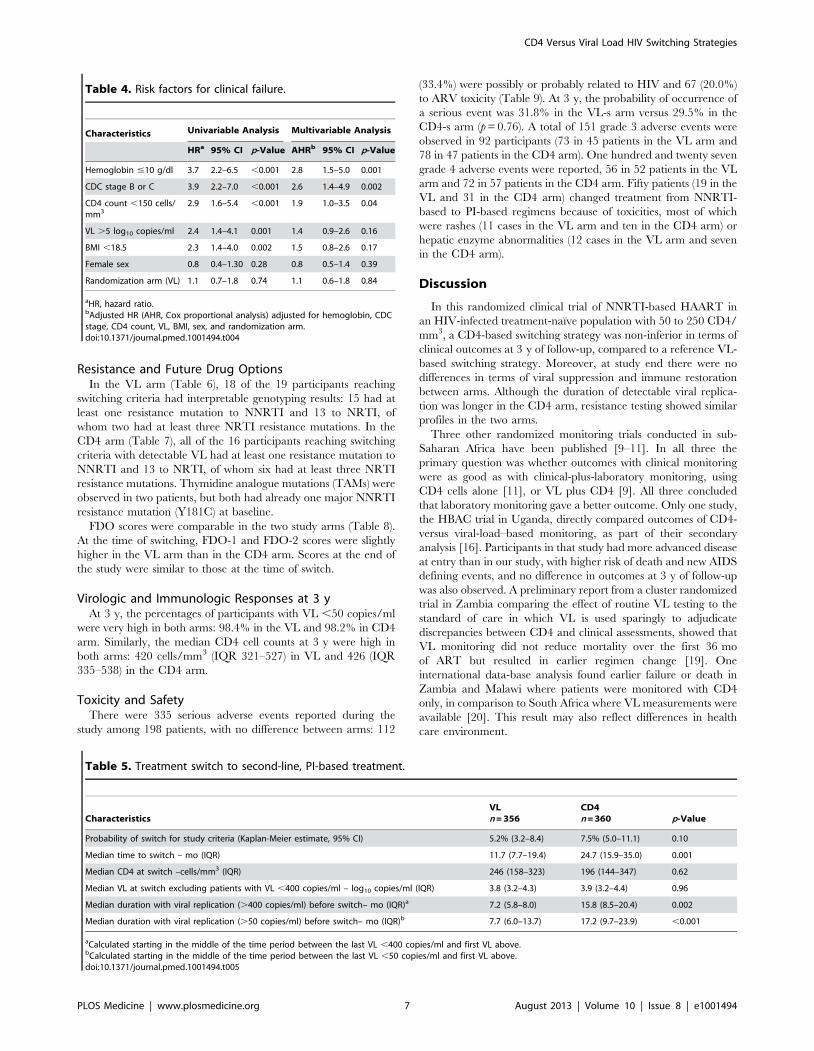
Resistance and Future Drug OptionsIn the VL arm (Table 6), 18 of the 19 participants reaching
switching criteria had interpretable genotyping results: 15 had at
least one resistance mutation to NNRTI and 13 to NRTI, of
whom two had at least three NRTI resistance mutations. In the
CD4 arm (Table 7), all of the 16 participants reaching switching
criteria with detectable VL had at least one resistance mutation to
NNRTI and 13 to NRTI, of whom six had at least three NRTI
resistance mutations. Thymidine analogue mutations (TAMs) were
observed in two patients, but both had already one major NNRTI
resistance mutation (Y181C) at baseline.
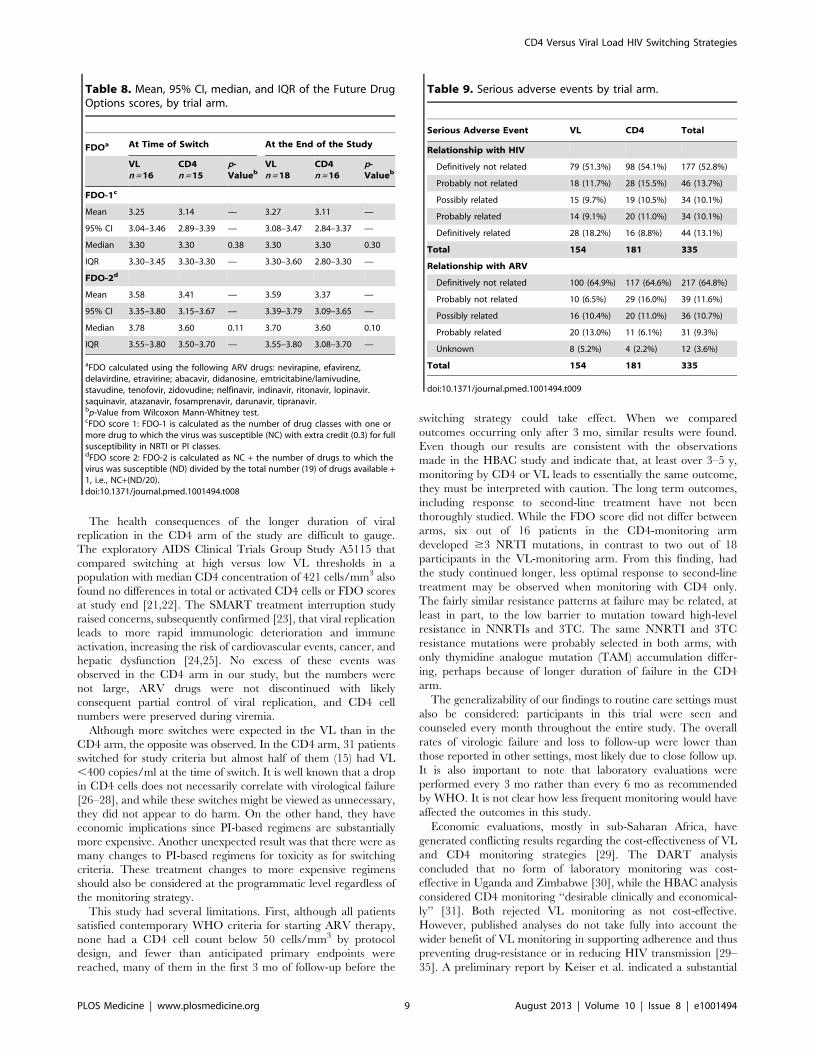
FDO scores were comparable in the two study arms (Table 8).
At the time of switching, FDO-1 and FDO-2 scores were slightly
higher in the VL arm than in the CD4 arm. Scores at the end of
the study were similar to those at the time of switch.
Virologic and Immunologic Responses at 3 yAt 3 y, the percentages of participants with VL ,50 copies/ml
were very high in both arms: 98.4% in the VL and 98.2% in CD4
arm. Similarly, the median CD4 cell counts at 3 y were high in
both arms: 420 cells/mm3 (IQR 321–527) in VL and 426 (IQR
335–538) in the CD4 arm.
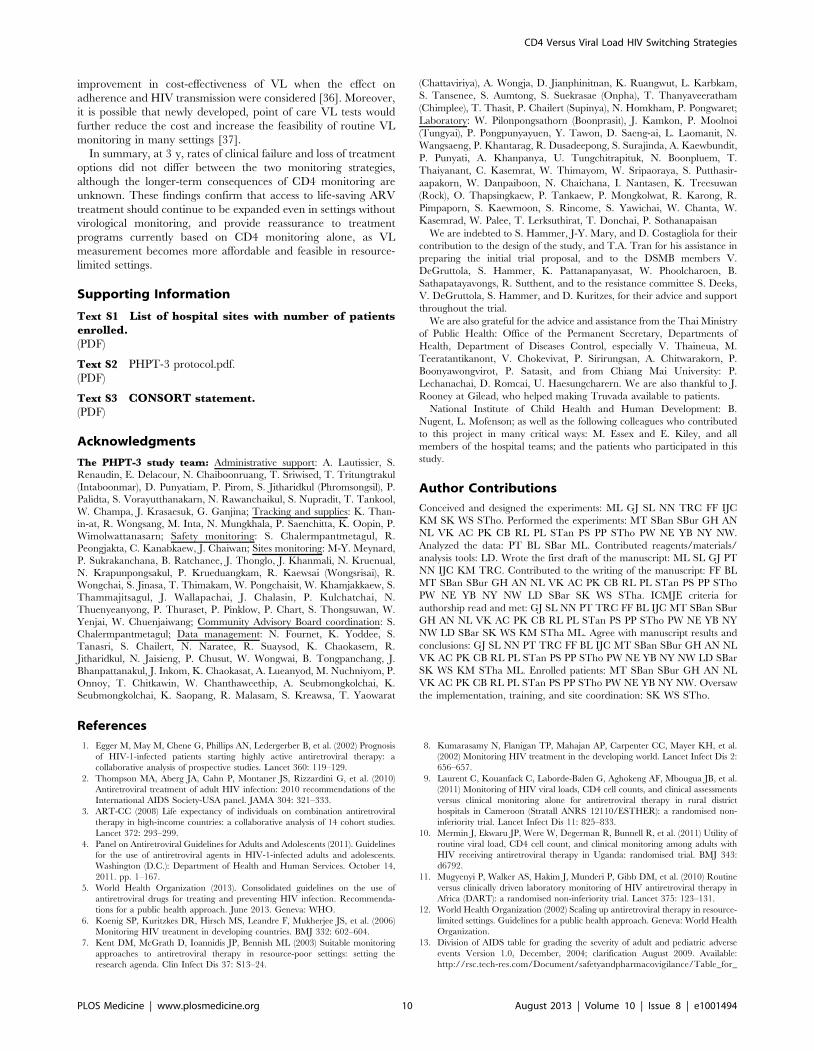
Toxicity and SafetyThere were 335 serious adverse events reported during the
study among 198 patients, with no difference between arms: 112
(33.4%) were possibly or probably related to HIV and 67 (20.0%)
to ARV toxicity (Table 9). At 3 y, the probability of occurrence of
a serious event was 31.8% in the VL-s arm versus 29.5% in the
CD4-s arm (p = 0.76). A total of 151 grade 3 adverse events were
observed in 92 participants (73 in 45 patients in the VL arm and
78 in 47 patients in the CD4 arm). One hundred and twenty seven
grade 4 adverse events were reported, 56 in 52 patients in the VL
arm and 72 in 57 patients in the CD4 arm. Fifty patients (19 in the
VL and 31 in the CD4 arm) changed treatment from NNRTI-
based to PI-based regimens because of toxicities, most of which
were rashes (11 cases in the VL arm and ten in the CD4 arm) or
hepatic enzyme abnormalities (12 cases in the VL arm and seven
in the CD4 arm).
Discussion
In this randomized clinical trial of NNRTI-based HAART in
an HIV-infected treatment-naıve population with 50 to 250 CD4/
mm3, a CD4-based switching strategy was non-inferior in terms of
clinical outcomes at 3 y of follow-up, compared to a reference VL-
based switching strategy. Moreover, at study end there were no
differences in terms of viral suppression and immune restoration
between arms. Although the duration of detectable viral replica-
tion was longer in the CD4 arm, resistance testing showed similar
profiles in the two arms.
Three other randomized monitoring trials conducted in sub-
Saharan Africa have been published [9–11]. In all three the
primary question was whether outcomes with clinical monitoring
were as good as with clinical-plus-laboratory monitoring, using
CD4 cells alone [11], or VL plus CD4 [9]. All three concluded
that laboratory monitoring gave a better outcome. Only one study,
the HBAC trial in Uganda, directly compared outcomes of CD4-
versus viral-load–based monitoring, as part of their secondary
analysis [16]. Participants in that study had more advanced disease
at entry than in our study, with higher risk of death and new AIDS
defining events, and no difference in outcomes at 3 y of follow-up
was also observed. A preliminary report from a cluster randomized
trial in Zambia comparing the effect of routine VL testing to the
standard of care in which VL is used sparingly to adjudicate
discrepancies between CD4 and clinical assessments, showed that
VL monitoring did not reduce mortality over the first 36 mo
of ART but resulted in earlier regimen change [19]. One
international data-base analysis found earlier failure or death in
Zambia and Malawi where patients were monitored with CD4
only, in comparison to South Africa where VL measurements were
available [20]. This result may also reflect differences in health
care environment.
Table 4. Risk factors for clinical failure.
Characteristics Univariable Analysis Multivariable Analysis
HRa 95% CI p-Value AHRb 95% CI p-Value
Hemoglobin #10 g/dl 3.7 2.2–6.5 ,0.001 2.8 1.5–5.0 0.001
CDC stage B or C 3.9 2.2–7.0 ,0.001 2.6 1.4–4.9 0.002
CD4 count ,150 cells/mm3
2.9 1.6–5.4 ,0.001 1.9 1.0–3.5 0.04
VL .5 log10 copies/ml 2.4 1.4–4.1 0.001 1.4 0.9–2.6 0.16
BMI ,18.5 2.3 1.4–4.0 0.002 1.5 0.8–2.6 0.17
Female sex 0.8 0.4–1.30 0.28 0.8 0.5–1.4 0.39
Randomization arm (VL) 1.1 0.7–1.8 0.74 1.1 0.6–1.8 0.84
aHR, hazard ratio.bAdjusted HR (AHR, Cox proportional analysis) adjusted for hemoglobin, CDCstage, CD4 count, VL, BMI, sex, and randomization arm.doi:10.1371/journal.pmed.1001494.t004
Table 5. Treatment switch to second-line, PI-based treatment.
CharacteristicsVLn = 356
CD4n = 360 p-Value
Probability of switch for study criteria (Kaplan-Meier estimate, 95% CI) 5.2% (3.2–8.4) 7.5% (5.0–11.1) 0.10
Median time to switch – mo (IQR) 11.7 (7.7–19.4) 24.7 (15.9–35.0) 0.001
Median CD4 at switch –cells/mm3 (IQR) 246 (158–323) 196 (144–347) 0.62
Median VL at switch excluding patients with VL ,400 copies/ml – log10 copies/ml (IQR) 3.8 (3.2–4.3) 3.9 (3.2–4.4) 0.96
Median duration with viral replication (.400 copies/ml) before switch– mo (IQR)a 7.2 (5.8–8.0) 15.8 (8.5–20.4) 0.002
Median duration with viral replication (.50 copies/ml) before switch– mo (IQR)b 7.7 (6.0–13.7) 17.2 (9.7–23.9) ,0.001
aCalculated starting in the middle of the time period between the last VL ,400 copies/ml and first VL above.bCalculated starting in the middle of the time period between the last VL ,50 copies/ml and first VL above.doi:10.1371/journal.pmed.1001494.t005
CD4 Versus Viral Load HIV Switching Strategies
PLOS Medicine | www.plosmedicine.org 7 August 2013 | Volume 10 | Issue 8 | e1001494
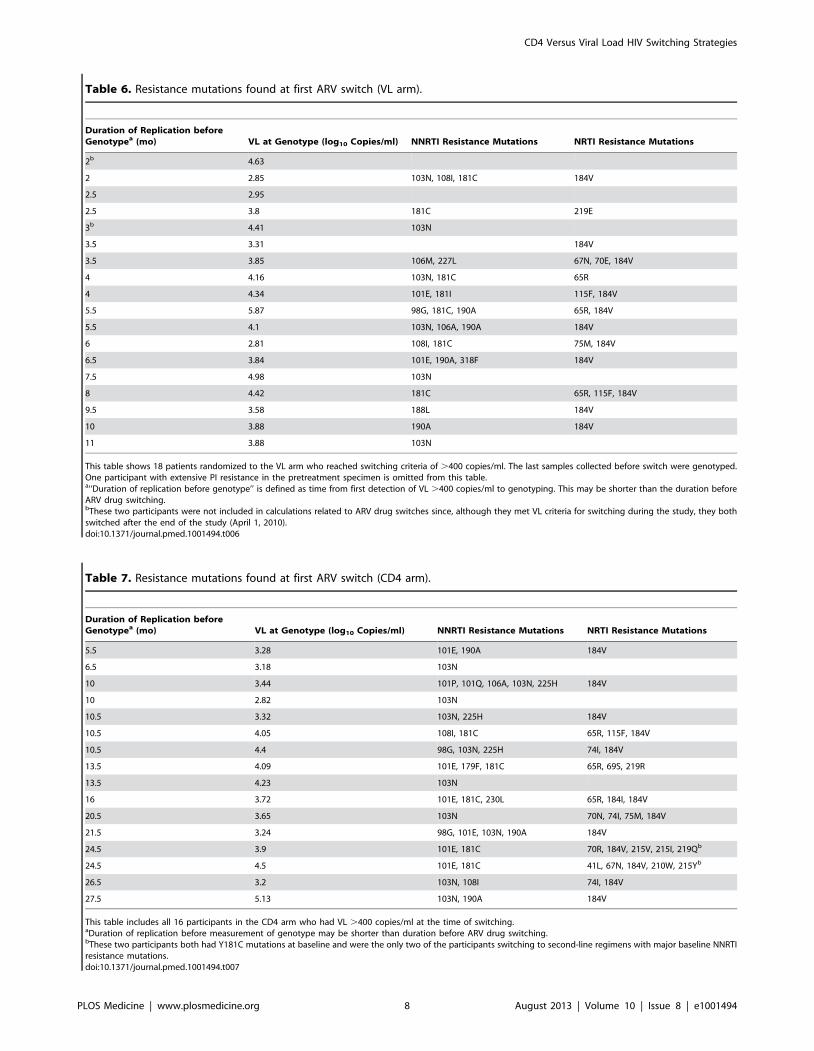
Table 6. Resistance mutations found at first ARV switch (VL arm).
Duration of Replication beforeGenotypea (mo) VL at Genotype (log10 Copies/ml) NNRTI Resistance Mutations NRTI Resistance Mutations
2b 4.63
2 2.85 103N, 108I, 181C 184V
2.5 2.95
2.5 3.8 181C 219E
3b 4.41 103N
3.5 3.31 184V
3.5 3.85 106M, 227L 67N, 70E, 184V
4 4.16 103N, 181C 65R
4 4.34 101E, 181I 115F, 184V
5.5 5.87 98G, 181C, 190A 65R, 184V
5.5 4.1 103N, 106A, 190A 184V
6 2.81 108I, 181C 75M, 184V
6.5 3.84 101E, 190A, 318F 184V
7.5 4.98 103N
8 4.42 181C 65R, 115F, 184V
9.5 3.58 188L 184V
10 3.88 190A 184V
11 3.88 103N
This table shows 18 patients randomized to the VL arm who reached switching criteria of .400 copies/ml. The last samples collected before switch were genotyped.One participant with extensive PI resistance in the pretreatment specimen is omitted from this table.a‘‘Duration of replication before genotype’’ is defined as time from first detection of VL .400 copies/ml to genotyping. This may be shorter than the duration beforeARV drug switching.bThese two participants were not included in calculations related to ARV drug switches since, although they met VL criteria for switching during the study, they bothswitched after the end of the study (April 1, 2010).doi:10.1371/journal.pmed.1001494.t006
Table 7. Resistance mutations found at first ARV switch (CD4 arm).
Duration of Replication beforeGenotypea (mo) VL at Genotype (log10 Copies/ml) NNRTI Resistance Mutations NRTI Resistance Mutations
5.5 3.28 101E, 190A 184V
6.5 3.18 103N
10 3.44 101P, 101Q, 106A, 103N, 225H 184V
10 2.82 103N
10.5 3.32 103N, 225H 184V
10.5 4.05 108I, 181C 65R, 115F, 184V
10.5 4.4 98G, 103N, 225H 74I, 184V
13.5 4.09 101E, 179F, 181C 65R, 69S, 219R
13.5 4.23 103N
16 3.72 101E, 181C, 230L 65R, 184I, 184V
20.5 3.65 103N 70N, 74I, 75M, 184V
21.5 3.24 98G, 101E, 103N, 190A 184V
24.5 3.9 101E, 181C 70R, 184V, 215V, 215I, 219Qb
24.5 4.5 101E, 181C 41L, 67N, 184V, 210W, 215Yb
26.5 3.2 103N, 108I 74I, 184V
27.5 5.13 103N, 190A 184V
This table includes all 16 participants in the CD4 arm who had VL .400 copies/ml at the time of switching.aDuration of replication before measurement of genotype may be shorter than duration before ARV drug switching.bThese two participants both had Y181C mutations at baseline and were the only two of the participants switching to second-line regimens with major baseline NNRTIresistance mutations.doi:10.1371/journal.pmed.1001494.t007
CD4 Versus Viral Load HIV Switching Strategies
PLOS Medicine | www.plosmedicine.org 8 August 2013 | Volume 10 | Issue 8 | e1001494
The health consequences of the longer duration of viral
replication in the CD4 arm of the study are difficult to gauge.
The exploratory AIDS Clinical Trials Group Study A5115 that
compared switching at high versus low VL thresholds in a
population with median CD4 concentration of 421 cells/mm3 also
found no differences in total or activated CD4 cells or FDO scores
at study end [21,22]. The SMART treatment interruption study
raised concerns, subsequently confirmed [23], that viral replication
leads to more rapid immunologic deterioration and immune
activation, increasing the risk of cardiovascular events, cancer, and
hepatic dysfunction [24,25]. No excess of these events was
observed in the CD4 arm in our study, but the numbers were
not large, ARV drugs were not discontinued with likely
consequent partial control of viral replication, and CD4 cell
numbers were preserved during viremia.
Although more switches were expected in the VL than in the
CD4 arm, the opposite was observed. In the CD4 arm, 31 patients
switched for study criteria but almost half of them (15) had VL
,400 copies/ml at the time of switch. It is well known that a drop
in CD4 cells does not necessarily correlate with virological failure
[26–28], and while these switches might be viewed as unnecessary,
they did not appear to do harm. On the other hand, they have
economic implications since PI-based regimens are substantially
more expensive. Another unexpected result was that there were as
many changes to PI-based regimens for toxicity as for switching
criteria. These treatment changes to more expensive regimens
should also be considered at the programmatic level regardless of
the monitoring strategy.
This study had several limitations. First, although all patients
satisfied contemporary WHO criteria for starting ARV therapy,
none had a CD4 cell count below 50 cells/mm3 by protocol
design, and fewer than anticipated primary endpoints were
reached, many of them in the first 3 mo of follow-up before the
switching strategy could take effect. When we compared
outcomes occurring only after 3 mo, similar results were found.
Even though our results are consistent with the observations
made in the HBAC study and indicate that, at least over 3–5 y,
monitoring by CD4 or VL leads to essentially the same outcome,
they must be interpreted with caution. The long term outcomes,
including response to second-line treatment have not been
thoroughly studied. While the FDO score did not differ between
arms, six out of 16 patients in the CD4-monitoring arm
developed $3 NRTI mutations, in contrast to two out of 18
participants in the VL-monitoring arm. From this finding, had
the study continued longer, less optimal response to second-line
treatment may be observed when monitoring with CD4 only.
The fairly similar resistance patterns at failure may be related, at
least in part, to the low barrier to mutation toward high-level
resistance in NNRTIs and 3TC. The same NNRTI and 3TC
resistance mutations were probably selected in both arms, with
only thymidine analogue mutation (TAM) accumulation differ-
ing, perhaps because of longer duration of failure in the CD4
arm.
The generalizability of our findings to routine care settings must
also be considered: participants in this trial were seen and
counseled every month throughout the entire study. The overall
rates of virologic failure and loss to follow-up were lower than
those reported in other settings, most likely due to close follow up.
It is also important to note that laboratory evaluations were
performed every 3 mo rather than every 6 mo as recommended
by WHO. It is not clear how less frequent monitoring would have
affected the outcomes in this study.
Economic evaluations, mostly in sub-Saharan Africa, have
generated conflicting results regarding the cost-effectiveness of VL
and CD4 monitoring strategies [29]. The DART analysis
concluded that no form of laboratory monitoring was cost-
effective in Uganda and Zimbabwe [30], while the HBAC analysis
considered CD4 monitoring ‘‘desirable clinically and economical-
ly’’ [31]. Both rejected VL monitoring as not cost-effective.
However, published analyses do not take fully into account the
wider benefit of VL monitoring in supporting adherence and thus
preventing drug-resistance or in reducing HIV transmission [29–
35]. A preliminary report by Keiser et al. indicated a substantial
Table 8. Mean, 95% CI, median, and IQR of the Future DrugOptions scores, by trial arm.
FDOa At Time of Switch At the End of the Study
VLn = 16
CD4n = 15
p-Valueb
VLn = 18
CD4n = 16
p-Valueb
FDO-1c
Mean 3.25 3.14 — 3.27 3.11 —
95% CI 3.04–3.46 2.89–3.39 — 3.08–3.47 2.84–3.37 —
Median 3.30 3.30 0.38 3.30 3.30 0.30
IQR 3.30–3.45 3.30–3.30 — 3.30–3.60 2.80–3.30 —
FDO-2d
Mean 3.58 3.41 — 3.59 3.37 —
95% CI 3.35–3.80 3.15–3.67 — 3.39–3.79 3.09–3.65 —
Median 3.78 3.60 0.11 3.70 3.60 0.10
IQR 3.55–3.80 3.50–3.70 — 3.55–3.80 3.08–3.70 —
aFDO calculated using the following ARV drugs: nevirapine, efavirenz,delavirdine, etravirine; abacavir, didanosine, emtricitabine/lamivudine,stavudine, tenofovir, zidovudine; nelfinavir, indinavir, ritonavir, lopinavir.saquinavir, atazanavir, fosamprenavir, darunavir, tipranavir.bp-Value from Wilcoxon Mann-Whitney test.cFDO score 1: FDO-1 is calculated as the number of drug classes with one ormore drug to which the virus was susceptible (NC) with extra credit (0.3) for fullsusceptibility in NRTI or PI classes.dFDO score 2: FDO-2 is calculated as NC + the number of drugs to which thevirus was susceptible (ND) divided by the total number (19) of drugs available +1, i.e., NC+(ND/20).doi:10.1371/journal.pmed.1001494.t008
Table 9. Serious adverse events by trial arm.
Serious Adverse Event VL CD4 Total
Relationship with HIV
Definitively not related 79 (51.3%) 98 (54.1%) 177 (52.8%)
Probably not related 18 (11.7%) 28 (15.5%) 46 (13.7%)
Possibly related 15 (9.7%) 19 (10.5%) 34 (10.1%)
Probably related 14 (9.1%) 20 (11.0%) 34 (10.1%)
Definitively related 28 (18.2%) 16 (8.8%) 44 (13.1%)
Total 154 181 335
Relationship with ARV
Definitively not related 100 (64.9%) 117 (64.6%) 217 (64.8%)
Probably not related 10 (6.5%) 29 (16.0%) 39 (11.6%)
Possibly related 16 (10.4%) 20 (11.0%) 36 (10.7%)
Probably related 20 (13.0%) 11 (6.1%) 31 (9.3%)
Unknown 8 (5.2%) 4 (2.2%) 12 (3.6%)
Total 154 181 335
doi:10.1371/journal.pmed.1001494.t009
CD4 Versus Viral Load HIV Switching Strategies
PLOS Medicine | www.plosmedicine.org 9 August 2013 | Volume 10 | Issue 8 | e1001494
improvement in cost-effectiveness of VL when the effect on
adherence and HIV transmission were considered [36]. Moreover,
it is possible that newly developed, point of care VL tests would
further reduce the cost and increase the feasibility of routine VL
monitoring in many settings [37].
In summary, at 3 y, rates of clinical failure and loss of treatment
options did not differ between the two monitoring strategies,
although the longer-term consequences of CD4 monitoring are
unknown. These findings confirm that access to life-saving ARV
treatment should continue to be expanded even in settings without
virological monitoring, and provide reassurance to treatment
programs currently based on CD4 monitoring alone, as VL
measurement becomes more affordable and feasible in resource-
limited settings.
Supporting Information
Text S1 List of hospital sites with number of patientsenrolled.(PDF)
Text S2 PHPT-3 protocol.pdf.
(PDF)
Text S3 CONSORT statement.(PDF)
Acknowledgments
The PHPT-3 study team: Administrative support: A. Lautissier, S.
Renaudin, E. Delacour, N. Chaiboonruang, T. Sriwised, T. Tritungtrakul
(Intaboonmar), D. Punyatiam, P. Pirom, S. Jitharidkul (Phromsongsil), P.
Palidta, S. Vorayutthanakarn, N. Rawanchaikul, S. Nupradit, T. Tankool,
W. Champa, J. Krasaesuk, G. Ganjina; Tracking and supplies: K. Than-
in-at, R. Wongsang, M. Inta, N. Mungkhala, P. Saenchitta, K. Oopin, P.
Wimolwattanasarn; Safety monitoring: S. Chalermpantmetagul, R.
Peongjakta, C. Kanabkaew, J. Chaiwan; Sites monitoring: M-Y. Meynard,
P. Sukrakanchana, B. Ratchanee, J. Thonglo, J. Khanmali, N. Kruenual,
N. Krapunpongsakul, P. Krueduangkam, R. Kaewsai (Wongsrisai), R.
Wongchai, S. Jinasa, T. Thimakam, W. Pongchaisit, W. Khamjakkaew, S.
Thammajitsagul, J. Wallapachai, J. Chalasin, P. Kulchatchai, N.
Thuenyeanyong, P. Thuraset, P. Pinklow, P. Chart, S. Thongsuwan, W.
Yenjai, W. Chuenjaiwang; Community Advisory Board coordination: S.
Chalermpantmetagul; Data management: N. Fournet, K. Yoddee, S.
Tanasri, S. Chailert, N. Naratee, R. Suaysod, K. Chaokasem, R.
Jitharidkul, N. Jaisieng, P. Chusut, W. Wongwai, B. Tongpanchang, J.
Bhanpattanakul, J. Inkom, K. Chaokasat, A. Lueanyod, M. Nuchniyom, P.
Onnoy, T. Chitkawin, W. Chanthaweethip, A. Seubmongkolchai, K.
Seubmongkolchai, K. Saopang, R. Malasam, S. Kreawsa, T. Yaowarat
(Chattaviriya), A. Wongja, D. Jianphinitnan, K. Ruangwut, L. Karbkam,
S. Tansenee, S. Aumtong, S. Suekrasae (Onpha), T. Thanyaveeratham
(Chimplee), T. Thasit, P. Chailert (Supinya), N. Homkham, P. Pongwaret;
Laboratory: W. Pilonpongsathorn (Boonprasit), J. Kamkon, P. Moolnoi
(Tungyai), P. Pongpunyayuen, Y. Tawon, D. Saeng-ai, L. Laomanit, N.
Wangsaeng, P. Khantarag, R. Dusadeepong, S. Surajinda, A. Kaewbundit,
P. Punyati, A. Khanpanya, U. Tungchitrapituk, N. Boonpluem, T.
Thaiyanant, C. Kasemrat, W. Thimayom, W. Sripaoraya, S. Putthasir-
aapakorn, W. Danpaiboon, N. Chaichana, I. Nantasen, K. Treesuwan
(Rock), O. Thapsingkaew, P. Tankaew, P. Mongkolwat, R. Karong, R.
Pimpaporn, S. Kaewmoon, S. Rincome, S. Yawichai, W. Chanta, W.
Kasemrad, W. Palee, T. Lerksuthirat, T. Donchai, P. Sothanapaisan
We are indebted to S. Hammer, J-Y. Mary, and D. Costagliola for their
contribution to the design of the study, and T.A. Tran for his assistance in
preparing the initial trial proposal, and to the DSMB members V.
DeGruttola, S. Hammer, K. Pattanapanyasat, W. Phoolcharoen, B.
Sathapatayavongs, R. Sutthent, and to the resistance committee S. Deeks,
V. DeGruttola, S. Hammer, and D. Kuritzes, for their advice and support
throughout the trial.
We are also grateful for the advice and assistance from the Thai Ministry
of Public Health: Office of the Permanent Secretary, Departments of
Health, Department of Diseases Control, especially V. Thaineua, M.
Teeratantikanont, V. Chokevivat, P. Sirirungsan, A. Chitwarakorn, P.
Boonyawongvirot, P. Satasit, and from Chiang Mai University: P.
Lechanachai, D. Romcai, U. Haesungcharern. We are also thankful to J.
Rooney at Gilead, who helped making Truvada available to patients.
National Institute of Child Health and Human Development: B.
Nugent, L. Mofenson; as well as the following colleagues who contributed
to this project in many critical ways: M. Essex and E. Kiley, and all
members of the hospital teams; and the patients who participated in this
study.
Author Contributions
Conceived and designed the experiments: ML GJ SL NN TRC FF IJC
KM SK WS STho. Performed the experiments: MT SBan SBur GH AN
NL VK AC PK CB RL PL STan PS PP STho PW NE YB NY NW.
Analyzed the data: PT BL SBar ML. Contributed reagents/materials/
analysis tools: LD. Wrote the first draft of the manuscript: ML SL GJ PT
NN IJC KM TRC. Contributed to the writing of the manuscript: FF BL
MT SBan SBur GH AN NL VK AC PK CB RL PL STan PS PP STho
PW NE YB NY NW LD SBar SK WS STha. ICMJE criteria for
authorship read and met: GJ SL NN PT TRC FF BL IJC MT SBan SBur
GH AN NL VK AC PK CB RL PL STan PS PP STho PW NE YB NY
NW LD SBar SK WS KM STha ML. Agree with manuscript results and
conclusions: GJ SL NN PT TRC FF BL IJC MT SBan SBur GH AN NL
VK AC PK CB RL PL STan PS PP STho PW NE YB NY NW LD SBar
SK WS KM STha ML. Enrolled patients: MT SBan SBur GH AN NL
VK AC PK CB RL PL STan PS PP STho PW NE YB NY NW. Oversaw
the implementation, training, and site coordination: SK WS STho.
References
1. Egger M, May M, Chene G, Phillips AN, Ledergerber B, et al. (2002) Prognosis
of HIV-1-infected patients starting highly active antiretroviral therapy: a
collaborative analysis of prospective studies. Lancet 360: 119–129.
2. Thompson MA, Aberg JA, Cahn P, Montaner JS, Rizzardini G, et al. (2010)
Antiretroviral treatment of adult HIV infection: 2010 recommendations of the
International AIDS Society-USA panel. JAMA 304: 321–333.
3. ART-CC (2008) Life expectancy of individuals on combination antiretroviral
therapy in high-income countries: a collaborative analysis of 14 cohort studies.
Lancet 372: 293–299.
4. Panel on Antiretroviral Guidelines for Adults and Adolescents (2011). Guidelines
for the use of antiretroviral agents in HIV-1-infected adults and adolescents.
Washington (D.C.): Department of Health and Human Services. October 14,
2011. pp. 1–167.
5. World Health Organization (2013). Consolidated guidelines on the use of
antiretroviral drugs for treating and preventing HIV infection. Recommenda-
tions for a public health approach. June 2013. Geneva: WHO.
6. Koenig SP, Kuritzkes DR, Hirsch MS, Leandre F, Mukherjee JS, et al. (2006)
Monitoring HIV treatment in developing countries. BMJ 332: 602–604.
7. Kent DM, McGrath D, Ioannidis JP, Bennish ML (2003) Suitable monitoring
approaches to antiretroviral therapy in resource-poor settings: setting the
research agenda. Clin Infect Dis 37: S13–24.
8. Kumarasamy N, Flanigan TP, Mahajan AP, Carpenter CC, Mayer KH, et al.
(2002) Monitoring HIV treatment in the developing world. Lancet Infect Dis 2:
656–657.
9. Laurent C, Kouanfack C, Laborde-Balen G, Aghokeng AF, Mbougua JB, et al.
(2011) Monitoring of HIV viral loads, CD4 cell counts, and clinical assessments
versus clinical monitoring alone for antiretroviral therapy in rural district
hospitals in Cameroon (Stratall ANRS 12110/ESTHER): a randomised non-
inferiority trial. Lancet Infect Dis 11: 825–833.
10. Mermin J, Ekwaru JP, Were W, Degerman R, Bunnell R, et al. (2011) Utility of
routine viral load, CD4 cell count, and clinical monitoring among adults with
HIV receiving antiretroviral therapy in Uganda: randomised trial. BMJ 343:
d6792.
11. Mugyenyi P, Walker AS, Hakim J, Munderi P, Gibb DM, et al. (2010) Routine
versus clinically driven laboratory monitoring of HIV antiretroviral therapy in
Africa (DART): a randomised non-inferiority trial. Lancet 375: 123–131.
12. World Health Organization (2002) Scaling up antiretroviral therapy in resource-
limited settings. Guidelines for a public health approach. Geneva: World Health
Organization.
13. Division of AIDS table for grading the severity of adult and pediatric adverse
events Version 1.0, December, 2004; clarification August 2009. Available:
http://rsc.tech-res.com/Document/safetyandpharmacovigilance/Table_for_
CD4 Versus Viral Load HIV Switching Strategies
PLOS Medicine | www.plosmedicine.org 10 August 2013 | Volume 10 | Issue 8 | e1001494
Grading_Severity_of_Adult_Pediatric_Adverse_Events.pdf. Accessed 8 Febru-
ary 2012.
14. Jiang H, Deeks SG, Kuritzkes DR, Lallemant M, Katzenstein D, et al. (2003)
Assessing resistance costs of antiretroviral therapies via measures of future drug
options. J Infect Dis 188: 1001–1008.
15. Grabar S, Le Moing V, Goujard C, Leport C, Kazatchkine MD, et al. (2000)
Clinical outcome of patients with HIV-1 infection according to immunologic
and virologic response after 6 months of highly active antiretroviral therapy. Ann
Intern Med 133: 401–410.
16. Hogg RS, Yip B, Chan KJ, Wood E, Craib KJ, et al. (2001) Rates of disease
progression by baseline CD4 cell count and viral load after initiating triple-drug
therapy. JAMA 286: 2568–2577.
17. Junghans C, Low N, Chan P, Witschi A, Vernazza P, et al. (1999) Uniform risk
of clinical progression despite differences in utilization of highly active
antiretroviral therapy: Swiss HIV Cohort Study. AIDS 13: 2547–2554.
18. Sterling TR, Chaisson RE, Moore RD (2001) HIV-1 RNA, CD4 T-
lymphocytes, and clinical response to highly active antiretroviral therapy. AIDS
15: 2251–2257.
19. Saag M, Westfall A, Luhanga D, Mulenga P, Chi B, et al. (2012) A cluster
randomized trial of routine vs discretionary viral load monitoring among adults
starting ART: Zambia. Abstract 87. 19th Conference on Retroviruses and
Opportunistic Infections. Seattle (Washington), US.
20. Keiser O, Chi BH, Gsponer T, Boulle A, Orrell C, et al. (2011) Outcomes of
antiretroviral treatment in programmes with and without routine viral load
monitoring in Southern Africa. AIDS 25: 1761–1769.
21. Riddler SA, Jiang H, Tenorio A, Huang H, Kuritzkes DR, et al. (2007) A
randomized study of antiviral medication switch at lower- versus higher-switch
thresholds: AIDS Clinical Trials Group Study A5115. Antivir Ther 12: 531–541.
22. Tenorio AR, Jiang H, Zheng Y, Bastow B, Kuritzkes DR, et al. (2009) Delaying
a treatment switch in antiretroviral-treated HIV type 1-infected patients with
detectable drug-resistant viremia does not have a profound effect on immune
parameters: AIDS Clinical Trials Group Study A5115. AIDS Res Hum
Retroviruses 25: 135–139.
23. Zhang S, van Sighem A, Kesselring A, Gras L, Smit C, et al. (2012) Episodes of
HIV viremia and the risk of non-AIDS diseases in patients on suppressive
antiretroviral therapy. J Acquir Immune Defic Syndr 60: 265–272.
24. El-Sadr WM, Lundgren JD, Neaton JD, Gordin F, Abrams D, et al. (2006)
CD4+ count-guided interruption of antiretroviral treatment. N Engl J Med 355:
2283–2296.
25. Kuller LH, Tracy R, Belloso W, De Wit S, Drummond F, et al. (2008)
Inflammatory and coagulation biomarkers and mortality in patients with HIVinfection. PLoS Med 5: e203. doi:10.1371/journal.pmed.0050203
26. Keiser O, MacPhail P, Boulle A, Wood R, Schechter M, et al. (2009) Accuracy
of WHO CD4 cell count criteria for virological failure of antiretroviral therapy.Trop Med Int Health 14: 1220–1225.
27. Mee P, Fielding KL, Charalambous S, Churchyard GJ, Grant AD (2008)Evaluation of the WHO criteria for antiretroviral treatment failure among adults
in South Africa. AIDS 22: 1971–1977.
28. Rawizza HE, Chaplin B, Meloni ST, Eisen G, Rao T, et al. (2011) Immunologiccriteria are poor predictors of virologic outcome: implications for HIV treatment
monitoring in resource-limited settings. Clin Infect Dis 53: 1283–1290.29. Walensky RP, Ciaranello AL, Park JE, Freedberg KA (2010) Cost-effectiveness
of laboratory monitoring in sub-Saharan Africa: a review of the currentliterature. Clin Infect Dis 51: 85–92.
30. Medina Lara A, Kigozi J, Amurwon J, Muchabaiwa L, Nyanzi Wakaholi B, et
al. (2012) Cost effectiveness analysis of clinically driven versus routine laboratorymonitoring of antiretroviral therapy in Uganda and Zimbabwe. PLoS ONE 7:
e33672. doi:10.1371/journal.pone.003367231. Kahn JG, Marseille E, Moore D, Bunnell R, Were W, et al. (2011) CD4 cell
count and viral load monitoring in patients undergoing antiretroviral therapy in
Uganda: cost effectiveness study. BMJ 343: d6884.32. Braithwaite RS, Nucifora KA, Yiannoutsos CT, Musick B, Kimaiyo S, et al.
(2011) Alternative antiretroviral monitoring strategies for HIV-infected patientsin east Africa: opportunities to save more lives? J Int AIDS Soc 14: 38.
33. Cohen MS, Chen YQ, McCauley M, Gamble T, Hosseinipour MC, et al. (2011)Prevention of HIV-1 infection with early antiretroviral therapy. N Engl J Med
365: 493–505.
34. Kimmel AD, Weinstein MC, Anglaret X, Goldie SJ, Losina E, et al. (2010)Laboratory monitoring to guide switching antiretroviral therapy in resource-
limited settings: clinical benefits and cost-effectiveness. J Acquir Immune DeficSyndr 54: 258–268.
35. Phillips AN, Gilks C, Lundgren JD (2009) Cost-effectiveness of strategies for
monitoring the response to antiretroviral therapy in resource-limited settings.Arch Intern Med 169: 904; author reply 904–905.
36. Keiser O, Estill J, Egger M (2012) Viral load versus CD4 monitoring - impact onmortality, transmission and cost-effectiveness. MSF-UNITAID Co-Hosted
Satellite Event, XIX International AIDS Conference. Washington (District ofColumbia).
37. Murtagh M (2011) HIV/AIDS Diagnostic Landscape. UNITAID technical
report. Geneva: UNITAID.
CD4 Versus Viral Load HIV Switching Strategies
PLOS Medicine | www.plosmedicine.org 11 August 2013 | Volume 10 | Issue 8 | e1001494
Editors’ Summary
Background. About 34 million people (most of them livingin low-and middle-income countries) are currently infectedwith HIV, the virus that causes AIDS. HIV infection leads tothe destruction of immune system cells (including CD4 cells,a type of white blood cell), leaving infected individualssusceptible to other infections. Early in the AIDS epidemic,most HIV-infected individuals died within 10 years ofinfection. Then, in 1996, highly active antiretroviral therapy(HAART)—combined drugs regimens that suppress viralreplication and allow restoration of the immune system—became available. For people living in affluent countries,HIV/AIDS became a chronic condition but, because HAARTwas expensive, HIV/AIDS remained a fatal illness for peopleliving in resource-limited countries. In 2003, the internationalcommunity declared HIV/AIDS a global health emergencyand, in 2006, it set the target of achieving universal globalaccess to HAART by 2010. By the end of 2011, 8 million of theestimated 14.8 million people in need of HAART in low- andmiddle-income countries were receiving treatment.
Why Was This Study Done? At the time this trial wasconceived, national and international recommendationswere that HIV-positive individuals should start HAART whentheir CD4 count fell below 200 cells/mm3 and should havetheir CD4 count regularly monitored to optimize HAART. In2013, the World Health Organization (WHO) recommenda-tions were updated to promote expanded eligibility forHAART with a CD4 of 500 cells/mm3 or less for adults,adolescents, and older children although priority is given toindividuals with CD4 count of 350 cells/mm3 or less. BecauseHIV often becomes resistant to first-line antiretroviral drugs,WHO also recommends that viral load—the amount of virusin the blood—should be monitored so that suspectedtreatment failures can be confirmed and patients switched tosecond-line drugs in a timely manner. This monitoring andswitching strategy is widely used in resource-rich settings,but is still very difficult to implement for low- and middle-income countries where resources for monitoring are limitedand access to costly second-line drugs is restricted. In thisrandomized non-inferiority trial, the researchers compare theperformance of a CD4-based treatment monitoring andswitching strategy with the standard viral load-basedstrategy among HIV-positive adults in Thailand. In arandomized trial, individuals are assigned different interven-tions by the play of chance and followed up to compare theeffects of these interventions; a non-inferiority trial investi-gates whether one treatment is not worse than another.
What Did the Researchers Do and Find? The researchersassigned about 700 HIV-positive adults who were beginningHAART for the first time to have their CD4 count (CD4 arm)or their CD4 count and viral load (VL arm) determined every3 months. Participants were switched to a second-linetherapy if their CD4 count declined by more than 30% fromtheir peak CD4 count (CD4 arm) or if a viral load of more than400 copies/ml was recorded (VL arm). The 3-year cumulativerisk of clinical failure (defined as death, a new AIDS-definingevent, or a CD4 count of less than 50 cells/mm3) was 8% inthe VL arm and 7.4% in the CD4 arm. This difference inclinical failure risk met the researchers’ predefined criterionfor non-inferiority. The probability of a treatment switch wassimilar in the two arms, but the average time from treatment
initiation to treatment switch and the average duration of ahigh viral load after treatment switch were both longer inthe CD4 arm than in the VL arm. Finally, the future-drug-option score, a measure of viral drug resistance profiles, wassimilar in the two arms at the time of treatment switch.
What Do These Findings Mean? These findings suggestthat, in Thailand, a CD4 switching strategy is non-inferior interms of clinical outcomes among HIV-positive adults 3 yearsafter beginning HAART when compared to the recom-mended viral load-based switching strategy and that there isno difference between the strategies in terms of viralsuppression and immune restoration after 3-years follow-up. Importantly, however, even though patients in the CD4arm spent longer with a high viral load than patients in theVL arm, the emergence of HIV mutants resistant toantiretroviral drugs was similar in the two arms. Althoughthese findings provide no information about the long-termoutcomes of the two monitoring strategies and may not begeneralizable to routine care settings, they neverthelessprovide reassurance that using CD4 counts alone to monitorHAART in HIV treatment programs in resource-limitedsettings is an appropriate strategy to use as viral loadmeasurement becomes more affordable and feasible inthese settings.
Additional Information. Please access these websites viathe online version of this summary at http://dx.doi.org/10.1371/journal.pmed.1001494.
N The World Health Organization provides information on allaspects of HIV/AIDS (in several languages); its 2010recommendations for antiretroviral therapy for HIVinfection in adults and adolescents are available as wellas the June 2013 Consolidated guidelines on the use ofantiretroviral drugs for treating and preventing HIVinfection: recommendations for a public health approach
N The 2012 UNAIDS World AIDS Day Report provides up-to-date information about the AIDS epidemic and efforts tohalt it
N Information is available from the US National Institute ofAllergy and Infectious Diseases on HIV infection and AIDS
N NAM/aidsmap provides basic information about HIV/AIDSand summaries of recent research findings on HIV care andtreatment
N Information is available from Avert, an international AIDScharity on many aspects of HIV/AIDS, including informa-tion on the global HIV/AIDS epidemic, on HIV and AIDS inThailand, on universal access to AIDS treatment, and onstarting, monitoring and switching HIV treatment (inEnglish and Spanish)
N The UK National Health Service Choices website providesinformation (including personal stories) about HIV andAIDS
N More information about this trial (the PHPT-3 trial) isavailable
N Patient stories about living with HIV/AIDS are availablethrough Avert; the nonprofit website Healthtalkonline alsoprovides personal stories about living with HIV, includingstories about HIV treatment
CD4 Versus Viral Load HIV Switching Strategies
PLOS Medicine | www.plosmedicine.org 12 August 2013 | Volume 10 | Issue 8 | e1001494