svb: venture investing is less risky than you think
TRANSCRIPT
Venture Investing is Less Risky Than You Think: Managing Return Risk Through a Highly Selective and Well-Diversified Portfolio to Achieve Superior ResultsAugust 2010
VENTURE CAPITAL UPDATE 1
Looking at the performance of venture capital over the past ten years, it is reasonable to ask whether the returns justify the risk of investing. The purpose of this article is to better understand the downside of venture capital based on our belief that 2000 to 2002 were vintages with significant downside risk. In retrospect, funds formed during this time period represent one of the worst vintages in venture capital history due to numerous factors including the amount of capital that was raised and invested, the high level of valuations (with the NASDAQ peaking at over 5,000), the number of companies that were created, the impact of Sarbanes-Oxley on liquidity and the bust of the Internet and communications sector bubbles.
Venture Investing is Less Risky Than You Think:Managing Return Risk Through a Highly Selective and Well-Diversified Portfolio to Achieve Superior Results
Written by:
Aaron GershenbergManaging [email protected]
Sven WeberManaging [email protected]
Jason LiouSenior Associate, [email protected]
Venture capital firms have shown an ability to generate compelling returns when public markets are healthy, with median internal rates of return between 20 and 40 percent.1 While no one can accurately predict the range of venture capital returns in the coming years (similar questions were raised about the viability of venture capital in the mid- to late 1980s, several years before returns for the industry soared),2 we believe that pursuing a highly selective strategy with strong diversification provides for a much less risky portfolio than many believe. Sophisticated investors who take a long-term view of venture capital and can withstand its illiquid nature will benefit from investing across market cycles, the creation of new intellectual
Venture Capital UpdateAugust 2010
Cambridge Associates LLC, Dow Jones & Company, Inc., Standard & Poor’s, and Thomson Datastream.
For example, see Pollack, Andrew, “Venture Capital Loses Its Vigor,” New York Times, October 8, 1989.
1
2
View the Second Quarter 2010 U.S. Venture Capital Snapshot
Venture Capital Update
Venture Investing is Less Risky Than You Think: Managing Return Risk Through a Highly Selective and Well-Diversified Portfolio to Achieve Superior ResultsAugust 2010
VENTURE CAPITAL UPDATE 2
property, business models, rapidly growing companies and markets. Over the past few years, the environment for venture investing has improved with fewer funds raised (we predict as many as half of the firms from a few years ago will go out of business) and a greater diversity of investment opportunities by sector, stage and geography. With the downside reasonably protected, venture capital’s most significant challenges are when IPO and merger and acquisition markets return to health.
In this article, we examine our experience of raising and investing a fund of funds between 2000 and 2002. Through a bottoms-up analysis of our portfolio, we look at the traction of our underlying investments and apply statistical simulation to develop an estimate of the fund’s ultimate return to investors. We share the benefits achieved from diversification by stage, sector, geography and time and our observations from investing during this period. In addition, we identify structural aspects of venture capital that provide downside protection, such as the use of preferred shares and other financing terms at the portfolio company level. Overall, our model indicates that our vintage year 2000 to 2002 fund of funds3 portfolio will
not only return capital, it will generate a positive return for our investors. This would indicate that, even during unhealthy markets, venture is much less risky than many believe.
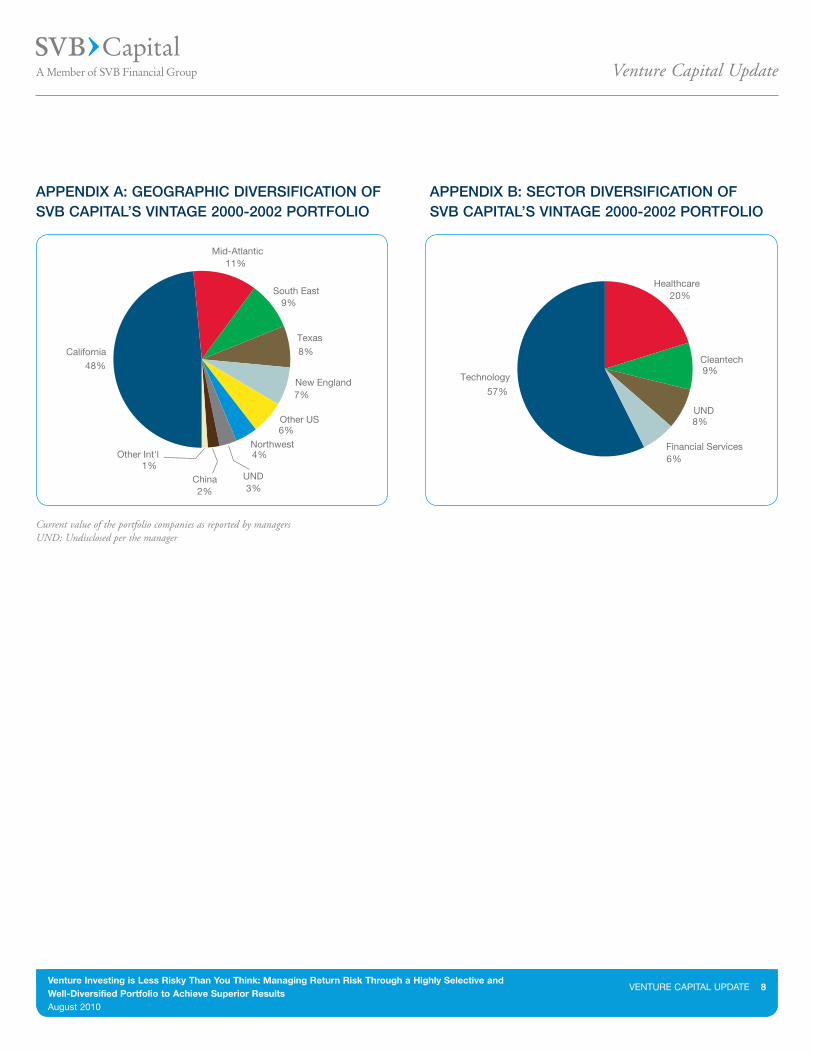
An AnAlysis of sVB CApitAl’s VintAge 2000 to 2002 Venture fund of funds portfolioBetween 2000 and 2002, SVB Capital committed nearly $110 million to 24 brand-name, regional and niche venture capital funds. Approximately 80 percent of the fund was placed with brand-name managers and 20 percent with regional/niche managers. Technology companies account for 57 percent of the portfolio’s value, while healthcare-focused firms are 20 percent and clean-tech companies account for 9 percent (for further detail, please see Appendix A and B).
Currently, half of the underlying funds have fully called our committed capital, while only two funds remain less than 80 percent called. Of the approximately 850 companies that received investments from the underlying funds, more than half are still active, and a good portion are nearing liquidity. Several of the top performing funds have made significant distributions back to investors, though a few have performed significantly worse than the portfolio median.
Nearly a decade later we now have much greater visibility into the risk profile and performance potential of each fund’s underlying companies. We are pleased to note that our portfolio has recovered from a deep below par J-curve. At one point in time the portfolio was valued at 60 cents on the dollar. Today it is back to par with total value equal to paid in capital. Approximately half of the funds currently have a TVPI ratio4 greater than 1x the capital paid in by investors, while only 10 of 24 funds are currently performing below 1x. Currently the portfolio has returned more than half of paid in capital and has a positive IRR.
Methods of AnalysisOur analysis of SVB Capital’s vintage 2000-2002 venture fund portfolio began at the company and fund level. We made what we believe are realistic assumptions on exits based on revenue, profitability and growth. Our working hypothesis was that the portfolio companies will face normal market conditions over time, and venture capital firms would be able to sufficiently support them through the recycling of capital. We also assumed that the multiples that exist in today’s exit market will prevail over the next five to 10 years.
See Appendix D for a definition of this and other key terms.
TVPI (or total-value-to-paid-in) is the ratio of sum of the fund’s total value and distributions to date to the amount of capital that was paid into the fund. DPI (or distributed-to-paid-in) is the sum of distributions received by investors to date relative to the total capital drawn from investors. At the end of a fund’s life, the DPI ratio is equivalent to the fund’s TVPI ratio as all portfolio companies have exited from the portfolio, leaving a net asset value of zero.
3
4
Venture Capital Update
Venture Investing is Less Risky Than You Think: Managing Return Risk Through a Highly Selective and Well-Diversified Portfolio to Achieve Superior ResultsAugust 2010
VENTURE CAPITAL UPDATE 3
We forecast a range of potential realized values for each active portfolio company. We incorporated data parameters (provided by SVB Analytics, SVB’s dedicated valuation team) which corresponded to each firm’s industry sector and growth stage to generate Monte Carlo distribution curves that were more specific to each company’s background.5 Once we had determined estimates of each company’s realized values, we calculated the total expected realized value for each fund and conducted further simulations to forecast the final DPI ratio of the fund of funds.
However, predicting the time to liquidity with accuracy is extremely challenging given the lack of visibility into future public and M&A markets, so we did not model the timeline in which capital would be returned to investors, nor did we forecast a final IRR for the portfolio. Results from Our Projections6
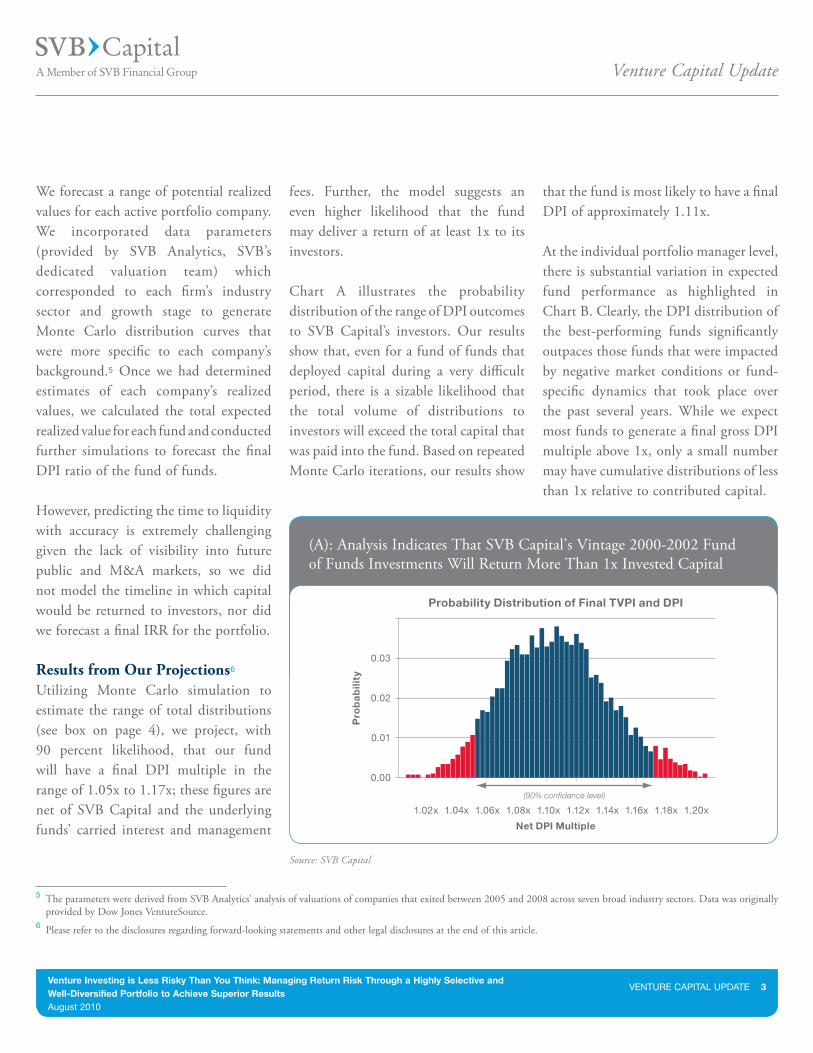
Utilizing Monte Carlo simulation to estimate the range of total distributions (see box on page 4), we project, with 90 percent likelihood, that our fund will have a final DPI multiple in the range of 1.05x to 1.17x; these figures are net of SVB Capital and the underlying funds’ carried interest and management
Source: SVB Capital
(A): Analysis Indicates That SVB Capital’s Vintage 2000-2002 Fund of Funds Investments Will Return More Than 1x Invested Capital
fees. Further, the model suggests an even higher likelihood that the fund may deliver a return of at least 1x to its investors.
Chart A illustrates the probability distribution of the range of DPI outcomes to SVB Capital’s investors. Our results show that, even for a fund of funds that deployed capital during a very difficult period, there is a sizable likelihood that the total volume of distributions to investors will exceed the total capital that was paid into the fund. Based on repeated Monte Carlo iterations, our results show
that the fund is most likely to have a final DPI of approximately 1.11x.
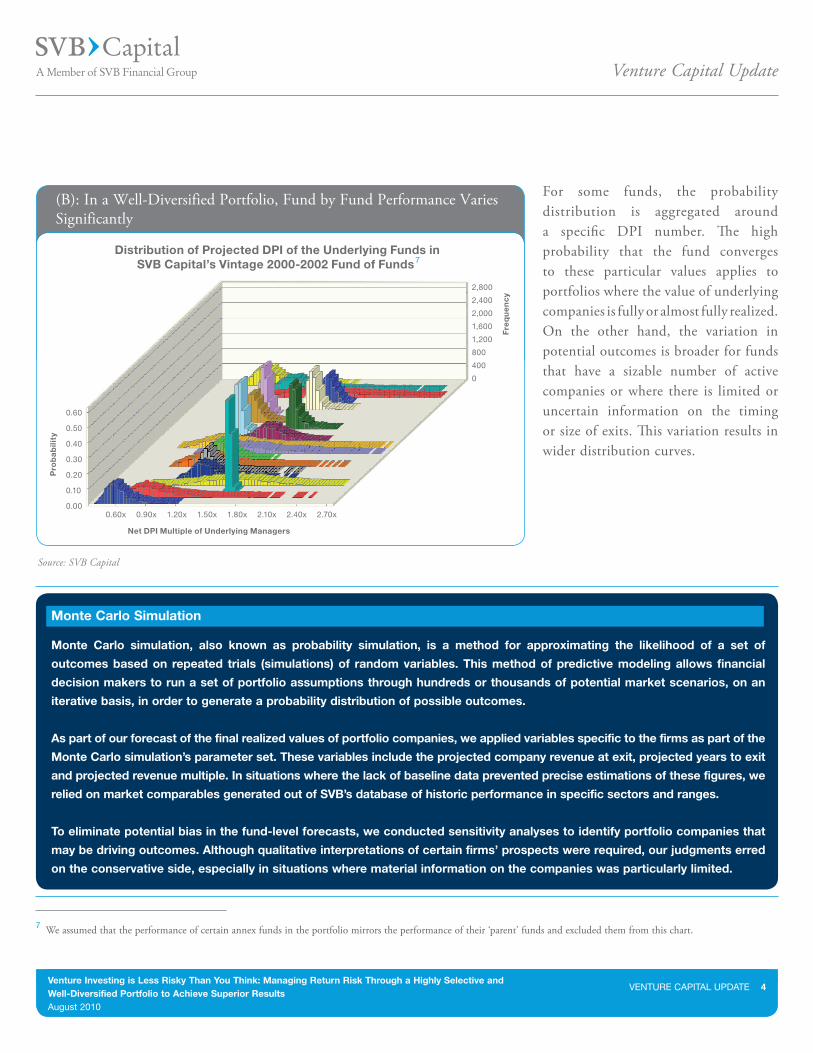
At the individual portfolio manager level, there is substantial variation in expected fund performance as highlighted in Chart B. Clearly, the DPI distribution of the best-performing funds significantly outpaces those funds that were impacted by negative market conditions or fund-specific dynamics that took place over the past several years. While we expect most funds to generate a final gross DPI multiple above 1x, only a small number may have cumulative distributions of less than 1x relative to contributed capital.
The parameters were derived from SVB Analytics’ analysis of valuations of companies that exited between 2005 and 2008 across seven broad industry sectors. Data was originally provided by Dow Jones VentureSource.
Please refer to the disclosures regarding forward-looking statements and other legal disclosures at the end of this article.
5
6
1.04x1.02x 1.06x 1.08x 1.10x
(90% confidence level)
1.12x 1.14x 1.16x 1.18x 1.20x
Pro
ba
bili
ty
Probability Distribution of Final TVPI and DPI
0.03
0.02
0.01
0.00
Net DPI Multiple
Venture Capital Update
Venture Investing is Less Risky Than You Think: Managing Return Risk Through a Highly Selective and Well-Diversified Portfolio to Achieve Superior ResultsAugust 2010
VENTURE CAPITAL UPDATE 4
For some funds, the probability distribution is aggregated around a specific DPI number. The high probability that the fund converges to these particular values applies to portfolios where the value of underlying companies is fully or almost fully realized. On the other hand, the variation in potential outcomes is broader for funds that have a sizable number of active companies or where there is limited or uncertain information on the timing or size of exits. This variation results in wider distribution curves.
Source: SVB Capital
(B): In a Well-Diversified Portfolio, Fund by Fund Performance Varies Significantly
2,800
2,400
2,000
1,600
1,200
800
400
0
0.60
0.50
0.40
0.30
0.20
0.10
0.00
Pro
ba
bili
ty
Net DPI Multiple of Underlying Managers
0.60x 0.90x 1.20x 1.50x 1.80x 2.10x 2.40x 2.70xF
req
ue
nc
y
Distribution of Projected DPI of the Underlying Funds inSVB Capital’s Vintage 2000-2002 Fund of Funds
Monte Carlo simulation, also known as probability simulation, is a method for approximating the likelihood of a set of
outcomes based on repeated trials (simulations) of random variables. This method of predictive modeling allows financial
decision makers to run a set of portfolio assumptions through hundreds or thousands of potential market scenarios, on an
iterative basis, in order to generate a probability distribution of possible outcomes.
As part of our forecast of the final realized values of portfolio companies, we applied variables specific to the firms as part of the
Monte Carlo simulation’s parameter set. These variables include the projected company revenue at exit, projected years to exit
and projected revenue multiple. In situations where the lack of baseline data prevented precise estimations of these figures, we
relied on market comparables generated out of SVB’s database of historic performance in specific sectors and ranges.
To eliminate potential bias in the fund-level forecasts, we conducted sensitivity analyses to identify portfolio companies that
may be driving outcomes. Although qualitative interpretations of certain firms’ prospects were required, our judgments erred
on the conservative side, especially in situations where material information on the companies was particularly limited.
Monte Carlo Simulation
7
We assumed that the performance of certain annex funds in the portfolio mirrors the performance of their ‘parent’ funds and excluded them from this chart.7
Venture Capital Update
Venture Investing is Less Risky Than You Think: Managing Return Risk Through a Highly Selective and Well-Diversified Portfolio to Achieve Superior ResultsAugust 2010
VENTURE CAPITAL UPDATE 5
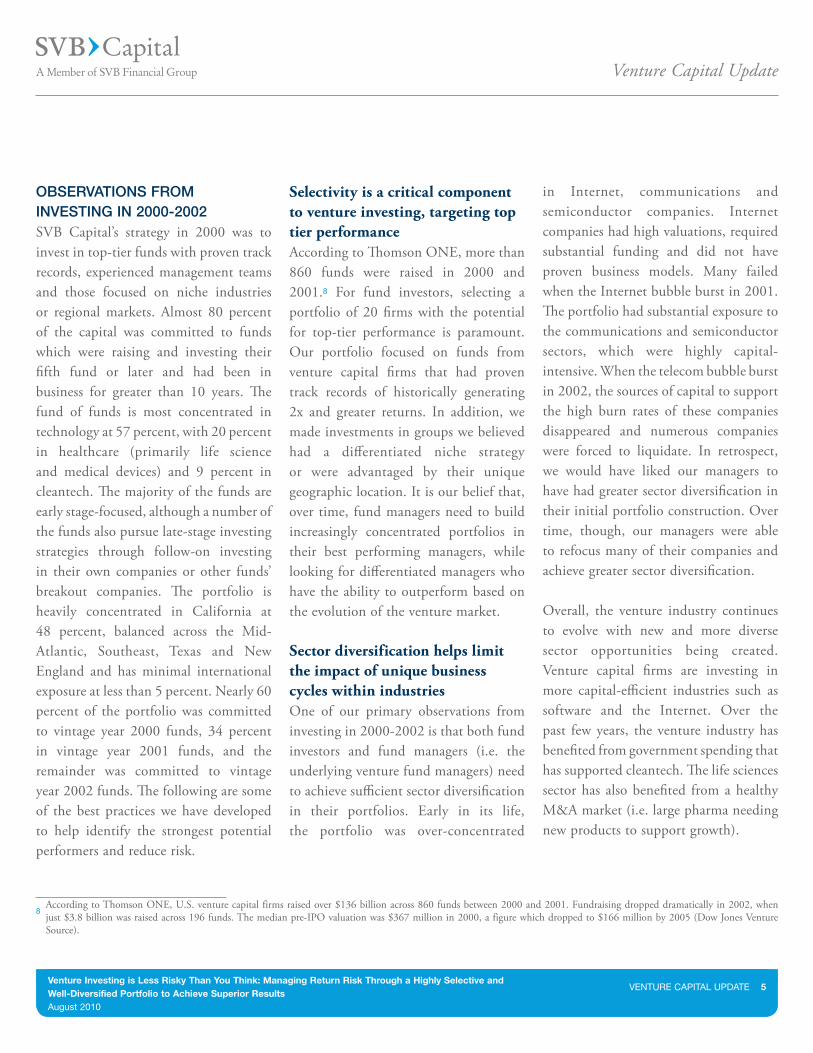
oBserVAtions from inVesting in 2000-2002SVB Capital’s strategy in 2000 was to invest in top-tier funds with proven track records, experienced management teams and those focused on niche industries or regional markets. Almost 80 percent of the capital was committed to funds which were raising and investing their fifth fund or later and had been in business for greater than 10 years. The fund of funds is most concentrated in technology at 57 percent, with 20 percent in healthcare (primarily life science and medical devices) and 9 percent in cleantech. The majority of the funds are early stage-focused, although a number of the funds also pursue late-stage investing strategies through follow-on investing in their own companies or other funds’ breakout companies. The portfolio is heavily concentrated in California at 48 percent, balanced across the Mid-Atlantic, Southeast, Texas and New England and has minimal international exposure at less than 5 percent. Nearly 60 percent of the portfolio was committed to vintage year 2000 funds, 34 percent in vintage year 2001 funds, and the remainder was committed to vintage year 2002 funds. The following are some of the best practices we have developed to help identify the strongest potential performers and reduce risk.
Selectivity is a critical component to venture investing, targeting top tier performanceAccording to Thomson ONE, more than 860 funds were raised in 2000 and 2001.8 For fund investors, selecting a portfolio of 20 firms with the potential for top-tier performance is paramount. Our portfolio focused on funds from venture capital firms that had proven track records of historically generating 2x and greater returns. In addition, we made investments in groups we believed had a differentiated niche strategy or were advantaged by their unique geographic location. It is our belief that, over time, fund managers need to build increasingly concentrated portfolios in their best performing managers, while looking for differentiated managers who have the ability to outperform based on the evolution of the venture market.
Sector diversification helps limit the impact of unique business cycles within industriesOne of our primary observations from investing in 2000-2002 is that both fund investors and fund managers (i.e. the underlying venture fund managers) need to achieve sufficient sector diversification in their portfolios. Early in its life, the portfolio was over-concentrated
in Internet, communications and semiconductor companies. Internet companies had high valuations, required substantial funding and did not have proven business models. Many failed when the Internet bubble burst in 2001. The portfolio had substantial exposure to the communications and semiconductor sectors, which were highly capital-intensive. When the telecom bubble burst in 2002, the sources of capital to support the high burn rates of these companies disappeared and numerous companies were forced to liquidate. In retrospect, we would have liked our managers to have had greater sector diversification in their initial portfolio construction. Over time, though, our managers were able to refocus many of their companies and achieve greater sector diversification.
Overall, the venture industry continues to evolve with new and more diverse sector opportunities being created. Venture capital firms are investing in more capital-efficient industries such as software and the Internet. Over the past few years, the venture industry has benefited from government spending that has supported cleantech. The life sciences sector has also benefited from a healthy M&A market (i.e. large pharma needing new products to support growth).
According to Thomson ONE, U.S. venture capital firms raised over $136 billion across 860 funds between 2000 and 2001. Fundraising dropped dramatically in 2002, when just $3.8 billion was raised across 196 funds. The median pre-IPO valuation was $367 million in 2000, a figure which dropped to $166 million by 2005 (Dow Jones Venture Source).
8
Venture Capital Update
Venture Investing is Less Risky Than You Think: Managing Return Risk Through a Highly Selective and Well-Diversified Portfolio to Achieve Superior ResultsAugust 2010
VENTURE CAPITAL UPDATE 6
India and China. These rapidly growing economies have created new markets for venture backed companies as well as new investment opportunities. Our funds have benefited from increased international exposure over time, and we believe it is important for investors to have exposure in these markets.
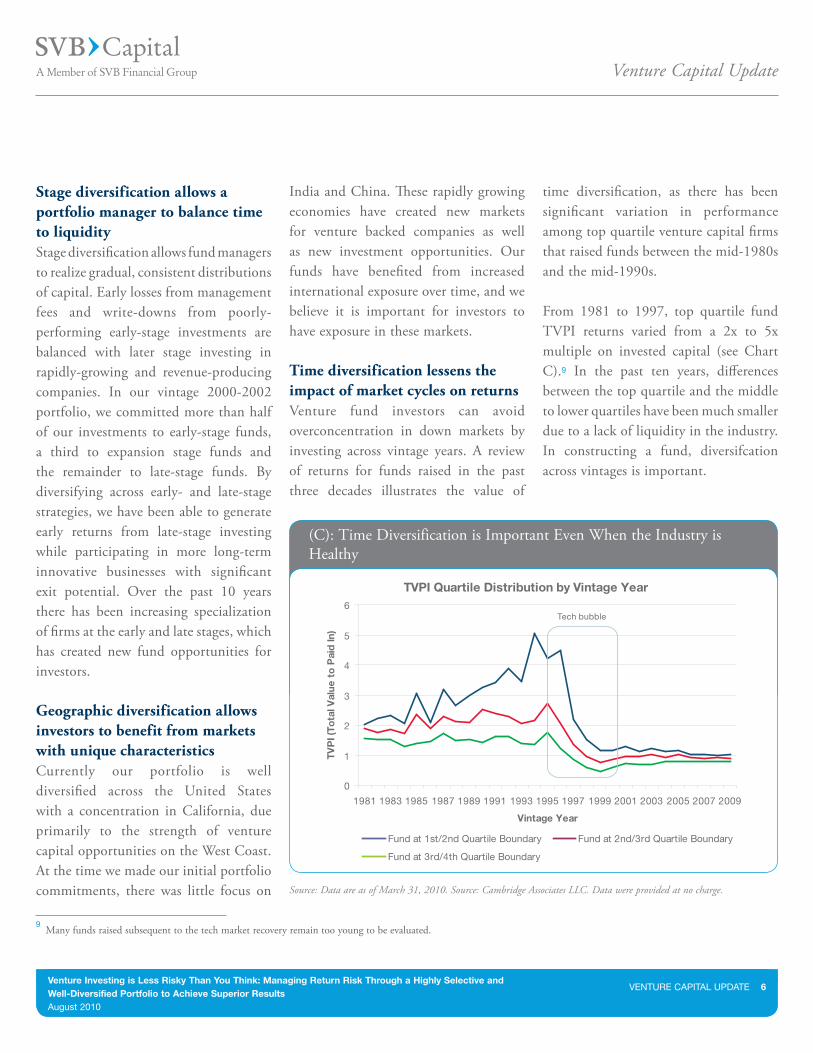
Time diversification lessens the impact of market cycles on returns Venture fund investors can avoid overconcentration in down markets by investing across vintage years. A review of returns for funds raised in the past three decades illustrates the value of
time diversification, as there has been significant variation in performance among top quartile venture capital firms that raised funds between the mid-1980s and the mid-1990s. From 1981 to 1997, top quartile fund TVPI returns varied from a 2x to 5x multiple on invested capital (see Chart C).9 In the past ten years, differences between the top quartile and the middle to lower quartiles have been much smaller due to a lack of liquidity in the industry. In constructing a fund, diversifcation across vintages is important.
Stage diversification allows a portfolio manager to balance time to liquidityStage diversification allows fund managers to realize gradual, consistent distributions of capital. Early losses from management fees and write-downs from poorly-performing early-stage investments are balanced with later stage investing in rapidly-growing and revenue-producing companies. In our vintage 2000-2002 portfolio, we committed more than half of our investments to early-stage funds, a third to expansion stage funds and the remainder to late-stage funds. By diversifying across early- and late-stage strategies, we have been able to generate early returns from late-stage investing while participating in more long-term innovative businesses with significant exit potential. Over the past 10 years there has been increasing specialization of firms at the early and late stages, which has created new fund opportunities for investors.
Geographic diversification allows investors to benefit from markets with unique characteristicsCurrently our portfolio is well diversified across the United States with a concentration in California, due primarily to the strength of venture capital opportunities on the West Coast. At the time we made our initial portfolio commitments, there was little focus on Source: Data are as of March 31, 2010. Source: Cambridge Associates LLC. Data were provided at no charge.
(C): Time Diversification is Important Even When the Industry is Healthy
TVPI Quartile Distribution by Vintage Year
0
1
2
3
4
5
6
1981 1983 1985 1987 1989 1991 1993 1995
Tech bubble
1997 1999 2001 2003 2005 2007 2009
Vintage Year
TVP
I (To
tal V
alue
to
Pai
d In
)
Fund at 1st/2nd Quartile Boundary Fund at 2nd/3rd Quartile Boundary
Fund at 3rd/4th Quartile Boundary
Many funds raised subsequent to the tech market recovery remain too young to be evaluated.9
Venture Capital Update
Venture Investing is Less Risky Than You Think: Managing Return Risk Through a Highly Selective and Well-Diversified Portfolio to Achieve Superior ResultsAugust 2010
VENTURE CAPITAL UPDATE 7
unique struCturAl AspeCts of Venture CApitAlThere are tangible and intangible aspects of venture capital that reduce risk and create economic value unique to the industry. Beginning at the portfolio company financing level, venture capital firms can use preferred shares and term sheet provisions such as liquidation preference to provide downside protection to investors.10 In Appendix C, we describe a model portfolio that illustrates the conditions that determine the relative return on capital that investors in different investing rounds receive upon a company’s exit.
As an industry, venture capital is highly differentiated from other forms of private equity on a risk return basis. Venture capital investors typically focus on the creation of intellectual property, which builds long-term value. Venture capitalists work side by side with entrepreneurs over the long term (usually five to ten years) to help their companies grow through challenging times. Venture capital firms also bring significant value to their portfolio companies by helping them with strategy development, capital
raising, marketing and team recruitment. These complement the “sweat equity” that entrepreneurs, service providers and law firms also commit to help innovative companies succeed. Risk of failure is further managed through the syndication of rounds to ensure the best possible boards and sufficient capital for follow-on rounds if needed. Combined, these aspects contribute to positive returns for investors, with the potential for superior performance.
return risk CAn Be reduCed through seleCtiVity And diVersifiCAtion At this point in time, the analysis of SVB Capital’s 2000-2002 venture fund portfolio indicates a high probability of a positive return on capital. Characteristic of this fund was a highly selective investment strategy with strong diversification. Today we are observing that our underlying managers are continuing to build value. Consistent with market data on the median time to liquidity now nearing 10 years,11 we see that an increasing number of our companies are now in the IPO queue. Over the past several quarters,
our portfolio has participated in several IPOs, including Calix Networks and Fortinet. Several of the funds’ underlying companies have been merged or acquired (such as Data Domain and Pure Digital) at significant multiples of invested capital. With the recent increase of liquidity, several other companies in the portfolio are in registration to go public and look promising to generate sizable returns in the near term.
The ability to mitigate venture capital’s downside, while creating an opportunity to participate in superior returns, is critical and provides compelling reasons for sophisticated investors to allocate capital to venture. Selectivity is crucial, as is building a well-diversified portfolio across stage, sector, geography and time. Given venture capital’s long-term nature, investors and fund managers must have the resources and “staying power” to weather economic cycles and participate in returns as exit markets improve. For sophisticated investors looking to achieve outperformance, venture is a critical component of an investment portfolio.
See, for example, the return investors received from the recent sale of Slide to Google (via Fred Wilson of Union Square Ventures): www.avc.com/a_vc/2010/08/heres-why-you-need-a-liquidation-preference.html
The median time from initial equity funding to IPO has increased from 3.1 years in 2000 to 9.4 years in the first half of 2010, according to Dow Jones VentureSource.
10
11
Venture Capital Update
Venture Investing is Less Risky Than You Think: Managing Return Risk Through a Highly Selective and Well-Diversified Portfolio to Achieve Superior ResultsAugust 2010
VENTURE CAPITAL UPDATE 8
Appendix A: geogrAphiC diVersifiCAtion ofsVB CApitAl’s VintAge 2000-2002 portfolio
Current value of the portfolio companies as reported by managersUND: Undisclosed per the manager
48%
11%
9%
8%
7%
6%
4%
3%2%
1%
California
Mid-Atlantic
South East
Texas
New England
Other US
Northwest
UNDChina
Other Int'l
Appendix B: seCtor diVersifiCAtion ofsVB CApitAl’s VintAge 2000-2002 portfolio
57%
20%
9%
8%
6%
Technology
Healthcare
Cleantech
UND
Financial Services
Venture Capital Update
Venture Investing is Less Risky Than You Think: Managing Return Risk Through a Highly Selective and Well-Diversified Portfolio to Achieve Superior ResultsAugust 2010
VENTURE CAPITAL UPDATE 9
Appendix C: A model of how preferred shAres And liquidAtion preferenCe ContriBute to proteCting Venture CApitAl’s inVestors
These assumptions were provided by SVB Analytics based on an analysis of 107 rounds of equity investment that closed between January 2009 and June 2010 in the software and services sector.We assumed that the Series A through Series D investors each had a 1x liquidation preference, and that the shares all investors in each series sell represented a 1 percent ownership of the company on a fully-diluted basis.This is a function of both the value of the Series D investors’ fully-diluted ownership in the round and the amount that was invested in that round.
12
13
14
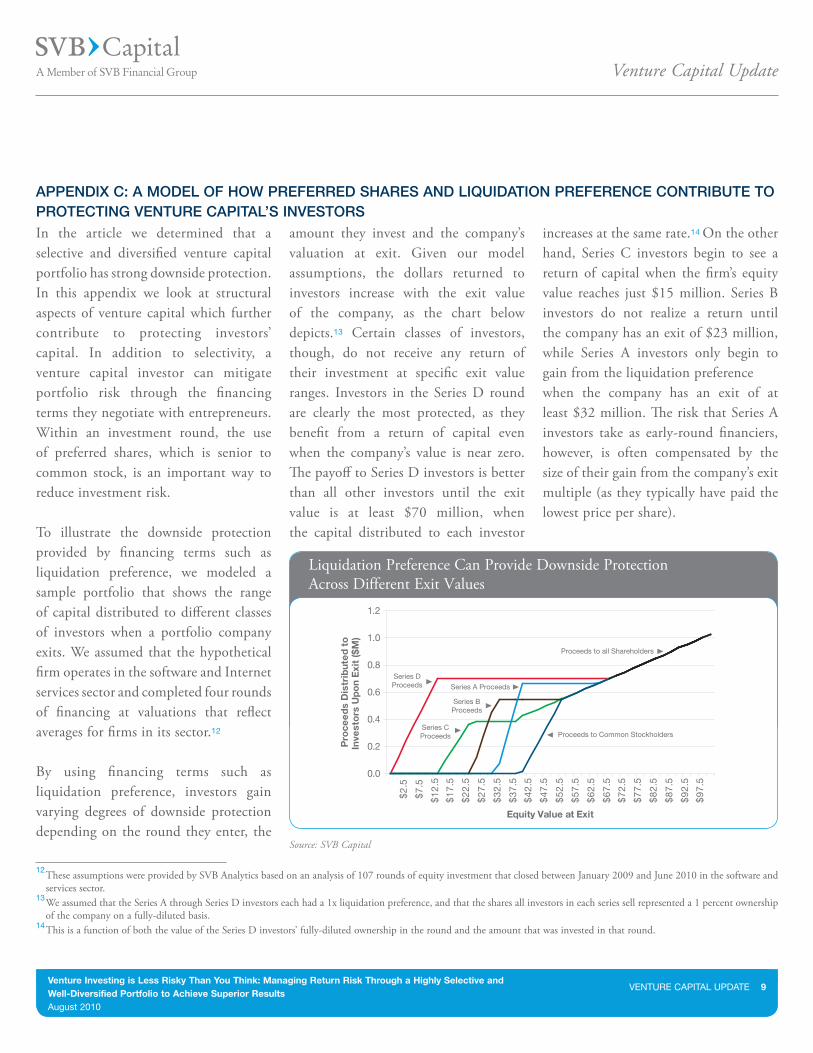
amount they invest and the company’s valuation at exit. Given our model assumptions, the dollars returned to investors increase with the exit value of the company, as the chart below depicts.13 Certain classes of investors, though, do not receive any return of their investment at specific exit value ranges. Investors in the Series D round are clearly the most protected, as they benefit from a return of capital even when the company’s value is near zero. The payoff to Series D investors is better than all other investors until the exit value is at least $70 million, when the capital distributed to each investor
increases at the same rate.14 On the other hand, Series C investors begin to see a return of capital when the firm’s equity value reaches just $15 million. Series B investors do not realize a return until the company has an exit of $23 million, while Series A investors only begin to gain from the liquidation preferencewhen the company has an exit of at least $32 million. The risk that Series A investors take as early-round financiers, however, is often compensated by the size of their gain from the company’s exit multiple (as they typically have paid the lowest price per share).
Liquidation Preference Can Provide Downside Protection Across Different Exit Values
0.0
0.2
0.4
0.6
0.8
1.0
1.2
Equity Value at Exit
$2
.5
$7
.5
$1
2.5
$1
7.5
$2
2.5
$2
7.5
$3
2.5
$3
7.5
$4
2.5
$4
7.5
$5
2.5
$5
7.5
$6
2.5
$6
7.5
$7
2.5
$7
7.5
$8
2.5
$8
7.5
$9
2.5
$9
7.5
Pro
ceed
s D
istr
ibut
ed t
oIn
vest
ors
Up
on
Exi
t ($
M)
Proceeds to all Shareholders
Series DProceeds
Series CProceeds
Series BProceeds
Series A Proceeds
Proceeds to Common Stockholders
In the article we determined that a selective and diversified venture capital portfolio has strong downside protection. In this appendix we look at structural aspects of venture capital which further contribute to protecting investors’ capital. In addition to selectivity, a venture capital investor can mitigate portfolio risk through the financing terms they negotiate with entrepreneurs. Within an investment round, the use of preferred shares, which is senior to common stock, is an important way to reduce investment risk.
To illustrate the downside protection provided by financing terms such as liquidation preference, we modeled a sample portfolio that shows the range of capital distributed to different classes of investors when a portfolio company exits. We assumed that the hypothetical firm operates in the software and Internet services sector and completed four rounds of financing at valuations that reflect averages for firms in its sector.12
By using financing terms such as liquidation preference, investors gain varying degrees of downside protection depending on the round they enter, the
Source: SVB Capital
Venture Capital Update
Venture Investing is Less Risky Than You Think: Managing Return Risk Through a Highly Selective and Well-Diversified Portfolio to Achieve Superior ResultsAugust 2010
VENTURE CAPITAL UPDATE 10
In a financing term sheet, the liquidation preference is the multiple of the investment amount that an investor in a given round receives in the event of a company liquidation or sale. Venture capital investors typically own preferred stock, which is senior to the common stock that founders typically own. Employees of a company usually receive either common stock or options to purchase common stock.
When a company exits by merger or acquisition, an investor has the option of either receiving their liquidation preference or converting their preferred shares into common stock and receiving their percentage ownership as their return. In the case of an IPO, preferred stock is generally converted to common stock and the liquidation preference is not applicable.
Liquidation preference is the most common financing term in a venture investment, with the majority of contracts having a preference multiple of 1x. Liquidation preferences of greater than 1x have become less common over the last several quarters, especially for early round investments. In Q1 of 2010, approximately 90 percent of Series A deals had a liquidation preference of 1x or less, while the remainder had a preference of between 1 and 2x.15 In the above-mentioned dataset provided by SVB Analytics, 86 percent of 107 financing rounds in the software and services sector had a 1x liquidation preference, while the remainder had a preference of greater than 1x.
Another feature of liquidation preference is known as participation. In a participating liquidation preference, VCs receive their preference as well as a pro rata share of the remaining common stock of the company. In our model portfolio, we did not include any assumptions on participation or other financing structures such as anti-dilution protection provisions.
Liquidation Preferences in Venture Capital
Venture Financing Report, May 2010,” Cooley LLP.15
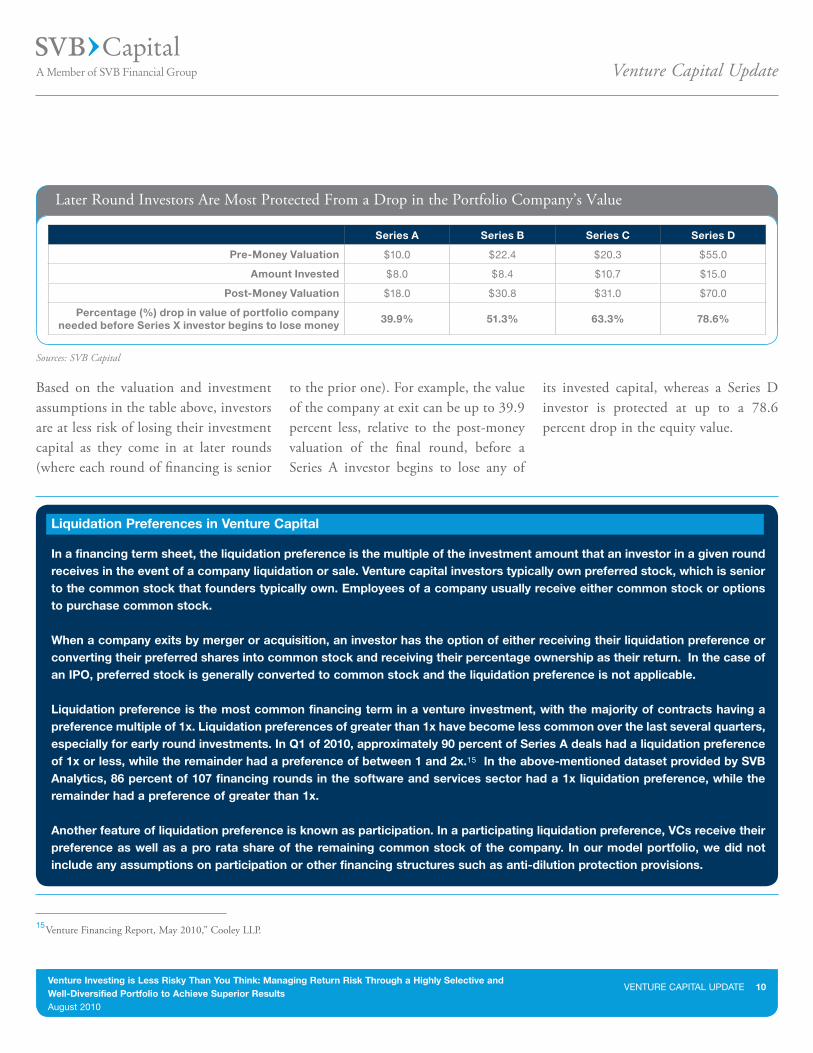
Later Round Investors Are Most Protected From a Drop in the Portfolio Company’s Value
Series A Series B Series C Series D
Pre-Money Valuation $10.0 $22.4 $20.3 $55.0
Amount Invested $8.0 $8.4 $10.7 $15.0
Post-Money Valuation $18.0 $30.8 $31.0 $70.0
Percentage (%) drop in value of portfolio company needed before Series X investor begins to lose money
39.9% 51.3% 63.3% 78.6%
Based on the valuation and investment assumptions in the table above, investors are at less risk of losing their investment capital as they come in at later rounds (where each round of financing is senior
to the prior one). For example, the value of the company at exit can be up to 39.9 percent less, relative to the post-money valuation of the final round, before a Series A investor begins to lose any of
its invested capital, whereas a Series D investor is protected at up to a 78.6 percent drop in the equity value.
Sources: SVB Capital
Venture Capital Update
Venture Investing is Less Risky Than You Think: Managing Return Risk Through a Highly Selective and Well-Diversified Portfolio to Achieve Superior ResultsAugust 2010
VENTURE CAPITAL UPDATE 11
Common Stock16
Common stock is the basic equity interest in a company. It is typically the type of stock held by founders and employees.
J-CurveThe curve of value creation exhibited by a venture capital fund’s returns across its lifetime, where strongly negative returns in the early years of the fund (from management fees and as the fund draws down capital) reverse as distributions to investors increase in later years.
Liquidation PreferenceSee explanation in box on page 10.
Preferred Stock17 Preferred stock has various “preferences” over common stock. These preferences can include liquidation preferences,
dividend rights, redemption rights, conversion rights and voting rights. Venture capitalists and other investors in private companies typically receive preferred stock for their investment.
“Series” of Preferred Stock18 When a company raises venture capital in a preferred stock financing, it typically designates the shares of preferred stock sold in that financing with a letter. The shares sold in the first financing are usually designated “Series A”, the second “Series B”, the third “Series C” and so forth. Shares of the same series all have the same rights, but shares of different series can have very different rights.
DPI (Distributions to Paid In)A ratio of the amount distributed by a fund to the money paid in to date. This
realization ratio is not very meaningful in the early stages of a fund’s life due to the J-curve effect.
TVPI (Total Value to Paid In)A ratio of the sum of the current value of a fund’s remaining investments (or net asset value) and the total value of distributions to date divided by the total money paid into the fund to date.
Venture Capital Fund of FundsA fund which invests in a selection of venture capital funds that, in turn, invests directly into companies. Funds of funds may also participate in the secondary market and in co-investments.
Appendix d: glossAry of key terms
As defined by Fenwick & West LLPAs defined by Fenwick & West LLPAs defined by Fenwick & West LLP
16
17
18
pleAse tAke our two-minute surVeySVB Capital welcomes questions and comments you may have about how to manage risk when investing in venture capital. If you’d like to participate in a survey on this topic, Please click here (or go to http://questionpro.com/t/Ajp2ZIGWl). All comments will be kept confidential, and we will be happy to send you a summary of the results after the survey closes on October 1, 2010.
tell us whAt you thinkSend your comments and suggestions for topics to Jason Liou [email protected].
Venture Capital Update
Venture Investing is Less Risky Than You Think: Managing Return Risk Through a Highly Selective and Well-Diversified Portfolio to Achieve Superior ResultsAugust 2010
VENTURE CAPITAL UPDATE 12
About SVB Capital
Founded in 2000, SVB Capital manages more than $1.4 billion of committed capital through its seven funds of funds and four direct investment funds. We also leverage SVB’s portfolio of more than 350 venture capital and private equity investments, a portfolio that originated in 1995. Our funds included diversified, worldwide venture capital and growth funds of funds and direct investment funds based out of the United States, India and China. Each fund has a differentiated, clearly defined strategy, with allocations for both primary and secondary investments. SVB Capital is a non-bank member of SVB Financial Group. Products and services offered by SVB Capital are not insured by the FDIC or any other Federal Government Agency and are not guaranteed by Silicon Valley Bank or its affiliates.
About SVB Analytics
SVB Analytics offers valuations and corporate equity administration to SVB Financial Group’s constituencies of private, venture capital-backed companies and venture capital firms. SVB Analytics is a non-bank affiliate of Silicon Valley Bank. EProsper is a majority-owned subsidiary of SVB Analytics and a non-bank affiliate of Silicon Valley Bank. Products and services offered by SVB Analytics and eProsper are not insured by the FDIC or any other Federal Government Agency and are not guaranteed by Silicon Valley Bank or its affiliates.
Venture Capital Update
Venture Investing is Less Risky Than You Think: Managing Return Risk Through a Highly Selective and Well-Diversified Portfolio to Achieve Superior ResultsAugust 2010
VENTURE CAPITAL UPDATE 13
legAl disClosures This Venture Capital Update includes forward-looking statements including but not limited to, future portfolio performance. Forward-looking statements are statements that are neither historical facts, nor guarantees of future performance and are subject to risks, uncertainties and other factors, some of which are difficult to predict and/or beyond the control of SVB Capital, SVB Financial Group, and their affiliates. Although the information set forth herein has been provided in good faith and based upon a reasonable belief in accuracy and we believe that the expectations reflected in these forward-looking statements are correct, actual results and financial performance could differ significantly from those expressed in or implied by such forward-looking statements.
This Venture Capital Update is for informational purposes only and is not a solicitation or recommendation that any particular investor should invest in any particular industry, security, or fund. Nothing relating to the material should be construed as a solicitation, offer or recommendation to acquire or dispose of any investment or to engage in any other transaction. The information contained in this Venture Capital Update should not be viewed as tax, investment, legal or other advice nor is it to be relied on in making an investment or other decision. You should obtain relevant and specific professional advice before making any investment decision.
This material, including without limitation, the statistical information herein, is provided for informational purposes only. The material is based in part on information from third-party sources that we believe to be reliable, but which have not been independently verified by us and for this reason we do not represent that the information is accurate or complete.
Venture Capital Update
Venture Investing is Less Risky Than You Think: Managing Return Risk Through a Highly Selective and Well-Diversified Portfolio to Achieve Superior ResultsAugust 2010
VENTURE CAPITAL UPDATE 14
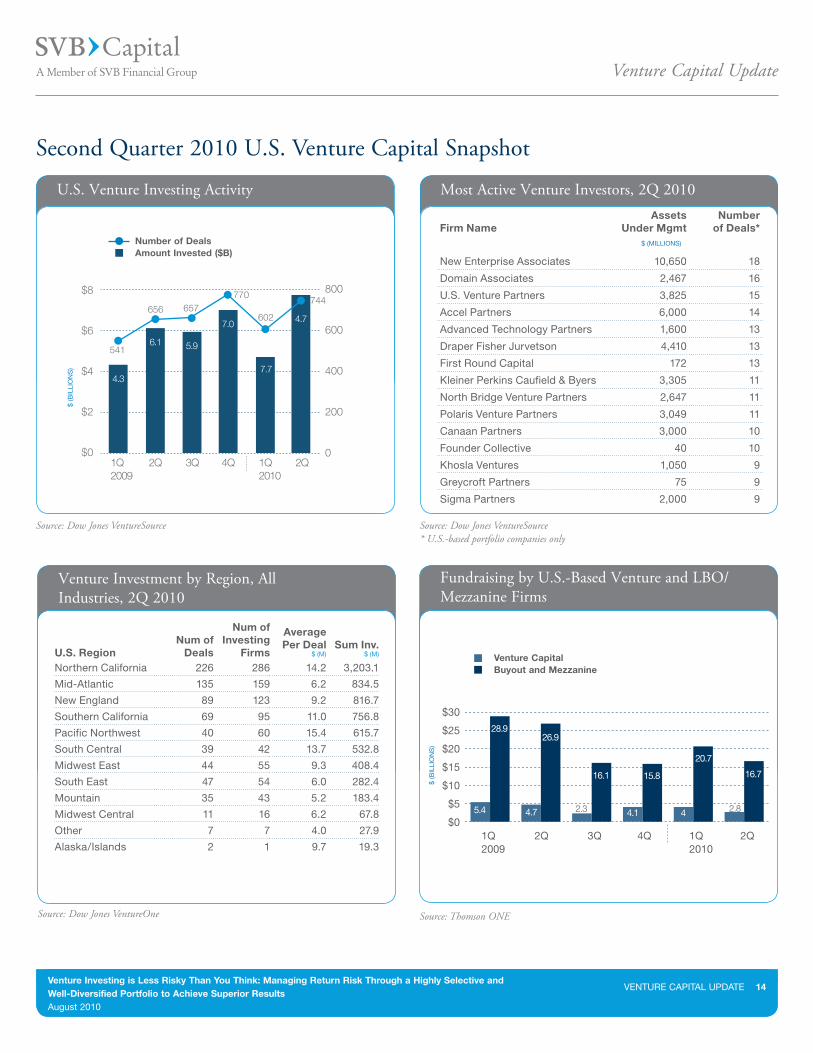
Second Quarter 2010 U.S. Venture Capital Snapshot
U.S. Venture Investing Activity
Source: Dow Jones VentureSource
Number of DealsAmount Invested ($B)
$8
$6
$4
$2
$0
800
600
400
200
01Q2009
4Q3Q2Q 2Q1Q2010
6.1
4.3
5.9
7.0
7.7
4.7
541
770657
602
744656
$ (B
ILLI
ON
S)
Most Active Venture Investors, 2Q 2010
Source: Dow Jones VentureSource * U.S.-based portfolio companies only
Firm NameAssets
Under MgmtNumber
of Deals*
New Enterprise Associates 10,650 18
Domain Associates 2,467 16
U.S. Venture Partners 3,825 15
Accel Partners 6,000 14
Advanced Technology Partners 1,600 13
Draper Fisher Jurvetson 4,410 13
First Round Capital 172 13
Kleiner Perkins Caufield & Byers 3,305 11
North Bridge Venture Partners 2,647 11
Polaris Venture Partners 3,049 11
Canaan Partners 3,000 10
Founder Collective 40 10
Khosla Ventures 1,050 9
Greycroft Partners 75 9
Sigma Partners 2,000 9
$ (MILLIONS)
Venture Investment by Region, All Industries, 2Q 2010
Source: Dow Jones VentureOne
U.S. RegionNum of
Deals
Num of Investing
Firms
AveragePer Deal
$ (M) Sum Inv.
$ (M)
Northern California 226 286 14.2 3,203.1
Mid-Atlantic 135 159 6.2 834.5
New England 89 123 9.2 816.7
Southern California 69 95 11.0 756.8
Pacific Northwest 40 60 15.4 615.7
South Central 39 42 13.7 532.8
Midwest East 44 55 9.3 408.4
South East 47 54 6.0 282.4
Mountain 35 43 5.2 183.4
Midwest Central 11 16 6.2 67.8
Other 7 7 4.0 27.9
Alaska/Islands 2 1 9.7 19.3
Fundraising by U.S.-Based Venture and LBO/Mezzanine Firms
Source: Thomson ONE
$ (B
ILLI
ON
S)
Venture CapitalBuyout and Mezzanine
$30
$25
$20
$15
$10
$5
$01Q 2Q 3Q 4Q 1Q 2Q2009 2010
28.926.9
16.1
4.1 4
15.8 16.7
20.7
5.4 4.7 2.3 2.8
Venture Capital Update
Venture Investing is Less Risky Than You Think: Managing Return Risk Through a Highly Selective and Well-Diversified Portfolio to Achieve Superior ResultsAugust 2010
VENTURE CAPITAL UPDATE 15
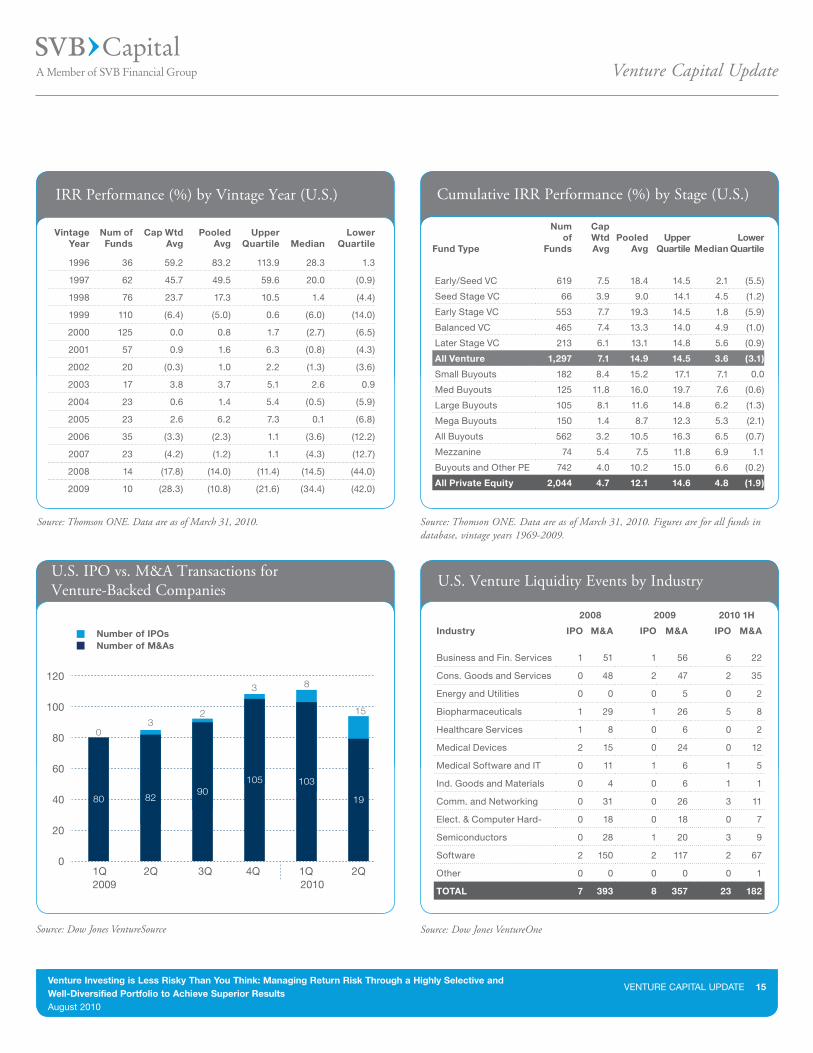
IRR Performance (%) by Vintage Year (U.S.)
Source: Thomson ONE. Data are as of March 31, 2010.
VintageYear
Num of Funds
Cap WtdAvg
PooledAvg
Upper Quartile Median
Lower Quartile
1996 36 59.2 83.2 113.9 28.3 1.3
1997 62 45.7 49.5 59.6 20.0 (0.9)
1998 76 23.7 17.3 10.5 1.4 (4.4)
1999 110 (6.4) (5.0) 0.6 (6.0) (14.0)
2000 125 0.0 0.8 1.7 (2.7) (6.5)
2001 57 0.9 1.6 6.3 (0.8) (4.3)
2002 20 (0.3) 1.0 2.2 (1.3) (3.6)
2003 17 3.8 3.7 5.1 2.6 0.9
2004 23 0.6 1.4 5.4 (0.5) (5.9)
2005 23 2.6 6.2 7.3 0.1 (6.8)
2006 35 (3.3) (2.3) 1.1 (3.6) (12.2)
2007 23 (4.2) (1.2) 1.1 (4.3) (12.7)
2008 14 (17.8) (14.0) (11.4) (14.5) (44.0)
2009 10 (28.3) (10.8) (21.6) (34.4) (42.0)
Cumulative IRR Performance (%) by Stage (U.S.)
Source: Thomson ONE. Data are as of March 31, 2010. Figures are for all funds in database, vintage years 1969-2009.
Fund Type
Num of
Funds
CapWtdAvg
Pooled Avg
Upper Quartile Median
LowerQuartile
Early/Seed VC 619 7.5 18.4 14.5 2.1 (5.5)
Seed Stage VC 66 3.9 9.0 14.1 4.5 (1.2)
Early Stage VC 553 7.7 19.3 14.5 1.8 (5.9)
Balanced VC 465 7.4 13.3 14.0 4.9 (1.0)
Later Stage VC 213 6.1 13.1 14.8 5.6 (0.9)
All Venture 1,297 7.1 14.9 14.5 3.6 (3.1)
Small Buyouts 182 8.4 15.2 17.1 7.1 0.0
Med Buyouts 125 11.8 16.0 19.7 7.6 (0.6)
Large Buyouts 105 8.1 11.6 14.8 6.2 (1.3)
Mega Buyouts 150 1.4 8.7 12.3 5.3 (2.1)
All Buyouts 562 3.2 10.5 16.3 6.5 (0.7)
Mezzanine 74 5.4 7.5 11.8 6.9 1.1
Buyouts and Other PE 742 4.0 10.2 15.0 6.6 (0.2)
All Private Equity 2,044 4.7 12.1 14.6 4.8 (1.9)
U.S. IPO vs. M&A Transactions for Venture-Backed Companies
80 8290
105 103
19
0
3
23
15
8
Source: Dow Jones VentureSource
Number of IPOsNumber of M&As
120
100
80
60
40
20
01Q 2Q 3Q 4Q 1Q 2Q2009 2010
U.S. Venture Liquidity Events by Industry
Source: Dow Jones VentureOne
Industry IPO M&A IPO M&A IPO M&A
Business and Fin. Services 1 51 1 56 6 22
Cons. Goods and Services 0 48 2 47 2 35
Energy and Utilities 0 0 0 5 0 2
Biopharmaceuticals 1 29 1 26 5 8
Healthcare Services 1 8 0 6 0 2
Medical Devices 2 15 0 24 0 12
Medical Software and IT 0 11 1 6 1 5
Ind. Goods and Materials 0 4 0 6 1 1
Comm. and Networking 0 31 0 26 3 11
Elect. & Computer Hard- 0 18 0 18 0 7
Semiconductors 0 28 1 20 3 9
Software 2 150 2 117 2 67
Other 0 0 0 0 0 1
TOTAL 7 393 8 357 23 182
2008 2009 2010 1H
Venture Capital Update
Venture Investing is Less Risky Than You Think: Managing Return Risk Through a Highly Selective and Well-Diversified Portfolio to Achieve Superior ResultsAugust 2010
VENTURE CAPITAL UPDATE 16
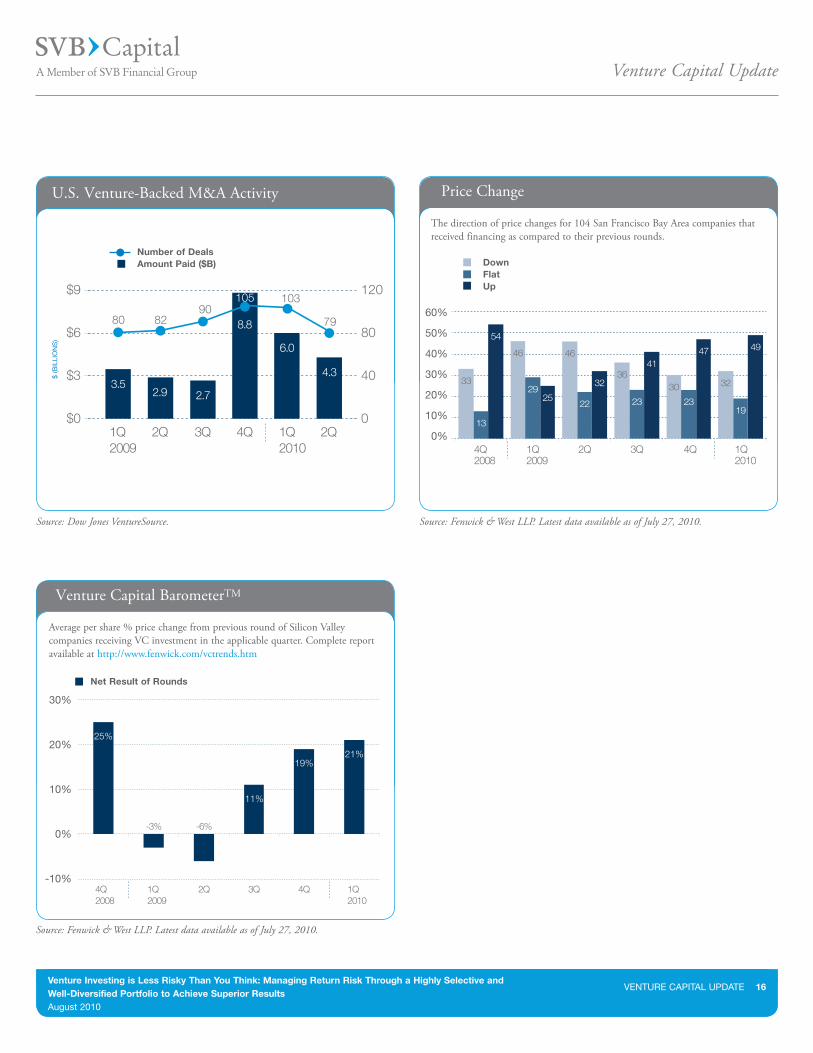
U.S. Venture-Backed M&A Activity
Source: Dow Jones VentureSource.
$ (B
ILLI
ON
S)
Number of DealsAmount Paid ($B)
1Q2009
2Q 2Q4Q 1Q2010
3Q
9082 79
103105
80
$0
$6
$3
$9
0
40
80
120
3.52.9 2.7
8.8
6.0
4.3
Price Change
Source: Fenwick & West LLP. Latest data available as of July 27, 2010.
The direction of price changes for 104 San Francisco Bay Area companies that received financing as compared to their previous rounds.
60%
50%
40%
30%
20%
10%
0%
DownFlatUp
54
33
13
25
46
2932
46
22
4136
23
47
30
23
49
32
19%
4Q2008
1Q2009
1Q2010
2Q 3Q 4Q
19
Venture Capital BarometerTM
Average per share % price change from previous round of Silicon Valley companies receiving VC investment in the applicable quarter. Complete report available at http://www.fenwick.com/vctrends.htm
Source: Fenwick & West LLP. Latest data available as of July 27, 2010.
Net Result of Rounds
30%
20%
10%
0%
-10%
25%55
19%
11%
-6%-3%
21%
4Q2008
1Q2009
1Q2010
2Q 3Q 4Q

©2010 SVB Financial Group. ® All rights reserved. Member Federal Reserve System. SVB, SVB> and SVB>Find a way are all trademarks of SVB Financial Group. SVB Capital is a non-bank member of SVB Financial Group. Products and services offered by SVB Capital are not insured by the FDIC or any other Federal Government Agency and are not guaranteed by Silicon Valley Bank or its affiliates. Rev. 08-11-10.
SVB Capital Headquarters2400 Hanover Street Palo Alto, California 94304Phone 650.855.3000
3000 Sand Hill Road, Building 3, Suite 150 Menlo Park, California 94025Phone 650.233.7420