svan 974 - intecconinc.com
TRANSCRIPT
SVAN 974 Vibration
ANALYSER
USER’S MANUAL
SVANTEK Sp. z o.o.
WARSAW, December 2013

SVAN 974 USER'S MANUAL_______________________________________________ _2
Notice: This user’s manual presents the software revision named 1.06.1 (cf. the description of the
Unit Label position of the Instrument list). The succeeding software revisions (marked with higher numbers)
can slightly change the view of some displays presented in the text of the manual.
SVAN 974 USER'S MANUAL_______________________________________________ _3
CONTENTS
1. INTRODUCTION 6
1.1. SVAN 974 as Vibration Level Meter & Analyser 6
1.2. General features of SVAN 974 6
1.3. Accessories included 7
1.4. Accessories available 7
1.5. Software options available 7
2. MANUAL CONTROL OF THE INSTRUMENT 8
2.1 Control push-buttons on the front panel 8
2.2 Input and output sockets of the instrument 10
3. SETTING THE INSTRUMENT 11
3.1. Basis of the instrument’s control 11
3.2. Powering of the instrument 13
3.3. Starting the instrument 14
3.4. Description of icons 14
3.5. Memory organisation 15
4. FUNCTIONS OF THE INSTRUMENT – Function 16
4.1. Selecting the accelerometer type – Mode 16
4.2. Measurement functions of the instrument - Measurement Function 16
4.1. Instrument’s calibration – Calibration 17
4.3.1. Calibration by Sensitivity 17
4.3.2. Calibration By Measurement 18
4.3.3. History of the calibrations - Last Calibration 18
4.3.4. Clear calibration records - Clear Calibr. History 19
5. MEASUREMENT PARAMETERS SETTING – Measurement 20
5.1 Selection of measurement parameters - General Settings 20
5.2 Measure trigger parameters selection – Measure Trigger 22
5.3 Setting parameters in a profile – Profiles 23
5.4 Setting the data logging functionality – Logging 24
5.4.1 Data logger programming – Logger Setup 24
5.4.2 Results selection – Logger Results 25
5.4.3 Logger trigger parameters setup – Logger Trigger 26
5.4.4 Event recording setup – Event Recording 27
5.4.5 Wave recording setup – Wave Recording 29
5.5 Selection of the 1/1 Octave and 1/3 Octave spectrum parameters – Spectrum 30
5.6 Measurement range setting – Range 30
5.7 Programming the …. – RPM 30
5.8 Programming the instrument’s internal timer – Timer 31
5.9 Description of an example timer function execution 32
6. DATA AVAILABLE ON THE DISPLAY – Display 33
SVAN 974 USER'S MANUAL_______________________________________________ _4
6.1 Selection of the modes of measurement results presentation - Display Modes 33
6.2 Setting the scale of the presentation and the display grid - Display Scale 36
6.3 Setting the parameters of the spectrum presentation - Spectrum View 37
6.4 Selection of the Spectrum Type - Spectrum Type 37
6.5 Setting the display brightness and power saver- Screen Setup 37
7. SAVING THE MEASUREMENT RESULTS – File 39
7.1 Managing the files saved in the external memory – File Manager 40
7.1.1 Setting the directory for saving files – Set as Working Dir. 40
7.1.2 Deleting file/catalogue – Delete 40
7.1.3 Erasing all files in a catalogue – Delete All 41
7.2 Managing the setup files – Setup Manager 41
8. SETTING OF THE INSTRUMENT PARAMETERS – Instrument 43
8.1. Checking the powering of the instrument – Battery 43
8.2. Selection of the IEPE current supply - IEPE Current 43
8.3. Selection of keyboard modes – Keyboard Settings 44
8.4. Setting parameters of the I/O port - Multifunction I/O 44
8.5. Programming the instrument’s internal Real Time Clock – RTC 46
8.6. Checking specification of the instrument - Unit Label 46
9. AUXILIARY SETTINGS – Auxiliary Setup 47
9.1. Setting the language of the user interface – Language 47
9.2. Return to the factory settings – Factory Settings 47
9.3. Reference signal in vibration measurements - Reference Levels 48
9.4. Selection of the Vibration units - Vibration Units 48
9.5. Warnings setup – Warnings 48
10. 1/1 AND 1/3 OCTAVE ANALYSER 50
10.1. Selection of 1/1 Octave or 1/3 Octave analysis mode 50
10.2. Selecting the parameters of 1/1 Octave and 1/3 Octave analysis 50
10.3. Measurement range selection in 1/1 Octave and 1/3 Octave analysis - Range 51
10.4. Setting the parameters of 1/1 Octave and 1/3 Octave analysis - Spectrum 51
10.5. Saving of 1/1 Octave and 1/3 Octave analysis results - Logger Results 51
10.6. Selecting the result which triggers recording for the logger in 1/1 Octave and 1/3 Octave analysis - Logger Trigger 52
10.7. Display options in 1/1 Octave and 1/3 Octave analysis mode 52
10.8. Presentation of 1/1 Octave and 1/3 Octave analysis results 52
10.9. Setting the scale of the spectrum presentation and the grid - Scale 53
10.10. Setting the parameters of the spectrum presentation - Spectrum View 54
10.11. Selection of the Spectrum Type in Vibration mode - Spectrum Type 55
11. FFT ANALYSER 56
11.1. Selection of FFT analysis mode 56
11.2. Selecting the parameters of FFT analysis 56

SVAN 974 USER'S MANUAL_______________________________________________ _5
11.3. Measurement range selection - Range 56
11.4. Setting the parameters of FFT analysis - FFT 57
11.5. Saving of FFT analysis results - Logger Results 57
11.6. Display options in FFT analysis mode 57
11.7. Presentation of FFT analysis results 58
11.8. Setting the scale of spectrum presentation - Scale 58
11.9. Setting the parameters of the spectrum presentation - Spectrum View 59
11.10. Selection of the Spectrum Type in Vibration mode - Spectrum Type 60
SVAN 974 USER'S MANUAL_______________________________________________ _6
1. INTRODUCTION
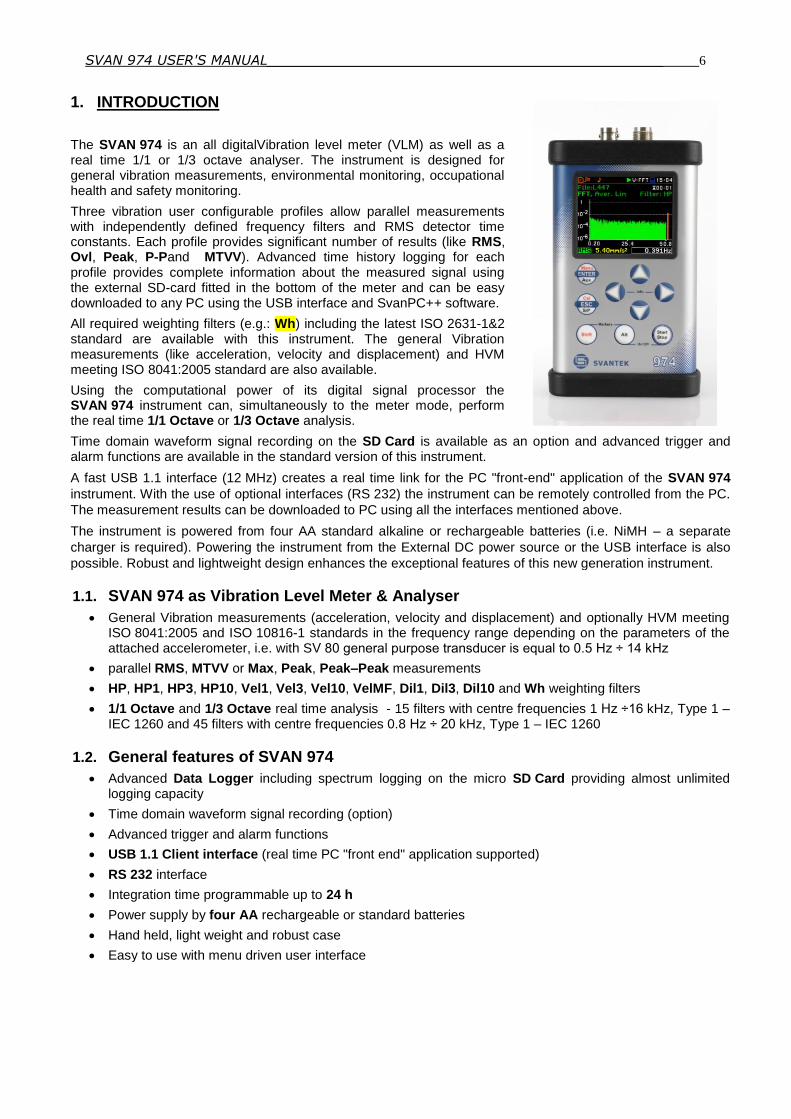
The SVAN 974 is an all digitalVibration level meter (VLM) as well as a real time 1/1 or 1/3 octave analyser. The instrument is designed for general vibration measurements, environmental monitoring, occupational health and safety monitoring.
Three vibration user configurable profiles allow parallel measurements with independently defined frequency filters and RMS detector time constants. Each profile provides significant number of results (like RMS, Ovl, Peak, P-Pand MTVV). Advanced time history logging for each profile provides complete information about the measured signal using the external SD-card fitted in the bottom of the meter and can be easy downloaded to any PC using the USB interface and SvanPC++ software.
All required weighting filters (e.g.: Wh) including the latest ISO 2631-1&2 standard are available with this instrument. The general Vibration measurements (like acceleration, velocity and displacement) and HVM meeting ISO 8041:2005 standard are also available.
Using the computational power of its digital signal processor the SVAN 974 instrument can, simultaneously to the meter mode, perform the real time 1/1 Octave or 1/3 Octave analysis.
Time domain waveform signal recording on the SD Card is available as an option and advanced trigger and alarm functions are available in the standard version of this instrument.
A fast USB 1.1 interface (12 MHz) creates a real time link for the PC "front-end" application of the SVAN 974
instrument. With the use of optional interfaces (RS 232) the instrument can be remotely controlled from the PC.
The measurement results can be downloaded to PC using all the interfaces mentioned above.
The instrument is powered from four AA standard alkaline or rechargeable batteries (i.e. NiMH – a separate
charger is required). Powering the instrument from the External DC power source or the USB interface is also
possible. Robust and lightweight design enhances the exceptional features of this new generation instrument.
1.1. SVAN 974 as Vibration Level Meter & Analyser
General Vibration measurements (acceleration, velocity and displacement) and optionally HVM meeting ISO 8041:2005 and ISO 10816-1 standards in the frequency range depending on the parameters of the attached accelerometer, i.e. with SV 80 general purpose transducer is equal to 0.5 Hz ÷ 14 kHz
parallel RMS, MTVV or Max, Peak, Peak–Peak measurements
HP, HP1, HP3, HP10, Vel1, Vel3, Vel10, VelMF, Dil1, Dil3, Dil10 and Wh weighting filters
1/1 Octave and 1/3 Octave real time analysis - 15 filters with centre frequencies 1 Hz ÷16 kHz, Type 1 – IEC 1260 and 45 filters with centre frequencies 0.8 Hz ÷ 20 kHz, Type 1 – IEC 1260
1.2. General features of SVAN 974
Advanced Data Logger including spectrum logging on the micro SD Card providing almost unlimited logging capacity
Time domain waveform signal recording (option)
Advanced trigger and alarm functions
USB 1.1 Client interface (real time PC "front end" application supported)
RS 232 interface
Integration time programmable up to 24 h
Power supply by four AA rechargeable or standard batteries
Hand held, light weight and robust case
Easy to use with menu driven user interface

SVAN 974 USER'S MANUAL_______________________________________________ _7
1.3. Accessories included
SV 80 - accelerometer with SA 27 mounting magnet,
SC 27 - coil cable,
SA 74 - waterproof carrying case
SC 56 – USB cable,
4 GB micro-SD card,
four AA - alkaline batteries
SvanPC++ - download and viewing software for Windows 2000/XP/Vista/Win 8 operating systems
1.4. Accessories available
SVRPM_PROB - Laser Tachometer with SC 69 cable
SV 80 - Accelerometer 100 mV/g, TNC top connector, 10-32 mounting hole
SC 27 - TNC (plug) to TNC (plug) coil cable (2 m)
SA 27 - Mounting magnet for the accelerometer
SA 47 - Carrying bag for SVAN 95x and accessories (fabric material)
SA 54 - Power supply unit by USB interface using cables SC 16 or SC 56 (cables not included)
SA 74 - Carrying case for SVAN 974 and accessories (waterproof)
1.5. Software options available
SV 974_1 - 1/1 & 1/3 octave analysis option
SV 974_4 - FFT analysis option
SV 974_8 - Rotation measurement option without Laser Tachometer
Notice: The software options for the instrument can be purchased at any time as only the introduction of a special unlock code is required for their activation in a specific instrument. Contact your local Svantek distributor for further information and costs for these options.

SVAN 974 USER'S MANUAL_______________________________________________ _8
2. MANUAL CONTROL OF THE INSTRUMENT
Control of the instrument has been developed in a fully interactive manner. The user can operate the instrument
by selecting the appropriate position from the selected Menu list. Thanks to that, the number of push-buttons for
control of the instrument has been reduced to nine for ease of use and convenience.
2.1 Control push-buttons on the front panel
The following control push-buttons are located on the front panel of
the instrument:
<ENTER>, (<Menu>), [<Save>],
<ESC>, (<Cal.>), [<S/P>],
<Shift>, [Markers]
<Alt>, [Markers]
<>,
<>,
<>,
<>,
<Start/Stop>.
The name given in (...) brackets denotes the second push-button
function which is available after pressing it in conjunction (or in
sequence) with the <Shift> push-button. For the first two push-
buttons the name given in square brackets […] denotes also the
third push-button function which is available after pressing it in
conjunction (or in sequence) with the <Alt> push-button.
<Shift> The second function of a push-button (written in red colour on a push-button) can be
used when the <Shift> push-button is pressed. This push-button can be used in two
different ways:
as Shift like with a computer keyboard (e.g. while typing the filename); both
<Shift> and the second push-button must be pressed together (two finger
operation);
as 2nd Fun; this push-button can be pressed and released before pressing the
second one or pressed in parallel (while operating in “2nd Fun” mode, see the
following notice) with the second push-button (one finger operation).
The <Shift> push-button pressed in conjunction with <Alt> enables the user to activate
the Markers on the plots during the measurement.
<Alt> This push-button enables the user to choose the third push-button function in case of
[<Save>] and [<Pause>] push-buttons. In order to select the third function the user
must press the <Alt> and the second push-button simultaneously.
Notice: Simultaneously pressing the <Alt> and <Start/Stop> push-buttons switches the instrument on or off.
<Start/Stop> This push-button enables the user to start the measurement process when the
instrument is not measuring or to stop it when the instrument is in course of the
measurement. It is also possible to set the mode of this push-button such that in order to
start or stop the measurements the user has to press it simultaneously with the <Shift>
push-button. This can prevent accidentally starting or stopping a measurement at the
wrong time by just brushing against the <Start/Stop> button on its own.
Notice: Changing the <Start/Stop> push-button mode is performed in the Keyboard Settings window of the Instrument list (see description of the Instrument list).
SVAN 974 USER'S MANUAL_______________________________________________ _9
<ENTER> This push-button enables the user to enter the selected position shown on the screen
Menu list or to confirm selected settings. Some additional functions of this push-button
will be described in the following chapters of this manual.
(<Menu>) This push-button (pressed together with <Shift>) enables the user to enter the main list
containing six sub-lists: Function, Measurement, Display, File, Instrument and
Auxiliary Setup. . Each of the above mentioned menu lists consists of sub-lists,
elements and data windows. These main sub-lists will be described in detail in the
following chapters of the manual. Double pressing the <Menu> push-button enters a list
containing the last eight opened sub-lists. It often speeds up the control of the
instrument as the user has faster access to the most frequently used sub-lists for easy
navigation.
<ESC> This push-button closes the control lists, sub-lists or windows. It acts in an opposite way
to the <ENTER> push-button. When the window is closed after pressing the <ESC>
push-button, any changes made in it are ignored in almost all cases.
([Cal.]) This push-button (pressed together with <Shift>) opens the Calibration sub-list.
[<S/P>] This push-button enables the user to pause or break the measurement process
temporarily.
<>, <>
These push-buttons enable the user specifically to:
select the column in a multi column parameter list;
select the parameters value in an active position (e.g. Start Delay period: 1s, 2s, 3s,
… etc.);
control the cursor in Spectrum and Logger modes of result presentation;
select the position of the character in the text editing screen;
activate markers 2 and 3
speed up changing the numerical values of the parameters when pressed and held.
(<>, <>) The <>, <> push-buttons pressed in conjunction (or in sequence) with <Shift>
enable the user specifically to:
change the parameters value with double step (e.g. Start Delay period: form 1s to
11s, 21s, … etc.);
to shift cursor from the first to the last position and back on the graphical presentation
mode.
[<>, <>]
The <>, <> push-buttons pressed in conjunction (or in sequence) with <Alt> enable
the user specifically to:
select the parameters value in an active position in the matrix parameter list;
select the parameters value in an active position (e.g. Start Delay period: 1s, 2s, 3s
… etc.);
insert or delete a character in the text edition screen.
<>, <>
The <>, <> push-buttons enable the user specifically to:
select lines in the list;
select the correct character from the list in the text edition screen;
(<>, <>)
The <>, <> push-buttons pressed in conjunction (or in sequence) with <Shift>
enable the user specifically to:
shift the cursor from the first to the last position and back on the menu list;
change the relationship between the Y-axis and X-axis of all plots presented on the
screen.
[<>, <>]
The <>, <> push-buttons pressed in conjunction (or in sequence) with <Alt> enable
the user specifically to:
change the mode of result presentation;
programme the Real Time Clock (RTC) and Timer.
SVAN 974 USER'S MANUAL_______________________________________________ _10
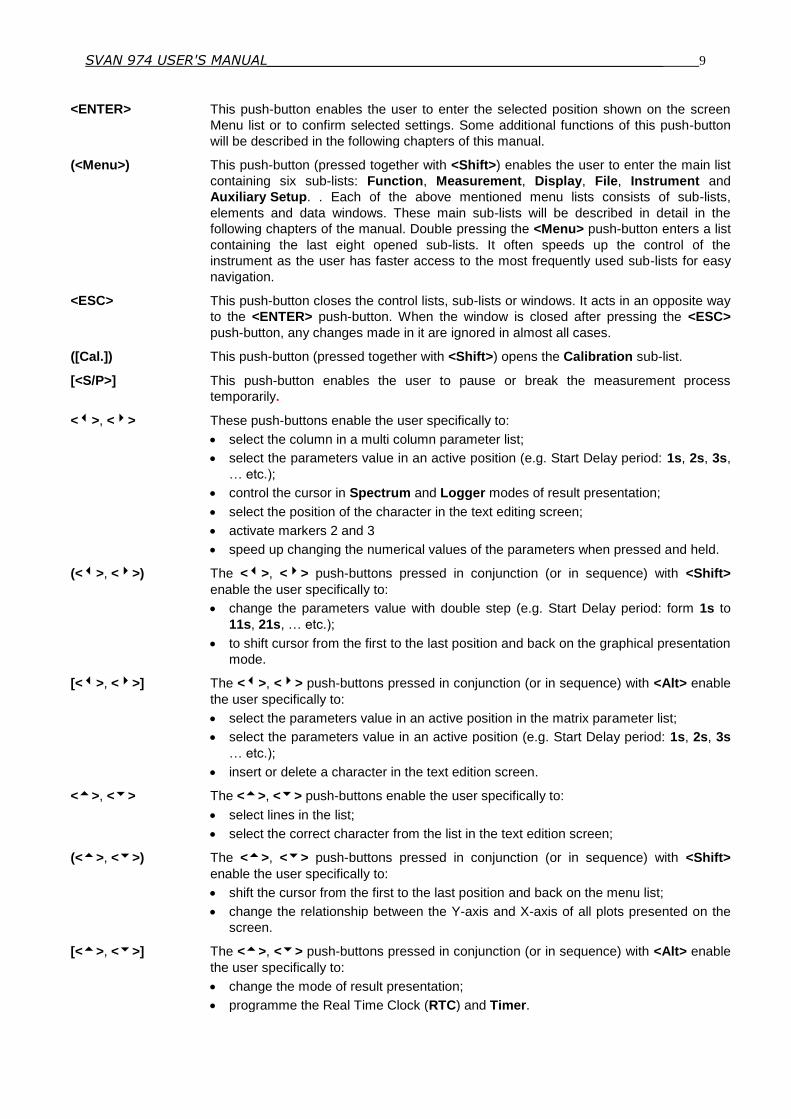
[Info]
The <Info> push-button (simultaneous pressing the
<>, <> push-buttons) opens the window with the
help information in the measurement display modes.
Press <ESC> or <ENTER> to exit the Info screen.
2.2 Input and output sockets of the instrument
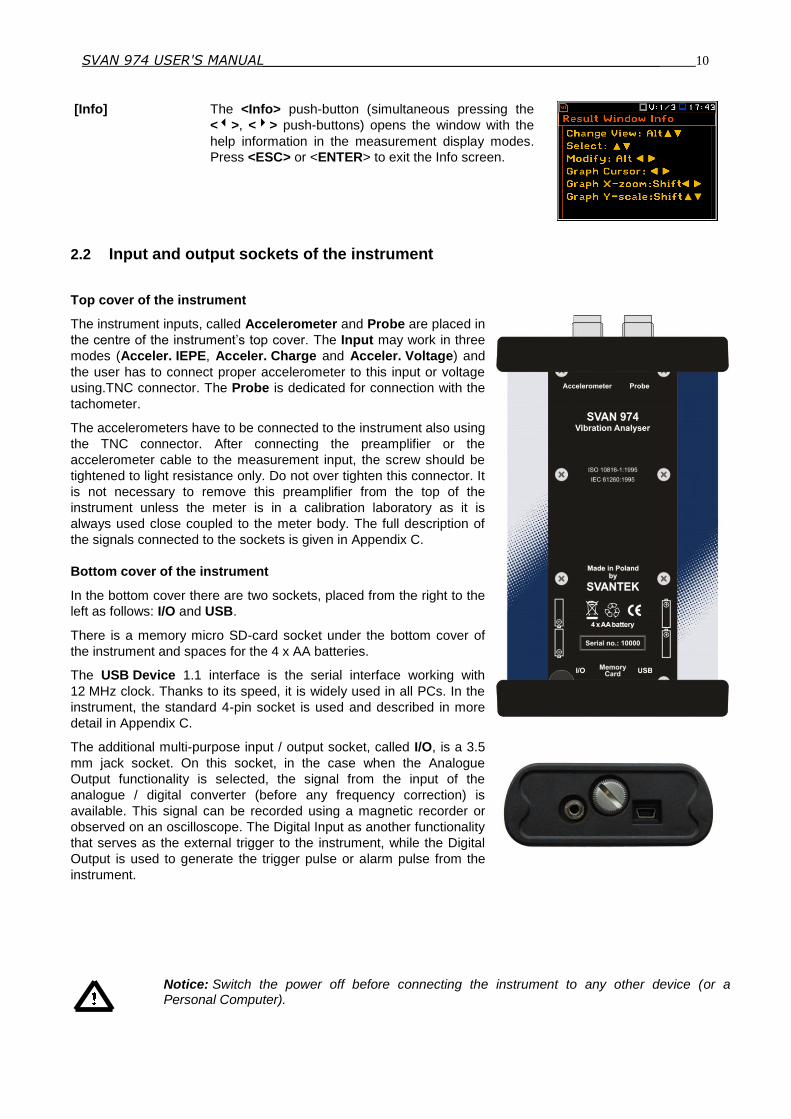
Top cover of the instrument
The instrument inputs, called Accelerometer and Probe are placed in
the centre of the instrument’s top cover. The Input may work in three
modes (Acceler. IEPE, Acceler. Charge and Acceler. Voltage) and
the user has to connect proper accelerometer to this input or voltage
using.TNC connector. The Probe is dedicated for connection with the
tachometer.
The accelerometers have to be connected to the instrument also using
the TNC connector. After connecting the preamplifier or the
accelerometer cable to the measurement input, the screw should be
tightened to light resistance only. Do not over tighten this connector. It
is not necessary to remove this preamplifier from the top of the
instrument unless the meter is in a calibration laboratory as it is
always used close coupled to the meter body. The full description of
the signals connected to the sockets is given in Appendix C.
Bottom cover of the instrument
In the bottom cover there are two sockets, placed from the right to the
left as follows: I/O and USB.
There is a memory micro SD-card socket under the bottom cover of
the instrument and spaces for the 4 x AA batteries.
The USB Device 1.1 interface is the serial interface working with
12 MHz clock. Thanks to its speed, it is widely used in all PCs. In the
instrument, the standard 4-pin socket is used and described in more
detail in Appendix C.
The additional multi-purpose input / output socket, called I/O, is a 3.5
mm jack socket. On this socket, in the case when the Analogue
Output functionality is selected, the signal from the input of the
analogue / digital converter (before any frequency correction) is
available. This signal can be recorded using a magnetic recorder or
observed on an oscilloscope. The Digital Input as another functionality
that serves as the external trigger to the instrument, while the Digital
Output is used to generate the trigger pulse or alarm pulse from the
instrument.
Notice: Switch the power off before connecting the instrument to any other device (or a Personal Computer).

SVAN 974 USER'S MANUAL_______________________________________________ _11
3. SETTING THE INSTRUMENT
In order to perform measurements using the instrument the user only has to plug-in the proper vibration
transducer and to switch the power on by pressing the <Alt> and <Start/Stop> push-buttons at the same time.
Hold both buttons down for 1 or 2 seconds and release to switch on.
3.1. Basis of the instrument’s control
The instrument is controlled by means of nine push-buttons on the keyboard. Using these push-buttons the user
can access all available functions and change the value of all available parameters. The functions are placed in
a system of lists and sub-lists.
The instrument's menu consists of different type of windows, which include: main menu list, sub-menu list,
option list, parameter list, text editor window, information window and file manager window with file command
list.
Main menu
The main list contains the headers of six lists, which also contain sub-lists or
positions (elements). The main list is opened after pressing the <Menu> push-
button. This list contains the following sub-lists: Function, Measurement,
Display, File, Instrument and Auxiliary Setup.
Recent Items list
Double pressing the <Menu> push-button opens the list of recently accessed
menu items. This enables the user to access the most frequently used lists
quickly, without the necessity of passing through the whole menu path.
Position selection
The desired position in menu list is
selecting using the <> or <> push-
buttons.
<>
Entering position
After selection of the desired position in the
menu list, the user has to press the
<ENTER> push-button in order to enter it.
After this operation a new sub-menu, option
list, parameter list or information window
appears on the display. <ENT>
List of parameters
The parameter list contains parameters for which the user may select the
value from the available range. Pressing the <ENTER> push-button enables
the user to access the above mentioned sub-list.
The desired position in a list is accessed after pressing the <> or <>
push-button.
The change of the value in a selected position is performed by the <> or
<> push-buttons (or pressed together with <Shift>).
SVAN 974 USER'S MANUAL_______________________________________________ _12
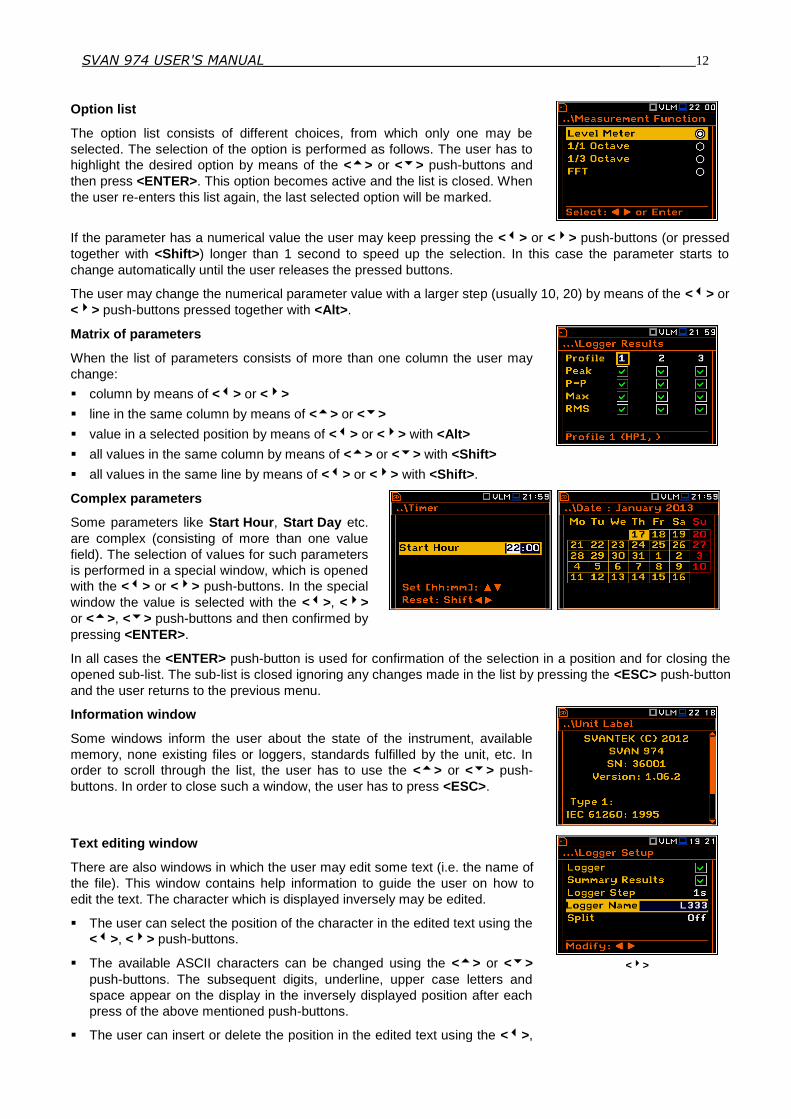
Option list
The option list consists of different choices, from which only one may be
selected. The selection of the option is performed as follows. The user has to
highlight the desired option by means of the <> or <> push-buttons and
then press <ENTER>. This option becomes active and the list is closed. When
the user re-enters this list again, the last selected option will be marked.
If the parameter has a numerical value the user may keep pressing the <> or <> push-buttons (or pressed
together with <Shift>) longer than 1 second to speed up the selection. In this case the parameter starts to
change automatically until the user releases the pressed buttons.
The user may change the numerical parameter value with a larger step (usually 10, 20) by means of the <> or
<> push-buttons pressed together with <Alt>.
Matrix of parameters
When the list of parameters consists of more than one column the user may
change:
column by means of <> or <>
line in the same column by means of <> or <>
value in a selected position by means of <> or <> with <Alt>
all values in the same column by means of <> or <> with <Shift>
all values in the same line by means of <> or <> with <Shift>.
Complex parameters
Some parameters like Start Hour, Start Day etc.
are complex (consisting of more than one value
field). The selection of values for such parameters
is performed in a special window, which is opened
with the <> or <> push-buttons. In the special
window the value is selected with the <>, <>
or <>, <> push-buttons and then confirmed by
pressing <ENTER>.
In all cases the <ENTER> push-button is used for confirmation of the selection in a position and for closing the
opened sub-list. The sub-list is closed ignoring any changes made in the list by pressing the <ESC> push-button
and the user returns to the previous menu.
Information window
Some windows inform the user about the state of the instrument, available
memory, none existing files or loggers, standards fulfilled by the unit, etc. In
order to scroll through the list, the user has to use the <> or <> push-
buttons. In order to close such a window, the user has to press <ESC>.
Text editing window
There are also windows in which the user may edit some text (i.e. the name of
the file). This window contains help information to guide the user on how to
edit the text. The character which is displayed inversely may be edited.
The user can select the position of the character in the edited text using the
<>, <> push-buttons.
The available ASCII characters can be changed using the <> or <>
push-buttons. The subsequent digits, underline, upper case letters and
space appear on the display in the inversely displayed position after each
press of the above mentioned push-buttons.
The user can insert or delete the position in the edited text using the <>,
<>
SVAN 974 USER'S MANUAL_______________________________________________ _13
<> push-buttons pressed together with <Alt>.
Help information
In most windows the last line or several lines at the bottom of the screen contain help information. It informs the
user how to select or modify the parameter’s value, change the character in the text line etc.
Inactive parameters
If some functions or parameters are not available, the positions in the menu or
parameter lists linked with this function or parameter became inactive (their
colour becomes grey). For example, if Logger (path: <Menu> / Measurement /
Logging / Logger Setup) is switched off the Logger presentation mode is not
active!
3.2. Powering of the instrument The SVAN 974 can be powered by one of the following sources:
Four AA standard size internal batteries. In the case of alkaline type, a new fully charged set can operate more than 12 h (6.0 V / 1.6 Ah). Instead of the ordinary alkaline cells, four AA rechargeable batteries can be used (a separate external charger is required for charging them). In this case, using the best NiMH type, the operation time can be increased up to 16 h (4.8 V / 2.6 Ah)
USB interface – 500 mA HUB
For each of the three kinds of possible power source there is a different view presented in the Battery window of the Instrument list.
When the instrument is powered from its internal batteries, the “Battery” icon is presented on the top line of the
display. When the voltage of the batteries is too low for reliable measurements, the icon is red or during attempt
to switch the instrument on the Low Battery! message occurs on the display for 2 seconds and the instrument
switches off by itself. To change the batteries the user has to switch off the instrument, unscrew and take off the
black bottom cover of the instrument, slide the battery tubes out, change the batteries taking care to observe the
correct polarity and reassemble the parts of the instrument. A fully charged set of 4 batteries ensures more than
12 hours of continuous operation of the instrument (with Dim LCD switched on). The battery condition can be
checked by means of the Battery function. It is also presented continuously on the top line of the display by
means of the “Battery” icon.
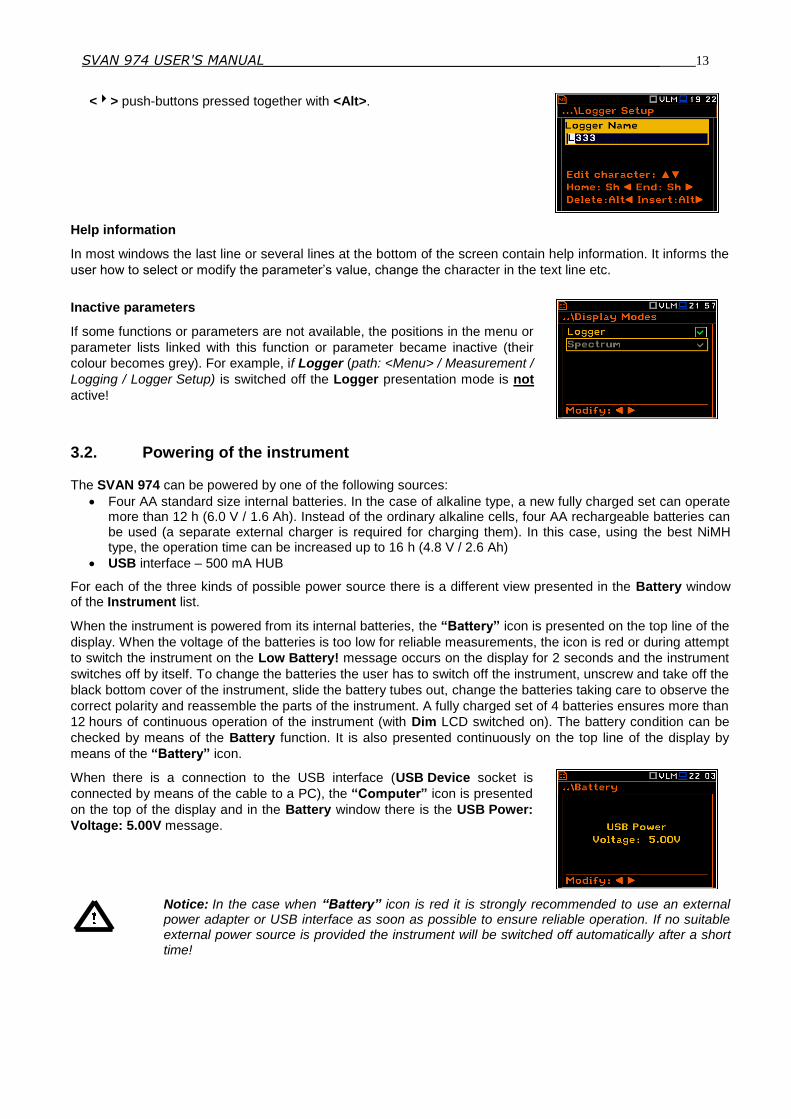
When there is a connection to the USB interface (USB Device socket is
connected by means of the cable to a PC), the “Computer” icon is presented
on the top of the display and in the Battery window there is the USB Power:
Voltage: 5.00V message.
Notice: In the case when “Battery” icon is red it is strongly recommended to use an external power adapter or USB interface as soon as possible to ensure reliable operation. If no suitable external power source is provided the instrument will be switched off automatically after a short time!
SVAN 974 USER'S MANUAL_______________________________________________ _14
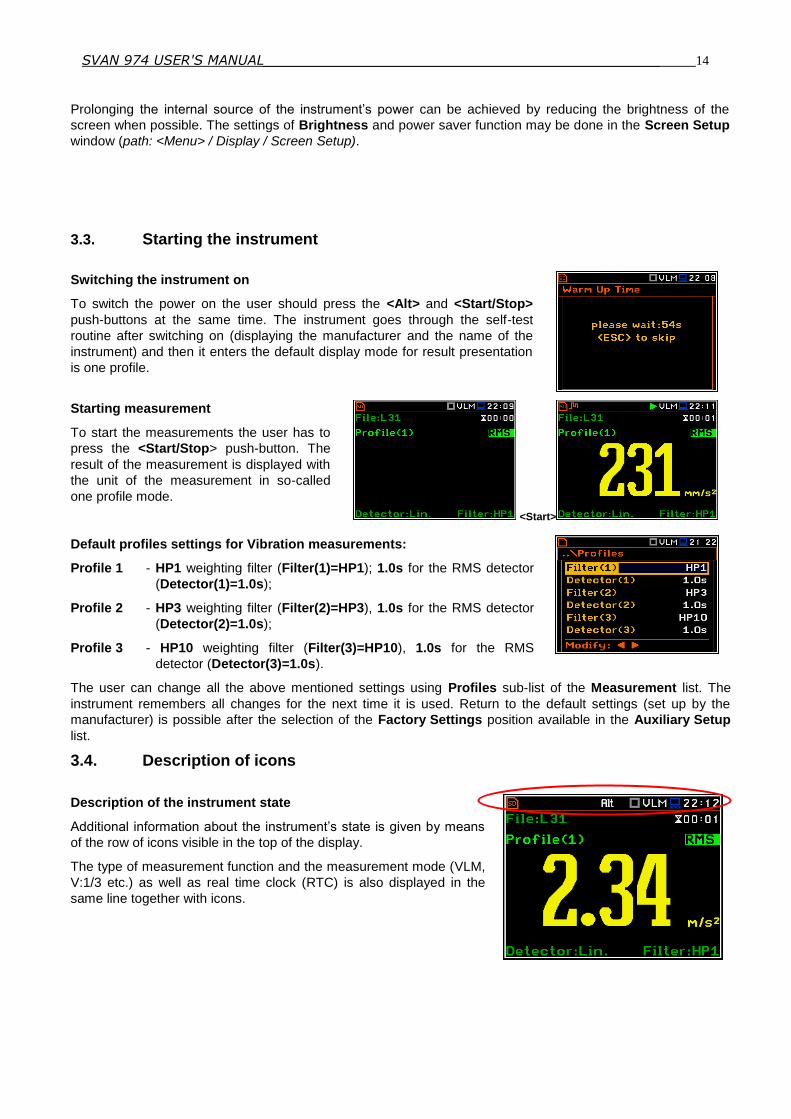
Prolonging the internal source of the instrument’s power can be achieved by reducing the brightness of the
screen when possible. The settings of Brightness and power saver function may be done in the Screen Setup
window (path: <Menu> / Display / Screen Setup).
3.3. Starting the instrument
Switching the instrument on
To switch the power on the user should press the <Alt> and <Start/Stop>
push-buttons at the same time. The instrument goes through the self-test
routine after switching on (displaying the manufacturer and the name of the
instrument) and then it enters the default display mode for result presentation
is one profile.
Starting measurement
To start the measurements the user has to
press the <Start/Stop> push-button. The
result of the measurement is displayed with
the unit of the measurement in so-called
one profile mode.
<Start>
Default profiles settings for Vibration measurements:
Profile 1 - HP1 weighting filter (Filter(1)=HP1); 1.0s for the RMS detector
(Detector(1)=1.0s);
Profile 2 - HP3 weighting filter (Filter(2)=HP3), 1.0s for the RMS detector
(Detector(2)=1.0s);
Profile 3 - HP10 weighting filter (Filter(3)=HP10), 1.0s for the RMS
detector (Detector(3)=1.0s).
The user can change all the above mentioned settings using Profiles sub-list of the Measurement list. The
instrument remembers all changes for the next time it is used. Return to the default settings (set up by the
manufacturer) is possible after the selection of the Factory Settings position available in the Auxiliary Setup
list.
3.4. Description of icons
Description of the instrument state
Additional information about the instrument’s state is given by means
of the row of icons visible in the top of the display.
The type of measurement function and the measurement mode (VLM,
V:1/3 etc.) as well as real time clock (RTC) is also displayed in the
same line together with icons.
SVAN 974 USER'S MANUAL_______________________________________________ _15
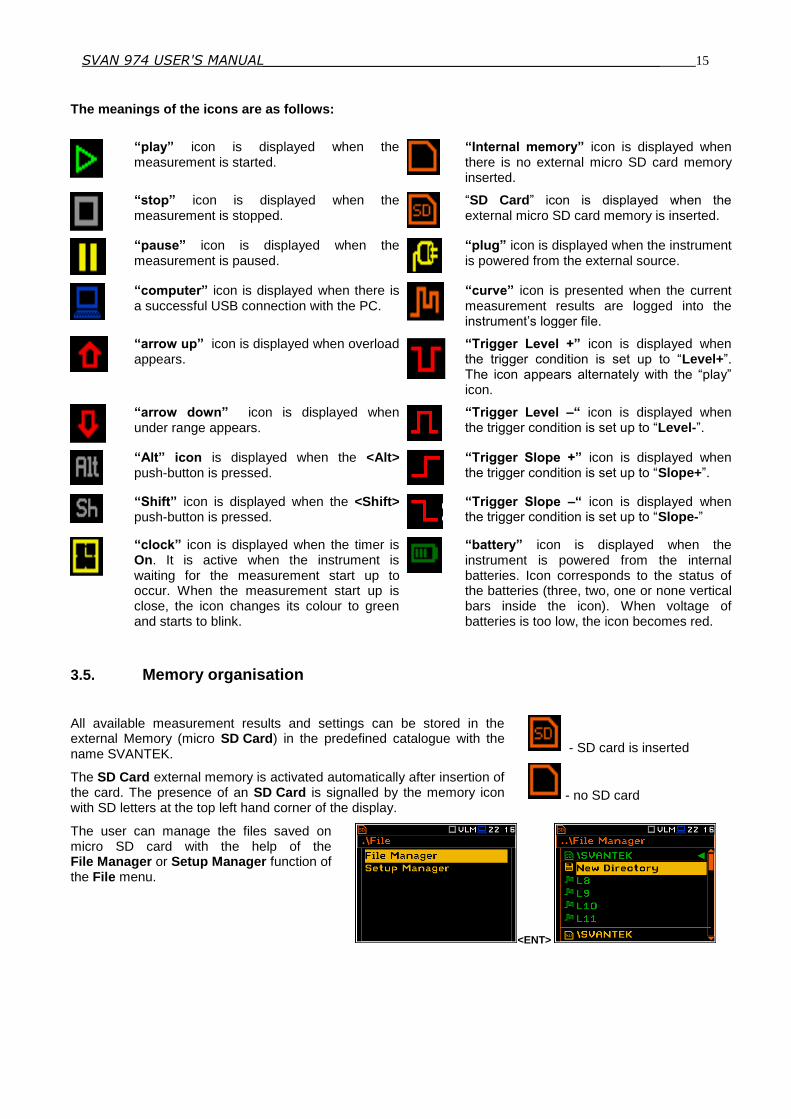
The meanings of the icons are as follows:
“play” icon is displayed when the measurement is started.
“Internal memory” icon is displayed when there is no external micro SD card memory inserted.
“stop” icon is displayed when the measurement is stopped.
“SD Card” icon is displayed when the external micro SD card memory is inserted.
“pause” icon is displayed when the measurement is paused.
“plug” icon is displayed when the instrument is powered from the external source.
“computer” icon is displayed when there is a successful USB connection with the PC.
“curve” icon is presented when the current measurement results are logged into the instrument’s logger file.
“arrow up” icon is displayed when overload appears.
“Trigger Level +” icon is displayed when the trigger condition is set up to “Level+”. The icon appears alternately with the “play” icon.
“arrow down” icon is displayed when under range appears.
“Trigger Level –“ icon is displayed when the trigger condition is set up to “Level-”.
“Alt” icon is displayed when the <Alt> push-button is pressed.
“Trigger Slope +” icon is displayed when the trigger condition is set up to “Slope+”.
“Shift” icon is displayed when the <Shift> push-button is pressed.
“Trigger Slope –“ icon is displayed when the trigger condition is set up to “Slope-”
“clock” icon is displayed when the timer is On. It is active when the instrument is waiting for the measurement start up to occur. When the measurement start up is close, the icon changes its colour to green and starts to blink.
“battery” icon is displayed when the instrument is powered from the internal batteries. Icon corresponds to the status of the batteries (three, two, one or none vertical bars inside the icon). When voltage of batteries is too low, the icon becomes red.
3.5. Memory organisation
All available measurement results and settings can be stored in the external Memory (micro SD Card) in the predefined catalogue with the name SVANTEK.
The SD Card external memory is activated automatically after insertion of the card. The presence of an SD Card is signalled by the memory icon with SD letters at the top left hand corner of the display.
- SD card is inserted
- no SD card
The user can manage the files saved on micro SD card with the help of the File Manager or Setup Manager function of the File menu.
<ENT>
SVAN 974 USER'S MANUAL_______________________________________________ _16
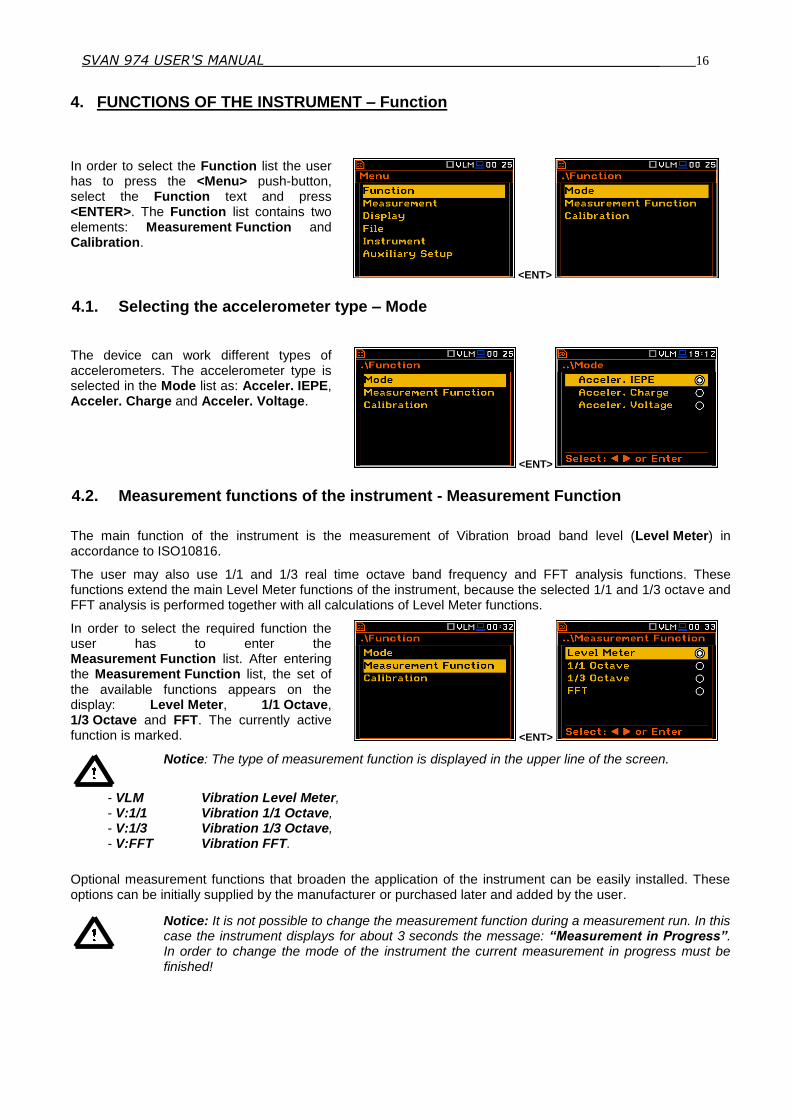
4. FUNCTIONS OF THE INSTRUMENT – Function
In order to select the Function list the user has to press the <Menu> push-button, select the Function text and press <ENTER>. The Function list contains two elements: Measurement Function and Calibration.
<ENT>
4.1. Selecting the accelerometer type – Mode
The device can work different types of accelerometers. The accelerometer type is selected in the Mode list as: Acceler. IEPE, Acceler. Charge and Acceler. Voltage.
<ENT>
4.2. Measurement functions of the instrument - Measurement Function
The main function of the instrument is the measurement of Vibration broad band level (Level Meter) in accordance to ISO10816.
The user may also use 1/1 and 1/3 real time octave band frequency and FFT analysis functions. These functions extend the main Level Meter functions of the instrument, because the selected 1/1 and 1/3 octave and FFT analysis is performed together with all calculations of Level Meter functions.
In order to select the required function the user has to enter the Measurement Function list. After entering the Measurement Function list, the set of the available functions appears on the display: Level Meter, 1/1 Octave, 1/3 Octave and FFT. The currently active function is marked. <ENT>
Notice: The type of measurement function is displayed in the upper line of the screen.
- VLM Vibration Level Meter, - V:1/1 Vibration 1/1 Octave, - V:1/3 Vibration 1/3 Octave, - V:FFT Vibration FFT.
Optional measurement functions that broaden the application of the instrument can be easily installed. These options can be initially supplied by the manufacturer or purchased later and added by the user.
Notice: It is not possible to change the measurement function during a measurement run. In this case the instrument displays for about 3 seconds the message: “Measurement in Progress”. In order to change the mode of the instrument the current measurement in progress must be finished!

SVAN 974 USER'S MANUAL_______________________________________________ _17
4.1. Instrument’s calibration – Calibration
The instrument is factory calibrated with the supplied accelerometers. In case of using other transducers calibration of the measurement channels should be performed by the user. Periodic calibration of standard accelerometers is also required. In order to select the calibration function the user has to enter the Calibration sub-list.
The Calibration sub-list consists of four positions: Calibr. by Sensitivity, Calibr. by Measurement, which are used to perform the actual calibration, Last Calibration, which contains the list of calibration measurements performed earlier and the results obtained and finally Clear Calibr. History. <ENT>
Notice: The calibration factor is always added to the results in the Level Meter, 1/1 Octave, 1/3 Octave modes.
Notice: The calibration level and the calibration result are expressed in different units depending on the settings of the instrument. The metric or non-metric Vibration units are set in the Vibration Units window (path: <Menu> / Auxiliary Setup / Vibration Units). Additionally, the linear or logarithmic units are set in the Display Scale window (path: <Menu> / Display / Display Scale).
Notice: It is not possible to calibrate the instrument during the execution of live measurements. It is possible to open different lists and sub-lists but the positions in these lists are displayed greyed out inversely and so - not accessible. The flashing “►” icon on the top line indicates that the instrument is in the measurement process. In order to change the sensitivity the current measurement in progress must be finished!
4.3.1. Calibration by Sensitivity
The calibration by using the accelerometer’s published sensitivity information can be performed in the following way:
1. Select this type of calibration (highlight the Calibr. by Sensitivity text) from
the Calibration sub-list and press the <ENTER> push-button.
2. Set the sensitivity of the accelerometer taken from its calibration certificate
using the <Shift> with <>, <> push-buttons and then press <ENTER>.
The calibration factor is calculated, after pressing the <ENTER> push-button,
in relation to the nominal value of 10.0 mV / ms-2
. In order to avoid the
calculation the user has to leave the Calibration sub-list by pressing <ESC>.
For an accelerometer sensitivity higher than 10.0 mV / ms-2
the calibration
factor will always be negative.
For an accelerometer sensitivity lower than 10.0 mV / ms-2
the calibration
factor will always be positive.
The lowest available value of the sensitivity that can be introduced is equal to
10.0 V / ms-2
(it conforms to the calibration factor equal to 60.0 dB) and the
highest value is equal to 10.0 V / ms-2
(calibration factor is equal to -60.0 dB).
SVAN 974 USER'S MANUAL_______________________________________________ _18
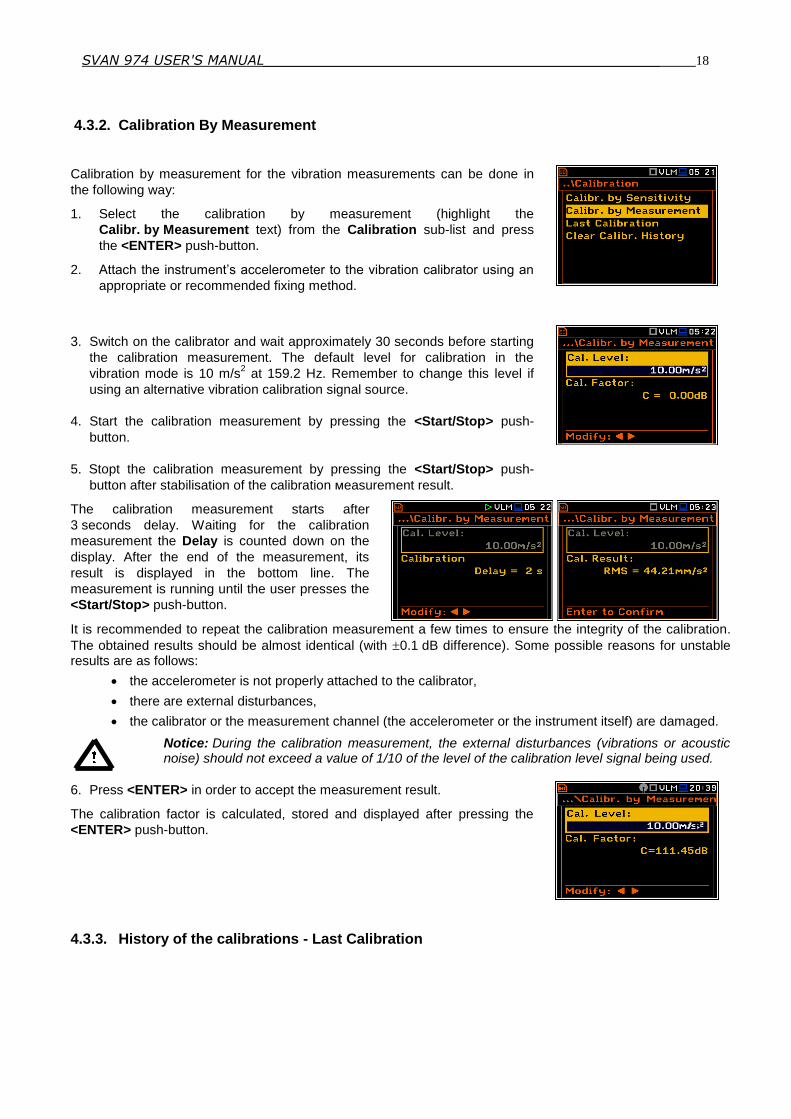
4.3.2. Calibration By Measurement
Calibration by measurement for the vibration measurements can be done in
the following way:
1. Select the calibration by measurement (highlight the
Calibr. by Measurement text) from the Calibration sub-list and press
the <ENTER> push-button.
2. Attach the instrument’s accelerometer to the vibration calibrator using an
appropriate or recommended fixing method.
3. Switch on the calibrator and wait approximately 30 seconds before starting
the calibration measurement. The default level for calibration in the
vibration mode is 10 m/s2 at 159.2 Hz. Remember to change this level if
using an alternative vibration calibration signal source.
4. Start the calibration measurement by pressing the <Start/Stop> push-
button.
5. Stopt the calibration measurement by pressing the <Start/Stop> push-
button after stabilisation of the сalibration мeasurement result.
The calibration measurement starts after
3 seconds delay. Waiting for the calibration
measurement the Delay is counted down on the
display. After the end of the measurement, its
result is displayed in the bottom line. The
measurement is running until the user presses the
<Start/Stop> push-button.
It is recommended to repeat the calibration measurement a few times to ensure the integrity of the calibration.
The obtained results should be almost identical (with 0.1 dB difference). Some possible reasons for unstable results are as follows:
the accelerometer is not properly attached to the calibrator,
there are external disturbances,
the calibrator or the measurement channel (the accelerometer or the instrument itself) are damaged.
Notice: During the calibration measurement, the external disturbances (vibrations or acoustic noise) should not exceed a value of 1/10 of the level of the calibration level signal being used.
6. Press <ENTER> in order to accept the measurement result.
The calibration factor is calculated, stored and displayed after pressing the
<ENTER> push-button.
4.3.3. History of the calibrations - Last Calibration
SVAN 974 USER'S MANUAL_______________________________________________ _19
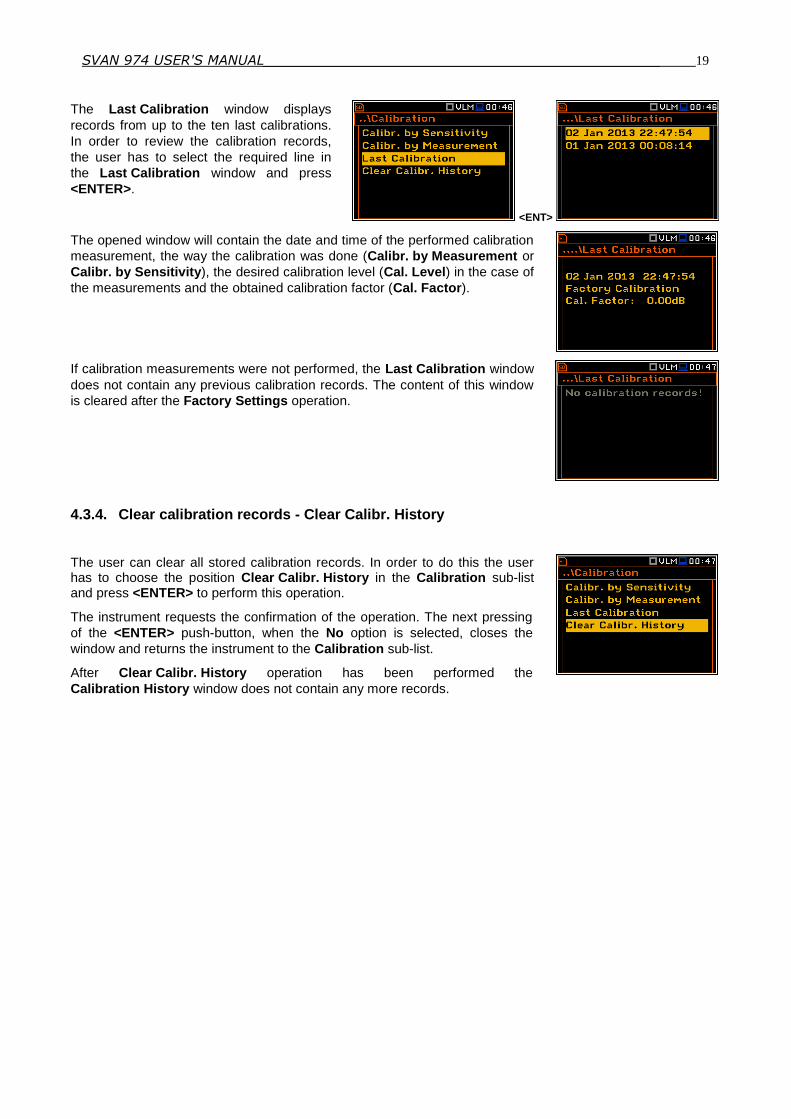
The Last Calibration window displays
records from up to the ten last calibrations.
In order to review the calibration records,
the user has to select the required line in
the Last Calibration window and press
<ENTER>.
<ENT>
The opened window will contain the date and time of the performed calibration
measurement, the way the calibration was done (Calibr. by Measurement or
Calibr. by Sensitivity), the desired calibration level (Cal. Level) in the case of
the measurements and the obtained calibration factor (Cal. Factor).
If calibration measurements were not performed, the Last Calibration window
does not contain any previous calibration records. The content of this window
is cleared after the Factory Settings operation.
4.3.4. Clear calibration records - Clear Calibr. History
The user can clear all stored calibration records. In order to do this the user has to choose the position Clear Calibr. History in the Calibration sub-list and press <ENTER> to perform this operation.
The instrument requests the confirmation of the operation. The next pressing
of the <ENTER> push-button, when the No option is selected, closes the
window and returns the instrument to the Calibration sub-list.
After Clear Calibr. History operation has been performed the
Calibration History window does not contain any more records.

SVAN 974 USER'S MANUAL_______________________________________________ _20
5. MEASUREMENT PARAMETERS SETTING – Measurement
The Measurement list contains the
elements that enable the user to set the
measurement parameters. To open the
Measurement list the user has to press the
<Menu> push-button, select the
Measurement text and press <ENTER>.
<ENT>
The Measurement list contains the following items:
General Settings enables the user to set various general measurement parameters;
Measure Trigger enables the user to set up the measurement trigger;
Profiles enables the user to program the profile parameters;
Logging enables the user to program the logging function;
Spectrum enables the user to set spectrum parameters;
Range enables the user to set the correct measurement range;
RPM enables the user to programme the measurements of rotational speed;
Timer enables the user to program the internal timer.
The content of the Measurement list is different
for different Measurement Function and other
settings. Some examples for different
measurement functions are presented.
Any parameter in the Measurement list can be changed only when the
instrument is not currently executing a measurement. The parameters are
displayed with grey colour. The blinking “►” icon on the top row indicates
that the instrument is performing a measurement.
5.1 Selection of measurement parameters - General Settings
The General Settings list consists of the following parameters: the delay of the
start of measurements (Start Delay), the maximum delay period for the
synchronization with RTC (Start Sync.), the integration period / measurement
run time (Integration Period), the repetition of the measurement cycles
(Repetition Cycles) and the RMS detector type (RMS Integration).

SVAN 974 USER'S MANUAL_______________________________________________ _21
Setting time delay before the start of measurements
The Start Delay position defines the delay period from the moment the
<Start/Stop> push-button is pressed to the start of the actual measurements
(the digital filters of the instrument constantly analyse the input signal even
when the measurement is stopped). This delay period can be set from
0 second to 60 seconds (with 1 second step by means of the <>, <>
push-buttons and with 10 seconds step by means of the <>, <> push-
buttons pressed together with <Shift>).
Notice: The minimum delay period is equal to 0 second. In the Calibration mode, the delay period is always equal to 3 seconds.
Setting synchronisation of the measurement start
The Start Sync. position defines maximum delay period from pressing the
<Start/Stop> push-button to the start of the measurements to allow
synchronisation with the instrument’s RTC. The Start Sync. parameter can be
set as: Off, 1m, 15m, 30m and 1h. For example, if 1h was selected, then each
measurement starts from the first second of next real time hour after pressing
<Start/Stop> push-button, and then each hour after Integr. Per, if
Rep. Cycles is greater than one. The default value is set to Off.
Switching on/off the integration period settings
The integration period can be set as infinite or can be defined together with the
Repetition Cycles number. The Integr. Period Inf position defines if the
period during which the signal is being measured is infinite or not. If the
Integr. Period Inf parameter is switched on then the signal will be averaged
all the time until the <Stop> push-button is pressed and the measurement is
stopped. If integration period is infinite, then two next positions become
inactive.
Setting the integration period
The Integr. Period position (integration
period) defines the period during which the
signal is being measured (integrated) and
stored as the set of Summary Results (SR).
The integration period can be set in the
special window, which is opened by pressing
the <> or <> push- buttons. <>
The measurement will stop automatically after this period, or the measurement will start again when the
selected Repetition Cycle is greater than one. The definitions of the measurement results in which the
integration period is used is given in App. D.
To set the integration period the user should define the required hours,
minutes and seconds fields.
The appropriate field may be selected by pressing the <> or <> push-
buttons.
Value of hour, minute and second is changing by means of the <> or
<> push- buttons.
Setting the number of repetition of measurement cycles
The Repetition Cycles position defines the number of cycles (with the
measurement period defined by Integration Period) to be performed by the
instrument. The Repetition Cycles number values are within the limits [1,
1000].
SVAN 974 USER'S MANUAL_______________________________________________ _22
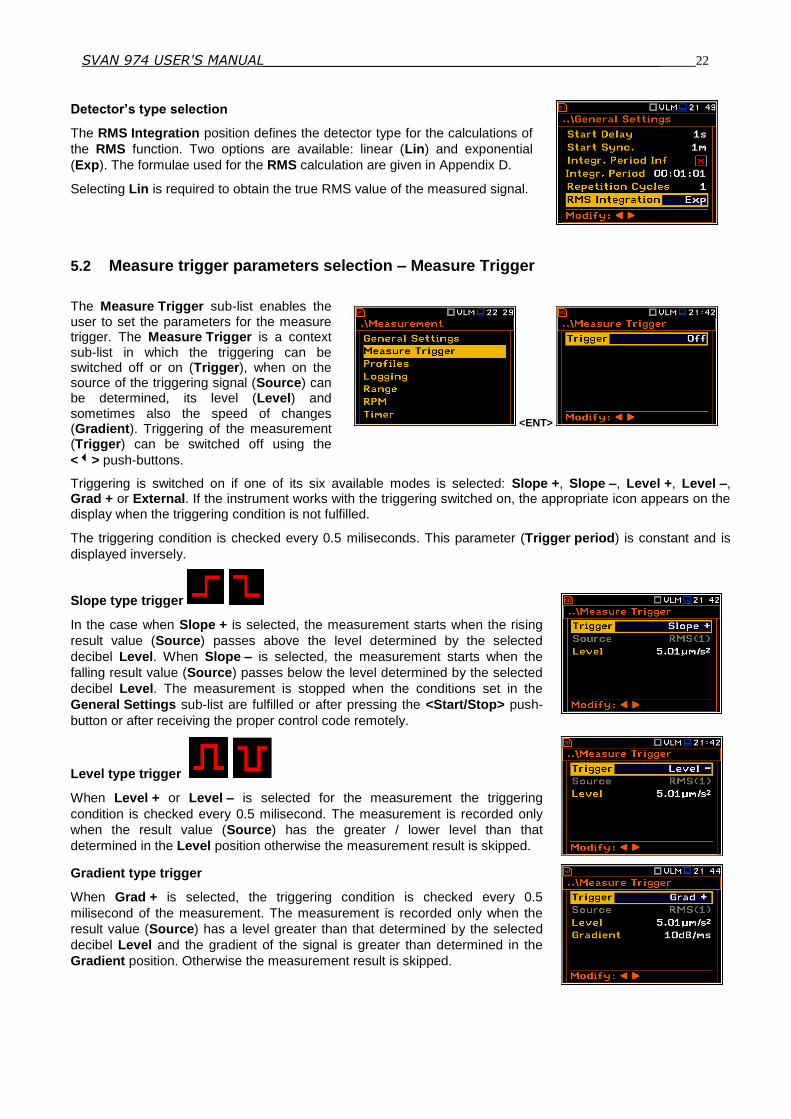
Detector’s type selection
The RMS Integration position defines the detector type for the calculations of
the RMS function. Two options are available: linear (Lin) and exponential
(Exp). The formulae used for the RMS calculation are given in Appendix D.
Selecting Lin is required to obtain the true RMS value of the measured signal.
5.2 Measure trigger parameters selection – Measure Trigger
The Measure Trigger sub-list enables the user to set the parameters for the measure trigger. The Measure Trigger is a context sub-list in which the triggering can be switched off or on (Trigger), when on the source of the triggering signal (Source) can be determined, its level (Level) and sometimes also the speed of changes (Gradient). Triggering of the measurement (Trigger) can be switched off using the
<> push-buttons.
<ENT>
Triggering is switched on if one of its six available modes is selected: Slope +, Slope –, Level +, Level –, Grad + or External. If the instrument works with the triggering switched on, the appropriate icon appears on the display when the triggering condition is not fulfilled.
The triggering condition is checked every 0.5 miliseconds. This parameter (Trigger period) is constant and is
displayed inversely.
Slope type trigger
In the case when Slope + is selected, the measurement starts when the rising
result value (Source) passes above the level determined by the selected
decibel Level. When Slope – is selected, the measurement starts when the
falling result value (Source) passes below the level determined by the selected
decibel Level. The measurement is stopped when the conditions set in the
General Settings sub-list are fulfilled or after pressing the <Start/Stop> push-
button or after receiving the proper control code remotely.
Level type trigger
When Level + or Level – is selected for the measurement the triggering
condition is checked every 0.5 milisecond. The measurement is recorded only
when the result value (Source) has the greater / lower level than that
determined in the Level position otherwise the measurement result is skipped.
Gradient type trigger
When Grad + is selected, the triggering condition is checked every 0.5
milisecond of the measurement. The measurement is recorded only when the
result value (Source) has a level greater than that determined by the selected
decibel Level and the gradient of the signal is greater than determined in the
Gradient position. Otherwise the measurement result is skipped.
SVAN 974 USER'S MANUAL_______________________________________________ _23
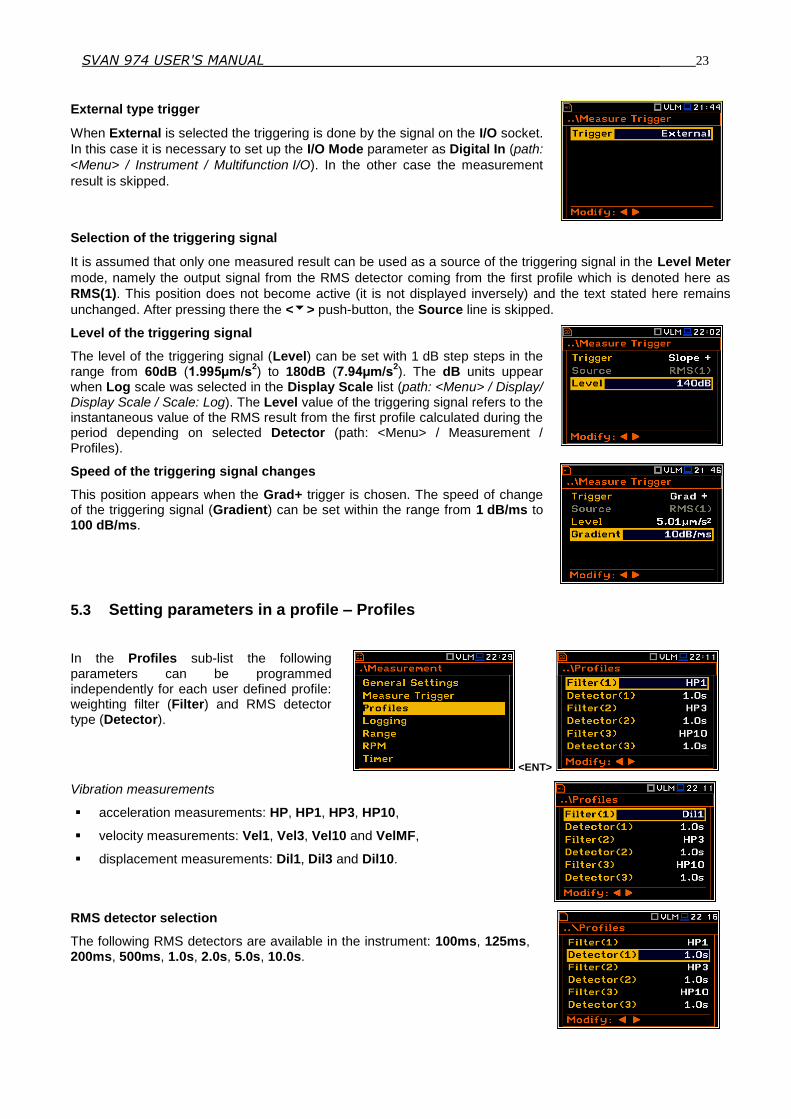
External type trigger
When External is selected the triggering is done by the signal on the I/O socket.
In this case it is necessary to set up the I/O Mode parameter as Digital In (path:
<Menu> / Instrument / Multifunction I/O). In the other case the measurement
result is skipped.
Selection of the triggering signal
It is assumed that only one measured result can be used as a source of the triggering signal in the Level Meter
mode, namely the output signal from the RMS detector coming from the first profile which is denoted here as
RMS(1). This position does not become active (it is not displayed inversely) and the text stated here remains
unchanged. After pressing there the <> push-button, the Source line is skipped.
Level of the triggering signal
The level of the triggering signal (Level) can be set with 1 dB step steps in the range from 60dB (1.995µm/s
2) to 180dB (7.94µm/s
2). The dB units uppear
when Log scale was selected in the Display Scale list (path: <Menu> / Display/ Display Scale / Scale: Log). The Level value of the triggering signal refers to the instantaneous value of the RMS result from the first profile calculated during the period depending on selected Detector (path: <Menu> / Measurement / Profiles).
Speed of the triggering signal changes
This position appears when the Grad+ trigger is chosen. The speed of change of the triggering signal (Gradient) can be set within the range from 1 dB/ms to 100 dB/ms.
5.3 Setting parameters in a profile – Profiles
In the Profiles sub-list the following parameters can be programmed independently for each user defined profile: weighting filter (Filter) and RMS detector type (Detector).
<ENT>
Vibration measurements
acceleration measurements: HP, HP1, HP3, HP10,
velocity measurements: Vel1, Vel3, Vel10 and VelMF,
displacement measurements: Dil1, Dil3 and Dil10.
RMS detector selection
The following RMS detectors are available in the instrument: 100ms, 125ms, 200ms, 500ms, 1.0s, 2.0s, 5.0s, 10.0s.

SVAN 974 USER'S MANUAL_______________________________________________ _24
5.4 Setting the data logging functionality – Logging
The Logging list enables the user to program the logger functions: the recording of the measurement time history results. The Logging list consists of three positions: Logger Setup, Logger Results and Logger Trigger.
<ENT>
5.4.1 Data logger programming – Logger Setup
The Logger Setup list enables the user to activate logger functionality and meteo results logging. It also allows to edit the name of the logger file and to set the logger step.
<ENT>
Notice: If Logger is Off, files are not created and measurement results of the time history changes are not saved!
The Logger position switches on and off the functionality, which enables the user to save selected results from the three user profiles with the defined period selected in Logger Step.
<>
The Summary Results position allows the user to select or deselect the saving of the full set of profile results that the instrument generates during total measurement time and which are not belonged to the time history data.These results are: RMS, Ovl, Peak, P-P.
The Logger Name position enables the user to define the logger file name. The default name is LOG. The name can be up to eight
characters long. After pressing the <>,
<> push-buttons, the special window with text editing function is opened.
<>
The edited name is accepted and saved after pressing the <ENTER> push-button. The special warning is displayed in case a file with the edited name already exists in the memory. The instrument waits then for a reaction of the user (any push-button should be pressed except <Shift> or <Alt>).
<ENT>
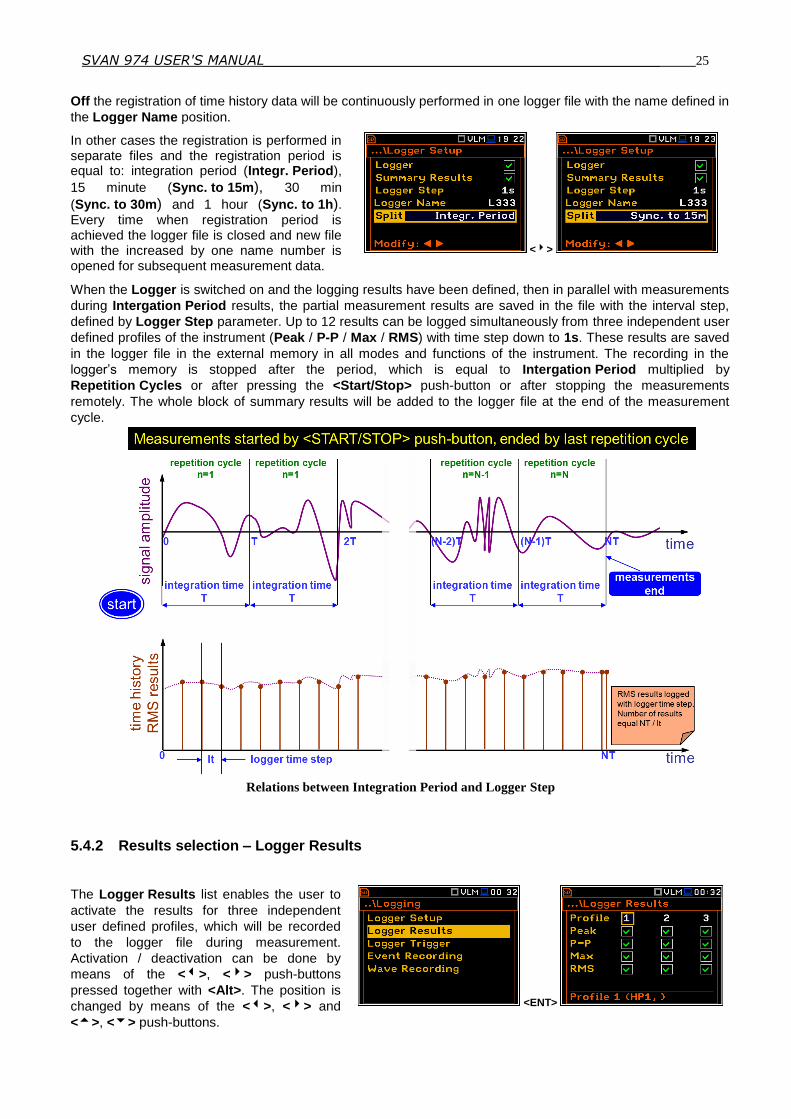
The Split position enables the user to split the logger registration data into separate files. If Split parameter is
SVAN 974 USER'S MANUAL_______________________________________________ _25
Off the registration of time history data will be continuously performed in one logger file with the name defined in
the Logger Name position.
In other cases the registration is performed in separate files and the registration period is equal to: integration period (Integr. Period),
15 minute (Sync. to 15m), 30 min
(Sync. to 30m) and 1 hour (Sync. to 1h). Every time when registration period is achieved the logger file is closed and new file with the increased by one name number is opened for subsequent measurement data.
<>
When the Logger is switched on and the logging results have been defined, then in parallel with measurements
during Intergation Period results, the partial measurement results are saved in the file with the interval step,
defined by Logger Step parameter. Up to 12 results can be logged simultaneously from three independent user
defined profiles of the instrument (Peak / P-P / Max / RMS) with time step down to 1s. These results are saved
in the logger file in the external memory in all modes and functions of the instrument. The recording in the
logger’s memory is stopped after the period, which is equal to Intergation Period multiplied by
Repetition Cycles or after pressing the <Start/Stop> push-button or after stopping the measurements
remotely. The whole block of summary results will be added to the logger file at the end of the measurement
cycle.
Relations between Integration Period and Logger Step
5.4.2 Results selection – Logger Results
The Logger Results list enables the user to
activate the results for three independent
user defined profiles, which will be recorded
to the logger file during measurement.
Activation / deactivation can be done by
means of the <>, <> push-buttons
pressed together with <Alt>. The position is
changed by means of the <>, <> and
<>, <> push-buttons.
<ENT>
SVAN 974 USER'S MANUAL_______________________________________________ _26
Notice: When Logger is switched off or there are no results for logging, the logger plot cannot
be activated in Disp. Modes and accordingly doesn’t appear on the display.
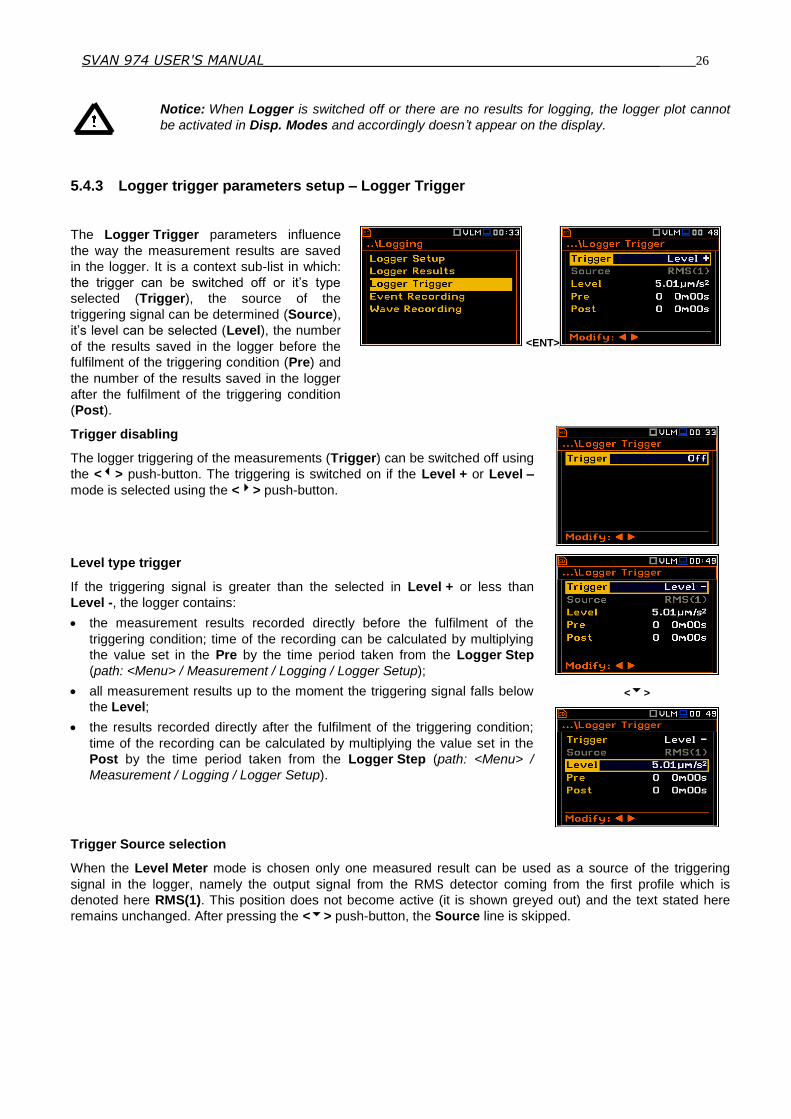
5.4.3 Logger trigger parameters setup – Logger Trigger
The Logger Trigger parameters influence
the way the measurement results are saved
in the logger. It is a context sub-list in which:
the trigger can be switched off or it’s type
selected (Trigger), the source of the
triggering signal can be determined (Source),
it’s level can be selected (Level), the number
of the results saved in the logger before the
fulfilment of the triggering condition (Pre) and
the number of the results saved in the logger
after the fulfilment of the triggering condition
(Post).
<ENT>
Trigger disabling
The logger triggering of the measurements (Trigger) can be switched off using
the <> push-button. The triggering is switched on if the Level + or Level –
mode is selected using the <> push-button.
Level type trigger
If the triggering signal is greater than the selected in Level + or less than
Level -, the logger contains:
the measurement results recorded directly before the fulfilment of the
triggering condition; time of the recording can be calculated by multiplying
the value set in the Pre by the time period taken from the Logger Step
(path: <Menu> / Measurement / Logging / Logger Setup);
all measurement results up to the moment the triggering signal falls below
the Level;
the results recorded directly after the fulfilment of the triggering condition;
time of the recording can be calculated by multiplying the value set in the
Post by the time period taken from the Logger Step (path: <Menu> /
Measurement / Logging / Logger Setup).
<>
Trigger Source selection
When the Level Meter mode is chosen only one measured result can be used as a source of the triggering
signal in the logger, namely the output signal from the RMS detector coming from the first profile which is
denoted here RMS(1). This position does not become active (it is shown greyed out) and the text stated here
remains unchanged. After pressing the <> push-button, the Source line is skipped.

SVAN 974 USER'S MANUAL_______________________________________________ _27
When the 1/1 Octave or 1/3 Octave mode is chosen it is possible to use the
RMS band-pass value of the 1/1 octave or 1/3 octave spectrum filters with
appropriate central frequency as a source of the triggering signal for the
logger.
Available values for the Source parameter for the 1/1 Octave mode:
Leq (1)/RMS(1), 125Hz, 250Hz, 500Hz, 1.00kHz, 2.00kHz, 4.00kHz, 8.00kHz,
16.0kHz.
Available values of the Source parameter for the 1/3 Octave mode:
Leq (1)/RMS(1), 125Hz, 160Hz, 200Hz, 250Hz, 315Hz, 400Hz, 500Hz,
630Hz, 800Hz, 1.00kHz, 1.25kHz, 1.60kHz, 2.00kHz, 2.50kHz, 3.15kHz,
4.00kHz, 5.00kHz, 6.30kHz, 8.00kHz, 10.0kHz, 12.5kHz, 16.0kHz, 20.0kHz.
Level of the triggering signal
The level of the triggering signal (Level) can be set with 1 dB step steps in the range from 60dB (1.995µm/s
2) to 180dB (7.94µm/s
2). The dB units uppear
when Log scale was selected in the Display Scale list (path: <Menu> / Display/ Display Scale / Scale: Log). The Level value of the triggering signal refers to the instantaneous value of the RMS result from the first profile calculated during the period depending on selected Detector (path: <Menu> / Measurement / Profiles).
Pre and post trigger recording
In the Pre line the number of the results recorded in the logger’s file before the
fulfilment of the triggering condition can be set. This number is within the limits
0..50.
In the Post line the number of the results recorded in the logger’s file after the
fulfilment of the triggering condition can be set. This number is within the limits
0..200.
The period of the measurements that are saved in the logger before or after
the fulfilment of the triggering condition can be calculated by multiplying the
value set in the Pre or Post positions by the value set in the Logger Step
position (path: <Menu> / Measurement / Logging / Logger Setup). The result
of the calculation is presented in the same line, at the right side of the display.
=>
5.4.4 Event recording setup – Event Recording
The Event Recording position enables the
user to activate and set the parameters of
event waveform signal recording on the
external memory (SD Card).
The Events position, if it is not Off, defines
the type of events recording: Continuous
or On Trigger. <ENT>
When On Trigger event recording is
chosen then additional positions appear
which enable the user to programme the
trigger conditions for the event recording.
The Audio Sampling position enables the
user to select the sampling frequency of the
event recording: 12KHz, 24kHz and 48kHz. <>

SVAN 974 USER'S MANUAL_______________________________________________ _28
The Bits Per Sample position enables the user to select the number of
recorded bits per sample: 16 or 24.
The Signal Gain position enables the user to select the gain of the recorded
signal, when 16 bits per sample was selected: 0dB … 40dB.
The Filter position informs the user about used weigting filter: HP.
The Trigger on Marker position switches on or off the triggering by marker.
When Trigger On Marker is switched on then event recording will start by
initiation of one of the user controlled markers. Markers for triggering are
defined in the Markers Setup window.
In the Trigger position the following options
are available: Off, Slope +, Slope –,
Level +, Level – and External.
<>…
The Source position only indicates the triggering signal source. Only one measured result can be used as a
source of the triggering signal in all modes, namely the output signal from the RMS detector coming from the
first profile which is denoted here as RMS(1). This position does not become active (it is not displayed inversely)
and the text shown here remains unchanged. After pressing the <> push-button, the Source line is skipped.
The level of the triggering signal (Level) can be set with 1 dB step steps in the
range from 60dB (1.995µm/s2) to 180dB (7.94µm/s
2). The dB units uppear
when Log scale was selected in the Display Scale list (path: <Menu> /
Display/ Display Scale / Scale: Log). The Level value of the triggering signal
refers to the instantaneous value of the RMS result from the first profile
calculated during the period depending on selected Detector (path: <Menu> /
Measurement / Profiles).
In the Trigger Period position it is possible to select the time interval of
checking the triggering conditions. This parameter can be set on: Log. Step
(same as Logger Step value), 0.5ms, 100.0ms and 1s.
In the Rec. Time position it is possible to select the time of signal recording
after triggering. If another triggering condition that satisfies the selected
conditions appears then the signal will be recorded for an additional
Rec. Time. The available values can be selected from 1s to 8h.
When Pre Trigger is switched on then the event signal starts to record before
the triggering condition. This parameter can be set on: 0s, 1s and 2s.

SVAN 974 USER'S MANUAL_______________________________________________ _29
5.4.5 Wave recording setup – Wave Recording
The Wave Recording enables the user to
activate and to set the parameters of the
raw time waveform recording on the
external memory (SD Card).
The Wave Rec. position, if it is not Off,
defines the type of the wave recording:
Continuous or On Trigger. <ENT>
The Format position enables the user to
select the format of the wave file header:
PCM or Extensible.
The Audio Sampling position enables the
user to select the sampling frequency of the
wave recording: 12 kHz, 24 kHz and 48
kHz.
<>
The Bits Per Sample position enables the user to select the number of
recorded bits per sample: 16 or 24.
The Signal Gain position enables the user to select the gain of the recorded
signal, when 16 bits per sample was selected: 0dB … 40dB.
The Filter position informs the user about used weigting filter: HP.
The File Name position enables the user to
edit the name of the wave file.
<>
The Wave Recording enables the user to activate and programme the
wave recorder trigger. This option became active only when the value of the
Wave Rec. parameter was set as On Trigger.
In the Trigger position the following options are available: Slope +, Slope ,
Level +, Level – and External.
The Source position indicates the triggering signal source. Only one measured result can be used as a source
of the triggering signal in all modes, namely the output signal from the RMS detector coming from the first profile
which is denoted here as RMS(1). This position does not become active (it is not displayed inversely) and the
text shown here remains unchanged. After pressing the <> push-button the Source line is skipped.

SVAN 974 USER'S MANUAL_______________________________________________ _30
The level of the triggering signal (Level) can be set with 1 dB step steps in
the range from 60dB (1.995µm/s2) to 180dB (7.94µm/s
2). The dB units
uppear when Log scale was selected in the Display Scale list (path:
<Menu> / Display/ Display Scale / Scale: Log). The Level value of the
triggering signal refers to the instantaneous value of the RMS result from the
first profile calculated during the period depending on selected Detector
(path: <Menu> / Measurement / Profiles).
In the Trigger Period position it is possible to select the time interval of
checking the triggering conditions. This parameter can be set on: Log. Step
(same as Logger Step value), 0.5ms, 100.0ms and 1s.
In the Rec. Time position it is possible to select the time of signal recording
after triggering. If another triggering condition that satisfies the selected
conditions appears then the signal will be recorded for an additional
Rec. Time. The available values can be selected from 1s to 8h.
When Pre Trigger is switched on then the event signal starts to record
before the triggering condition. This parameter can be set on: 0s, 1s and 2s.
5.5 Selection of the 1/1 Octave and 1/3 Octave spectrum parameters – Spectrum
The Spectrum position appears in the Measurement list when the
1/1 Octave or 1/3 Octave function is selected in the
Measurement Function list (path: <Menu> / Function /
Measurement Function / 1/1 Octave or 1/3 Octave). See section 10 for more
details.
5.6 Measurement range setting – Range
The Range position is used to view the
available measurement range in the
instrument.
The absolute range value changes due to
the calibration factor and are shown on the
screen.
<ENT>
There is one available range: Single. The detailed description of the
measurement range is given in App. C. The range can be also presented in
logarithmic units. For this purpose the user should select Log for the Scale
parameter (path: <Menu> / Display / Display Scale).
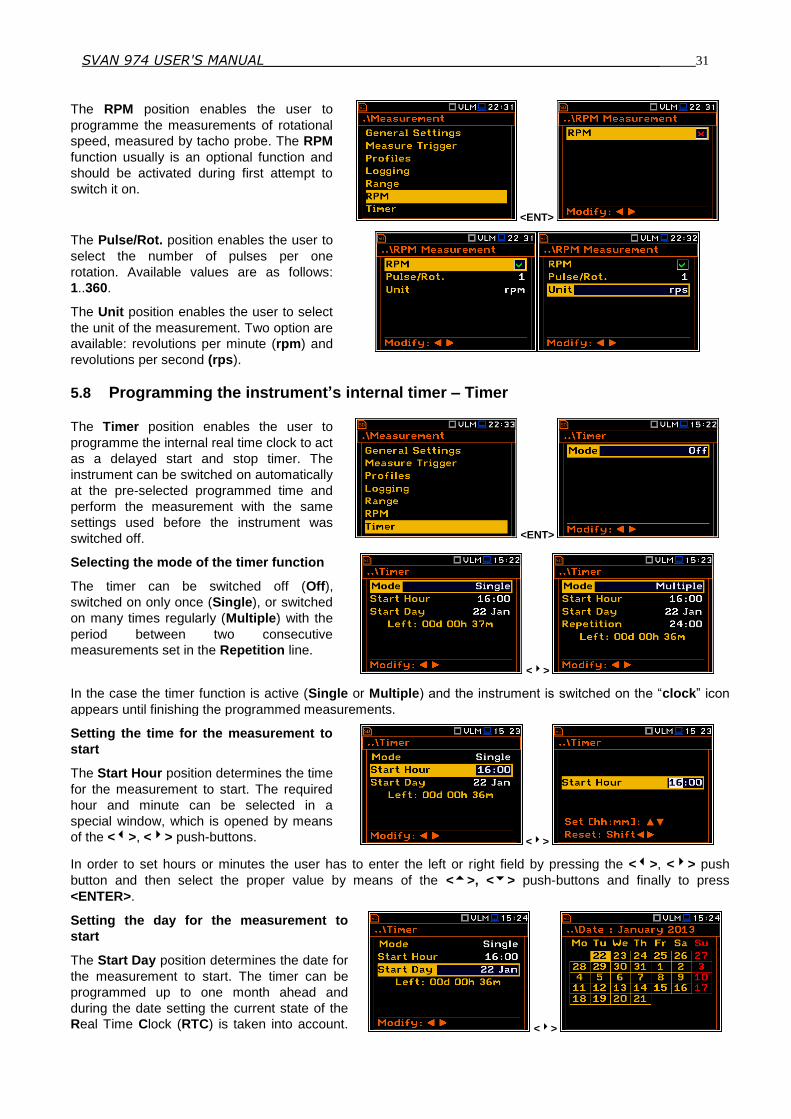
5.7 Programming the RPM measurements parameters – RPM
SVAN 974 USER'S MANUAL_______________________________________________ _31
The RPM position enables the user to
programme the measurements of rotational
speed, measured by tacho probe. The RPM
function usually is an optional function and
should be activated during first attempt to
switch it on.
<ENT>
The Pulse/Rot. position enables the user to
select the number of pulses per one
rotation. Available values are as follows:
1..360.
The Unit position enables the user to select
the unit of the measurement. Two option are
available: revolutions per minute (rpm) and
revolutions per second (rps).
5.8 Programming the instrument’s internal timer – Timer
The Timer position enables the user to
programme the internal real time clock to act
as a delayed start and stop timer. The
instrument can be switched on automatically
at the pre-selected programmed time and
perform the measurement with the same
settings used before the instrument was
switched off. <ENT>
Selecting the mode of the timer function
The timer can be switched off (Off),
switched on only once (Single), or switched
on many times regularly (Multiple) with the
period between two consecutive
measurements set in the Repetition line.
<>
In the case the timer function is active (Single or Multiple) and the instrument is switched on the “clock” icon
appears until finishing the programmed measurements.
Setting the time for the measurement to
start
The Start Hour position determines the time
for the measurement to start. The required
hour and minute can be selected in a
special window, which is opened by means
of the <>, <> push-buttons. <>
In order to set hours or minutes the user has to enter the left or right field by pressing the <>, <> push
button and then select the proper value by means of the <>, <> push-buttons and finally to press
<ENTER>.
Setting the day for the measurement to
start
The Start Day position determines the date for
the measurement to start. The timer can be
programmed up to one month ahead and
during the date setting the current state of the
Real Time Clock (RTC) is taken into account. <>
SVAN 974 USER'S MANUAL_______________________________________________ _32
The required date can be selected in a special
window, which is opened by means of the
<>, <> push-buttons.
In order to set date the user has to select its position by means of the <> , <> and <>, <> push button
and then press <ENTER>.
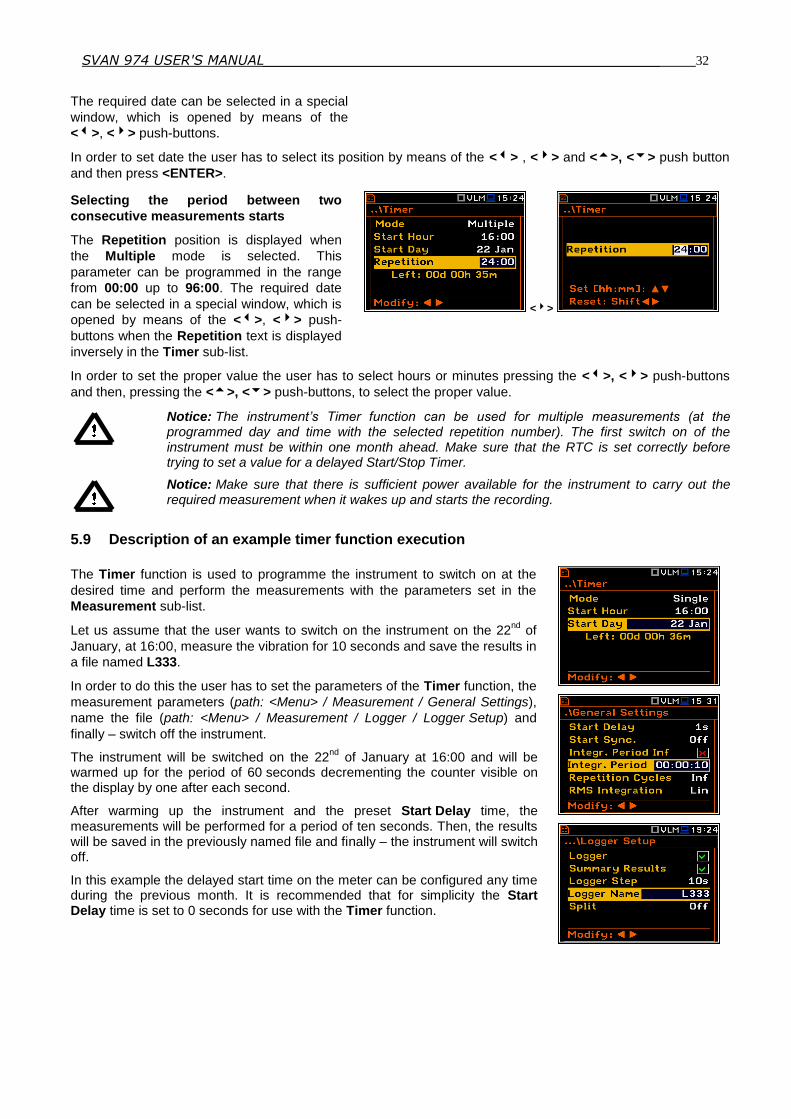
Selecting the period between two
consecutive measurements starts
The Repetition position is displayed when
the Multiple mode is selected. This
parameter can be programmed in the range
from 00:00 up to 96:00. The required date
can be selected in a special window, which is
opened by means of the <>, <> push-
buttons when the Repetition text is displayed
inversely in the Timer sub-list.
<>
In order to set the proper value the user has to select hours or minutes pressing the <>, <> push-buttons
and then, pressing the <>, <> push-buttons, to select the proper value.
Notice: The instrument’s Timer function can be used for multiple measurements (at the programmed day and time with the selected repetition number). The first switch on of the instrument must be within one month ahead. Make sure that the RTC is set correctly before trying to set a value for a delayed Start/Stop Timer.
Notice: Make sure that there is sufficient power available for the instrument to carry out the required measurement when it wakes up and starts the recording.
5.9 Description of an example timer function execution
The Timer function is used to programme the instrument to switch on at the
desired time and perform the measurements with the parameters set in the
Measurement sub-list.
Let us assume that the user wants to switch on the instrument on the 22nd
of
January, at 16:00, measure the vibration for 10 seconds and save the results in
a file named L333.
In order to do this the user has to set the parameters of the Timer function, the
measurement parameters (path: <Menu> / Measurement / General Settings),
name the file (path: <Menu> / Measurement / Logger / Logger Setup) and
finally – switch off the instrument.
The instrument will be switched on the 22nd
of January at 16:00 and will be warmed up for the period of 60 seconds decrementing the counter visible on the display by one after each second.
After warming up the instrument and the preset Start Delay time, the measurements will be performed for a period of ten seconds. Then, the results will be saved in the previously named file and finally – the instrument will switch off.
In this example the delayed start time on the meter can be configured any time during the previous month. It is recommended that for simplicity the Start Delay time is set to 0 seconds for use with the Timer function.
SVAN 974 USER'S MANUAL_______________________________________________ _33
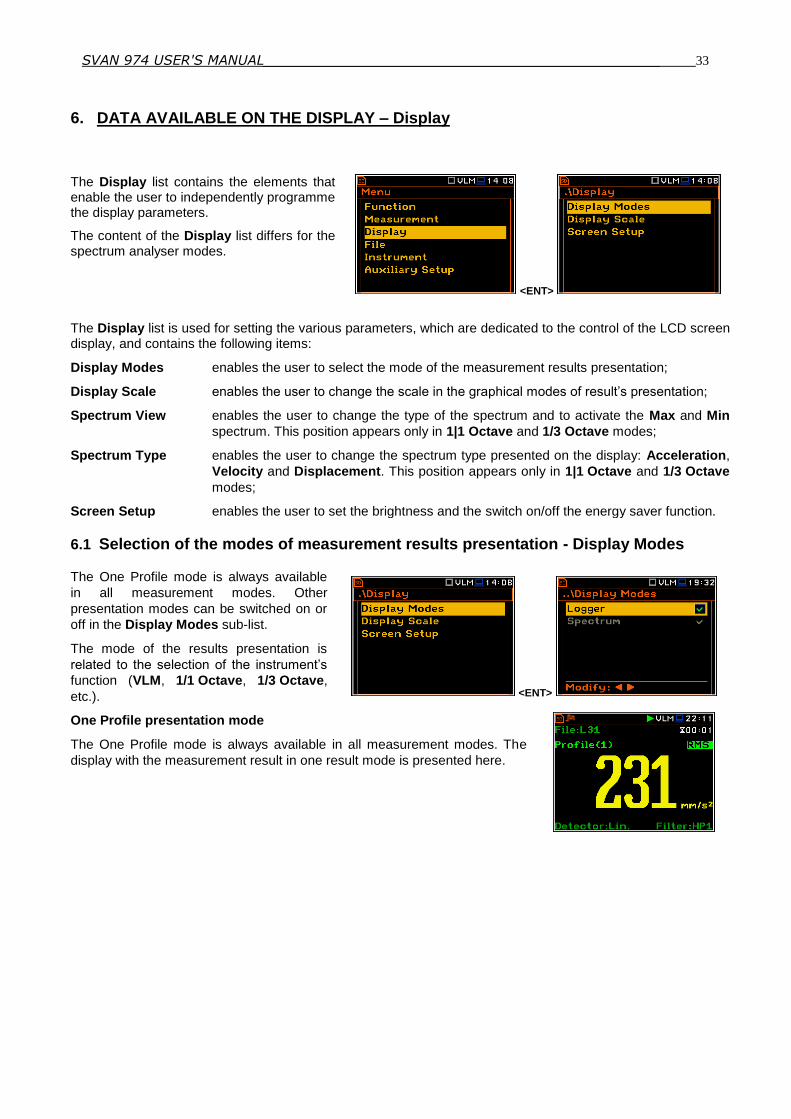
6. DATA AVAILABLE ON THE DISPLAY – Display
The Display list contains the elements that enable the user to independently programme the display parameters.
The content of the Display list differs for the spectrum analyser modes.
<ENT>
The Display list is used for setting the various parameters, which are dedicated to the control of the LCD screen display, and contains the following items:
Display Modes enables the user to select the mode of the measurement results presentation;
Display Scale enables the user to change the scale in the graphical modes of result’s presentation;
Spectrum View enables the user to change the type of the spectrum and to activate the Max and Min
spectrum. This position appears only in 1|1 Octave and 1/3 Octave modes;
Spectrum Type enables the user to change the spectrum type presented on the display: Acceleration,
Velocity and Displacement. This position appears only in 1|1 Octave and 1/3 Octave
modes;
Screen Setup enables the user to set the brightness and the switch on/off the energy saver function.
6.1 Selection of the modes of measurement results presentation - Display Modes
The One Profile mode is always available
in all measurement modes. Other
presentation modes can be switched on or
off in the Display Modes sub-list.
The mode of the results presentation is
related to the selection of the instrument’s
function (VLM, 1/1 Octave, 1/3 Octave,
etc.). <ENT>
One Profile presentation mode
The One Profile mode is always available in all measurement modes. The
display with the measurement result in one result mode is presented here.
SVAN 974 USER'S MANUAL_______________________________________________ _34
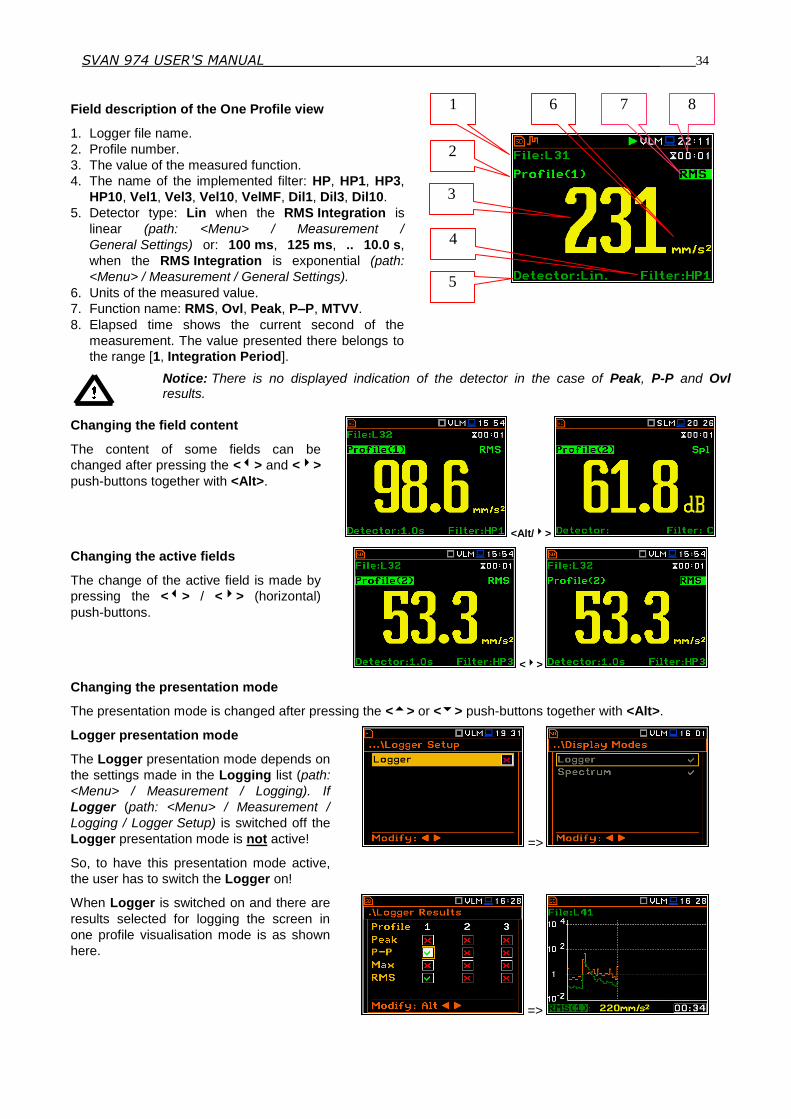
Field description of the One Profile view
1. Logger file name.
2. Profile number.
3. The value of the measured function.
4. The name of the implemented filter: HP, HP1, HP3,
HP10, Vel1, Vel3, Vel10, VelMF, Dil1, Dil3, Dil10.
5. Detector type: Lin when the RMS Integration is
linear (path: <Menu> / Measurement /
General Settings) or: 100 ms, 125 ms, .. 10.0 s,
when the RMS Integration is exponential (path:
<Menu> / Measurement / General Settings).
6. Units of the measured value.
7. Function name: RMS, Ovl, Peak, P–P, MTVV.
8. Elapsed time shows the current second of the
measurement. The value presented there belongs to
the range [1, Integration Period].
Notice: There is no displayed indication of the detector in the case of Peak, P-P and Ovl results.
Changing the field content
The content of some fields can be
changed after pressing the <> and <>
push-buttons together with <Alt>.
<Alt/>
Changing the active fields
The change of the active field is made by
pressing the <> / <> (horizontal)
push-buttons.
<>
Changing the presentation mode
The presentation mode is changed after pressing the <> or <> push-buttons together with <Alt>.
Logger presentation mode
The Logger presentation mode depends on
the settings made in the Logging list (path:
<Menu> / Measurement / Logging). If
Logger (path: <Menu> / Measurement /
Logging / Logger Setup) is switched off the
Logger presentation mode is not active!
So, to have this presentation mode active,
the user has to switch the Logger on!
=>
When Logger is switched on and there are
results selected for logging the screen in
one profile visualisation mode is as shown
here.
=>
6 1
3
7
5
4
8
2

SVAN 974 USER'S MANUAL_______________________________________________ _35
2
3
7
8
1 6
4 5 Field description of the Logger view
1. Y-scale
2. Logger plot
3. Name of the logged result and profile
number
4. Name of the logger file
5. Real Time Clock
6. Cursor position
7. Result value for the cursor position
8. Cursor time position
The user may change the cursor position by
means of the <>, <> push-buttons.
<>...
Spectrum presentation mode
The Spectrum position is accessible only
for active 1/1 Octave, 1/3 Octave and FFT
functions (path: <Menu> / Function /
Measurement Function).
=>
Field description of the Spectrum view
1. Type of spectrum
2. Cursor position
3. Value for the cursor position
4. Averaging used (Lin or Exp)
5. Spectrum plot
6. Frequency weighting filter used
7. Total values
8. Central frequency for the cursor position
The user may shift the Y-axis during the
spectrum presentation after pressing the
<Shift> and <> (or <Shift> and <>)
push-buttons.
<Sh/>
2
3
7
8
1 6
4 5

SVAN 974 USER'S MANUAL_______________________________________________ _36
The user may change the cursor position by
means of the <>, <> push-buttons. The
frequency and the appropriate value are
presented in the line below the plot. Press
the <>, <> push-buttons with <Shift>
to move straight to the first or last displayed
band on screen. <> .
6.2 Setting the scale of the presentation and the display grid - Display Scale
The Display Scale sub-list enables the user
to change the displayed dynamic scale in the
available modes of graphical presentation of
the measurement results and switch the grid
on/off.
<ENT>
Setting the scale of the measurement
results presentation
In the Scale position two options are
available: Lin (linear) and Log (logarithmic).
In case of Lin the graphical presentation and
the units are linear. In case of Log the
graphical presentation is given in the
logarithmic scale and the measurement
results are expressed in decibels (the result is
related to the values set in the
Reference Levels window (path: <Menu> /
Auxiliary Setup / Reference Levels).
<>
Scaling the vertical axis
The Dynamic position enables the user to
select the required dynamic range scaling of
the graphical mode display presentation. It is
possible to select the range from the set:
10dB, 20dB, 40dB, 80dB, 100dB and
120dB. <>

SVAN 974 USER'S MANUAL_______________________________________________ _37
Switching the grid on/off
The Grid position enables the user to switch
on or off the horizontal grid lines in any
graphical presentation.
=>
6.3 Setting the parameters of the spectrum presentation - Spectrum View
The Spectrum View position appears when
1/1 Octave or 1/3 Octave functions is
selected in the Measurement Function
window and enables the user to change the
type of the spectrum (Type) and to activate
the presentation on the display of the Max
and Min values for every displayed
spectrum band. <ENT>
In the Type position the user may choose
the following different spectrum type to be
presented on the display in the graphical
presentation modes: Averaged,
Instantaneous, Max and Min.
<>
The minimum and maximum spectra can be
presented at the same plot as main
spectrum when the Max or Min parameter
is switched on. A red line shows the
maximum levels in every band while a blue
line shows the minimum levels if selected
by the user. =>
6.4 Selection of the Spectrum Type - Spectrum Type
The Spectrum Type position enables the
user to change the vibration spectrum
type. This sub-list contains three
positions: Acceleration, Velocity or
Displacement.
<ENT>
6.5 Setting the display brightness and power saver- Screen Setup

SVAN 974 USER'S MANUAL_______________________________________________ _38
The Screen Setup window enables the user to set the brightness of the display and to switch on the screen saver.
<ENT>
Setting the brightness of the display
The Brightness position enables the user to set the proper brightness of the
display by means of the <>, <> push-buttons. The user can select 20 different values of this parameter. The new value of the brightness level is
confirmed after each press of the <> or <> push-buttons.
Setting the power saver function
The saving of the internal source of the instrument’s power can be achieved
by means of reducing the brightness of the screen when possible.
There are two options for the power saver function. The screen may be
switched off (Screen off on idle) and/or dimmed (Dim screen on idle).
When either of these options is set, after a delay, set by the parameters
Dim screen delay or Screen off delay, from pressing any push-button the
screen is dimmed or switched off. If it happened, the first press of any push-
button will cause the screen to switch back on again.
Setting the power saver delay
The power saver delay defines the delay period from last use of any push-button to the power saver mode. This delay period can be set for Dim screen on idle from 5 s to 60 s and for Screen off on idle from 1 m to 60 m. The <ENTER> push-button must be pressed for confirmation of the selection, which then also closes the Screen Setup window.
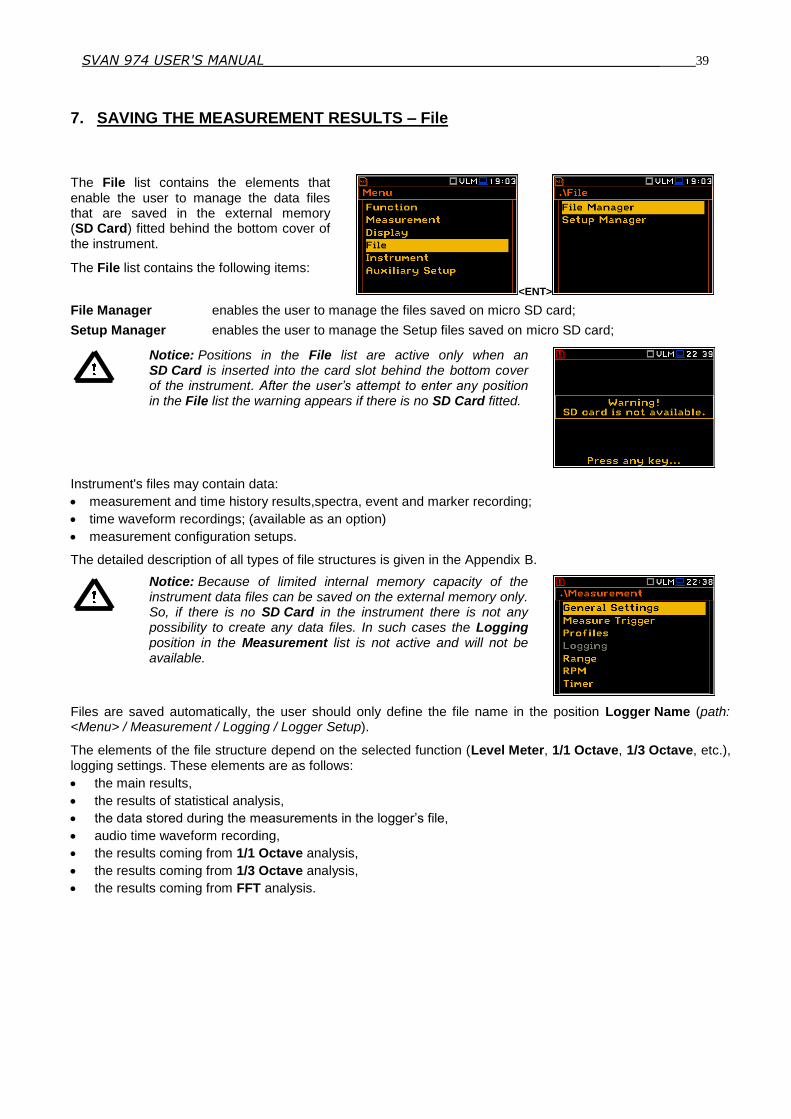
SVAN 974 USER'S MANUAL_______________________________________________ _39
7. SAVING THE MEASUREMENT RESULTS – File
The File list contains the elements that enable the user to manage the data files that are saved in the external memory (SD Card) fitted behind the bottom cover of the instrument.
The File list contains the following items:
<ENT>
File Manager enables the user to manage the files saved on micro SD card;
Setup Manager enables the user to manage the Setup files saved on micro SD card;
Notice: Positions in the File list are active only when an SD Card is inserted into the card slot behind the bottom cover of the instrument. After the user’s attempt to enter any position in the File list the warning appears if there is no SD Card fitted.
Instrument's files may contain data:
measurement and time history results,spectra, event and marker recording;
time waveform recordings; (available as an option)
measurement configuration setups.
The detailed description of all types of file structures is given in the Appendix B.
Notice: Because of limited internal memory capacity of the instrument data files can be saved on the external memory only. So, if there is no SD Card in the instrument there is not any possibility to create any data files. In such cases the Logging position in the Measurement list is not active and will not be available.
Files are saved automatically, the user should only define the file name in the position Logger Name (path: <Menu> / Measurement / Logging / Logger Setup).
The elements of the file structure depend on the selected function (Level Meter, 1/1 Octave, 1/3 Octave, etc.), logging settings. These elements are as follows:
the main results,
the results of statistical analysis,
the data stored during the measurements in the logger’s file,
audio time waveform recording,
the results coming from 1/1 Octave analysis,
the results coming from 1/3 Octave analysis,
the results coming from FFT analysis.

SVAN 974 USER'S MANUAL_______________________________________________ _40
7.1 Managing the files saved in the external memory – File Manager
File manager
The File Manager is used for checking the
contents of the memory, delete files and
catalogues, create new catalogues and select
catalogue for saving new files.
All file names are of upper case letters and
have no extensions. Catalogue names are of
upper case letters. Catlogues and files are
distingueshed with special icons.
<ENT>
The list of files and catalogues is presented in
the File Manager window. Files are stored in
catalogues, which are organised
hierarchically. By pressing the <ENTER>
push-button the window with the list of
available operations is opening for the
marked (highlighted) position. <ENT>
Creating new catalogue
The first position of the File Manager list is New Directory, which creates the new catalogue.
In order to create the new catalogue the user should enter the catalogue in which the new one will be created and press the <ENTER> push-button at the New Directory position.
<ENT>
The marked catalogue can be opened by
means of the <> push-button.
To return to the upper catalogue the user has
to press the <> push-button.
<>
7.1.1 Setting the directory for saving files – Set as Working Dir.
It is possible to assign the catalogue for automatically saving logger files. In order to do this the user should choose the required catalogue and press the <ENTER> push-button. After opening the list of operations the user should select Set as Working Dir. and press the <ENTER> push-button.
<ENT>
Notice: The working catalogue name is displayed on the bottom line of the screen.
7.1.2 Deleting file/catalogue – Delete
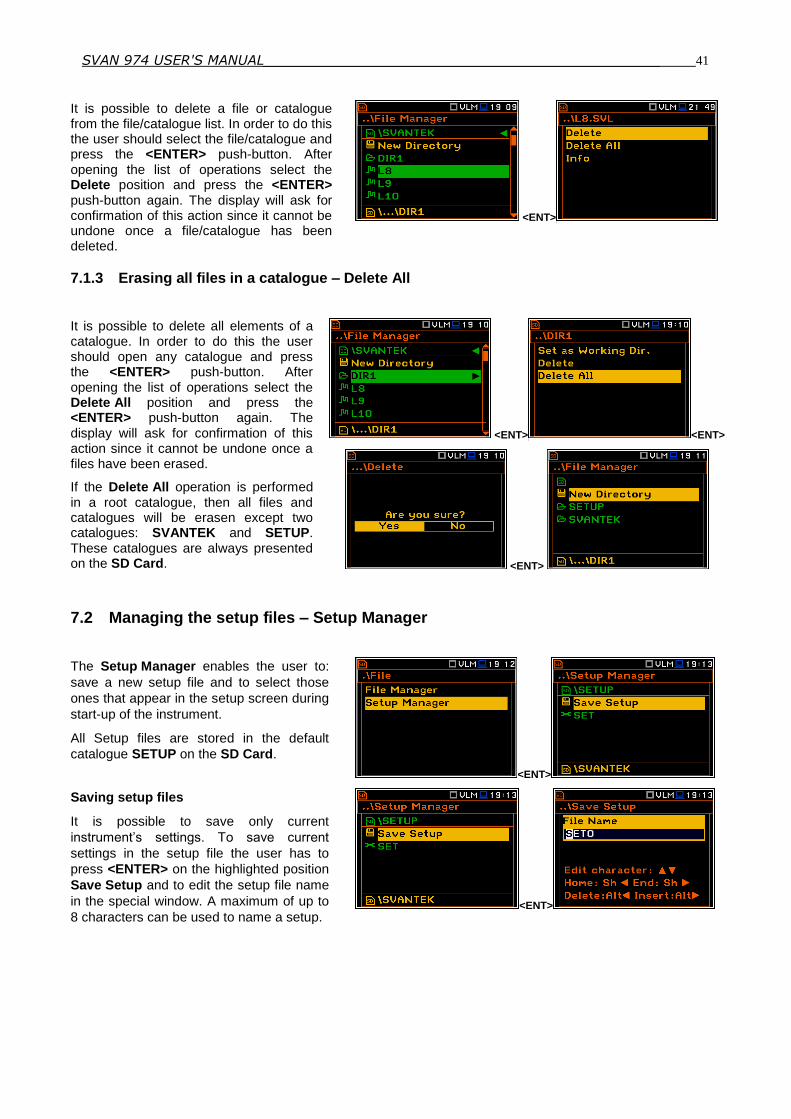
SVAN 974 USER'S MANUAL_______________________________________________ _41
It is possible to delete a file or catalogue from the file/catalogue list. In order to do this the user should select the file/catalogue and press the <ENTER> push-button. After opening the list of operations select the Delete position and press the <ENTER> push-button again. The display will ask for confirmation of this action since it cannot be undone once a file/catalogue has been deleted.
<ENT>
7.1.3 Erasing all files in a catalogue – Delete All
It is possible to delete all elements of a catalogue. In order to do this the user should open any catalogue and press the <ENTER> push-button. After opening the list of operations select the Delete All position and press the <ENTER> push-button again. The display will ask for confirmation of this action since it cannot be undone once a files have been erased.
If the Delete All operation is performed in a root catalogue, then all files and catalogues will be erasen except two catalogues: SVANTEK and SETUP. These catalogues are always presented on the SD Card.
<ENT> <ENT>
<ENT>
7.2 Managing the setup files – Setup Manager
The Setup Manager enables the user to:
save a new setup file and to select those
ones that appear in the setup screen during
start-up of the instrument.
All Setup files are stored in the default
catalogue SETUP on the SD Card.
<ENT>
Saving setup files
It is possible to save only current
instrument’s settings. To save current
settings in the setup file the user has to
press <ENTER> on the highlighted position
Save Setup and to edit the setup file name
in the special window. A maximum of up to
8 characters can be used to name a setup. <ENT>
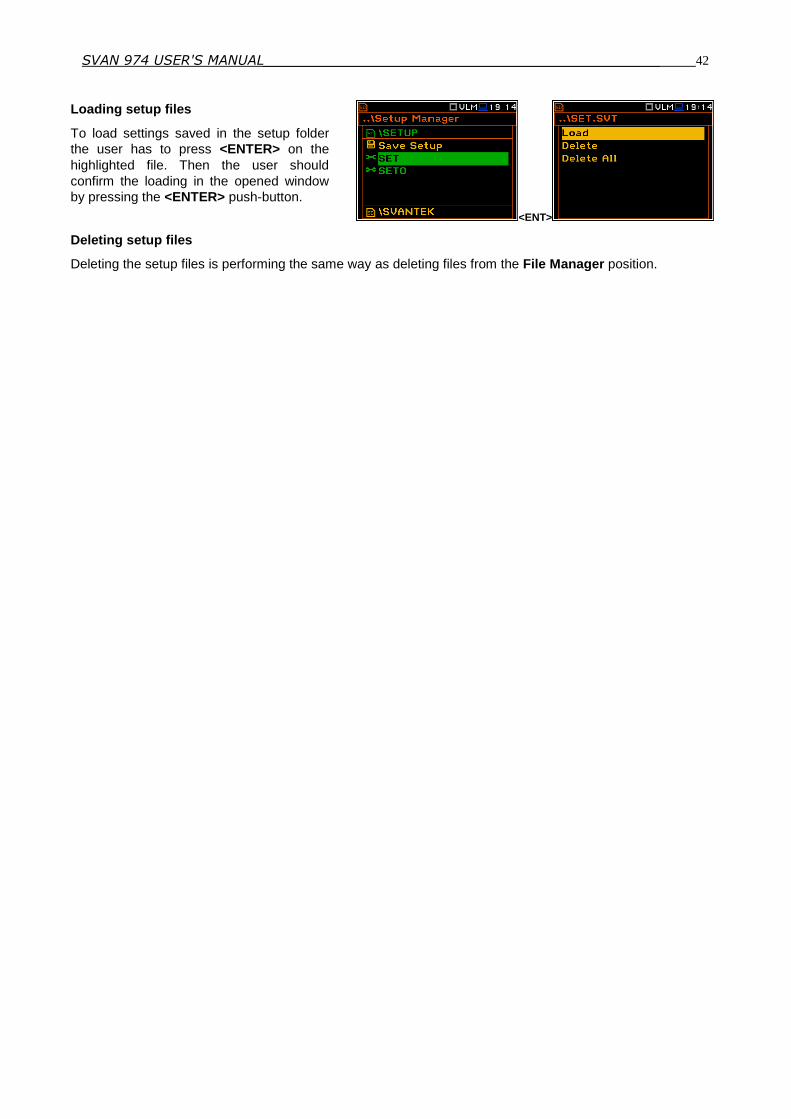
SVAN 974 USER'S MANUAL_______________________________________________ _42
Loading setup files
To load settings saved in the setup folder
the user has to press <ENTER> on the
highlighted file. Then the user should
confirm the loading in the opened window
by pressing the <ENTER> push-button.
<ENT>
Deleting setup files
Deleting the setup files is performing the same way as deleting files from the File Manager position.
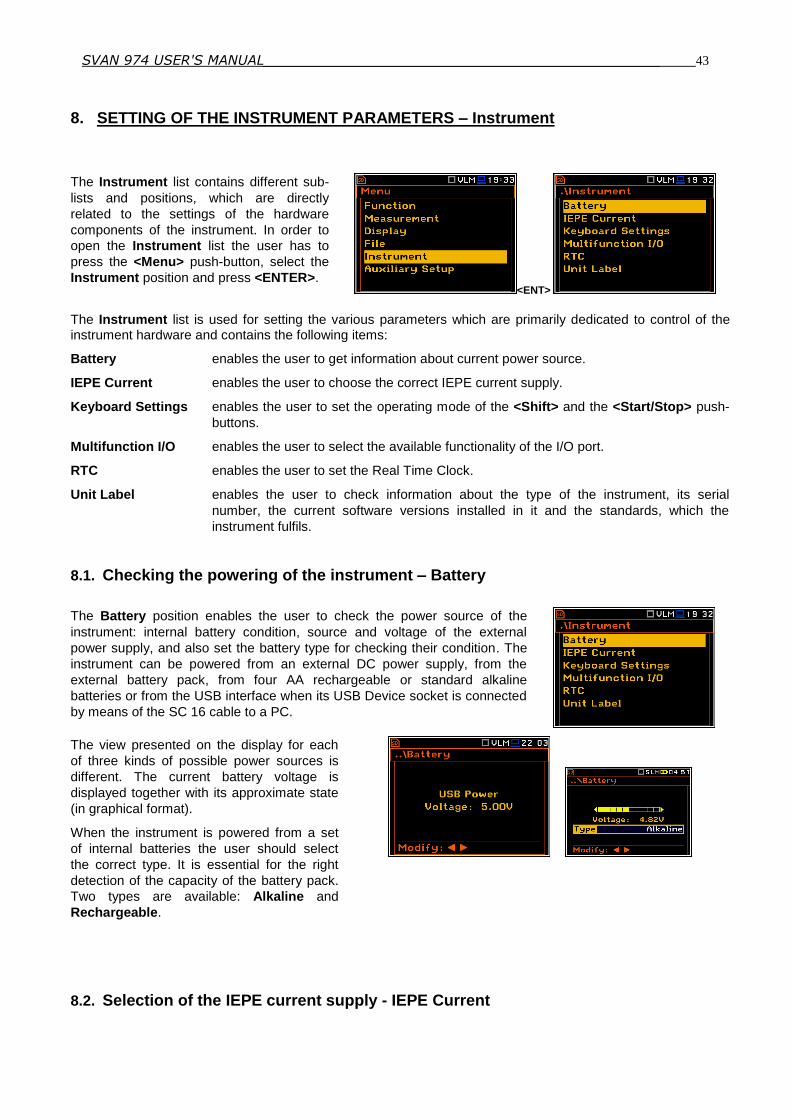
SVAN 974 USER'S MANUAL_______________________________________________ _43
8. SETTING OF THE INSTRUMENT PARAMETERS – Instrument
The Instrument list contains different sub-
lists and positions, which are directly
related to the settings of the hardware
components of the instrument. In order to
open the Instrument list the user has to
press the <Menu> push-button, select the
Instrument position and press <ENTER>. <ENT>
The Instrument list is used for setting the various parameters which are primarily dedicated to control of the instrument hardware and contains the following items:
Battery enables the user to get information about current power source.
IEPE Current enables the user to choose the correct IEPE current supply.
Keyboard Settings enables the user to set the operating mode of the <Shift> and the <Start/Stop> push-
buttons.
Multifunction I/O enables the user to select the available functionality of the I/O port.
RTC enables the user to set the Real Time Clock.
Unit Label enables the user to check information about the type of the instrument, its serial
number, the current software versions installed in it and the standards, which the
instrument fulfils.
8.1. Checking the powering of the instrument – Battery
The Battery position enables the user to check the power source of the
instrument: internal battery condition, source and voltage of the external
power supply, and also set the battery type for checking their condition. The
instrument can be powered from an external DC power supply, from the
external battery pack, from four AA rechargeable or standard alkaline
batteries or from the USB interface when its USB Device socket is connected
by means of the SC 16 cable to a PC.
The view presented on the display for each
of three kinds of possible power sources is
different. The current battery voltage is
displayed together with its approximate state
(in graphical format).
When the instrument is powered from a set
of internal batteries the user should select
the correct type. It is essential for the right
detection of the capacity of the battery pack.
Two types are available: Alkaline and
Rechargeable.
8.2. Selection of the IEPE current supply - IEPE Current
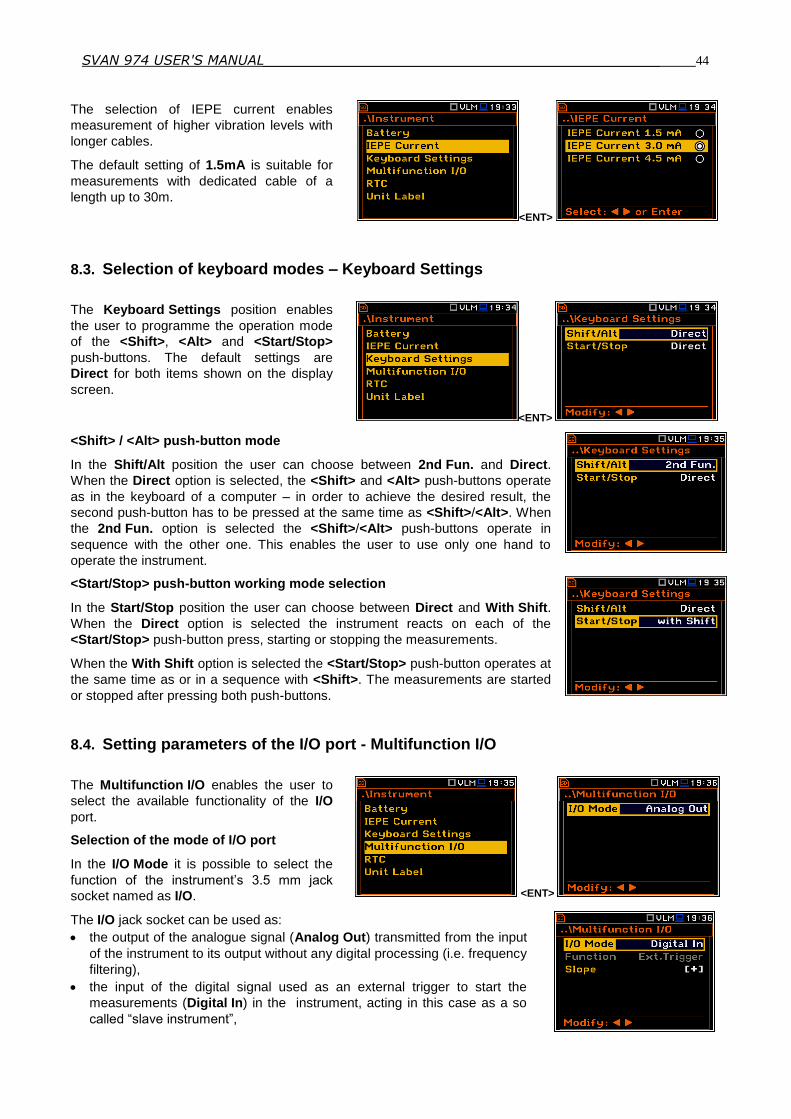
SVAN 974 USER'S MANUAL_______________________________________________ _44
The selection of IEPE current enables
measurement of higher vibration levels with
longer cables.
The default setting of 1.5mA is suitable for
measurements with dedicated cable of a
length up to 30m.
<ENT>
8.3. Selection of keyboard modes – Keyboard Settings
The Keyboard Settings position enables
the user to programme the operation mode
of the <Shift>, <Alt> and <Start/Stop>
push-buttons. The default settings are
Direct for both items shown on the display
screen.
<ENT>
<Shift> / <Alt> push-button mode
In the Shift/Alt position the user can choose between 2nd Fun. and Direct.
When the Direct option is selected, the <Shift> and <Alt> push-buttons operate
as in the keyboard of a computer – in order to achieve the desired result, the
second push-button has to be pressed at the same time as <Shift>/<Alt>. When
the 2nd Fun. option is selected the <Shift>/<Alt> push-buttons operate in
sequence with the other one. This enables the user to use only one hand to
operate the instrument.
<Start/Stop> push-button working mode selection
In the Start/Stop position the user can choose between Direct and With Shift.
When the Direct option is selected the instrument reacts on each of the
<Start/Stop> push-button press, starting or stopping the measurements.
When the With Shift option is selected the <Start/Stop> push-button operates at
the same time as or in a sequence with <Shift>. The measurements are started
or stopped after pressing both push-buttons.
8.4. Setting parameters of the I/O port - Multifunction I/O
The Multifunction I/O enables the user to
select the available functionality of the I/O
port.
Selection of the mode of I/O port
In the I/O Mode it is possible to select the
function of the instrument’s 3.5 mm jack
socket named as I/O. <ENT>
The I/O jack socket can be used as:
the output of the analogue signal (Analog Out) transmitted from the input
of the instrument to its output without any digital processing (i.e. frequency
filtering),
the input of the digital signal used as an external trigger to start the
measurements (Digital In) in the instrument, acting in this case as a so
called “slave instrument”,
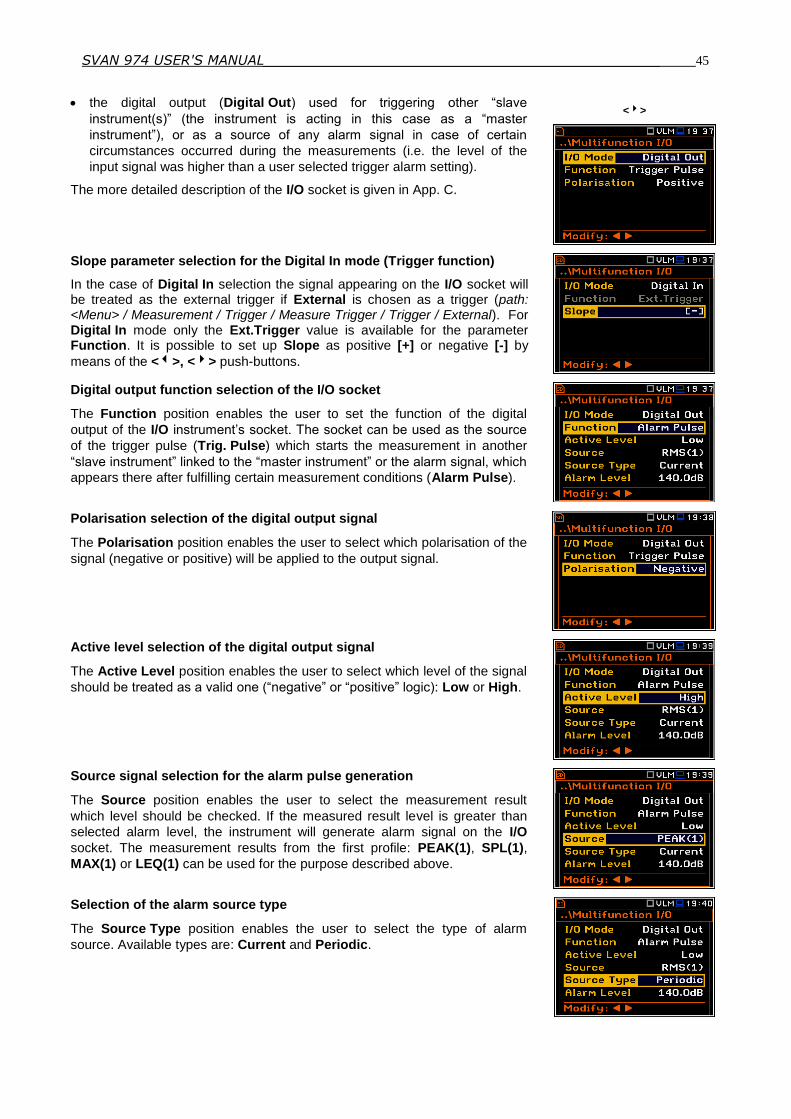
SVAN 974 USER'S MANUAL_______________________________________________ _45
the digital output (Digital Out) used for triggering other “slave
instrument(s)” (the instrument is acting in this case as a “master
instrument”), or as a source of any alarm signal in case of certain
circumstances occurred during the measurements (i.e. the level of the
input signal was higher than a user selected trigger alarm setting).
The more detailed description of the I/O socket is given in App. C.
<>
Slope parameter selection for the Digital In mode (Trigger function)
In the case of Digital In selection the signal appearing on the I/O socket will be treated as the external trigger if External is chosen as a trigger (path: <Menu> / Measurement / Trigger / Measure Trigger / Trigger / External). For Digital In mode only the Ext.Trigger value is available for the parameter Function. It is possible to set up Slope as positive [+] or negative [-] by
means of the <>, <> push-buttons.
Digital output function selection of the I/O socket
The Function position enables the user to set the function of the digital
output of the I/O instrument’s socket. The socket can be used as the source
of the trigger pulse (Trig. Pulse) which starts the measurement in another
“slave instrument” linked to the “master instrument” or the alarm signal, which
appears there after fulfilling certain measurement conditions (Alarm Pulse).
Polarisation selection of the digital output signal
The Polarisation position enables the user to select which polarisation of the
signal (negative or positive) will be applied to the output signal.
Active level selection of the digital output signal
The Active Level position enables the user to select which level of the signal
should be treated as a valid one (“negative” or “positive” logic): Low or High.
Source signal selection for the alarm pulse generation
The Source position enables the user to select the measurement result
which level should be checked. If the measured result level is greater than
selected alarm level, the instrument will generate alarm signal on the I/O
socket. The measurement results from the first profile: PEAK(1), SPL(1),
MAX(1) or LEQ(1) can be used for the purpose described above.
Selection of the alarm source type
The Source Type position enables the user to select the type of alarm
source. Available types are: Current and Periodic.
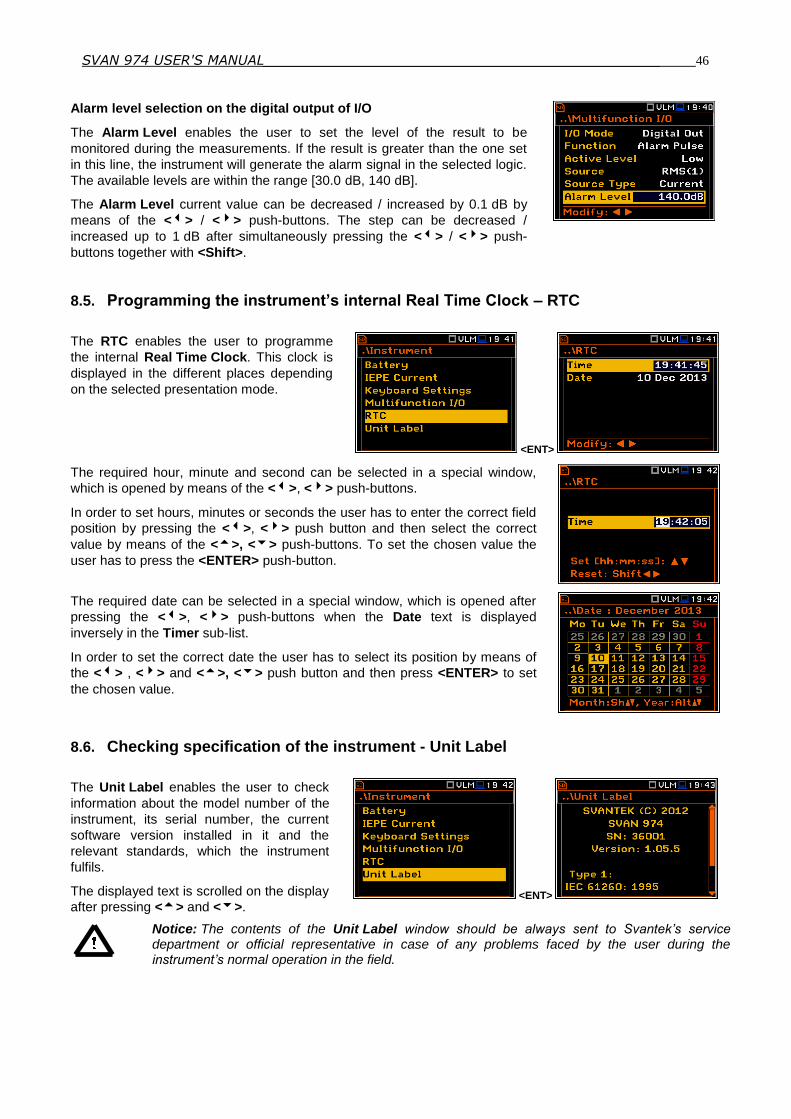
SVAN 974 USER'S MANUAL_______________________________________________ _46
Alarm level selection on the digital output of I/O
The Alarm Level enables the user to set the level of the result to be
monitored during the measurements. If the result is greater than the one set
in this line, the instrument will generate the alarm signal in the selected logic.
The available levels are within the range [30.0 dB, 140 dB].
The Alarm Level current value can be decreased / increased by 0.1 dB by
means of the <> / <> push-buttons. The step can be decreased /
increased up to 1 dB after simultaneously pressing the <> / <> push-
buttons together with <Shift>.
8.5. Programming the instrument’s internal Real Time Clock – RTC
The RTC enables the user to programme
the internal Real Time Clock. This clock is
displayed in the different places depending
on the selected presentation mode.
<ENT>
The required hour, minute and second can be selected in a special window,
which is opened by means of the <>, <> push-buttons.
In order to set hours, minutes or seconds the user has to enter the correct field
position by pressing the <>, <> push button and then select the correct
value by means of the <>, <> push-buttons. To set the chosen value the
user has to press the <ENTER> push-button.
The required date can be selected in a special window, which is opened after
pressing the <>, <> push-buttons when the Date text is displayed
inversely in the Timer sub-list.
In order to set the correct date the user has to select its position by means of
the <> , <> and <>, <> push button and then press <ENTER> to set
the chosen value.
8.6. Checking specification of the instrument - Unit Label
The Unit Label enables the user to check
information about the model number of the
instrument, its serial number, the current
software version installed in it and the
relevant standards, which the instrument
fulfils.
The displayed text is scrolled on the display
after pressing <> and <>. <ENT>
Notice: The contents of the Unit Label window should be always sent to Svantek’s service department or official representative in case of any problems faced by the user during the instrument’s normal operation in the field.
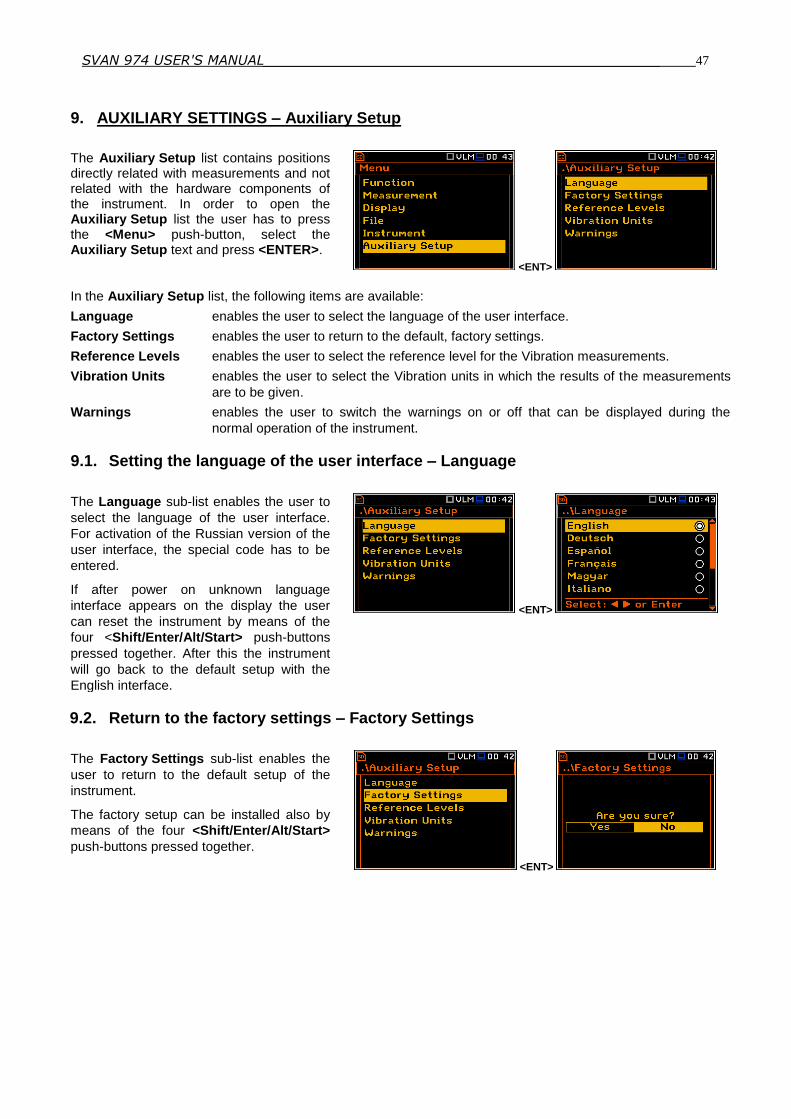
SVAN 974 USER'S MANUAL_______________________________________________ _47
9. AUXILIARY SETTINGS – Auxiliary Setup
The Auxiliary Setup list contains positions directly related with measurements and not related with the hardware components of the instrument. In order to open the Auxiliary Setup list the user has to press the <Menu> push-button, select the Auxiliary Setup text and press <ENTER>.
<ENT>
In the Auxiliary Setup list, the following items are available:
Language enables the user to select the language of the user interface.
Factory Settings enables the user to return to the default, factory settings.
Reference Levels enables the user to select the reference level for the Vibration measurements.
Vibration Units enables the user to select the Vibration units in which the results of the measurements
are to be given.
Warnings enables the user to switch the warnings on or off that can be displayed during the
normal operation of the instrument.
9.1. Setting the language of the user interface – Language
The Language sub-list enables the user to
select the language of the user interface.
For activation of the Russian version of the
user interface, the special code has to be
entered.
If after power on unknown language
interface appears on the display the user
can reset the instrument by means of the
four <Shift/Enter/Alt/Start> push-buttons
pressed together. After this the instrument
will go back to the default setup with the
English interface.
<ENT>
9.2. Return to the factory settings – Factory Settings
The Factory Settings sub-list enables the
user to return to the default setup of the
instrument.
The factory setup can be installed also by
means of the four <Shift/Enter/Alt/Start>
push-buttons pressed together.
<ENT>
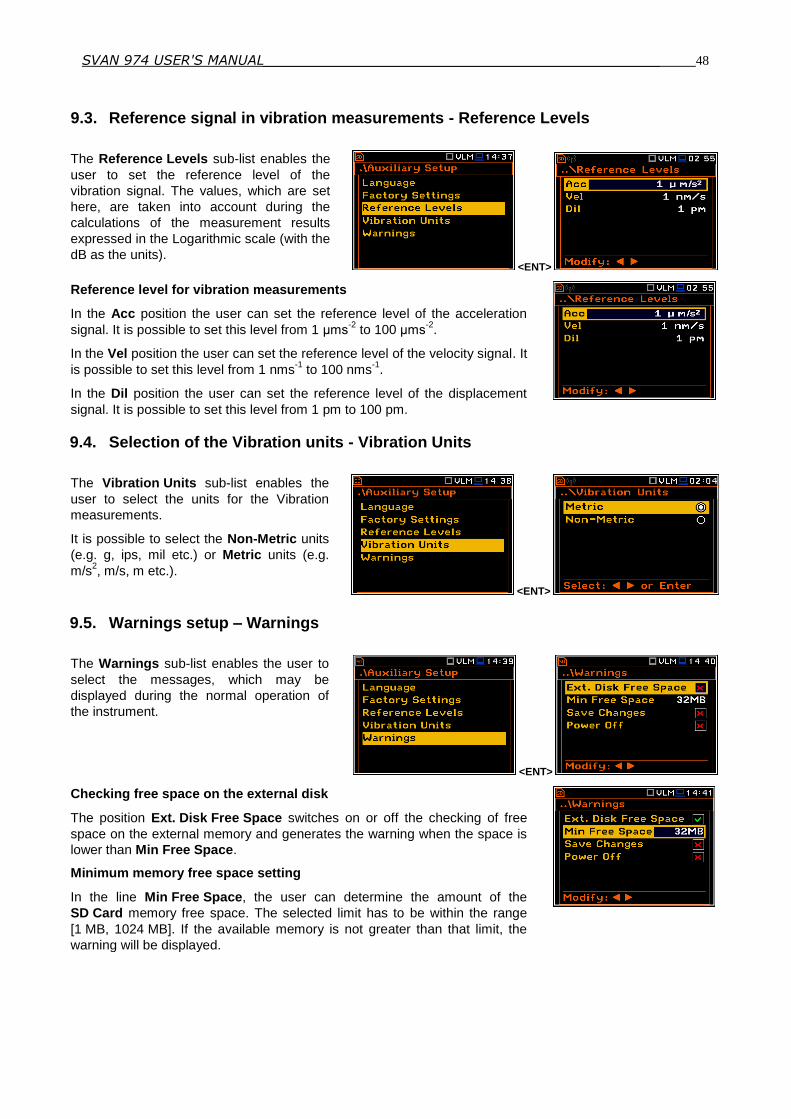
SVAN 974 USER'S MANUAL_______________________________________________ _48
9.3. Reference signal in vibration measurements - Reference Levels
The Reference Levels sub-list enables the
user to set the reference level of the
vibration signal. The values, which are set
here, are taken into account during the
calculations of the measurement results
expressed in the Logarithmic scale (with the
dB as the units). <ENT>
Reference level for vibration measurements
In the Acc position the user can set the reference level of the acceleration
signal. It is possible to set this level from 1 µms-2
to 100 µms-2
.
In the Vel position the user can set the reference level of the velocity signal. It
is possible to set this level from 1 nms-1
to 100 nms-1
.
In the Dil position the user can set the reference level of the displacement
signal. It is possible to set this level from 1 pm to 100 pm.
9.4. Selection of the Vibration units - Vibration Units
The Vibration Units sub-list enables the
user to select the units for the Vibration
measurements.
It is possible to select the Non-Metric units
(e.g. g, ips, mil etc.) or Metric units (e.g.
m/s2, m/s, m etc.).
<ENT>
9.5. Warnings setup – Warnings
The Warnings sub-list enables the user to
select the messages, which may be
displayed during the normal operation of
the instrument.
<ENT>
Checking free space on the external disk
The position Ext. Disk Free Space switches on or off the checking of free
space on the external memory and generates the warning when the space is
lower than Min Free Space.
Minimum memory free space setting
In the line Min Free Space, the user can determine the amount of the
SD Card memory free space. The selected limit has to be within the range
[1 MB, 1024 MB]. If the available memory is not greater than that limit, the
warning will be displayed.

SVAN 974 USER'S MANUAL_______________________________________________ _49
Confirmation of parameter changes
In the line Save Changes the user can
switch on the option of confirmation of
parameters changes, after exit the screen
with the parameter list by means of the
<ESC> push-button.
=>
Confirmation of the instrument switch off
If the Power Off parameter is switch on then
the instrument will display the warning
message in case the user is switching the
instrument off.
=>
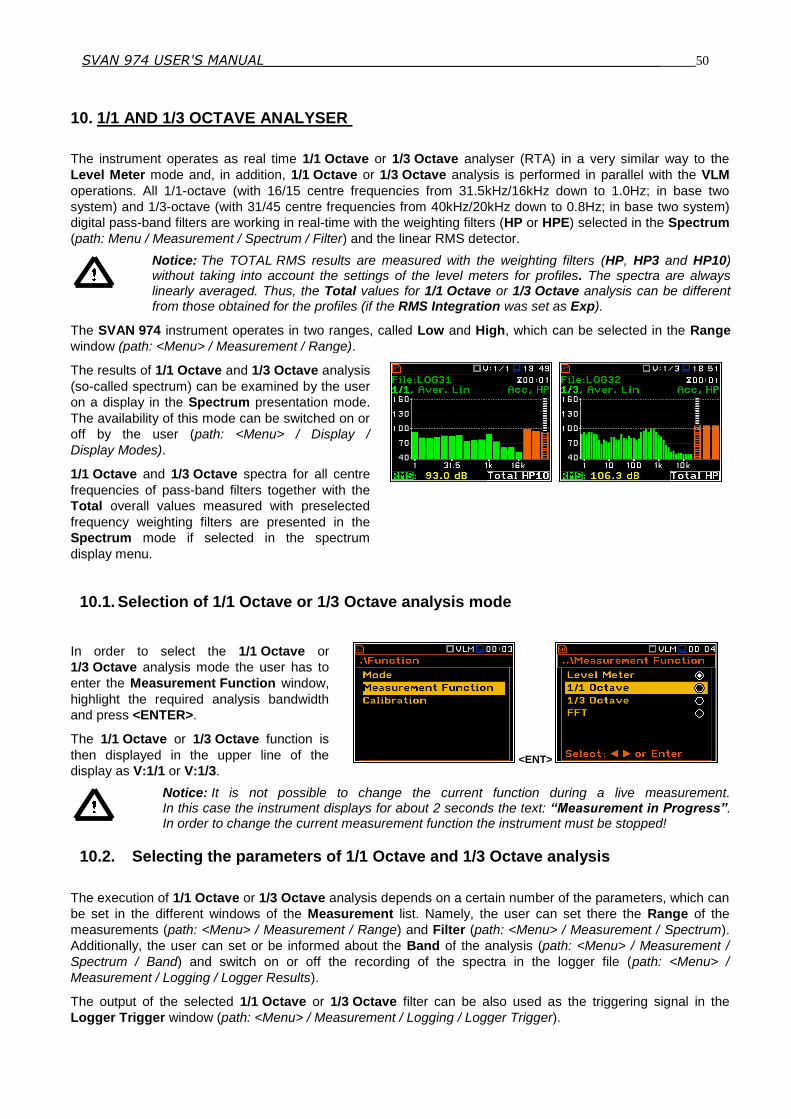
SVAN 974 USER'S MANUAL_______________________________________________ _50
10. 1/1 AND 1/3 OCTAVE ANALYSER
The instrument operates as real time 1/1 Octave or 1/3 Octave analyser (RTA) in a very similar way to the
Level Meter mode and, in addition, 1/1 Octave or 1/3 Octave analysis is performed in parallel with the VLM
operations. All 1/1-octave (with 16/15 centre frequencies from 31.5kHz/16kHz down to 1.0Hz; in base two
system) and 1/3-octave (with 31/45 centre frequencies from 40kHz/20kHz down to 0.8Hz; in base two system)
digital pass-band filters are working in real-time with the weighting filters (HP or HPE) selected in the Spectrum
(path: Menu / Measurement / Spectrum / Filter) and the linear RMS detector.
Notice: The TOTAL RMS results are measured with the weighting filters (HP, HP3 and HP10) without taking into account the settings of the level meters for profiles. The spectra are always linearly averaged. Thus, the Total values for 1/1 Octave or 1/3 Octave analysis can be different from those obtained for the profiles (if the RMS Integration was set as Exp).
The SVAN 974 instrument operates in two ranges, called Low and High, which can be selected in the Range
window (path: <Menu> / Measurement / Range).
The results of 1/1 Octave and 1/3 Octave analysis
(so-called spectrum) can be examined by the user
on a display in the Spectrum presentation mode.
The availability of this mode can be switched on or
off by the user (path: <Menu> / Display /
Display Modes).
1/1 Octave and 1/3 Octave spectra for all centre
frequencies of pass-band filters together with the
Total overall values measured with preselected
frequency weighting filters are presented in the
Spectrum mode if selected in the spectrum
display menu.
10.1. Selection of 1/1 Octave or 1/3 Octave analysis mode
In order to select the 1/1 Octave or
1/3 Octave analysis mode the user has to
enter the Measurement Function window,
highlight the required analysis bandwidth
and press <ENTER>.
The 1/1 Octave or 1/3 Octave function is
then displayed in the upper line of the
display as V:1/1 or V:1/3. <ENT>
Notice: It is not possible to change the current function during a live measurement. In this case the instrument displays for about 2 seconds the text: “Measurement in Progress”. In order to change the current measurement function the instrument must be stopped!
10.2. Selecting the parameters of 1/1 Octave and 1/3 Octave analysis
The execution of 1/1 Octave or 1/3 Octave analysis depends on a certain number of the parameters, which can
be set in the different windows of the Measurement list. Namely, the user can set there the Range of the
measurements (path: <Menu> / Measurement / Range) and Filter (path: <Menu> / Measurement / Spectrum).
Additionally, the user can set or be informed about the Band of the analysis (path: <Menu> / Measurement /
Spectrum / Band) and switch on or off the recording of the spectra in the logger file (path: <Menu> /
Measurement / Logging / Logger Results).
The output of the selected 1/1 Octave or 1/3 Octave filter can be also used as the triggering signal in the
Logger Trigger window (path: <Menu> / Measurement / Logging / Logger Trigger).

SVAN 974 USER'S MANUAL_______________________________________________ _51
10.3. Measurement range selection in 1/1 Octave and 1/3 Octave analysis - Range
There is one available range in the 1/1 Octave or
1/3 Octave analyser: Single. The input range can
be viewed after entering the Range window of the
Measurement list.The detailed description of the
measurement range is given in App. C.The range
can be also presented in logarithmic units. For this
purpose the user should select Log for the Scale
parameter (path: <Menu> / Display /
Display Scale).
…
10.4. Setting the parameters of 1/1 Octave and 1/3 Octave analysis - Spectrum
In the 1/1 Octave or 1/3 Octave mode a
context element (Spectrum) appears on the
Measurement list (path: <Menu> /
Measurement / Spectrum). The Spectrum
window informs the user about: frequency
band, pre-weighting broadband frequency
filter and detector type. <ENT>
Selection the band
The Band position defines the applied band of 1/1 Octave or 1/3 Octave analysis.
For 1/1 Octave next frequency band is
used:
o Full (1-16k) - 15 filters with centre
frequencies 1 Hz ÷16 kHz,
=>
For 1/3 Octave next frequency band is
used:
o Full (0.8-20k) - 45 filters with centre
frequencies 0.8 Hz ÷20 kHz,
=>
Weighting filter selection
The pre-weighting filter is:
HP type 1 according to the IEC 61672-1 standard.
The characteristics of the filters are given in Appendix D.
Detector for 1/1 Octave or 1/3 Octave analysis
The Detector position informs the user about the default Linear detector for
the 1/1 Octave or 1/3 Octave analysis.
10.5. Saving of 1/1 Octave and 1/3 Octave analysis results - Logger Results
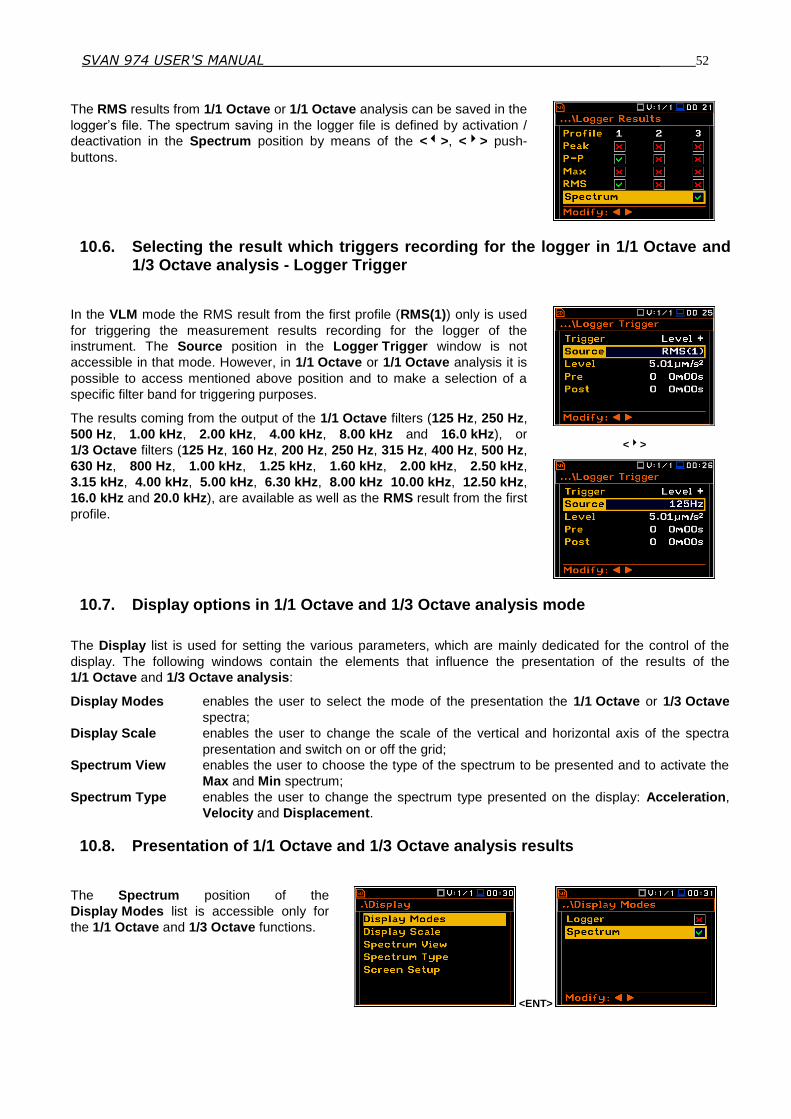
SVAN 974 USER'S MANUAL_______________________________________________ _52
The RMS results from 1/1 Octave or 1/1 Octave analysis can be saved in the
logger’s file. The spectrum saving in the logger file is defined by activation /
deactivation in the Spectrum position by means of the <>, <> push-
buttons.
10.6. Selecting the result which triggers recording for the logger in 1/1 Octave and 1/3 Octave analysis - Logger Trigger
In the VLM mode the RMS result from the first profile (RMS(1)) only is used
for triggering the measurement results recording for the logger of the
instrument. The Source position in the Logger Trigger window is not
accessible in that mode. However, in 1/1 Octave or 1/1 Octave analysis it is
possible to access mentioned above position and to make a selection of a
specific filter band for triggering purposes.
The results coming from the output of the 1/1 Octave filters (125 Hz, 250 Hz,
500 Hz, 1.00 kHz, 2.00 kHz, 4.00 kHz, 8.00 kHz and 16.0 kHz), or
1/3 Octave filters (125 Hz, 160 Hz, 200 Hz, 250 Hz, 315 Hz, 400 Hz, 500 Hz,
630 Hz, 800 Hz, 1.00 kHz, 1.25 kHz, 1.60 kHz, 2.00 kHz, 2.50 kHz,
3.15 kHz, 4.00 kHz, 5.00 kHz, 6.30 kHz, 8.00 kHz 10.00 kHz, 12.50 kHz,
16.0 kHz and 20.0 kHz), are available as well as the RMS result from the first
profile.
<>
10.7. Display options in 1/1 Octave and 1/3 Octave analysis mode
The Display list is used for setting the various parameters, which are mainly dedicated for the control of the
display. The following windows contain the elements that influence the presentation of the results of the
1/1 Octave and 1/3 Octave analysis:
Display Modes enables the user to select the mode of the presentation the 1/1 Octave or 1/3 Octave
spectra;
Display Scale enables the user to change the scale of the vertical and horizontal axis of the spectra
presentation and switch on or off the grid;
Spectrum View enables the user to choose the type of the spectrum to be presented and to activate the
Max and Min spectrum;
Spectrum Type enables the user to change the spectrum type presented on the display: Acceleration,
Velocity and Displacement.
10.8. Presentation of 1/1 Octave and 1/3 Octave analysis results
The Spectrum position of the
Display Modes list is accessible only for
the 1/1 Octave and 1/3 Octave functions.
<ENT>

SVAN 974 USER'S MANUAL_______________________________________________ _53
When the Spectrum mode is switched on
the measurement screen in the Spectrum
visualisation mode is shown here for octave
and third octave bands.
Field description of the Spectrum view
1. Type of spectrum
2. Cursor position
3. Value for the cursor position
4. Averaging used
5. Spectrum plot
6. Frequency weighting filter used
7. Total values
8. Central frequency for the cursor position
The user may shift the Y-axis during the
spectrum presentation after pressing the
<Shift> and <> (or <Shift> and <>)
push-buttons.
<Sh/>
The user may change the cursor position by
means of the <>, <> push-buttons. The
frequency and the appropriate value are
presented in the line below the plot. The
user can change quickly to the first or last
spectrum line by simultaneously pressing
the <> or <> buttons with <Shift>.
<> ...
10.9. Setting the scale of the spectrum presentation and the grid - Scale
The Display Scale sub-list enables the
user to change the scale in the available
modes of graphical presentation of the
measurement results and to switch the grid
on or off.
<ENT>
2
3
7
8
1 6
4 5
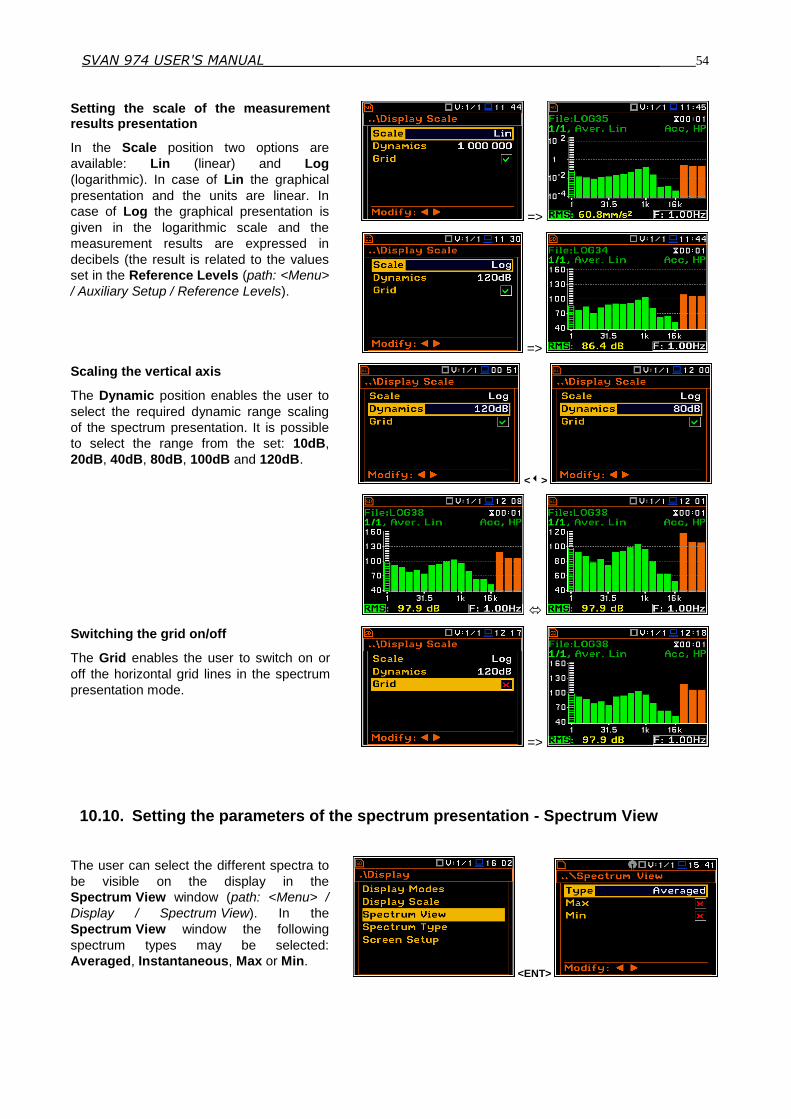
SVAN 974 USER'S MANUAL_______________________________________________ _54
Setting the scale of the measurement results presentation
In the Scale position two options are
available: Lin (linear) and Log
(logarithmic). In case of Lin the graphical
presentation and the units are linear. In
case of Log the graphical presentation is
given in the logarithmic scale and the
measurement results are expressed in
decibels (the result is related to the values
set in the Reference Levels (path: <Menu>
/ Auxiliary Setup / Reference Levels).
=>
=>
Scaling the vertical axis
The Dynamic position enables the user to
select the required dynamic range scaling
of the spectrum presentation. It is possible
to select the range from the set: 10dB,
20dB, 40dB, 80dB, 100dB and 120dB.
<>
Switching the grid on/off
The Grid enables the user to switch on or
off the horizontal grid lines in the spectrum
presentation mode.
=>
10.10. Setting the parameters of the spectrum presentation - Spectrum View
The user can select the different spectra to
be visible on the display in the
Spectrum View window (path: <Menu> /
Display / Spectrum View). In the
Spectrum View window the following
spectrum types may be selected:
Averaged, Instantaneous, Max or Min. <ENT>
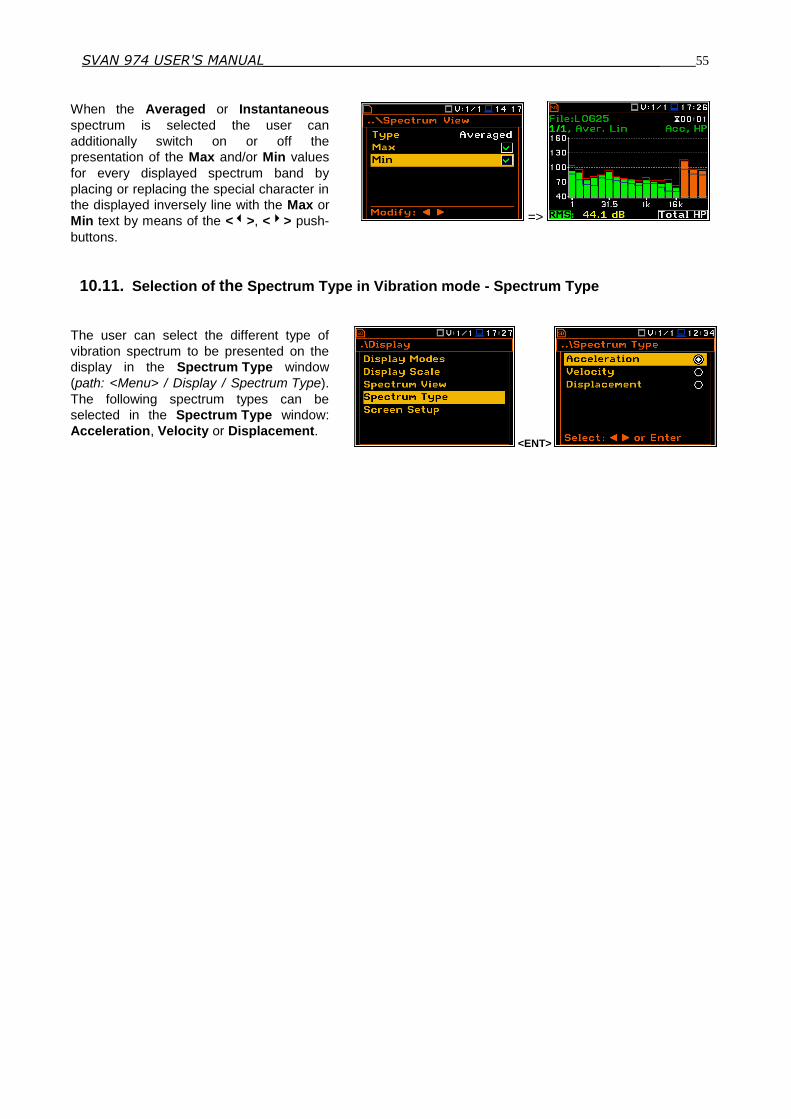
SVAN 974 USER'S MANUAL_______________________________________________ _55
When the Averaged or Instantaneous
spectrum is selected the user can
additionally switch on or off the
presentation of the Max and/or Min values
for every displayed spectrum band by
placing or replacing the special character in
the displayed inversely line with the Max or
Min text by means of the <>, <> push-
buttons.
=>
10.11. Selection of the Spectrum Type in Vibration mode - Spectrum Type
The user can select the different type of
vibration spectrum to be presented on the
display in the Spectrum Type window
(path: <Menu> / Display / Spectrum Type).
The following spectrum types can be
selected in the Spectrum Type window:
Acceleration, Velocity or Displacement. <ENT>
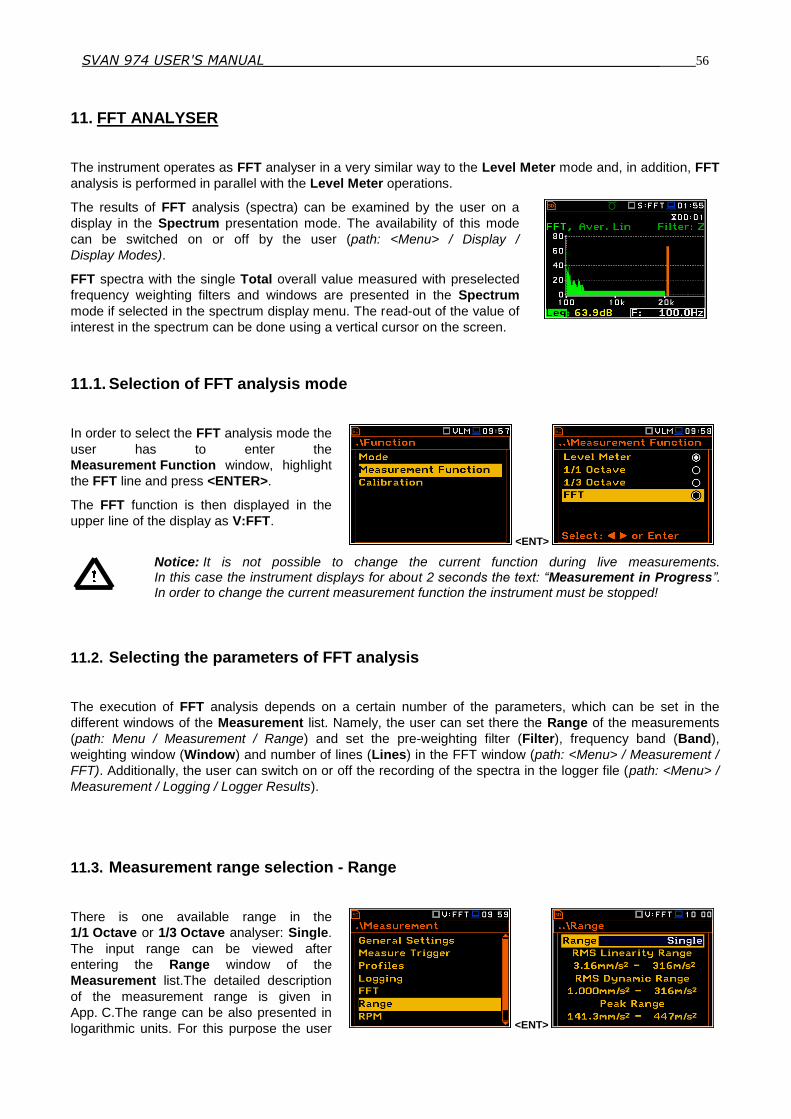
SVAN 974 USER'S MANUAL_______________________________________________ _56
11. FFT ANALYSER
The instrument operates as FFT analyser in a very similar way to the Level Meter mode and, in addition, FFT
analysis is performed in parallel with the Level Meter operations.
The results of FFT analysis (spectra) can be examined by the user on a
display in the Spectrum presentation mode. The availability of this mode
can be switched on or off by the user (path: <Menu> / Display /
Display Modes).
FFT spectra with the single Total overall value measured with preselected
frequency weighting filters and windows are presented in the Spectrum
mode if selected in the spectrum display menu. The read-out of the value of
interest in the spectrum can be done using a vertical cursor on the screen.
11.1. Selection of FFT analysis mode
In order to select the FFT analysis mode the
user has to enter the
Measurement Function window, highlight
the FFT line and press <ENTER>.
The FFT function is then displayed in the
upper line of the display as V:FFT.
<ENT>
Notice: It is not possible to change the current function during live measurements. In this case the instrument displays for about 2 seconds the text: “Measurement in Progress”. In order to change the current measurement function the instrument must be stopped!
11.2. Selecting the parameters of FFT analysis
The execution of FFT analysis depends on a certain number of the parameters, which can be set in the
different windows of the Measurement list. Namely, the user can set there the Range of the measurements
(path: Menu / Measurement / Range) and set the pre-weighting filter (Filter), frequency band (Band),
weighting window (Window) and number of lines (Lines) in the FFT window (path: <Menu> / Measurement /
FFT). Additionally, the user can switch on or off the recording of the spectra in the logger file (path: <Menu> /
Measurement / Logging / Logger Results).
11.3. Measurement range selection - Range
There is one available range in the
1/1 Octave or 1/3 Octave analyser: Single.
The input range can be viewed after
entering the Range window of the
Measurement list.The detailed description
of the measurement range is given in
App. C.The range can be also presented in
logarithmic units. For this purpose the user <ENT>
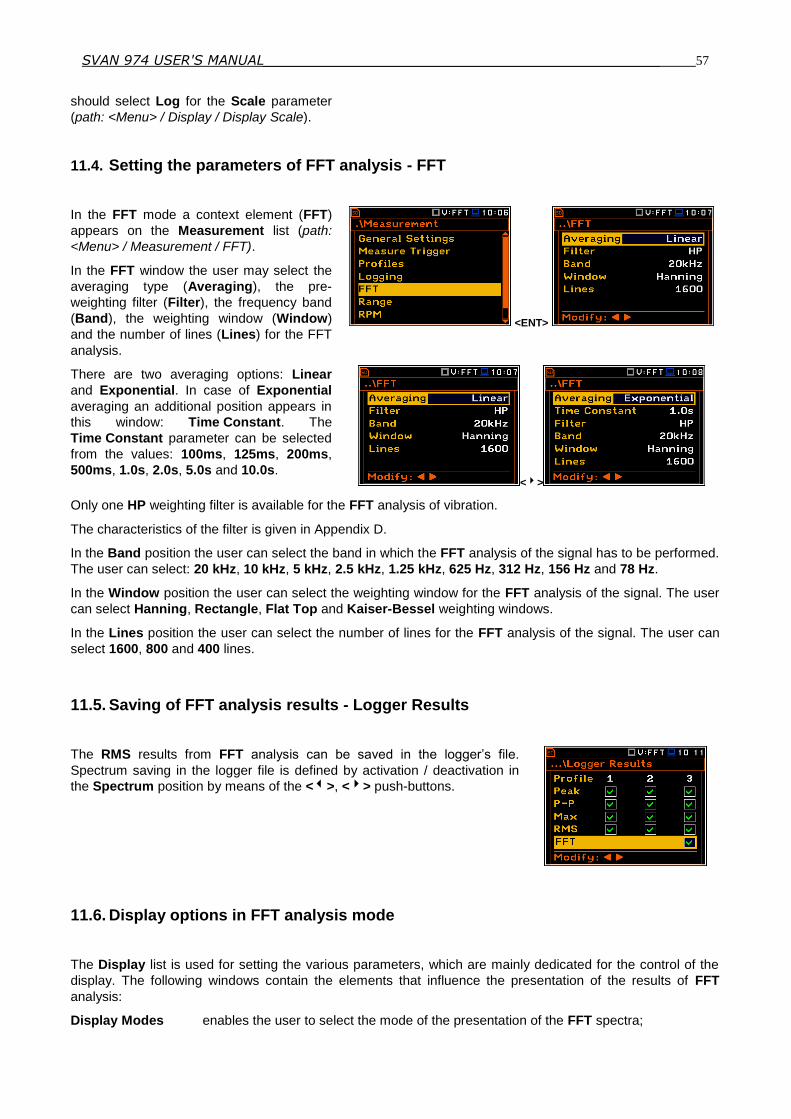
SVAN 974 USER'S MANUAL_______________________________________________ _57
should select Log for the Scale parameter
(path: <Menu> / Display / Display Scale).
11.4. Setting the parameters of FFT analysis - FFT
In the FFT mode a context element (FFT)
appears on the Measurement list (path:
<Menu> / Measurement / FFT).
In the FFT window the user may select the
averaging type (Averaging), the pre-
weighting filter (Filter), the frequency band
(Band), the weighting window (Window)
and the number of lines (Lines) for the FFT
analysis.
<ENT>
There are two averaging options: Linear
and Exponential. In case of Exponential
averaging an additional position appears in
this window: Time Constant. The
Time Constant parameter can be selected
from the values: 100ms, 125ms, 200ms,
500ms, 1.0s, 2.0s, 5.0s and 10.0s. <>
Only one HP weighting filter is available for the FFT analysis of vibration.
The characteristics of the filter is given in Appendix D.
In the Band position the user can select the band in which the FFT analysis of the signal has to be performed.
The user can select: 20 kHz, 10 kHz, 5 kHz, 2.5 kHz, 1.25 kHz, 625 Hz, 312 Hz, 156 Hz and 78 Hz.
In the Window position the user can select the weighting window for the FFT analysis of the signal. The user
can select Hanning, Rectangle, Flat Top and Kaiser-Bessel weighting windows.
In the Lines position the user can select the number of lines for the FFT analysis of the signal. The user can
select 1600, 800 and 400 lines.
11.5. Saving of FFT analysis results - Logger Results
The RMS results from FFT analysis can be saved in the logger’s file.
Spectrum saving in the logger file is defined by activation / deactivation in
the Spectrum position by means of the <>, <> push-buttons.
11.6. Display options in FFT analysis mode
The Display list is used for setting the various parameters, which are mainly dedicated for the control of the
display. The following windows contain the elements that influence the presentation of the results of FFT
analysis:
Display Modes enables the user to select the mode of the presentation of the FFT spectra;

SVAN 974 USER'S MANUAL_______________________________________________ _58
Display Scale enables the user to change the scale of the vertical and horizontal axis of the spectra
presentation, switch on or off the grid and autoscale;
Spectrum View enables the user to choose the type of the spectrum to be presented;
Logger View enables the user to select and present the spectra results stored in the logger files.
11.7. Presentation of FFT analysis results
The Spectrum position of the
Display Modes list is accessible for the
FFT function.
When the Spectrum mode is switched on
the measurement screen in the Spectrum
visualisation mode is shown here.
=>
The user may shift the Y-axis during the
spectrum presentation after pressing the
<Shift> and <> (or the <Shift> and
<>) push-buttons.
<Sh/>
The user may change the cursor position
by means of the <>, <> push-buttons.
The frequency and appropriate value are
presented in the line below the plot.
<> ...
The user may zoom in/out the frequency
scale at the cursor position by means of
the <>, <> push-buttons, pressed with
<Shift>.
<Sh/>
11.8. Setting the scale of spectrum presentation - Scale
The Display Scale sub-list enables the user
to change the scale in the available modes
of graphical presentation of the
measurement results and to switch the grid
on or off.
<ENT>

SVAN 974 USER'S MANUAL_______________________________________________ _59
Setting the scale of the measurement
results presentation
The Scale position is accessible only in
case of Vibration measurement modes. Two
options are available: Lin (linear) and Log
(logarithmic). In case of Lin the graphical
presentation and the units are linear. In
case of Log graphical presentation is given
in the logarithmic scale and the
measurement results are expressed in
decibels (the result is related to the values
set in the Reference Levels (path: <Menu>
/ Auxiliary Setup / Reference Levels).
=>
=>
Scaling the vertical axis of the graphical mode presentation – Dynamic
The Dynamic position enables the user to
select the required dynamic range scaling of
the spectrum presentation. It is possible to
select the range from the set: 10dB, 20dB,
40dB, 80dB, 100dB and 120dB. =>
Switching the grid on/off
The Grid option enables the user to switch
on or off the horizontal grid lines in the
spectrum presentation mode.
=>
11.9. Setting the parameters of the spectrum presentation - Spectrum View
The user can select the different spectra to
be visible on the display in the
Spectrum View window (path: <Menu> /
Display / Spectrum View). In the
Spectrum View window the following
spectrum types may be selected:
Averaged, Instantaneous, Max or Min.
The Max or Min spectra can be also
superimposed on the Averaged or
Instantaneous spectra.
=>
When the Averaged or Instantaneous
spectrum is selected the user can
additionally switch on or off the presentation
of the Max and/or Min values for every
displayed spectrum band by placing or
replacing the special character in the
inversely displayed line using the <>,
<> push-buttons. =>

SVAN 974 USER'S MANUAL_______________________________________________ _60
To switch the cursor to read the Max or Min
values the user should select the field in the
lower left hand corner of the display by
means of the <>, <> push-buttons.
Then select the appropriate value by means
of the <>, <> push-buttons pressed
together with <Alt>. <Alt/>
11.10. Selection of the Spectrum Type in Vibration mode - Spectrum Type
The user can select the different type of
vibration spectrum to be presented on the
display in the Spectrum Type window
(path: <Menu> / Display / Spectrum Type).
The Spectrum Type position is available
only for Vibration modes and the following
spectrum types can be selected in the
Spectrum Type window: Acceleration,
Velocity or Displacement.
<ENT>