sustainable energy options - university of iceland · primary vs. secondary ... ⇨london smog:...
TRANSCRIPT
UAU212F Spring 2012
Throstur Thorsteinsson ([email protected]) 1
Sustainable Energy Options
UAU212F
ENVIRONMENTAL
IMPACT
Throstur Thorsteinsson [email protected]
Pollution: refers to the occurrence of an unwanted change in the environment caused by the introduction of harmful materials
- introduced through a) Point Sources b) Area Sources c) Mobile Sources
Contamination: making something unfit for a particular use through the introduction of an undesirable material.
Toxicity: Materials that are poisonous to living things.
Carcinogen: a type of toxin that increases the risk of cancer.
Synergism: the interaction of different substances resulting in a total effect greater than the sum of the effects of the separate sources.
Terminology
⇨ Infectious Agents ⇨ Toxic Heavy Metals ⇨ Organic Compounds ⇨ Radiation ⇨ Thermal Pollution ⇨ Particulates ⇨ Asbestos ⇨ Electromagnetic Fields ⇨ Noise Pollution
Categories of Pollutants
⇨ High atomic weight
⇨ Mercury, Lead, Cadmium, Nikkel, Gold,
arsenic, selenium, chromium, tallium
⇨ Been around since the stone age
⇨ Stored in living tissue – accumulate over time ⇨ biomagification in tissue.
⇨ 10% of energy moved, but 100% of THM.
Toxic Heavy Metals
⇨ Biomagnifications: the accumulation or
increase in concentration of a substance in
living tissue (e.g. fatty tissue) as it moves
through a food web.
⇨ Body burden: the quantity of metals that is
toxic to humans. ⇨ Drinking water inorganic mercury
Maximum contaminant level: 2 ppb (0.002 mg/L)
Toxic Heavy Metals
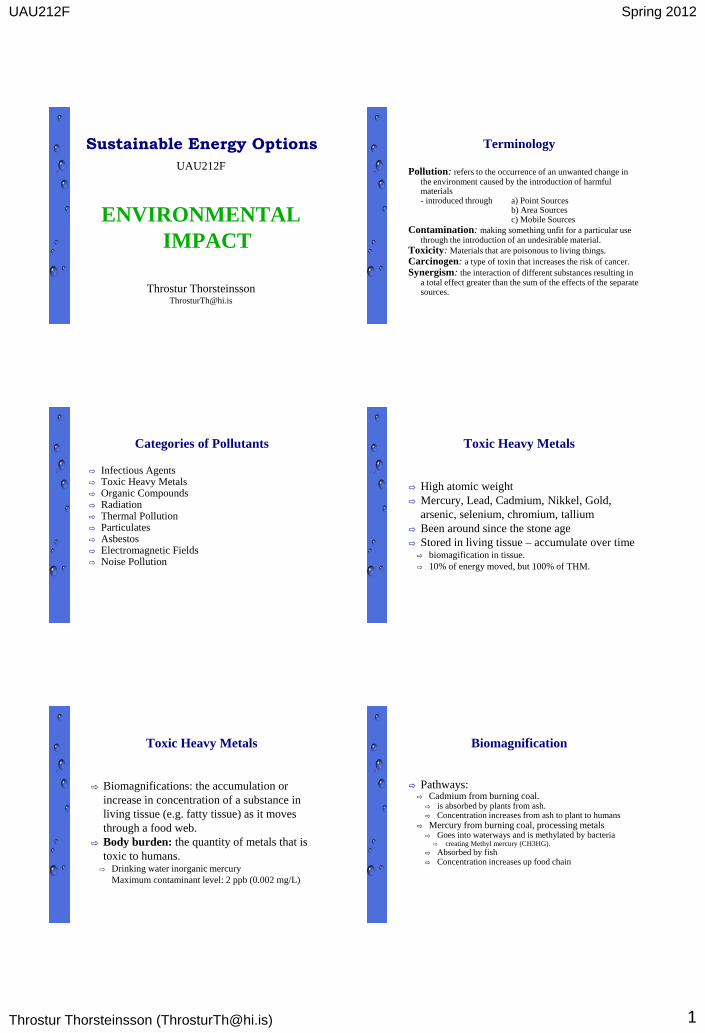
⇨ Pathways: ⇨ Cadmium from burning coal.
⇨ is absorbed by plants from ash. ⇨ Concentration increases from ash to plant to humans
⇨ Mercury from burning coal, processing metals ⇨ Goes into waterways and is methylated by bacteria
⇨ creating Methyl mercury (CH3HG).
⇨ Absorbed by fish ⇨ Concentration increases up food chain
Biomagnification
UAU212F Spring 2012
Throstur Thorsteinsson ([email protected]) 2
⇨ Radiation: ⇨ Radiation from nuclear power plants
⇨ Natural radiation
⇨ Thermal pollution ⇨ Heat released into water
⇨ Changes average water temp and dissolved oxygen –
causing changes in biota
Radiation and thermal pollution
⇨ Small particles of dust ⇨ Asbestos
⇨ Soot
⇨ Road dust
⇨ Cause respiratory illnesses, cancer etc. ⇨ Depending on type.
⇨ Size matters – the smaller the more dangerous
Particulates
⇨ Radiation from electromagnetic fields ⇨ Power lines
⇨ Cell phones
⇨ Appliances
⇨ TV’s
No conclusive link to heath effects.
Electromagnetic fields
⇨ Defined as unwanted sound ⇨ Intensity measured in decibels (dB)
⇨ Average level at home 45 dB
⇨ Jet engine taking off 120 dB
⇨ Hearing loss 110 dB
⇨ But what really is noise pollution?
⇨ Anything above 80 dB is potentially dangerous.
Noise Pollution
⇨ Changes in Abundance
⇨ Changes in Distribution
⇨ Changes in Birth Rates
⇨ Changes in Death Rates
⇨ Changes in Growth Rates
General Effects of Pollutants
UAU212F Spring 2012
Throstur Thorsteinsson ([email protected]) 3
⇨ The idea that in spite of the fact that full
scientific certainty is often not available to
prove cause and effect, we should still take
cost-effective precautions to solve
environmental problems where there exists a
threat of potentially serious and/ or
irreversible environmental damage
Precautionary Principle
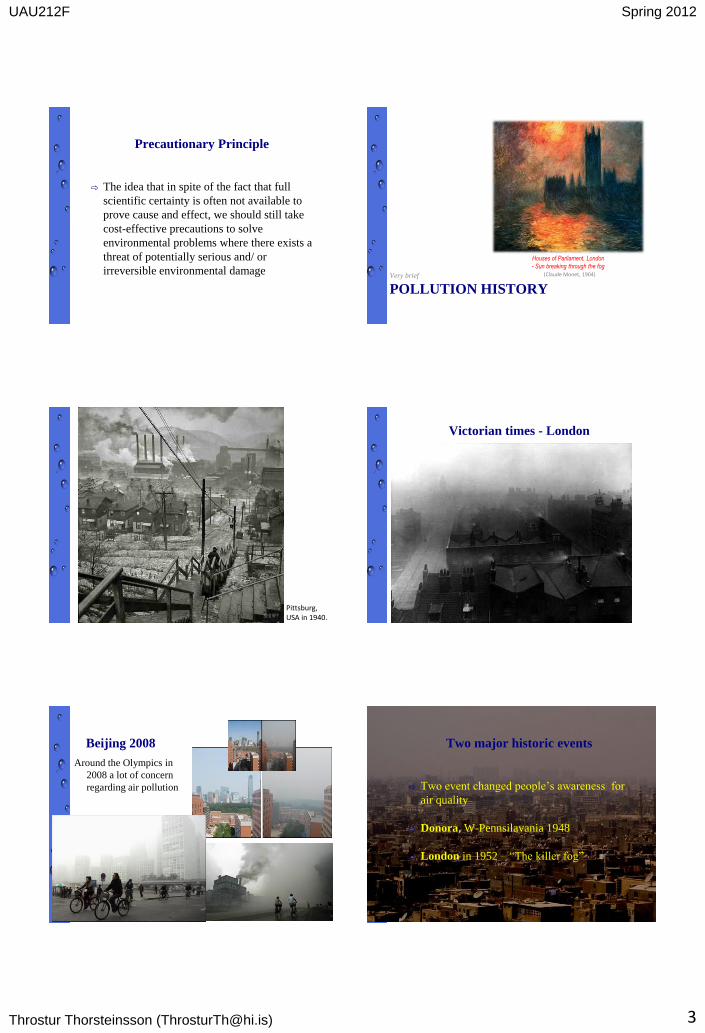
POLLUTION HISTORY Very brief
Houses of Parliament, London
- Sun breaking through the fog
(Claude Monet, 1904)
Pittsburg
Pittsburg, USA in 1940.
Victorian times - London
1838 - 1901
Beijing 2008
Around the Olympics in
2008 a lot of concern
regarding air pollution
Two major historic events
⇨ Two event changed people’s awareness for
air quality
⇨ Donora, W-Pennsilavania 1948
⇨ London in 1952 – “The killer fog”
Cairo smog
UAU212F Spring 2012
Throstur Thorsteinsson ([email protected]) 4
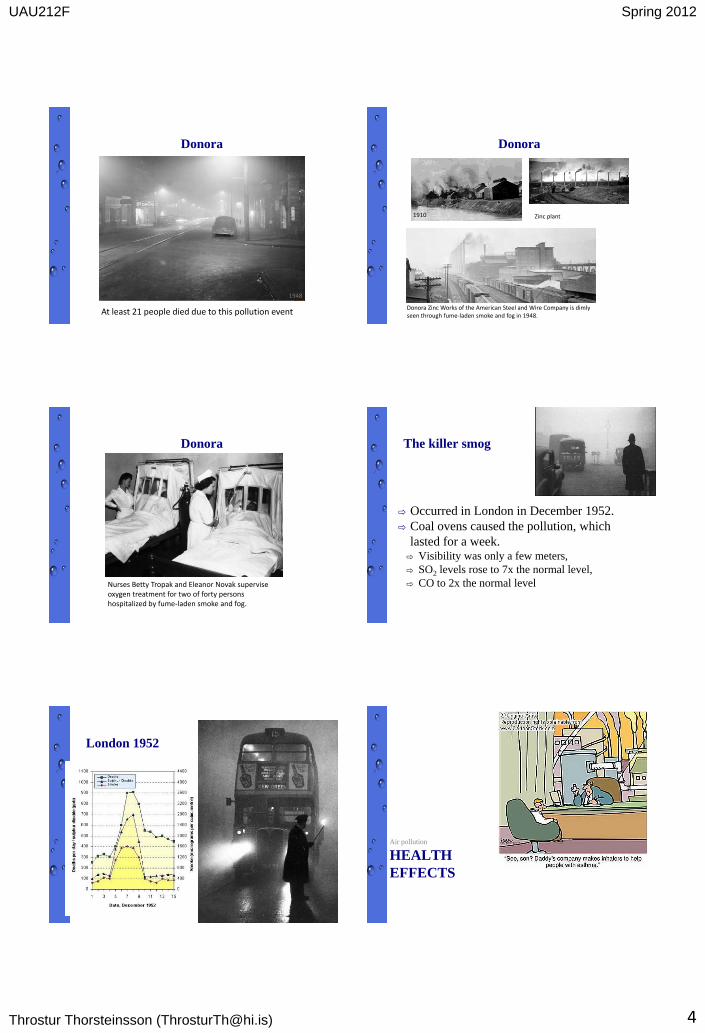
Donora
1948
At least 21 people died due to this pollution event
Donora
1910 Zinc plant
Donora Zinc Works of the American Steel and Wire Company is dimly seen through fume-laden smoke and fog in 1948.
Donora
Nurses Betty Tropak and Eleanor Novak supervise oxygen treatment for two of forty persons hospitalized by fume-laden smoke and fog.
The killer smog
⇨ Occurred in London in December 1952.
⇨ Coal ovens caused the pollution, which
lasted for a week. ⇨ Visibility was only a few meters,
⇨ SO2 levels rose to 7x the normal level,
⇨ CO to 2x the normal level
London 1952
Air pollution
HEALTH
EFFECTS
UAU212F Spring 2012
Throstur Thorsteinsson ([email protected]) 5
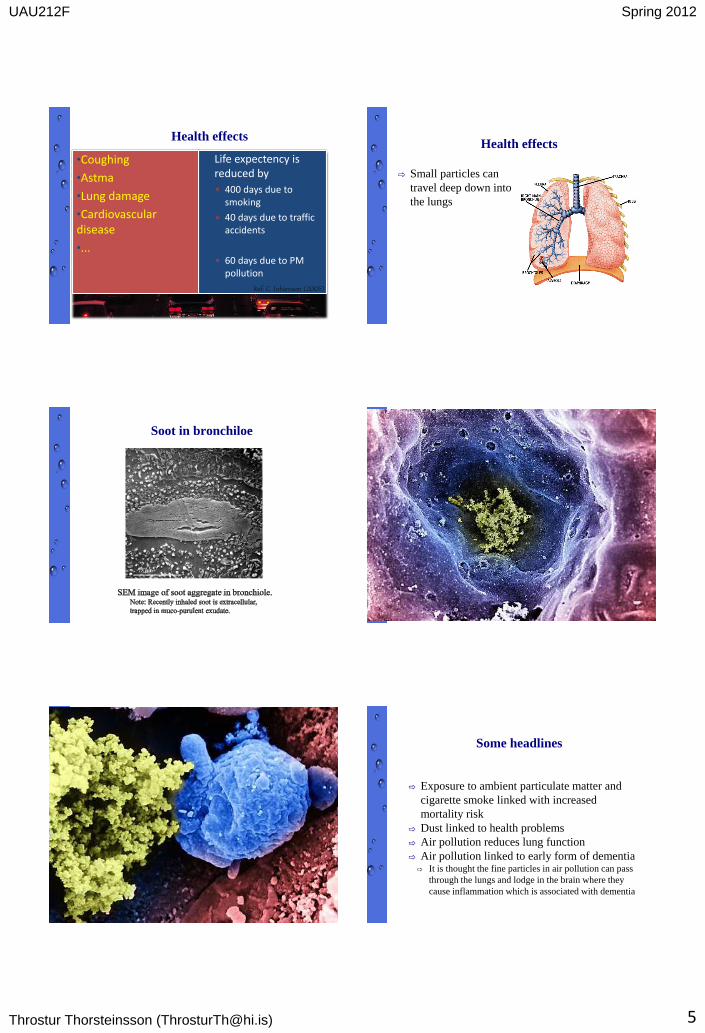
Health effects
•Coughing
•Astma
•Lung damage
•Cardiovascular disease
•...
Life expectency is reduced by
400 days due to smoking
40 days due to traffic accidents
60 days due to PM pollution
Ref: C. Johansson (2005)
Health effects
⇨ Small particles can
travel deep down into
the lungs
Soot in bronchiloe
Some headlines
⇨ Exposure to ambient particulate matter and
cigarette smoke linked with increased
mortality risk
⇨ Dust linked to health problems
⇨ Air pollution reduces lung function
⇨ Air pollution linked to early form of dementia ⇨ It is thought the fine particles in air pollution can pass
through the lungs and lodge in the brain where they
cause inflammation which is associated with dementia
UAU212F Spring 2012
Throstur Thorsteinsson ([email protected]) 6
Headlines continued
⇨ Air pollution could boost blood pressure
⇨ Polluted air impairs neurons that regulate
heart rate in mice
Air Pollution
Regional, Local
Throstur Thorsteinsson [email protected]
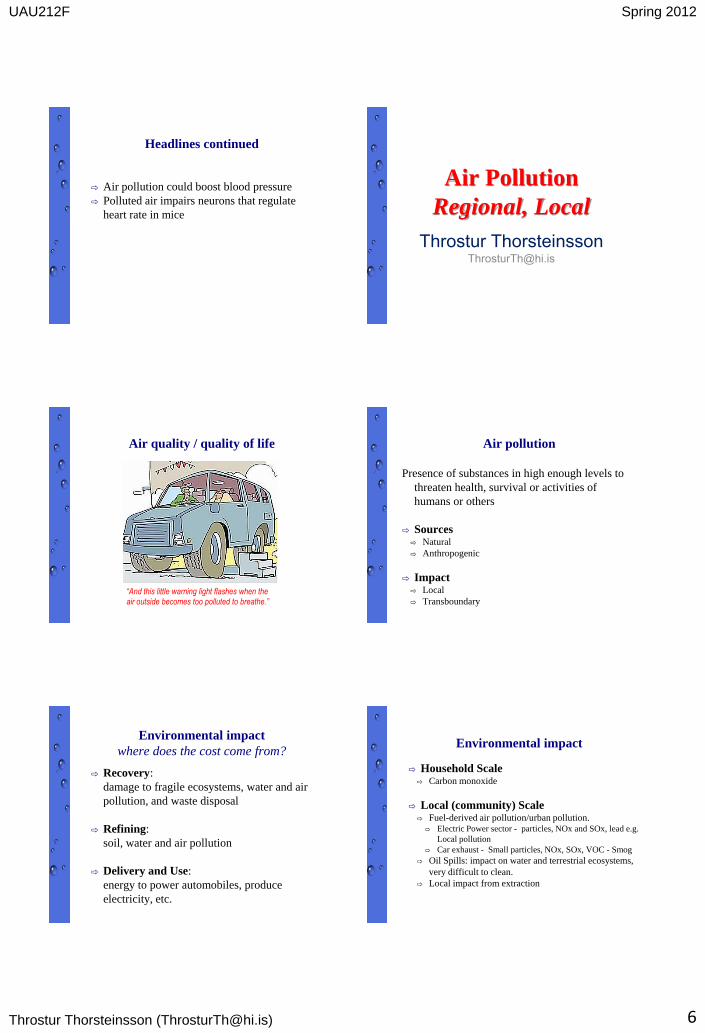
Air quality / quality of life
“And this little warning light flashes when the air outside becomes too polluted to breathe.”
Air pollution
Presence of substances in high enough levels to
threaten health, survival or activities of
humans or others
⇨ Sources ⇨ Natural
⇨ Anthropogenic
⇨ Impact ⇨ Local
⇨ Transboundary
Environmental impact
where does the cost come from?
⇨ Recovery:
damage to fragile ecosystems, water and air
pollution, and waste disposal
⇨ Refining:
soil, water and air pollution
⇨ Delivery and Use:
energy to power automobiles, produce
electricity, etc.
Environmental impact
⇨ Household Scale ⇨ Carbon monoxide
⇨ Local (community) Scale ⇨ Fuel-derived air pollution/urban pollution.
⇨ Electric Power sector - particles, NOx and SOx, lead e.g.
Local pollution
⇨ Car exhaust - Small particles, NOx, SOx, VOC - Smog
⇨ Oil Spills: impact on water and terrestrial ecosystems,
very difficult to clean.
⇨ Local impact from extraction
UAU212F Spring 2012
Throstur Thorsteinsson ([email protected]) 7
Env. impact
⇨ Regional scale ⇨ Acid Rain
⇨ Global Scale ⇨ Climate change
Stationary and Mobile Sources of Air Pollution
⇨ Two Sources of Air Pollution
1. Stationary Sources: have a relatively fixed location
⇨ Point Sources
⇨ Area Sources
⇨ Fugitive sources (from pressurized equipment)
2. Mobile Sources: move from place to place while
emitting pollutants ⇨ Ex. Airplanes, vehicles
General Effects of Air Pollution
⇨ Visual quality of the environment ⇨ Discoloration, clarity
⇨ Health of Vegetation, Animals, Soil
⇨ Water Quality ⇨ Acidity, heavy metals
⇨ Natural and Artificial Structures
⇨ Human Health (dose response)
⇨ Indoor, outdoor
Dynamics of air pollution
How does concentration change? ⇨ Transport
⇨ Transboundary pollutants
⇨ Dilution ⇨ Mixing in the atmosphere
⇨ Transformation ⇨ Physical, chemical, photochemical
⇨ Removal ⇨ Rainout, washout, fallout
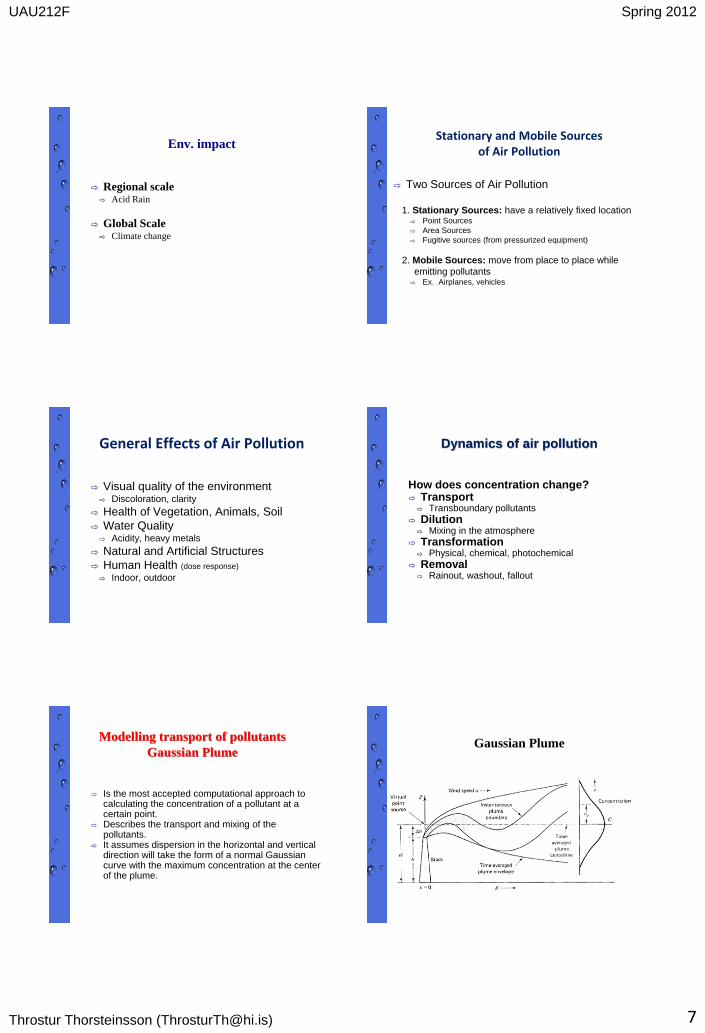
Modelling transport of pollutants
Gaussian Plume
⇨ Is the most accepted computational approach to
calculating the concentration of a pollutant at a certain point.
⇨ Describes the transport and mixing of the pollutants.
⇨ It assumes dispersion in the horizontal and vertical direction will take the form of a normal Gaussian curve with the maximum concentration at the center of the plume.
Gaussian Plume
UAU212F Spring 2012
Throstur Thorsteinsson ([email protected]) 8
Primary vs. Secondary
Pollutants
⇨ Primary Pollutants ⇨ Those emitted directly into the air
⇨ S02, CO, Hydrocarbons, particulates
⇨ Secondary Pollutants ⇨ Produced through reactions between primary
pollutants and normal atmospheric compounds
⇨ Ozone, Acid rain
Major Local and Transboundary
Air Pollutants
⇨ Sulfur Dioxide ⇨ Nitrogen Oxide ⇨ Carbon Monoxide ⇨ Ozone and Other Photochemical Oxidants ⇨ Volatile Organic Compounds ⇨ Particulate Matter ⇨ Hydrogen Sulfide ⇨ Hydrogen Fluoride
Transboundary Pollutants
Sulfur Dioxide
⇨ Colorless, highly corrosive and irritates the lungs, shortness of breath, narrow airways
⇨ Natural sources are volcanoes, sea spray , rotting vegetation and plankton
⇨ 50% of all sulfur in atmosphere is emitted from anthropogenic sources
⇨ Mostly from the use of fossil fuels, coal fired power plants, industrial processes
⇨ Precursor for acid rain
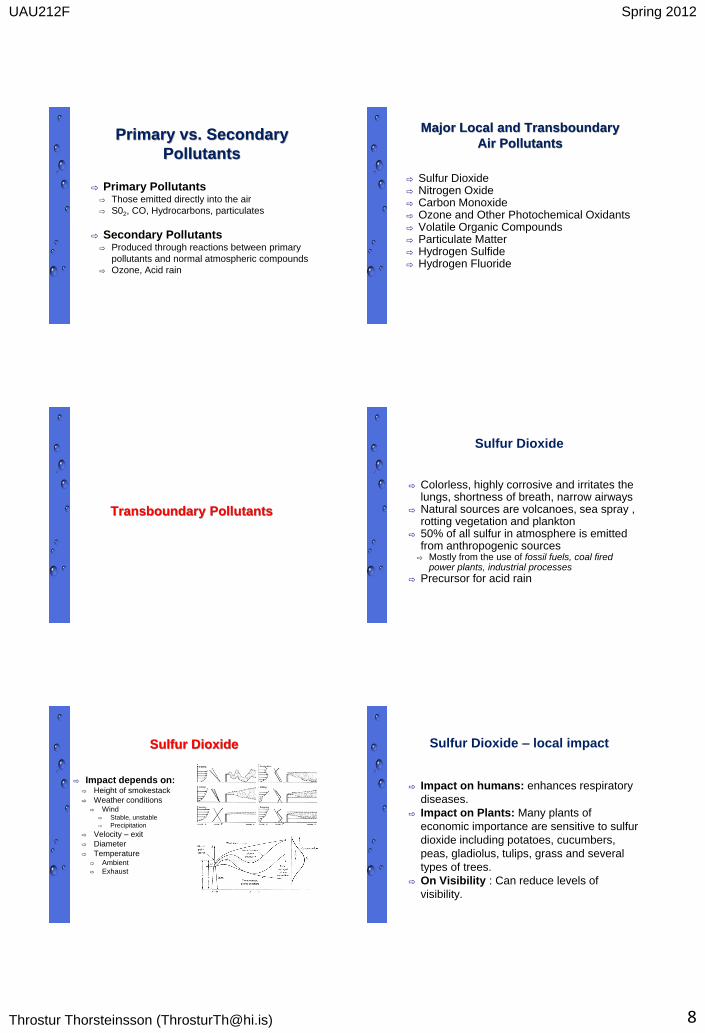
Sulfur Dioxide
⇨ Impact depends on: ⇨ Height of smokestack
⇨ Weather conditions ⇨ Wind
⇨ Stable, unstable
⇨ Precipitation
⇨ Velocity – exit
⇨ Diameter
⇨ Temperature ⇨ Ambient
⇨ Exhaust
Sulfur Dioxide – local impact
⇨ Impact on humans: enhances respiratory
diseases.
⇨ Impact on Plants: Many plants of
economic importance are sensitive to sulfur
dioxide including potatoes, cucumbers,
peas, gladiolus, tulips, grass and several
types of trees.
⇨ On Visibility : Can reduce levels of
visibility.
UAU212F Spring 2012
Throstur Thorsteinsson ([email protected]) 9
Acid Rain
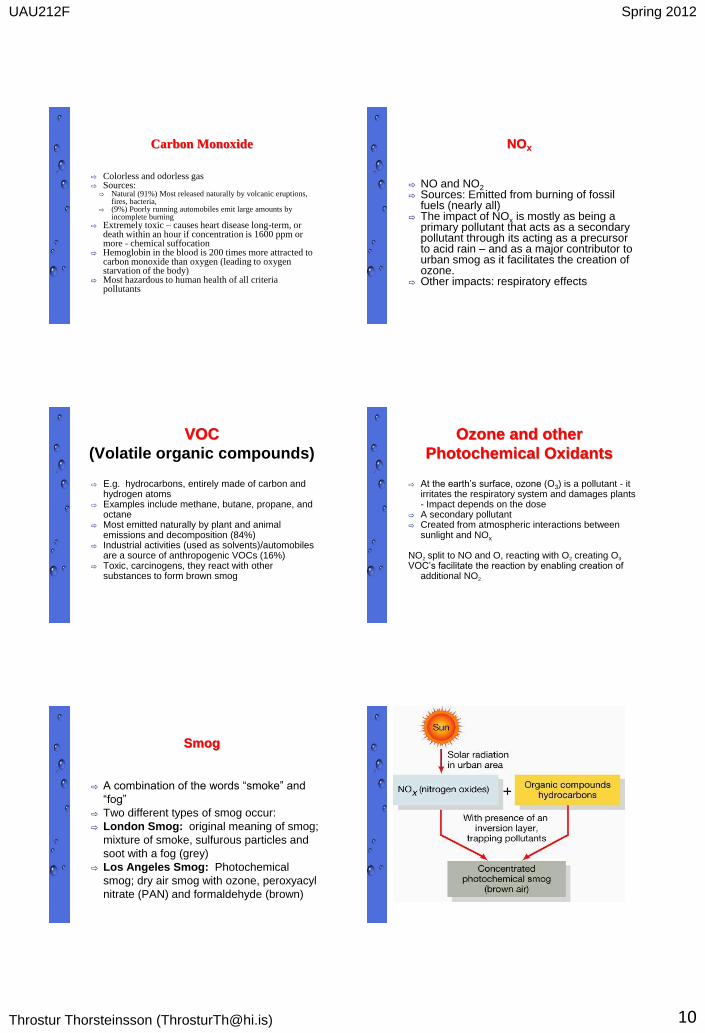
⇨ High smokestacks emit SO2 into higher layers – becomes transboundary
⇨ Acid rain originates from sulfur dioxide and nitrogen oxide particles – that become sulfate or nitrate particles
⇨ Travel long distances on wind currents ⇨ By combining with water vapor, these particles form
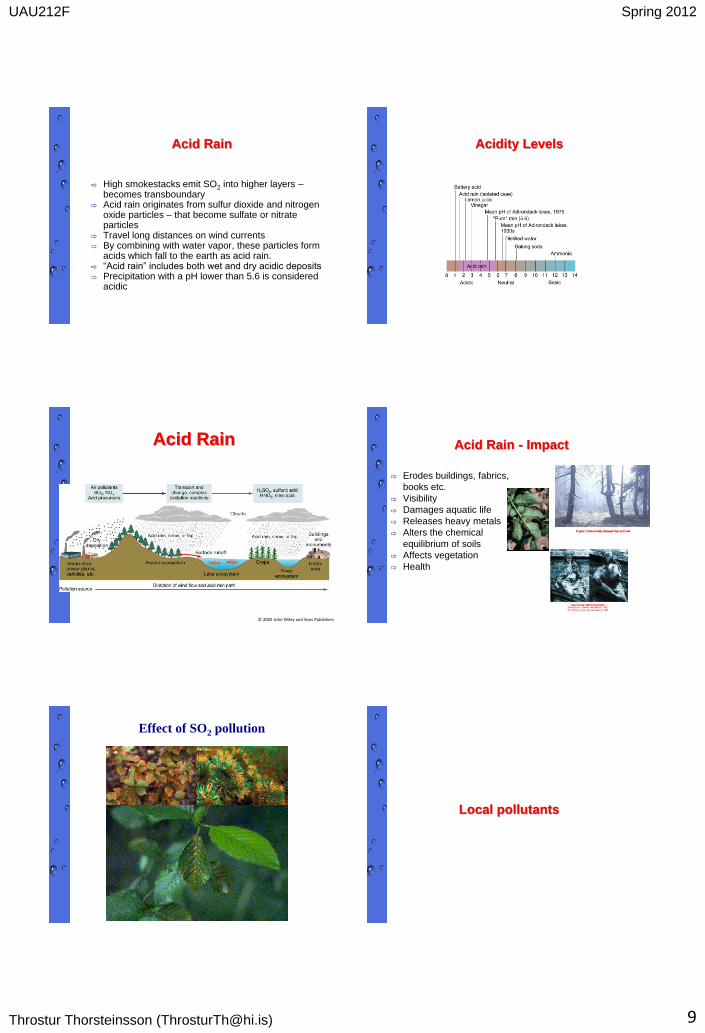
acids which fall to the earth as acid rain. ⇨ “Acid rain” includes both wet and dry acidic deposits ⇨ Precipitation with a pH lower than 5.6 is considered
acidic
Acidity Levels
© 2005 John Wiley and Sons Publishers
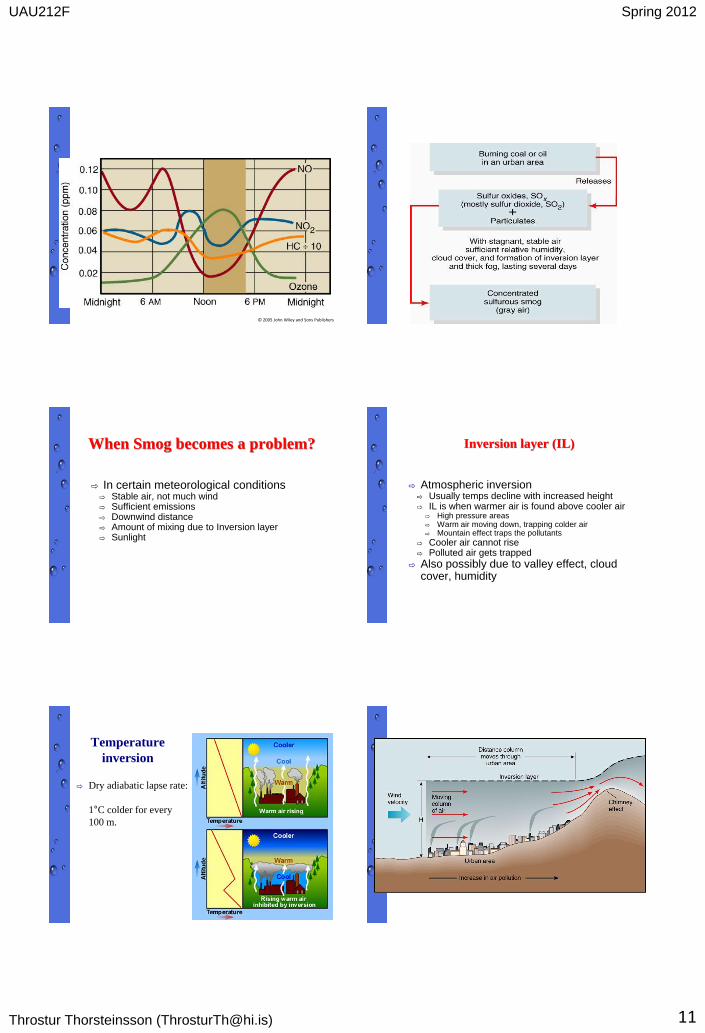
Acid Rain Acid Rain - Impact
⇨ Erodes buildings, fabrics,
books etc.
⇨ Visibility
⇨ Damages aquatic life
⇨ Releases heavy metals
⇨ Alters the chemical
equilibrium of soils
⇨ Affects vegetation
⇨ Health
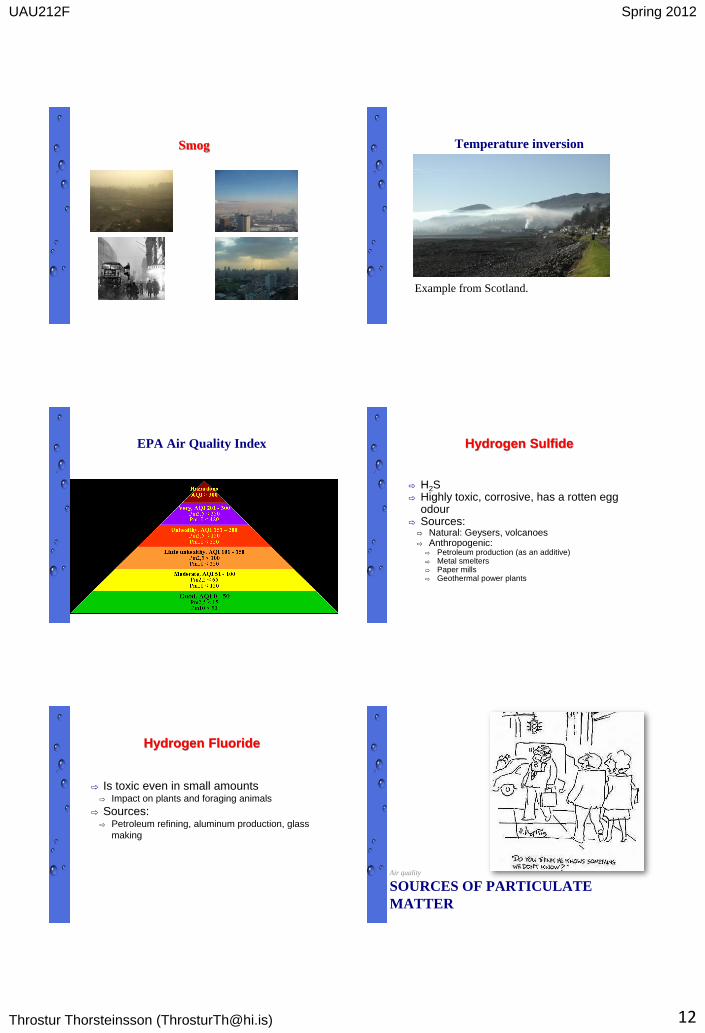
Effect of SO2 pollution
Local pollutants
UAU212F Spring 2012
Throstur Thorsteinsson ([email protected]) 10
Carbon Monoxide
⇨ Colorless and odorless gas ⇨ Sources:
⇨ Natural (91%) Most released naturally by volcanic eruptions, fires, bacteria,
⇨ (9%) Poorly running automobiles emit large amounts by incomplete burning
⇨ Extremely toxic – causes heart disease long-term, or death within an hour if concentration is 1600 ppm or more - chemical suffocation
⇨ Hemoglobin in the blood is 200 times more attracted to carbon monoxide than oxygen (leading to oxygen starvation of the body)
⇨ Most hazardous to human health of all criteria pollutants
NOX
⇨ NO and NO2 ⇨ Sources: Emitted from burning of fossil
fuels (nearly all) ⇨ The impact of NOx is mostly as being a
primary pollutant that acts as a secondary pollutant through its acting as a precursor to acid rain – and as a major contributor to urban smog as it facilitates the creation of ozone.
⇨ Other impacts: respiratory effects
VOC
(Volatile organic compounds)
⇨ E.g. hydrocarbons, entirely made of carbon and hydrogen atoms
⇨ Examples include methane, butane, propane, and octane
⇨ Most emitted naturally by plant and animal emissions and decomposition (84%)
⇨ Industrial activities (used as solvents)/automobiles are a source of anthropogenic VOCs (16%)
⇨ Toxic, carcinogens, they react with other substances to form brown smog
Ozone and other
Photochemical Oxidants
⇨ At the earth’s surface, ozone (O3) is a pollutant - it irritates the respiratory system and damages plants - Impact depends on the dose
⇨ A secondary pollutant ⇨ Created from atmospheric interactions between
sunlight and NOx NO2 split to NO and O, reacting with O2 creating O3
VOC’s facilitate the reaction by enabling creation of additional NO2
Smog
⇨ A combination of the words “smoke” and
“fog”
⇨ Two different types of smog occur:
⇨ London Smog: original meaning of smog;
mixture of smoke, sulfurous particles and
soot with a fog (grey)
⇨ Los Angeles Smog: Photochemical
smog; dry air smog with ozone, peroxyacyl
nitrate (PAN) and formaldehyde (brown)
UAU212F Spring 2012
Throstur Thorsteinsson ([email protected]) 11
© 2005 John Wiley and Sons Publishers
When Smog becomes a problem?
⇨ In certain meteorological conditions ⇨ Stable air, not much wind ⇨ Sufficient emissions ⇨ Downwind distance ⇨ Amount of mixing due to Inversion layer ⇨ Sunlight
Inversion layer (IL)
⇨ Atmospheric inversion ⇨ Usually temps decline with increased height ⇨ IL is when warmer air is found above cooler air
⇨ High pressure areas ⇨ Warm air moving down, trapping colder air ⇨ Mountain effect traps the pollutants
⇨ Cooler air cannot rise ⇨ Polluted air gets trapped
⇨ Also possibly due to valley effect, cloud cover, humidity
Temperature
inversion
⇨ Dry adiabatic lapse rate:
1°C colder for every
100 m.
UAU212F Spring 2012
Throstur Thorsteinsson ([email protected]) 12
Smog Temperature inversion
Example from Scotland.
EPA Air Quality Index
⇨ Method to convay information to the public
Hydrogen Sulfide
⇨ H2S ⇨ Highly toxic, corrosive, has a rotten egg
odour ⇨ Sources:
⇨ Natural: Geysers, volcanoes ⇨ Anthropogenic:
⇨ Petroleum production (as an additive) ⇨ Metal smelters ⇨ Paper mills ⇨ Geothermal power plants
Hydrogen Fluoride
⇨ Is toxic even in small amounts ⇨ Impact on plants and foraging animals
⇨ Sources: ⇨ Petroleum refining, aluminum production, glass
making
Air quality
SOURCES OF PARTICULATE
MATTER
UAU212F Spring 2012
Throstur Thorsteinsson ([email protected]) 13
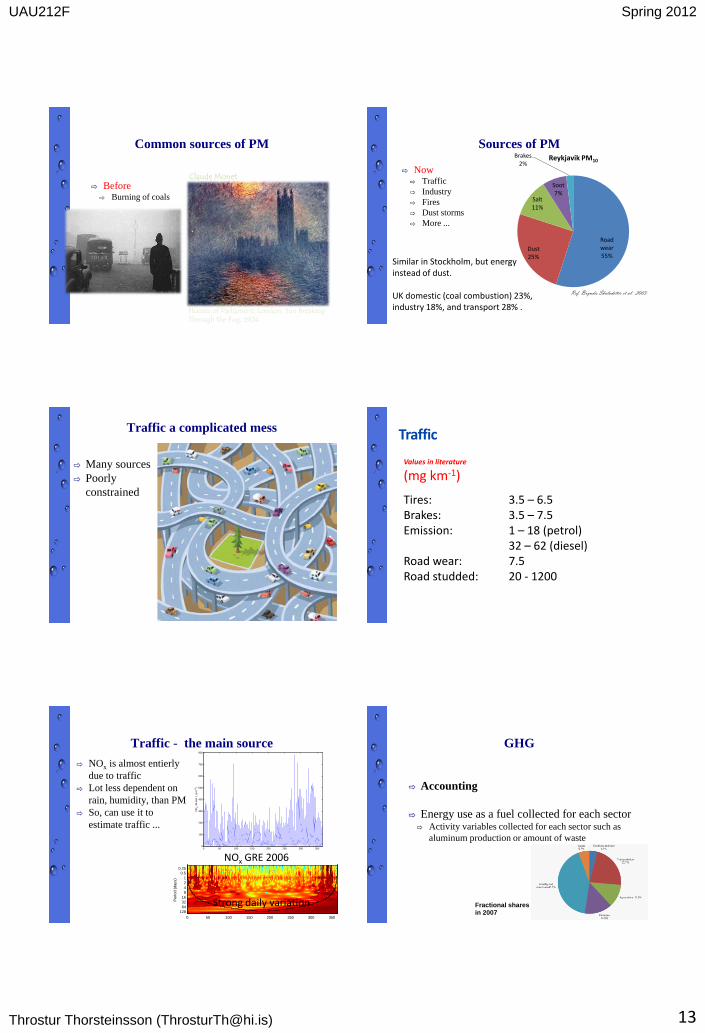
Common sources of PM
⇨ Before ⇨ Burning of coals
Houses of Parliament, London, Sun Breaking Through the Fog, 1904
Claude Monet
Sources of PM
⇨ Now ⇨ Traffic
⇨ Industry
⇨ Fires
⇨ Dust storms
⇨ More ...
Road wear 55%
Dust 25%
Salt 11%
Soot 7%
Brakes 2%
Reykjavik PM10
Ref. Bryndís Skúladóttir et al. 2003
Similar in Stockholm, but energy instead of dust. UK domestic (coal combustion) 23%, industry 18%, and transport 28% .
⇨ Many sources
⇨ Poorly
constrained
Traffic a complicated mess
Values in literature
(mg km-1)
Tires: 3.5 – 6.5 Brakes: 3.5 – 7.5 Emission: 1 – 18 (petrol) 32 – 62 (diesel) Road wear: 7.5 Road studded: 20 - 1200
Traffic
Traffic - the main source
⇨ NOx is almost entierly
due to traffic
⇨ Lot less dependent on
rain, humidity, than PM
⇨ So, can use it to
estimate traffic ...
0 50 100 150 200 250 300 3500
100
200
300
400
500
600
700
800
Day of 2006
NO
x 3
0-m
in (
g m
-3)
NOx GRE 2006 0 50 100 150 200 250 300 350
-5
0
5
10
15
Time (year)
d18O
a) d18O (func of time)
Time (days)
Period (
days)
b) d18O Wavelet Power Spectrum
0 50 100 150 200 250 300 350
0.25
0.5
1
2
4
8
16
32
64
128
0 2 4
x 105Power (d18O2)
c) Global Wavelet Spectrum
0 50 100 150 200 250 300 3500
200
400
600
800
Time (year)
Avg
variance (
d18O
2)
d) 5 - 6.5667 yr Scale-average Time Series
Strong daily variation
GHG
⇨ Accounting
⇨ Energy use as a fuel collected for each sector ⇨ Activity variables collected for each sector such as
aluminum production or amount of waste
Fractional shares in 2007

UAU212F Spring 2012
Throstur Thorsteinsson ([email protected]) 14
Transportation fuels Human influence on the atmosphere
GHG - Energy - Iceland
⇨ Energy authority collects data on energy use
by type and user
⇨ UST estimates emissions of CO2 based on
carbon and energy content of each fuel.
⇨ Emissions of other GHG a function of use
conditions,equipment and technologies
GHG – Transportation - Iceland
⇨ Energy authority
collects data on energy
use by type and user
⇨ UST estimates
emissions of CO2 based
on carbon and energy
content of each fuel.
⇨ Emissions of other
GHG a function of use
conditions, equipment
and technologies
BP Oil spills
Environment 2006 2007 2008 2009 2010
Number of oil spills # 300 213 170 122 142
Volume of oil spilled 106 l 2.2 1.0 3.4 1.2 1.7
Volume of oil unrecovered 106 l 0.4 0.3 0.9 0.2 0.8
Direct CO2 Mte 59.3 59.2 57 60.4 60.2
Indirect CO2 Mte 10.1 10.7 9.2 9.6 10.0
Direct methane Mte 0.24 0.20 0.21 0.22 0.22
Direct GHG Mte CO2e 64.4 63.5 61.4 65.0 64.9
Flaring (E&P) kte hydrocarbon 1241 1124 1718 2149 1671
Customer emissions Mte CO2 539 521 530 554 573
Env. and safety fines $ million 2.5 22.5 1.1 66.6 52.5
Environmental expenditure $ million 4026 3293 2520 2484 18400
Energy related pollution
More …
⇨ Land use
⇨ Visual effects