sustainability implications of the incorporation of a
TRANSCRIPT

sustainability
Article
Sustainability Implications of the Incorporation of aBiogas Trapping System into a Conventional CrudePalm Oil Supply Chain
Chye Ing Lim 1,*,† and Wahidul K. Biswas 2,†
1 Faculty of Engineering and Science, Curtin University Malaysia, Sarawak 98009, Malaysia2 Sustainable Engineering Group, Curtin University, Perth, WA 6845, Australia; [email protected]* Correspondence: [email protected]; Tel.: +60-85-443939; Fax: +60-85-443838† These authors contributed equally to this work.
Received: 25 December 2018; Accepted: 30 January 2019; Published: 2 February 2019�����������������
Abstract: This paper presents the sustainability implications of installing biogas trapping systemsin palm oil mills of a crude palm oil production supply chains in Malaysia. The study evaluatesthe impact of this mitigation strategy on the existing supply chains published by Lim and Biswas.The experience of a local palm oil mill installed with the KUBOTA biogas trapping system wasincorporated into a typical 60 metric tonne per hour palm oil mill for effluent treatment. This allowedus to assess the changes in sustainability performance of the whole crude palm oil supply chainusing the Palm Oil Sustainability Assessment (POSA) framework. Installing the biogas trappingsystem increased waste recycling and reuse percentage of the mill from 81.81% to 99.99% and theenergy ratio (energy output/fossil fuel and biomass energy input) from 2.45 to 2.56; and reducedthe Greenhouse Gas emission of the supply chain from 0.814 tonne CO2eq to 0.196 tonne CO2eq pertonne of Crude Palm Oil. This system could also potentially increase the mill’s annual revenue by2.3%, while sacrificing the sustainability performance of other economic indicators (i.e., a further 3%negative deviation of actual growth rate from sustainable growth rate). Overall, sustainability scoreof the supply chain improved from 3.47/5 to 3.59/5 on the 5-level-Likert-scale due to environmentalimprovement strategy consideration. Finally, this paper shows that the POSA framework is capableof capturing changes in the sustainability performance of triple bottom line indicators associatedwith the use or incorporation of any improvement strategy in the crude palm oil supply chain.
Keywords: palm oil; sustainability; biogas trapping; POME; cleaner production
1. Introduction
The full-fledged production of palm oil in Malaysia began in the 1980s. It has since become oneof the most important sectors in the country’s economic development. Whilst the industry createsjob opportunities, enriches businesses (small, medium, and large), empowers local smallholders,and revives small and rural townships [1,2], it has significantly changed the country’s landscape, byreplacing forests and farmland with a large-scale monoculture plantation [3,4]. The lack of or absenceof consultation and dialogue between producers and the local people has resulted in social conflicts [5].Palm oil production has recently received worldwide criticism due to its increased environmentalfootprint at different stages of the supply chain. Apart from the ‘devastating impacts’ [6] on forests andspecies, another major environmental impact is greenhouse gas (GHG) emissions from the applicationof considerable amounts of synthetic fertilizer, and aerobic digestion of large volumes of palm oil milleffluent (POME) [7,8]
POME is waste water produced from the crude palm oil production process. Raw POME has lowpH (4–5), a high temperature 60 ◦C–70 ◦C, a high Biochemical Oxygen Demand (BOD) of ~32,000 mg/L,
Sustainability 2019, 11, 792; doi:10.3390/su11030792 www.mdpi.com/journal/sustainability
Sustainability 2019, 11, 792 2 of 19
a high Chemical Oxygen Demand (COD) of ~62,000 mg/L, suspended solids of 5000–54,000 mg/L,and total nitrogen of 600–1000 mg/L [9,10], compared to the acceptable limit set by the MalaysianDepartment of Environment (DOE). For every processed tonne of fresh fruit bunches (FFB), 0.7–1.0 m3
of raw POME is generated [11]. Hence, a typical 60 MT/hr palm oil mill would generate about300,000 m3 POME waste per year, resulting an annual GHG emission of 37,000–52,000 tonnes of CO2eq.
Madaki and Lau [12] described POME as ‘the most expensive and difficult waste to manage’due to handling, storage, and treatment reasons. In order to meet the Department of Environment(DOE) water quality standards, more than 85% of palm oil mills use ponding systems (Pondingsystem employs biological methods, e.g., waste stabilization lagoons and oxidation (aerobic, anaerobic,facultative, maturation) ponds for wastewaters treatment. It is also used as sedimentation ponds forsludge or suspended solid settlement [13]) to treat raw POME [13,14] before it is discharged to waterbodies. Whilst this ponding system is the most conventional and relatively cheaper treatment option,it has a large land footprint (about 5 hectares for a 60 MT/hr mill) and carbon footprint (i.e., 33.6 m3 ofmethane per tonne of crude palm oil production through aerobic digestion) [15]. Methane is 28 timesmore powerful than carbon dioxide to produce global warming impact [16]. This open-space treatmentalso causes public nuisance as POME releases intolerable odor into the surrounding community.
To reduce the aforementioned environmental impacts associated with conventional POMEtreatments, the Malaysian Palm Oil Board (MPOB) has introduced new regulations that came intoeffect in January 2014. According to this regulation, all new palm oil mills, and existing mills that hadalready applied to throughput expansion, must include a ‘full biogas trapping or methane avoidancefacilities’ [17], i.e., biogas digester (i.e., an anaerobic digestion process where methane is generatedin the absence of oxygen) in the plant’s design. The regulation also requires the mills that were builtbefore January 2014 to upgrade with ‘full biogas trapping or methane avoidance facilities’ by 2020.Non-compliance with the regulation would risk the business losing its license to operate the mill [18].This regulation has in fact increased the investment cost for mill owners. It is difficult to offset thisincremental cost as the downstream supply chain of biogas markets is lacking [19].
Despite the resistance from stakeholders in the palm oil supply chain, the Malaysian governmenthad introduced this new regulation to reduce the environmental impact of palm oil production.The enforcement of full biogas trapping, or methane avoidance facilities, in palm oil industries is infact one of the eight Entry Point Projects under National Key Economic Area, with an aim to improvethe sustainability performance in the palm oil sector [17].
Recent research carried out overseas showed that biogas capture from POME could deliversignificant environmental benefits. Stichnothe and Schuchardt [20] carried out a life cycle assessment(LCA) to compare four types of palm oil waste management practices, including dumping Empty FruitBunches (EFB) and storing POME in ponding systems; using EFB in palm oil plantation and POMEin ponding system; using EFB and POME for co-composting for plantation; and biogas generationfrom POME. The results indicated that GHG emissions from palm oil mill waste can be significantlyreduced by 98% via converting methane to biogas. Besides, Nasution, et al. [21] compared open lagoonPOME treatment with combinations of open lagoon technology (COLT) consisting of compostingand COLT-Biogas systems in Indonesia. The study found that by replacing the open lagoon POMEtreatment with the COLT system could reduce GHG emissions by 357.18 kg CO2eq. These results agreewith findings in other studies [22,23], where the biogas trapping system as a POME waste treatmentsolution were found to significantly reduce overall GHG emissions of crude palm oil supply chains.These studies, however, mainly used life cycle assessment to estimate the GHG saving potential ofbiogas plants in palm oil supply chains, therefore, there exists a gap in terms of assessing other criticalenvironmental indicators as well as economic and societal impacts. Besides, system boundaries ofthese studies are limited to processes during the production stage in palm oil mills, and they do notconsider other stages in the entire supply chain, i.e., nursery and plantation stages.
The authors of this paper, Lim and Biswas, recently developed a POSA framework specificallyfor holistic sustainability assessment of crude palm oil production throughout its supply chain [24,25].

Sustainability 2019, 11, 792 3 of 19
This framework was subsequently applied to assess the environmental, economic, and socialsustainability implications of the most common crude palm oil supply chain of 60 MT/hr located inthe Borneo Island of Malaysia [26]. They found that the overall sustainability performance of this palmoil supply chain is 1.53 points below the sustainability threshold (i.e., 3.47/5), because improvementsare required in terms of GHG emissions reduction, smallholder equity enhancement, biomass wasterecycling and recovery, plantation practice, as well as average wages and local employment [26].Opportunities could exist for improving some of these indicators by complying with the government’snew regulation for biogas digester installation in palm oil mills. The palm oil mill in this supply chaindid not have a biogas trapping system. Thus, study’s challenge was to find out the sustainabilityimplications of incorporating a biogas trapping system into this existing crude palm oil supply chain.This allowed us to investigate the flexibility of the POSA framework in assessing changes to the supplychain when mitigation strategies are implemented.
Thus, this paper intends to evaluate:
1. The environmental, economic, and social sustainability performance of incorporating a biogastrapping system into a typical crude palm oil supply chain.
2. The level of improvement it would bring to the overall sustainability performance of crude palmoil production in Malaysia.
3. The flexibility of the POSA framework [25] in responding the changes in technology and strategiesin the supply chain.
2. Methodology
This research used the POSA framework to assess sustainability implications of incorporatinga biogas trapping system into the palm oil mill of a crude palm oil supply chain. A previous studyconducted by the authors Lim and Biswas [26], on the most common 60MT/hr crude palm oil supplychain in Borneo Island of Malaysia, was used as a baseline for comparison. The current paper utilizedraw or primary data of this 60MT/hr crude palm oil supply chain, as this research is a follow upinvestigation into previously published work [26].
Secondly, a KUBOTA biogas cum polishing plant (BGPP) was considered for incorporation asan improvement strategy. Accordingly, site-specific data was collected from this BGPP to investigatechanges in crude palm oil supply chain sustainability performance associated with the installation of asimilar BGPP in the 60 MT/hr palm oil mill. Primary data were collected from BGPP by obtainingsite operational data records, interviewing stakeholders in the supply chain, and conducting surveyswith local people to gather their collective feedback. Primary data were compiled and processed todetermine performance measures of the environmental, economic, and social sustainability objectivesof the POSA framework.
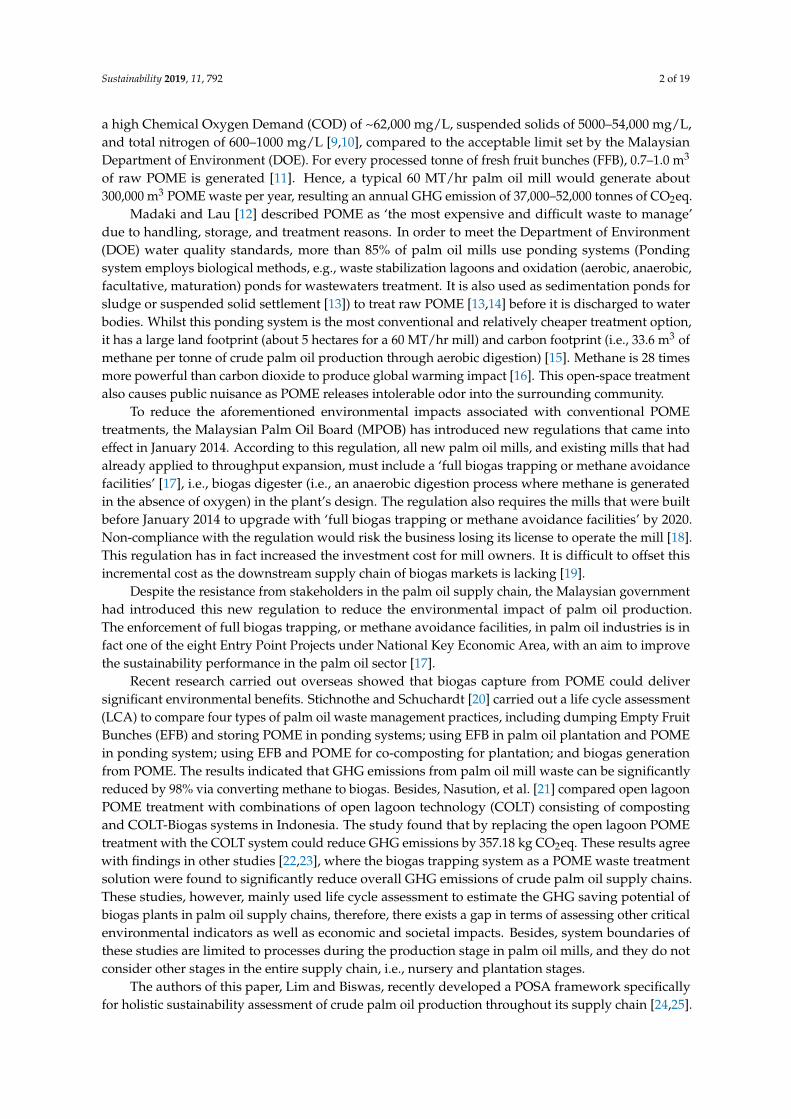
Figure 1 shows the systems boundary of a baseline crude palm oil supply chain consisting ofinput and output data, in order to calculate triple bottom line indicators and to show the interactionbetween stakeholders across this supply chain. In the comparative study, KUBOTA BGPP replaced thePOME pond (Figure 2).

Sustainability 2019, 11, 792 4 of 19Sustainability 2019, 11, x FOR PEER REVIEW 5 of 20
167
Figure 1. The reviewed baseline crude palm oil supply chain. 168
4. The KUBOTA Biogas and Polishing Plant 169
Figure 1. The reviewed baseline crude palm oil supply chain.
Sustainability 2019, 11, 792 5 of 19
Sustainability 2019, 11, x FOR PEER REVIEW 6 of 20
The KUBOTA BGPP consisting of Anaerobic Membrane Bioreactor (AnMBR) and Polishing 170 Plant with Membrane Bioreactor (MBR) that are considered in this case study are shown in Figure 2; 171 Figure 3. 172
The biogas plant used raw POME from palm oil mills as slurry to produce biogas at the rate of 173 30 Nm3 per tonne of POME. The methane content of biogas generated from POME is 62.55% [9]. This 174 biogas was sold to the neighboring brick factory, which is excluded from the system boundary of this 175 study due to the fact that the biogas was regenerated from waste, and the combustion of biogas or 176 the technology considered at a brick factory is not an outcome of the crude palm oil production 177 process. In addition, capital equipment are usually excluded in life cycle assessment [31]. 178
Permeate/digested slurry from the biogas plant is further treated in the polishing plant before 179 the waste water (final discharge) is released to the river. This system was designed to achieve a BOD 180 effluent of <20 mg/L, total nitrogen <100 mg/L, suspended solid <10 mg/L, and temperature <45 oC 181 [10], which complies with DOE’s requirements. 182
Digested slurry from the biogas and polishing plants is discharged to the sludge pond, where 183 the dewatering process takes place to produce a solid decanter that could be used as fertilizer in palm 184 oil plantations. Filtrate/supernatant liquid from the sludge ponds is returned to the polishing plant 185 for further treatment. 186
The use of this biogas trapping plant with a conventional open ponding system significantly 187 reduces the amount of land from 5 hectares to 1.5 hectares for waste management purposes [32], 188 associated with the release of an unpleasant odor. The BGPP uses membrane processes, which require 189 minimum maintenance such as periodic cleaning and servicing. These processes are fully automated, 190 as it only requires a few operators that could be sourced locally. 191
Apart from the aforementioned field information, following technical assumptions were 192 considered when determining PMs under the POSA framework. 193 i. Since the amount of sludge produced from the anaerobic process varies between 5% and 10% of 194
treated POME [11], an average of 7.5% was considered. 195 ii. Solid decanter cake from the sludge pond was assumed to be 4% of POME mass [30]. 196 iii. Density of biogas is 1.15 kg/Nm3 [33]. 197
198
Figure 2. Kubota biogas and polishing plant (BGPP). 199 Figure 2. Kubota biogas and polishing plant (BGPP).
Thirdly, the ranking value of each Performance Measures (PM), Key Performance Indicator (KPI),Higher Performance Indicator (HPI), and overall sustainability of the supply chain with the biogastrapping system were assessed using the POSA framework [24,25,27]. Each PM was ranked on a1–5 Likert scale, according to the pre-defined ranking criteria, where level 5 is the sustainabilitythreshold. The sustainability gap referred to the difference between threshold value of sustainability(5) and the rank of the corresponding indicator (i.e., between 1–5), based on the quantitative site dataor feedback given by the respondents in the supply chain. Each PM had a distributed weighting factordetermined by the stakeholders through collective feedback on its level of importance according toLim and Biswas [25]. The ranking value of PMs under a KPI was aggregated into the score of this KPI,and the score of KPIs under a HPI was aggregated into the score of this HPI. The overall sustainabilityscore for the supply chain was the aggregated value of HPI scores under environment, economic, andsocial objectives. Lastly, the triple bottom line indicators of both crude palm oil supply chains, withand without a BGPP, were compared to assess the level of improvement in sustainability performance.
3. Review of the Baseline Crude Palm Oil Supply Chain
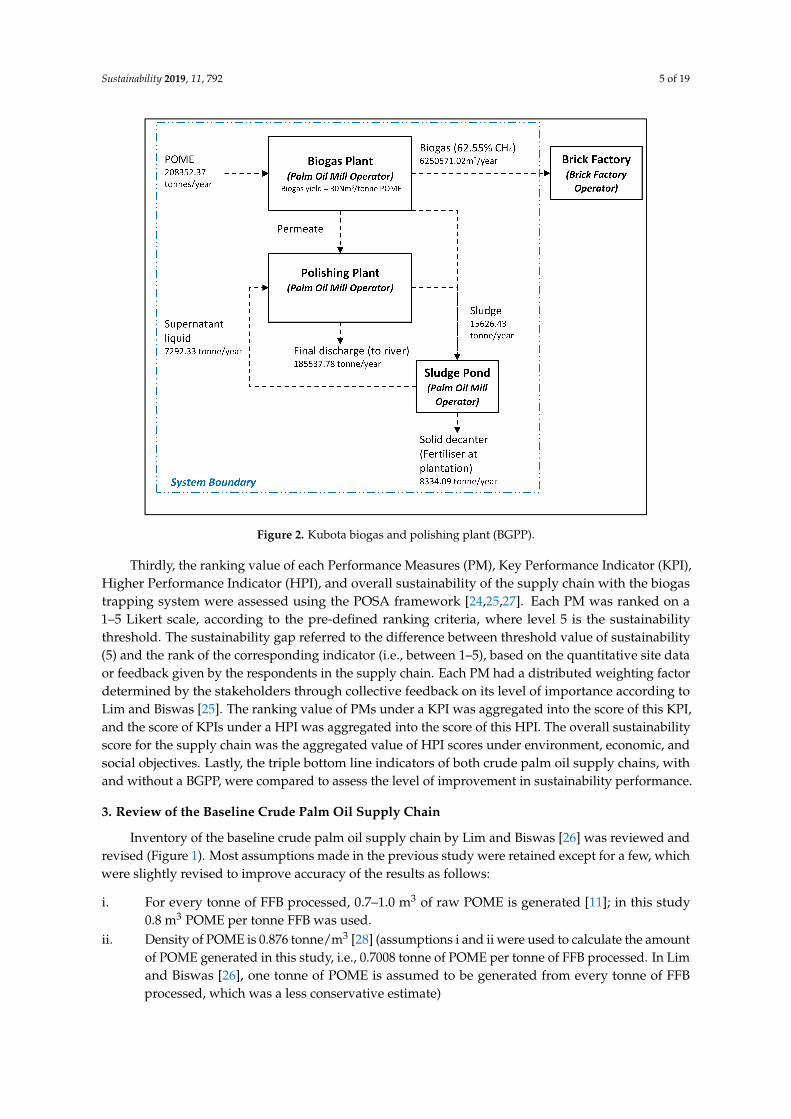
Inventory of the baseline crude palm oil supply chain by Lim and Biswas [26] was reviewed andrevised (Figure 1). Most assumptions made in the previous study were retained except for a few, whichwere slightly revised to improve accuracy of the results as follows:
i. For every tonne of FFB processed, 0.7–1.0 m3 of raw POME is generated [11]; in this study0.8 m3 POME per tonne FFB was used.
ii. Density of POME is 0.876 tonne/m3 [28] (assumptions i and ii were used to calculate the amountof POME generated in this study, i.e., 0.7008 tonne of POME per tonne of FFB processed. In Limand Biswas [26], one tonne of POME is assumed to be generated from every tonne of FFBprocessed, which was a less conservative estimate)

Sustainability 2019, 11, 792 6 of 19
iii. Five tonnes of water are consumed for every tonne of CPO produced, and more than 50% ofwater consumed is discharged as POME [29,30] (assumption iii considers water loss along thepalm oil mill processes, i.e., leakages, steam release, vents, etc. in addition to water dischargedas POME for total water consumption. Lim and Biswas [26] did not consider this water lossthroughout the milling process in calculating the water consumption)
4. The KUBOTA Biogas and Polishing Plant
The KUBOTA BGPP consisting of Anaerobic Membrane Bioreactor (AnMBR) and Polishing Plantwith Membrane Bioreactor (MBR) that are considered in this case study are shown in Figures 2 and 3.Sustainability 2019, 11, x FOR PEER REVIEW 7 of 20
200 Figure 3. The biogas plant, polishing plant, the neighboring brick factory, and sludge pond in 201 Sarawak, Malaysia (clockwise from top left corner). 202
5. Sustainability Implications of Incorporating a Biogas Plant 203 Sustainability implications of incorporating a biogas trapping system into the crude palm oil 204
supply chain was assessed using the POSA framework. Table 1 shows the data on the sustainability 205 performance measures of crude palm oil supply chains with and without the biogas trapping system. 206
Table 1. Comparing performance measures of supply chain with and without the biogas trapping 207 system. 208
Sust. Obj.
Headline Performance
Indicator (HPI)*
Key Performance Indicator (KPI)* Performance Measures (PM)*
PM values without biogas
trapping
PM values with Biogas
trapping
Env. 1
Natural Capital
Conservation
1.1 Climate Change 1.1.1 GHG Emission (kgCO2eq
per tonne CPO) 0.814 0.196
1.2 Air, Water and
Soil Quality
1.2.1 NOx emission intensity from palm oil mill
0 0
1.2.2
Biological Oxygen Demand of water
discharged from POME pond
22.25 17
1.2.3 Soil Nitrate Level measured
through pH in waterway
92 92
1.3 Waste
Generation 1.3.1 % biomass waste
recovery/recycling 81.809% ≈100%
1.4 Biodiversity 1.4.1 Plantation Practice (Number
of best practices met) 3.5/6 3.5/6
Figure 3. The biogas plant, polishing plant, the neighboring brick factory, and sludge pond in Sarawak,Malaysia (clockwise from top left corner).
The biogas plant used raw POME from palm oil mills as slurry to produce biogas at the rate of 30Nm3 per tonne of POME. The methane content of biogas generated from POME is 62.55% [9]. Thisbiogas was sold to the neighboring brick factory, which is excluded from the system boundary of thisstudy due to the fact that the biogas was regenerated from waste, and the combustion of biogas or thetechnology considered at a brick factory is not an outcome of the crude palm oil production process.In addition, capital equipment are usually excluded in life cycle assessment [31].
Permeate/digested slurry from the biogas plant is further treated in the polishing plant beforethe waste water (final discharge) is released to the river. This system was designed to achieve aBOD effluent of <20 mg/L, total nitrogen <100 mg/L, suspended solid <10 mg/L, and temperature<45 ◦C [10], which complies with DOE’s requirements.
Digested slurry from the biogas and polishing plants is discharged to the sludge pond, where thedewatering process takes place to produce a solid decanter that could be used as fertilizer in palm oilplantations. Filtrate/supernatant liquid from the sludge ponds is returned to the polishing plant forfurther treatment.
The use of this biogas trapping plant with a conventional open ponding system significantlyreduces the amount of land from 5 hectares to 1.5 hectares for waste management purposes [32],associated with the release of an unpleasant odor. The BGPP uses membrane processes, which require

Sustainability 2019, 11, 792 7 of 19
minimum maintenance such as periodic cleaning and servicing. These processes are fully automated,as it only requires a few operators that could be sourced locally.
Apart from the aforementioned field information, following technical assumptions wereconsidered when determining PMs under the POSA framework.
i. Since the amount of sludge produced from the anaerobic process varies between 5% and 10%of treated POME [11], an average of 7.5% was considered.
ii. Solid decanter cake from the sludge pond was assumed to be 4% of POME mass [30].iii. Density of biogas is 1.15 kg/Nm3 [33].
5. Sustainability Implications of Incorporating a Biogas Plant
Sustainability implications of incorporating a biogas trapping system into the crude palm oilsupply chain was assessed using the POSA framework. Table 1 shows the data on the sustainabilityperformance measures of crude palm oil supply chains with and without the biogas trapping system.
Table 1. Comparing performance measures of supply chain with and without the biogastrapping system.
Sust.Obj.
Headline PerformanceIndicator (HPI) *
Key PerformanceIndicator (KPI) * Performance Measures (PM) *
PM ValueswithoutBiogas
Trapping
PM Valueswith Biogas
Trapping
Env. 1 Natural CapitalConservation
1.1 Climate Change 1.1.1 GHG Emission (kgCO2eqper tonne CPO) 0.814 0.196
1.2Air, Water and
Soil Quality
1.2.1 NOx emission intensityfrom palm oil mill 0 0
1.2.2
Biological OxygenDemand of water
discharged from POMEpond
22.25 17
1.2.3Soil Nitrate Level
measured through pH inwaterway
92 92
1.3 WasteGeneration 1.3.1 % biomass waste
recovery/recycling 81.809% ≈100%
1.4 Biodiversity
1.4.1Plantation Practice
(Number of bestpractices met)
3.5/6 3.5/6
1.4.2 Land Use
Planted onformal
agriculturalland
Planted onformal
agriculturalland
1.4.3 Species loss
12% voted 1,5% voted 2,
39% voted 3,34% voted 4,10% voted 5
12% voted 1,5% voted 2,39% voted 3,34% voted 4,10% voted 5
1.5 ResourcesConsumption 1.5.1
Energy (Fossil fuel andbiomass) consumption
intensity (Output/Inputenergy ratio)
2.45 2.56
Eco.
2Business
Continuity andResiliency
2.1Productivity
efficiency
2.1.1 Plantation yield (tonneFFB/hectare) 25.55 25.55
2.1.2Mill production efficiency
(tonne CPO pertonne FFB)
0.2196 0.2196
2.2 BusinessContinuity 2.2.1
Actual Growth Rate(deviation from
sustainable growth rate)−4% −7%
3Sharing ofEconomic
Power
3.1 Relative Poverty 3.1.1Average annual income
per worker (% of nationalaverage income)
26.95 26.95
3.2
Localcommunity
inclusion anddistribution of
wealth
3.2.1Employment opportunity
for the local (% of localemployment)
31.33 31.33
3.2.2 Smallholders’ equity 10% 10%

Sustainability 2019, 11, 792 8 of 19
Table 1. Cont.
Sust.Obj.
Headline PerformanceIndicator (HPI) *
Key PerformanceIndicator (KPI) * Performance Measures (PM) *
PM ValueswithoutBiogas
Trapping
PM Valueswith Biogas
Trapping
Soc.
4 Social Wellbeing 4.1MeetingEssential
Human Needs
4.1.1 Workers’ accessibility towater supply 100% 100%
4.1.2 Workers’ accessibility tohealth care 100% 100%
4.1.3 Provision of sanitationfacilities to workers 100% 100%
4.1.4 Provision of housingfacilities to workers 100% 100%
5 Social Equity 5.1
Localcommunity
empowermentand engagement
5.1.1 Sharing of informationwith the local community
32% voted 1,10% voted 2,36% voted 3,22% voted 4,0% voted 5
32% voted 1,10% voted 2,36% voted 3,22% voted 4,0% voted 5
5.1.2Fair Partnership and
Community involvementin decision making
19% voted 1,20% voted 2,29% voted 3,27% voted 4,5% voted 5
19% voted 1,20% voted 2,29% voted 3,27% voted 4,5% voted 5
5.1.3Level of community
acceptance to plantationand mill activities
85%agreement
85%agreement
* These HPIs, KPIs and PMs sourced from authors’ papers on POSA framework [26]. Shaded in grey are PMsaffected by the introduction of the biogas trapping system. ** It is worth mentioning that an LCA approach thatfollows ISO14040-44 [34,35], was only used to measure the carbon footprint/life cycle GHG emissions as theestimation of this indicator requires all upstream and downstream data.
5.1. Environmental Sustainability Performance Measures
Out of nine PMs under the environmental objectives, four PMs, i.e., PM1.1.1—GHG Emission;PM1.2.2—biological oxygen demand of water discharged from POME pond; PM 1.3.1—percentage ofbiomass waste recovered or recycled; and PM 1.5.2—Energy (fossil fuel and biomass) consumptionintensity (output/Input energy ratio) were improved due to the incorporation of a BGPP.
PM1.1.1—GHG Emission—in the case of baseline crude palm oil supply chain without the biogastrapping system, an estimated 208,352 tonnes of POME were generated due to the production of65,277 tonnes of CPO per year. The discharge of this POME to existing open ponding systems releases~1439 tonnes of methane gas (i.e., 40,287 tonnes CO2eq [16]) per year, accounting for ~76% of thesupply chain GHG emissions (Table 2).
Table 2. GHG emissions from crude palm oil supply chains with and without a biogas trapping facility.
Source of EmissionGHG Emission (kgCO2eq)
Without Biogas Trapping With Biogas Trapping
Smallholder FFB 1.47 × 10⁶ 2.77% 1.47 × 10⁶ 11.48%Large Plantation FFB 9.82 × 10⁶ 18.49% 9.82 × 10⁶ 76.55%
Water 1.23 × 10² 0.00% 1.23 × 10² 0.00%Fossil Fuel consumed by mill 1.50 × 10⁶ 2.83% 1.50 × 10⁶ 11.73%
Methane from POME 4.03 × 10⁷ 75.86% N/A N/AChemical for Water Treatment Plant 2.45 × 10⁴ 0.05% 2.45 × 10⁴ 0.19%Chemical for biogas/polishing plant N/A N/A 6.21 × 10³ 0.05%
Total 5.31 × 10⁷ 100.00% 1.28 × 10⁷ 100.00%
FFB production was the second largest emitter of GHG after POME. It was found that largeplantations that contribute to 90% equity emitted less GHG for FFB production (i.e., 36.7 kgCO2eq)than the smallholders’ plantations that contributed to 10% of the equity in the supply chain (i.e.,49.55 kgCO2eq), due to the use of efficient machinery, and fertilizer management practices [36].In addition, large plantations have skilled manpower and management systems to optimize its

Sustainability 2019, 11, 792 9 of 19
operation. This research estimated that the incorporation of a BGPP into the palm oil mill of supplychains could significantly reduce GHG emissions by 75.9% mainly due to the complete elimination ofmethane from POME. There was, however, a release of negligible amounts of GHG (i.e., 0.05% of totalemission) from this plant due to the use of chemicals in membrane cleaning processes in BGPP.
PM1.2.2—biological oxygen demand of water discharged from POME ponds—the POMEtreatment, using conventional ponding system, in the current analysis met the DOE’s requirement forBOD of waste water discharge <100 mg/L. This was because the BGPP system could further reducethe BOD to a level below 20 mg/L. However, the use of this open ponding system during the time offlood is risky, as POME could overflow and pollute fresh water in surrounding areas. Since POMEis enclosed in the biogas trapping plant, it eliminates the risks associated with water and groundpollution in the event of a flood.
PM 1.3.1—percentage of biomass waste recovered or recycled—biomass waste generated fromthe mill is equal to the mass of FFB minus the mass of main products, i.e., crude palm oil and palmkernel. Biomass waste, in the form of EFB and mesocarp fiber, contains useful materials and energythat could be recovered. The recovery processes in the existing system of palm oil mill use most ofthese biomass wastes (82%) for palm kernel shell, bio-fertilizer production, and energy generation.Part of this biomass waste is used as fuel in the boiler to generate steam for the milling process. The ashgenerated due to combustion of this waste for energy generation was purchased by the neighboringcement factory for its use as a partial replacement of cement in concrete [37]. This ash was also used asa substitute for potassium organic fertilizer [38]. The rate of recovery or recycling of biomass waste(i.e., PM 1.3.1) could increase due to the introduction of this biogas trapping system.
Of the biomass waste (i.e., 39,878 tonnes per year) generated from the palm oil mill in the existingsupply chain, 18% is unrecoverable and is discharged in the form of POME. The installation of a biogastrapping plant in the system converts this unused biomass waste that exists in POME into methane forenergy generation. Figure 4 shows that the biomass waste recovery in palm oil mills increased from82% to 99.99% due to the use of the biogas trapping system. Only a small portion of biomass wastewas unrecovered in this new system, which is the suspended solid in the final discharge/effluent(i.e., about 0.001% of the final discharge, <10 mg/L).
Sustainability 2019, 11, x FOR PEER REVIEW 10 of 20
ash generated due to combustion of this waste for energy generation was purchased by the 248 neighboring cement factory for its use as a partial replacement of cement in concrete [37]. This ash 249 was also used as a substitute for potassium organic fertilizer [38]. The rate of recovery or recycling of 250 biomass waste (i.e., PM 1.3.1) could increase due to the introduction of this biogas trapping system. 251
Of the biomass waste (i.e. 39,878 tonnes per year) generated from the palm oil mill in the existing 252 supply chain, 18% is unrecoverable and is discharged in the form of POME. The installation of a 253 biogas trapping plant in the system converts this unused biomass waste that exists in POME into 254 methane for energy generation. Figure 4 shows that the biomass waste recovery in palm oil mills 255 increased from 82% to 99.99% due to the use of the biogas trapping system. Only a small portion of 256 biomass waste was unrecovered in this new system, which is the suspended solid in the final 257 discharge/effluent (i.e., about 0.001% of the final discharge, <10 mg/L). 258
259
Figure 4. Biomass waste recovery in the palm oil mill (with and without the biogas trapping 260 system). 261
Biogas generated from the KUBOTA BGPP was used by the neighboring brick factory and 262 formed an industrial symbiotic relationship. This biogas could alternatively be used in situ to 263 supplement the energy needed at the mill’s steam boiler and reduce demand for mesocarp fiber. This 264 saved mesocarp fiber could then either be sold as a fuel to other industries or be further processed 265 into fertilizer. This is because the transportation of mesocarp fiber by trucks could be more convenient 266 than delivering gas through a complex pipe network to meet the energy demands of downstream 267 customers in isolated locations, where these palm oil mills are located. 268
PM 1.5.2—energy (fossil fuel and biomass) consumption intensity (output/input energy ratio)—269 the biogas trapping system traps 3,909,732 m3 methane gas per year for a 60 MT/hr mill, which is 270 equivalent to 145 TJ of energy. This increases the total energy output from the crude palm oil supply 271 chain by 4.6%. Therefore, PM 1.5.2, which is measured in terms of output/input energy ratio increased 272 from 2.45 to 2.56. Although the energy output/input ratio is low (rank at level 1/5), it is worth noting 273 that 96.9% of the energy input to the supply chain that mainly generates steam in the milling process, 274 comes from biomass waste recovered from the supply chain. This conserves 7,233 tonnes equivalent 275 of coal (assuming coal heating value of 20 MJ/kg) for the future generation and thereby, enhances 276 intergenerational social equity. Fossil fuel consumption for machinery at nurseries and plantations, 277 for transportation and diesel generators at palm oil mills amounted to 3.1% of the total energy input 278 of the supply chain. In this case, fossil fuel consumption remained unchanged with the introduction 279 of BGPP, as the biogas produced was considered to be sold to the neighbor brick factory through an 280 industrial symbiotic process. 281
5.2. Economic Sustainability Performance Measures 282
Figure 4. Biomass waste recovery in the palm oil mill (with and without the biogas trapping system).
Biogas generated from the KUBOTA BGPP was used by the neighboring brick factory and formedan industrial symbiotic relationship. This biogas could alternatively be used in situ to supplement theenergy needed at the mill’s steam boiler and reduce demand for mesocarp fiber. This saved mesocarpfiber could then either be sold as a fuel to other industries or be further processed into fertilizer. This isbecause the transportation of mesocarp fiber by trucks could be more convenient than delivering gas

Sustainability 2019, 11, 792 10 of 19
through a complex pipe network to meet the energy demands of downstream customers in isolatedlocations, where these palm oil mills are located.
PM 1.5.2—energy (fossil fuel and biomass) consumption intensity (output/input energy ratio)—the biogas trapping system traps 3,909,732 m3 methane gas per year for a 60 MT/hr mill, which isequivalent to 145 TJ of energy. This increases the total energy output from the crude palm oil supplychain by 4.6%. Therefore, PM 1.5.2, which is measured in terms of output/input energy ratio increasedfrom 2.45 to 2.56. Although the energy output/input ratio is low (rank at level 1/5), it is worth notingthat 96.9% of the energy input to the supply chain that mainly generates steam in the milling process,comes from biomass waste recovered from the supply chain. This conserves 7233 tonnes equivalentof coal (assuming coal heating value of 20 MJ/kg) for the future generation and thereby, enhancesintergenerational social equity. Fossil fuel consumption for machinery at nurseries and plantations, fortransportation and diesel generators at palm oil mills amounted to 3.1% of the total energy input ofthe supply chain. In this case, fossil fuel consumption remained unchanged with the introduction ofBGPP, as the biogas produced was considered to be sold to the neighbor brick factory through anindustrial symbiotic process.
5.2. Economic Sustainability Performance Measures
BGPP instillation requires a capital investment of USD 2.9 million (RM11.6 million) and anoperational expenditure of USD 0.12 million (RM 0.48 million) per year, for an investment period of16 years [39]. Biogas supply to the neighboring plant could increase the mill’s annual revenue by RM4.52 million (consider RM 33 per MMBtu [40]) by selling this to the neighboring brick factory. Hence,the profit was estimated to be RM 4.04 million per year with a payback period of 2.87 years (Assuming1USD = RM4).
PM2.2.1—deviation of actual growth rate (AGR) from sustainability growth rate (SGR) evaluatesif the palm oil mill’s growth is healthy for long term business continuity and resiliency. Growingtoo fast (i.e., a positive deviation) or too slow (i.e., a negative deviation) are both not economicallysustainable for the business [41,42]. A positive deviation of AGR from SGR means that the businesscannot be sustained without additional borrowing, and a negative deviation means the business isunderperforming considering the assets and cash it has in hand.
The additional investment on this environmental mitigation strategy increased the profit andrevenue but also increased the value of assets and debts. Table 3 compares the financial status of thepalm oil mill before and after one year of BGPP investment. The introduction of BGPP increased thesustainable growth rate of the palm oil mill, i.e., the maximum growth rate that the mill can sustainwithout having to increase financial leverage from 10% to 16% due to the higher return on equity andbusiness retention rate. AGR of the palm oil mill increased from 6% to 9% due to the higher recentsale figures, with additional revenue generated from selling the biogas. An increase in growth due tothe introduction of BGPP seems to have a positive impact on the supply chain, but it leads to a largerdeviation of actual growth rate from sustainable growth rate of −4% to −7%, hence causing a negativeeconomic impact to PM 2.2.1.
This deviation could be narrowed by reducing SGR through the productive use of excess cash,e.g., increasing dividends of shareholders or reducing business debt levels [42]. Alternatively, AGRcan be increased by increasing sales, through processing more FFB into CPO, palm kernel, and otherby-products with existing facilities.

Sustainability 2019, 11, 792 11 of 19
Table 3. Comparing financial status before and after BGPP investment.
ID Description Formula Unit Without BGPP With BGPP
a. Sales figure from startingpoint RM 11,547,410 11,547,410
b. Most recent sales figure RM 12,199,346 12,576,410
c. Total Sales throughout theyear RM 177,959,338 182,484,110
d. Total Assets at year end RM 70,737,661 82,337,661e. Dividend RM 4,282,930 5,569,167f. Net Income RM 9,392,273. 13,437,045g. Total Debt at year end RM 40,123,436 51,723,436h. Total Assets at year end RM 70,737,661 82,337,661i. Asset Utilization Rate c/d % 252% 222%j. Profitability Rate f/c % 5% 7%k. Financial Utilization Rate g/l % 131% 169%l. Total Equity h - g RM 30,614,225 30,614,225
m. Return on Equity I* j* k 0.17 0.28n. Dividend Rate e/f % 45.60% 41.45%o. Business Retention Rate 1 - n % 54.40% 58.55%p. Sustainable Growth Rate m * o % 10% 16%q. Actual Growth Rate (b - a)/a % 6% 9%
r.Actual Growth Rate
deviation from SustainableGrowth Rate
q - p % −4% −7%
Figures 5–7 illustrate the sensitiveness of total debt reductions, increased dividend, and increasedproduction (hence increase sales and net income) to SGR, AGR, and the deviation of AGR from SGR.AGR will remain constant, and SGR will be reduced if the total debts are cut down. The calculationshows that reducing total debts up to 23% of current debt levels would bring down the deviation ofAGR from SGR to zero provided all other parameters (e.g., dividend) remain the same. SGR will alsobe reduced with smaller impact, if the dividend paid to shareholders is increased (Figure 6). A moreeffective way to reduce the difference between AGR and SGR, is by increasing sales and net incomethrough increased production. Figure 7 shows that increasing both sales and net income by 9% wouldreduce the difference between AGR and SGR to zero.
Sustainability 2019, 11, x FOR PEER REVIEW 12 of 20
deviation of AGR from SGR. AGR will remain constant, and SGR will be reduced if the total debts 312 are cut down. The calculation shows that reducing total debts up to 23% of current debt levels would 313 bring down the deviation of AGR from SGR to zero provided all other parameters (e.g., dividend) 314 remain the same. SGR will also be reduced with smaller impact, if the dividend paid to shareholders 315 is increased (Figure 6). A more effective way to reduce the difference between AGR and SGR, is by 316 increasing sales and net income through increased production. Figure 7 shows that increasing both 317 sales and net income by 9% would reduce the difference between AGR and SGR to zero. 318
319
Figure 5. Effects of total debts reduction on SGR, AGR, and their deviation. 320
321 Figure 6. Effects of dividend increment on SGR, AGR, and their deviation. 322
Figure 5. Effects of total debts reduction on SGR, AGR, and their deviation.

Sustainability 2019, 11, 792 12 of 19
Sustainability 2019, 11, x FOR PEER REVIEW 12 of 20
deviation of AGR from SGR. AGR will remain constant, and SGR will be reduced if the total debts 312 are cut down. The calculation shows that reducing total debts up to 23% of current debt levels would 313 bring down the deviation of AGR from SGR to zero provided all other parameters (e.g., dividend) 314 remain the same. SGR will also be reduced with smaller impact, if the dividend paid to shareholders 315 is increased (Figure 6). A more effective way to reduce the difference between AGR and SGR, is by 316 increasing sales and net income through increased production. Figure 7 shows that increasing both 317 sales and net income by 9% would reduce the difference between AGR and SGR to zero. 318
319
Figure 5. Effects of total debts reduction on SGR, AGR, and their deviation. 320
321 Figure 6. Effects of dividend increment on SGR, AGR, and their deviation. 322 Figure 6. Effects of dividend increment on SGR, AGR, and their deviation.
Sustainability 2019, 11, x FOR PEER REVIEW 13 of 20
323
Figure 7. Effects of sales and net income increments on SGR, AGR, and their deviation. 324
The economic PMs including PM2.1.1—plantation yield (tonne FFB/hectare); and PM2.1.2—mill 325 production efficiency (tonne CPO per tonne FFB), do not seem to be affected by the introduction of a 326 biogas trapping system. This is because the BGPP only processes POME waste and does not affect 327 plantation activities and other crude palm oil extraction processes at the palm oil mill. The revenue, 328 profit, and cash flow have increased, but this extra earning neither directly benefitted the workers nor the 329 local community, probably due to consideration of other higher priority areas such as debts reduction as 330 the business had increased the capital investment through extra bank financing. Hence, PM3.1.1, i.e., 331 average annual income per worker, which is the percentage of national average income, and PM3.2.2 332 (i.e., smallholders' equity) remain unchanged. The BGPP requires minimum human involvement 333 during operation while the periodic maintenance task could be performed by the existing manpower 334 in the palm oil mill. Hence, the number of job opportunities for the local people (i.e., PM3.2.1 or 335 employment opportunity for the locals) remains the same. 336
5.3. Social Sustainability Performance Measures 337 Table 1 shows that the introduction of a biogas trapping system does not have an immediate and 338
direct effect on the social sustainability performance measures. In both supply chain scenarios, with 339 and without a biogas trapping system, the HPI of social wellbeing was achieved by fulfilling the 340 essential needs, including water supply, healthcare, sanitation facilities, and housing facilities for 341 workers (PM 4.1.1–4.1.4). The supply chain practiced the same administrative strategies on workers’ 342 welfare, regardless of whether a biogas trapping system is installed or not. 343
HPI of social equity (i.e., local community empowerment and engagement), which is attained 344 by sharing information with the local community (PM5.1.1) and by offering fair partnership and 345 community involvement in decision making (PM5.1.2), were not impacted by the biogas trapping 346 system. This is because the incorporation of the BGPP does not affect the local community in terms 347 of land accusation, pollution creation, and businesses, and so the consultation was not deemed 348 necessary. This was mainly driven by governing policies but not by community pressure. 349
This new development can potentially improve the level of community acceptance to plantation 350 and mill activities (PM 5.1.3), as the conversion of POME to biogas can reduce the unpleasant odor 351 produced by the open POME pond. It should be notable that the Department of Environment in 352 Malaysia receives ~1,082 complaints each year about odor pollution and this accounts for 2.4% of the 353 cases lodged/filed each year, and is ranked sixth as the major sources of odor pollution in the country 354
Figure 7. Effects of sales and net income increments on SGR, AGR, and their deviation.
The economic PMs including PM2.1.1—plantation yield (tonne FFB/hectare); and PM2.1.2—millproduction efficiency (tonne CPO per tonne FFB), do not seem to be affected by the introductionof a biogas trapping system. This is because the BGPP only processes POME waste and does notaffect plantation activities and other crude palm oil extraction processes at the palm oil mill. Therevenue, profit, and cash flow have increased, but this extra earning neither directly benefitted theworkers nor the local community, probably due to consideration of other higher priority areas such asdebts reduction as the business had increased the capital investment through extra bank financing.Hence, PM3.1.1, i.e., average annual income per worker, which is the percentage of national averageincome, and PM3.2.2 (i.e., smallholders’ equity) remain unchanged. The BGPP requires minimumhuman involvement during operation while the periodic maintenance task could be performed by theexisting manpower in the palm oil mill. Hence, the number of job opportunities for the local people(i.e., PM3.2.1 or employment opportunity for the locals) remains the same.

Sustainability 2019, 11, 792 13 of 19
5.3. Social Sustainability Performance Measures
Table 1 shows that the introduction of a biogas trapping system does not have an immediateand direct effect on the social sustainability performance measures. In both supply chain scenarios,with and without a biogas trapping system, the HPI of social wellbeing was achieved by fulfillingthe essential needs, including water supply, healthcare, sanitation facilities, and housing facilities forworkers (PM 4.1.1–4.1.4). The supply chain practiced the same administrative strategies on workers’welfare, regardless of whether a biogas trapping system is installed or not.
HPI of social equity (i.e., local community empowerment and engagement), which is attainedby sharing information with the local community (PM5.1.1) and by offering fair partnership andcommunity involvement in decision making (PM5.1.2), were not impacted by the biogas trappingsystem. This is because the incorporation of the BGPP does not affect the local community in terms ofland accusation, pollution creation, and businesses, and so the consultation was not deemed necessary.This was mainly driven by governing policies but not by community pressure.
This new development can potentially improve the level of community acceptance to plantationand mill activities (PM 5.1.3), as the conversion of POME to biogas can reduce the unpleasant odorproduced by the open POME pond. It should be notable that the Department of Environment inMalaysia receives ~1,082 complaints each year about odor pollution and this accounts for 2.4% ofthe cases lodged/filed each year, and is ranked sixth as the major sources of odor pollution in thecountry [43]. However, improvements on the level of community acceptance cannot be observedimmediately as it takes time for stakeholders to observe the system’s implications.
5.4. The Overall Sustainability Assessment
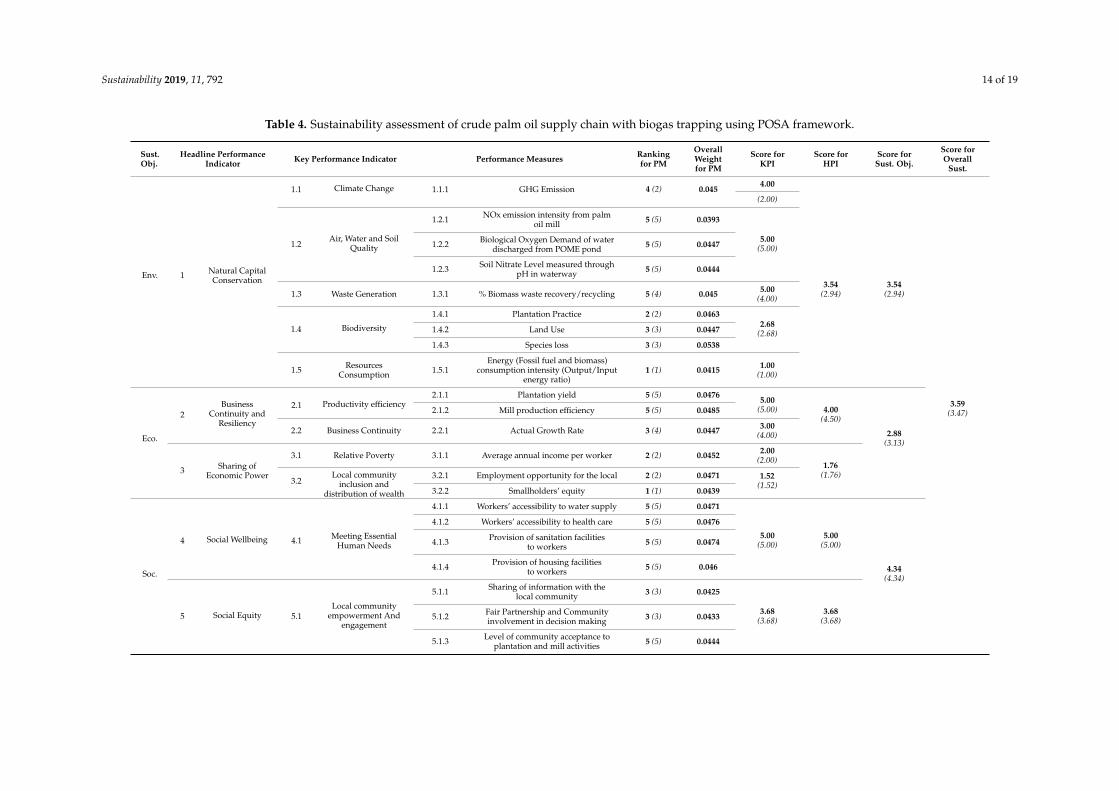
Sustainability assessment results of crude palm oil supply chains, with and without a biogastrapping system, were determined using the POSA framework. Ranks of PMs were determined bycomparing the data of PMs against the ranking criteria, while scores for KPIs, HPIs, sustainabilityobjectives, and overall sustainability were calculated using formulae developed by Lim and Biswas [25].For comparison purposes, rank value of PMs and score for KPIs, HPIs, sustainability objectives, andoverall sustainability of the existing supply chain (i.e., without a biogas trapping system) were includedin italic within brackets (Table 4).
The overall sustainability score improved from 3.47 to 3.59 out of 5, due to the incorporation of abiogas trapping system. Most of the improvements took place from an environmental perspective. TheHPI score of Natural Capital Conservation in the baseline supply chain increased from 2.94 out of 5 to3.54 out of 5 due to this improvement strategy. KPI 1.1—climate change—was significantly improveddue to higher performance of its PM 1.1.1—GHG emissions (76% reduction in GHG emission). Thishad in fact reduced the gap between the rank and the sustainability threshold of this PM from 3 to 1.Similarly, the gap for KPI 1.3—waste generation was reduced from 1 to 0 by improving the recovery ofbiomass waste by 17% (i.e., PM 1.3.1—percentage of biomass waste recovered/recycled).
The incorporation of biogas plant in the supply chain was found to increase the deviation of actualgrowth rate from sustainability growth rate by −3%, hence the ranking of its PM 2.2.1—actual growthrate—dropped from 4 out of 5 to 3 out of 5. This has been reflected on the score for KPI 2.2—businesscontinuity—HPI 2 of business continuity, and resiliency of the overall economic sustainability objective.
There were no changes in the scores of PMs, KPIs, HPIs, and sustainability for social sustainabilityobjectives. This means that the incorporation of a biogas plant in the supply chain does not causesocial consequences.
Sustainability 2019, 11, 792 14 of 19
Table 4. Sustainability assessment of crude palm oil supply chain with biogas trapping using POSA framework.
Sust.Obj.
Headline PerformanceIndicator Key Performance Indicator Performance Measures Ranking
for PM
OverallWeightfor PM
Score forKPI
Score forHPI
Score forSust. Obj.
Score forOverall
Sust.
Env. 1 Natural CapitalConservation
1.1 Climate Change 1.1.1 GHG Emission 4 (2) 0.0454.00
3.54(2.94)
3.54(2.94)
3.59(3.47)
(2.00)
1.2Air, Water and Soil
Quality
1.2.1 NOx emission intensity from palmoil mill 5 (5) 0.0393
5.00(5.00)1.2.2 Biological Oxygen Demand of water
discharged from POME pond 5 (5) 0.0447
1.2.3 Soil Nitrate Level measured throughpH in waterway 5 (5) 0.0444
1.3 Waste Generation 1.3.1 % Biomass waste recovery/recycling 5 (4) 0.045 5.00(4.00)
1.4 Biodiversity
1.4.1 Plantation Practice 2 (2) 0.04632.68
(2.68)1.4.2 Land Use 3 (3) 0.0447
1.4.3 Species loss 3 (3) 0.0538
1.5 ResourcesConsumption 1.5.1
Energy (Fossil fuel and biomass)consumption intensity (Output/Input
energy ratio)1 (1) 0.0415 1.00
(1.00)
Eco.
2Business
Continuity andResiliency
2.1 Productivity efficiency2.1.1 Plantation yield 5 (5) 0.0476
5.00(5.00) 4.00
(4.50)
2.88(3.13)
2.1.2 Mill production efficiency 5 (5) 0.0485
2.2 Business Continuity 2.2.1 Actual Growth Rate 3 (4) 0.0447 3.00(4.00)
3 Sharing ofEconomic Power
3.1 Relative Poverty 3.1.1 Average annual income per worker 2 (2) 0.0452 2.00(2.00)
1.76(1.76)
3.2Local community
inclusion anddistribution of wealth
3.2.1 Employment opportunity for the local 2 (2) 0.0471 1.52(1.52)
3.2.2 Smallholders’ equity 1 (1) 0.0439
Soc.
4 Social Wellbeing 4.1 Meeting EssentialHuman Needs
4.1.1 Workers’ accessibility to water supply 5 (5) 0.0471
5.00(5.00)
5.00(5.00)
4.34(4.34)
4.1.2 Workers’ accessibility to health care 5 (5) 0.0476
4.1.3 Provision of sanitation facilitiesto workers 5 (5) 0.0474
4.1.4 Provision of housing facilitiesto workers 5 (5) 0.046
5 Social Equity 5.1Local community
empowerment Andengagement
5.1.1 Sharing of information with thelocal community 3 (3) 0.0425
3.68(3.68)
3.68(3.68)5.1.2 Fair Partnership and Community
involvement in decision making 3 (3) 0.0433
5.1.3 Level of community acceptance toplantation and mill activities 5 (5) 0.0444

Sustainability 2019, 11, 792 15 of 19
With the implementation of a biogas trapping system, hotspot of the crude palm oil supply chain inPM 1.1.1—GHG emission—could potentially be eliminated. Other hotspots (i.e., PM 1.4.1—plantationpractice; PM1.5.2—energy (fossil fuel and biomass) consumption intensity (output/input energy ratio);PM3.1.1—average annual income per worker; PM3.2.1—employment opportunity for the local; andPM 3.2.2—smallholders’ equity) would not likely to be improved. Thus, some new strategies could beconsidered in the future, such as integrated livestock farming, pesticide and herbicide management,local skill development, and smallholder’s support program for reducing economic and environmentalhotspots (list few within this bracket in short) and to further reduce the overall sustainability gap.
6. Discussion
Our results show that implementing a biogas trapping system to the most common crude palm oilsupply chain in Malaysia allows the supply chain to reduce the sustainability gap. The results of thisassessment, using the POSA framework, are consistent with findings of others in the literature [20–23],where GHG emissions were significantly reduced with the introduction of a biogas plant. Thisassessment also found improvements in other environmental sustainability indicators, includingbiological oxygen demand of the water discharged, percentage biomass waste recovery/recycling, andenergy (fossil fuel and biomass) consumption intensity (output/input energy ratio). The land sizerequired for waste treatment could also be reduced from 5 hectares to 1.5 hectares (70% reduction). Thisreduction in land size, however, is insignificant in making an impact as the land used for plantation,which is reflected in PM 2.1.1 plantation yield (in tonne FFB per Ha) is much larger compared to thissaving. The results show that the biogas trapping system could cause beneficial repercussions in termsof enhanced environmental sustainability performances. Whilst overall environmental sustainabilityperformance improved due to this biogas trapping plant, some other specific environmental impactsthat depend on plant management system, such as plantation practice, land use, and species loss are stillsubstantial and did not reach the sustainability threshold. This confirms that the sustainability policy,along with technological improvements are required to achieve significant sustainability improvementsin the supply chain.
PM1.5.1—energy (fossil fuel and biomass) consumption intensity (output/input energy ratio)remains the hotspot despite the fact that the biogas plant contributes to additional energy output to thesupply chain. While strategies and efforts should be involved in order to reduce fossil fuel consumptionduring plantation, milling, and transportation stages, it is worth reviewing the definition of the energyinput in calculating this PM. The current calculation method includes energy input obtained from thebiomass waste generated within the system boundary. It could have been more accurate to consider thenet energy input in the system boundary of the supply chain [44,45], which could have also highlightedthe importance of energy conservation and recovery within the supply chain.
The installation of a biogas trapping system can increase the revenue and net profits of the palmoil mill of the baseline supply chain. The additional investment is economically feasible as a breakevenpoint can be attained in less than 3 years. The additional capital investment due to incorporationof this biogas trapping system can cause debts, and as the mill was underutilized, it could lead toa significant deviation of actual growth rate from sustainable growth rate. With current facilities’capacity and investment, the supply chain could have produced more crude palm oil and palm kernelfor sustainable growth. The shortage of FFB supply due to labor shortage and lower CPO market price,are some main key possible barriers to increase the growth of sales [46,47].
The introduction of a biogas trapping system does not play a role to combat poverty and wealthcreation, meaning that it does not help increase average annual income per worker, create employmentopportunity for the local people, and increase smallholders’ equity in this case study. However, withthe increase of revenue and profit, the supply chain has greater financial ability to improve the welfareof its employees. Palm oil mill owners in the supply chain could introduce schemes such as theemployee stock options plan [48] to improve the social security of their employees, which wouldreward, retain, and attract local employees. Employee stock options plan offers company shares

Sustainability 2019, 11, 792 16 of 19
to the employees and thus the employees could own part of the company. They could also benefitdirectly through the annual dividend when the company is making a profit. Making the employeesshareholders of the company meets the economic sustainability objective of sharing economic powerthrough distribution of wealth.
The biogas trapping system does not make any changes to the social sustainability performance.The perception and level of acceptance of the local community towards the palm oil supply chain isexpected to be more positive by reducing key environmental impacts, and also by eliminating odornuisance/pollution.
While the biogas trapping system helps improve the overall sustainability performance of thecrude palm oil supply chain, it cannot totally close the sustainability gap. Other environmentalsustainability issues need to be resolved in terms of further reduction of fossil fuel consumption,improved plantation practice to reduce the loss of biodiversity, and land usage, initiatives for speciesprotection, and by further reducing GHG emissions to meet the international target (i.e., 0.15 tonneCO2eq/tonne CPO, considering Malaysia’s pledge in Copenhagen for a 40% reduction in GHGemission by 2020 from 2005 level). This holistic framework also demonstrates that there exists largeeconomic and social sustainability gaps, particularly in sharing economic power and uplifting socialequity, which remain major areas of improvement, despite the efforts that could be made by installingthe biogas trapping system. These economic and social sustainability indicators would require newadministrative strategies and policy changes along the supply chain, e.g., increasing the share of freshfruit bunches collected from smallholders, and the practice of community-inclusive policy in decisionmaking, to make significant improvements.
The incorporation of technological changes in the supply chain modified the system boundarybut it did not affect the sustainability assessment process using the POSA framework. The quantifiableframework thus demonstrates flexibilities or captures any sort of changes associated with theincorporation of strategies in the crude palm oil supply chain to enhance the sustainabilityperformance. Key characteristics of the POSA framework that are generated from this researchare its comprehensiveness, decision making capability, and holistic or multidisciplinary assessment byexamining all indicators of the three sustainability objectives.
7. Conclusions
The paper demonstrates the flexibility of POSA framework to incorporate any improvements intothe existing supply chain of crude palm oil production for sustainability assessment. The incorporationof a biogas trapping system in palm oil mills for POME treatments as an environmental improvementstrategy, has improved the overall sustainability performance score of a typical crude palm oilproduction supply chain in Malaysia from 3.47 out of 5 to 3.59 out of 5. This POSA frameworkcaptured the changes/side effects associated with the incorporation of a biogas trapping systeminto the supply chain. Environmental indicators such as GHG emissions, BOD, and waste recoverywere improved due to inclusion/consideration of this environmental improvement strategy but theperformance of actual growth rate decreased.
There still exists a significant gap to achieve a complete sustainability outcome (i.e., 5 out of5), as the incorporation of one improvement strategy is not enough. This research using the POSAframework has further identified that biodiversity, wealth distribution, and social equity are someareas that require a significant level of improvement using relevant improvement strategies to closethis gap. The biogas trapping system would solve part of the problem but achieving sustainabilityproduction of crude palm oil remains a challenge to all stakeholders in the supply chain.
Similarly, other strategies can be incorporated into or trialed in the POSA framework until thesustainability performance gap becomes very close or equal to zero. This way the framework couldenable policy makers, businesses, and customers in the supply chain to discern right strategies inattaining sustainable crude oil production in Malaysia.

Sustainability 2019, 11, 792 17 of 19
This framework is limited to the crude palm oil production, but the system boundary could befurther extended by incorporating the refinery production processes to generate a finished product,e.g., olein for cooking oil and biodiesel, stearin for margarine and shortening. Besides, the accuracy inestimating some performance measures could be improved, e.g., species loss could be measured usingscientific methods (e.g., the species–area curve [49]) rather than collective feedback, soil nitrate levelscould be measured directly with a flow injection analyzer [50] rather than through pH in water way.
Author Contributions: Conceptualization, C.I.L. and W.K.B.; methodology, C.I.L.; validation, W.K.B.; formalanalysis, C.I.L.; investigation, C.I.L.; resources, C.IL.; data collection, C.I.L.; writing—original draft preparation,C.I.L.; writing—review and editing, C.I.L. and W.K.B.; visualization, C.I.L.; supervision, W.K.B.; projectadministration, C.I.L.
Funding: This research received no external funding
Acknowledgments: The authors would like to thank villages, smallholders, nurseries, plantation companies,palm oil mills and all the stakeholders along the crude palm oil supply chain who have participated in the datacollection process of this research. The authors also appreciate the administrative support provided by CurtinUniversity in completing this research.
Conflicts of Interest: The authors declare no conflict of interest.
Nomenclature
AGR Actual Growth RateBGPP Biogas cum Polishing PlantBOD Biochemical Oxygen DemandCO2eq Carbon Dioxide EquivalentCOD Chemical Oxygen DemandCPO Crude Palm OilDOE Department of EnvironmentEFB Empty Fruit BunchesFFB Fresh Fruit BunchesGHG Greenhouse GasHPI Higher Performance IndicatorKPI Key Performance Indicatorm3 cubic metermg/L Milligram per litreMJ Mega jouleMT/hr Metric tonne per hourNm3 Normal Cubic MeterPM Performance MeasurePOME Palm Oil Mill EffluentPOSA Palm Oil Sustainability AssessmentSGR Sustainable Growth Rate
References
1. Enden, S.V.D. Smallholders and Sustainable Palm Oil Production: A Better Understanding between PolicyArrangements and Real-Life Practices a Case Study of the Siak Smallholders Site, Riau Province. Master’sThesis, Wageningen University, Wageningen, The Netherlands, 2013.
2. Lyndon, N.; Razak, N.; Azima, A.M.; Junaidi, A.B.; Sivapalan, S. Empowerment of the bidayuh ruralcommunity oil palm smallholders: A case study in serian district, sarawak, Malaysia. Mediterr. J. Soc. Sci.2015, 6, 55. [CrossRef]
3. Rival, A.; Levang, P. Palms of Controversies—Oil Palm and Development Challenges; Center for InternationalForestry Research (CIFOR): Bogor, Indonesia, 2014.
4. Varsha, V.; Stuart, L.P.; Clinton, N.J.; Sharon, J.S. The impacts of oil palm on recent deforestation andbiodiversity loss. PLoS ONE 2016, 11, e0159668.
5. Colchester, M. Palm Oil and Indigenous People in South East Asia; The International Land Coalition: Rome,Italy, 2011.
6. WWF. Palm Oil & Biodiversity Loss. Available online: http://wwf.panda.org (accessed on 31 March 2017).7. Reijnders, L.; Huijbregts, M.A.J. Palm oil and the emission of carbon-based greenhouse gases. J. Clean. Prod.
2008, 16, 477–482. [CrossRef]

Sustainability 2019, 11, 792 18 of 19
8. Mohd Kusin, F.; Akhir, N.I.M.; Mohamat-Yusuff, F.; Awang, M. The impact of nitrogen fertilizer use ongreenhouse gas emissions in an oil palm plantation associated with land use change. Atmósfera 2015, 28,243–250. [CrossRef]
9. BBC. Bbc Biogas and Polishing Plant (Kubota System); Bhd, B.B.S., Ed.; BBC Sdn Bhd: London, UK, 2018.10. Foo, K.Y.; Hameed, B.H. Insight into the applications of palm oil mill effluent: A renewable utilization of the
industrial agricultural waste. Renew. Sustain. Energy Rev. 2010, 14, 1445–1452. [CrossRef]11. Rahayu, A.S.; Karsiwulan, D.; Yuwono, H.; Trisnawati, I.; Mulyasari, S.; Rahardjo, S.; Hokermin, S.;
Paramita, V. Handbook Pome-to-Biogas Project Development in Indonesia; Winrock International: Little Rock, AR,USA, 2015.
12. Madaki, Y.S.; Lau, S. Palm oil mill effluent (pome) from Malaysia palm oil mills: Waste or resource. Int. J. Sci.Environ. Technol. 2013, 2, 1138–1155.
13. Wong, K.K. Application of ponding systems in the treatment of palm oil mill and rubber mill effluents.Pertanika 1980, 3, 133–141.
14. Rupani, P.F.; Singh, R.P.; Ibrahim, M.H.; Esa, N. Review of current palm oil mill effluent (pome) treatmentmethods: Vermicomposting as a sustainable practice. World Appl. Sci. J. 2010, 10, 1190–1201.
15. Wicke, B.; Dornburg, V.; Junginger, M.; Faaij, A. Different palm oil production systems for energy purposesand their greenhouse gas implications. Biomass Bioenergy 2008, 32, 1322–1337. [CrossRef]
16. Intergovernmental Panel on Climate Change. Climate Change 2014: Mitigation of Climate Change: WorkingGroup iii Contribution to the Fifth Assessment Report of the Intergovernmental Panel on Climate Change/Edited byOttmar Edenhofer [and Fifteen Others]; Cambridge University Press: New York, NY, USA, 2014.
17. MPOB. National Key Economic Areas (NKEA) National Biogas Implementation (EPP5) Biogas Capture and CdmProject Implementation for Palm Oil Mills; Malaysian Palm Oil Board (MPOB): Bandar Baru Bangi, Malaysia,2014.
18. Choo, Y.M. Public Consultation on Mandatory Installation of Biogas Facilities in Palm Oil Mills; Palm Oil Board:Bandar Baru Bangi, Malaysia, 2013.
19. BorneoPost. Palm oil mills’ biogas capture implementation in sarawak a major challenge—Soppoa.Borneo Post Online. 5 November 2014. Available online: http://www.theborneopost.com/2014/11/05/palm-oil-mills-biogas-capture-implementation-in-sarawak-a-major-challenge-soppoa/ (accessed on15 October 2018).
20. Stichnothe, H.; Schuchardt, F. Comparison of different treatment options for palm oil production waste on alife cycle basis. Int. J. Life Cycle Assess. 2010, 15, 907–915. [CrossRef]
21. Nasution, M.A.; Wibawa, D.S.; Ahamed, T.; Noguchi, R. Comparative environmental impact evaluation ofpalm oil mill effluent treatment using a life cycle assessment approach: A case study based on compostingand a combination for biogas technologies in north sumatera of indonesia. J. Clean. Prod. 2018, 184, 1028–1040.[CrossRef]
22. Vijaya, S.; Ma, A.; Choo, Y. Capturing biogas: A means to reduce green house gas emissions for the productionof crude palm oil. Am. J. Geosci. 2010, 1, 1. [CrossRef]
23. Hansen, S.B.; Olsen, S.I.; Ujang, Z. Greenhouse gas reductions through enhanced use of residues in the lifecycle of Malaysian palm oil derived biodiesel. Bioresour. Technol. 2012, 104, 358–366. [CrossRef] [PubMed]
24. Lim, C.I.; Biswas, W. An evaluation of holistic sustainability assessment framework for palm oil productionin Malaysia. Sustainability 2015, 7, 16561–16587. [CrossRef]
25. Lim, C.I.; Biswas, W.K. Development of triple bottom line indicators for sustainability assessment frameworkof Malaysian palm oil industry. Clean Technol. Environ. Policy 2017, 20, 1–22. [CrossRef]
26. Lim, C.I.; Biswas, W. Sustainability assessment for crude palm oil production in Malaysia using the palm oilsustainability assessment framework. Sustain. Dev. 2018, 1–17. [CrossRef]
27. Lim, C.I.; Biswas, W.; Samyudia, Y. Review of existing sustainability assessment methods for Malaysianpalm oil production. Procedia CIRP 2015, 26, 13–18. [CrossRef]
28. Ali, E.N.; Tay, C.I. Characterization of biodiesel produced from palm oil via base catalyzed transesterification.Procedia Eng. 2013, 53, 7–12. [CrossRef]
29. Latif Ahmad, A.; Ismail, S.; Bhatia, S. Water recycling from palm oil mill effluent (pome) using membranetechnology. Desalination 2003, 157, 87–95. [CrossRef]
30. Bala, J.D.; Lalung, J.; Ismail, N. Palm oil mill effluent (pome) treatment “microbial communities in ananaerobic digester”: A review. Int. J. Sci. Res. Publ. 2014, 4, 1–24.

Sustainability 2019, 11, 792 19 of 19
31. Wahidul, K.B. Life cycle assessment of seawater desalinization in western australia. World Acad. Sci. Eng.Technol. 2009, 56, 369–375.
32. Puthankattil, V. Kubota’s biogas plant design more efficient, saves land space. Borneo Post Online.10 December 2012. Available online: http://www.theborneopost.com/2012/12/10/kubotas-biogas-plant-design-more-efficient-saves-land-space/ (accessed on 15 October 2018).
33. Jørgensen, P.J. Biogas-Green Energy •Process • Design • Energy Supply• Environment; PlanEnergi and Researcherfor a Day 2009. Available online: http://www.lemvigbiogas.com/BiogasPJJuk.pdf (accessed on 10May 2018).
34. ISO. ISO 14040:2006-Environmental Management—Life Cycle Assessment—Principles and Framework;International Organization for Standardization: Geneva, Switzerland, 2006.
35. ISO. ISO 14044:2006-Environmental Management—Life Cycle Assessment—Requirements and Guidelines;International Organization for Standardization: Geneva, Switzerland, 2006.
36. Abdullah, R. Ghg emission for crude palm oil supply chain with and without biogas capture facility. Oil PalmInd. Econ. J. 2013, 13, 27–37.
37. Majid, R.A.; Esa, H. The use of boiler fly ash for bod, tss and colour reduction of palm oil mill effluent.Palm Oil Eng. Bull. 2017, 125.
38. Othman, H.; Mohammed, A.T.; Dolmat, M.T. Bunch ash: An efficient and cost-effective k-fertilizer source formature oil palm on peat under high rainfall environment. MPOB Transf. Technol. 2005, 254.
39. Abas, R.; Abdullah, R.; Hawari, Y. Economic feasibility study on establishing an oil palm biogas plant inMalaysia. Oil Palm Ind. Econ. J. 2013, 13, 14–21.
40. GasMalaysia. Tariff and Rates. Available online: http://www.gasMalaysia.com/index.php/our-services/at-your-service/bills-payments/tariff-rates (accessed on 1 July 2018).
41. Arora, L.; Kumar, S.; Verma, P. The anatomy of sustainable growth rate of indian manufacturing firms.Glob. Bus. Rev. 2018, 19, 1050–1071. [CrossRef]
42. Inc.com. Sustainable Growth. Available online: https://www.inc.com/encyclopedia/sustainable-growth.html (accessed on 10 September 2018).
43. Mohd Nahar, O. Present Status of Odour Management in Malaysia; Research and Development Seminar 2014;International Atomic Energy Agency (IAEA): Bangi, Malaysia, 2014.
44. Kreith, F.; Goswami, D.Y. Handbook of Energy Efficiency and Renewable Energy/Edited by Frank Kreith and d. YogiGoswami; CRC Press: Boca Raton, FL, USA, 2007.
45. Vallero, D.A. Green Engineering and Sustainable Design Aspects of Waste Management; Elsevier: New York, NY,USA, 2011; pp. 11–21.
46. Ismail, A. The effect of labour shortage in the supply and demand of palm oil in Malaysia. Oil Palm Ind.Econ. J. 2013, 13, 15–26.
47. Sime Darby Plantation’s q3 Earnings slip 39% on Lower ffb Production, Cpo Price. The Sun Daily, 31 May2018.
48. SEC. Employee Stock Options Plans. Available online: https://www.sec.gov/fast-answers/answers-empopthtm.html (accessed on 15 October 2018).
49. Cain, S.A. The species-area curve. Am. Mid. Nat. 1938, 19, 573–581. [CrossRef]50. Birrell, S.J.; Hummel, J.W. Real-time multi isfet/fia soil analysis system with automatic sample extraction.
Comput. Electron. Agric. 2001, 32, 45–67. [CrossRef]
© 2019 by the authors. Licensee MDPI, Basel, Switzerland. This article is an open accessarticle distributed under the terms and conditions of the Creative Commons Attribution(CC BY) license (http://creativecommons.org/licenses/by/4.0/).