sustainability assessment of coal based energy … sm wor… · of coal based energy and chemical...
TRANSCRIPT
Sustainability Assessment
of Coal based Energy and Chemical Processes
Yu Qian
South China University of Technology Guangzhou, China
Sino-USA Workshop on Sustainable Manufacture Wuhan, March 13-15, 2014
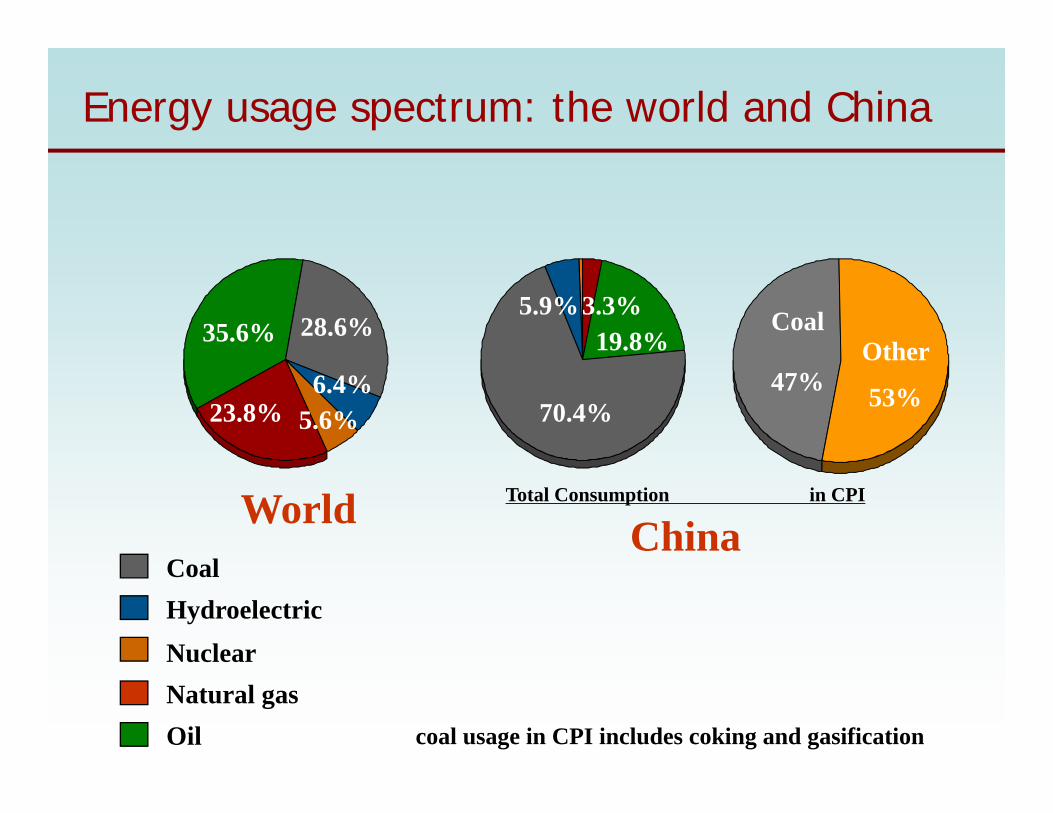
World
28.6%
6.4%5.6%23.8%
35.6%
Coal
Oil Natural gas
HydroelectricNuclear
Total Consumption in CPI
China
70.4%
5.9%3.3%19.8%
coal usage in CPI includes coking and gasification
53%47%
CoalOther
Energy usage spectrum: the world and China
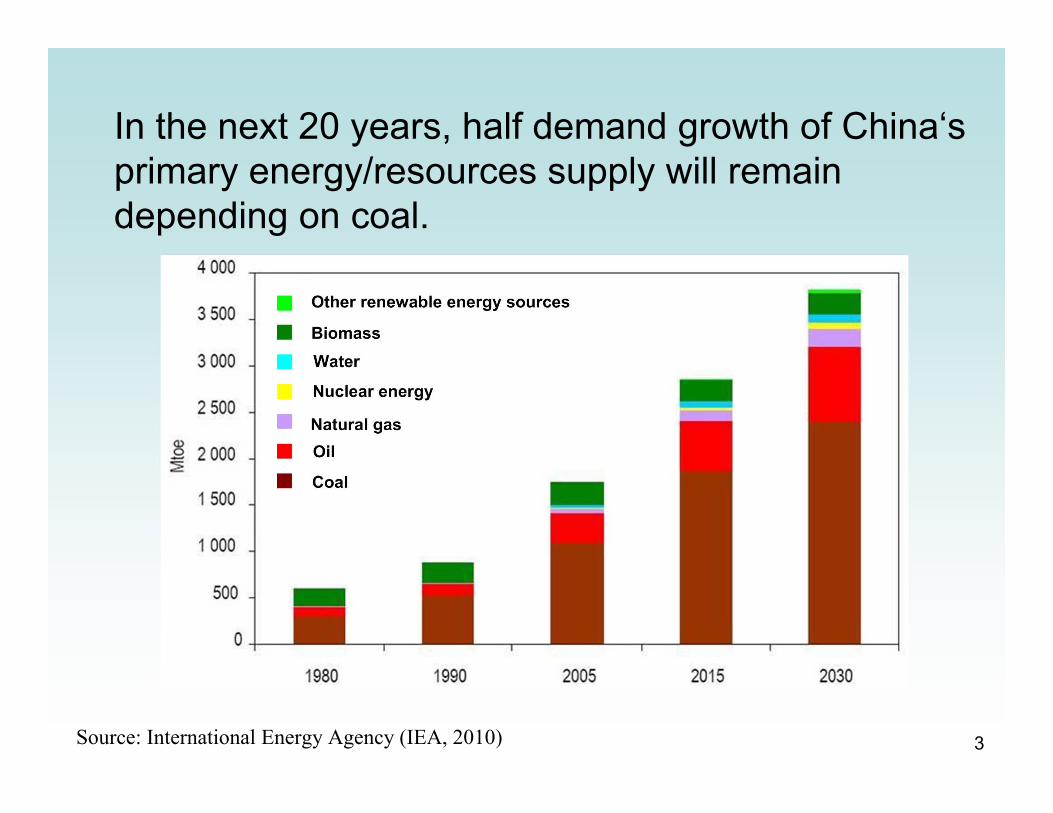
3Source: International Energy Agency (IEA, 2010)
In the next 20 years, half demand growth of China‘s primary energy/resources supply will remain depending on coal.
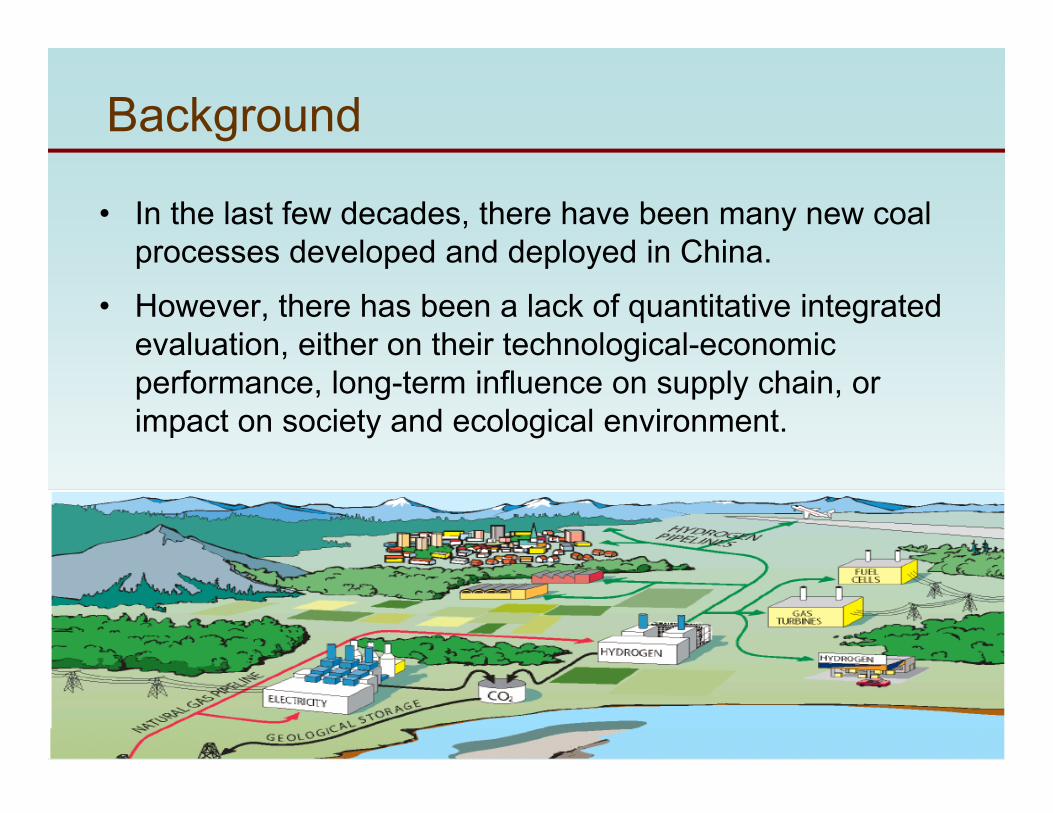
Background
• In the last few decades, there have been many new coal processes developed and deployed in China.
• However, there has been a lack of quantitative integrated evaluation, either on their technological-economic performance, long-term influence on supply chain, or impact on society and ecological environment.
4
5
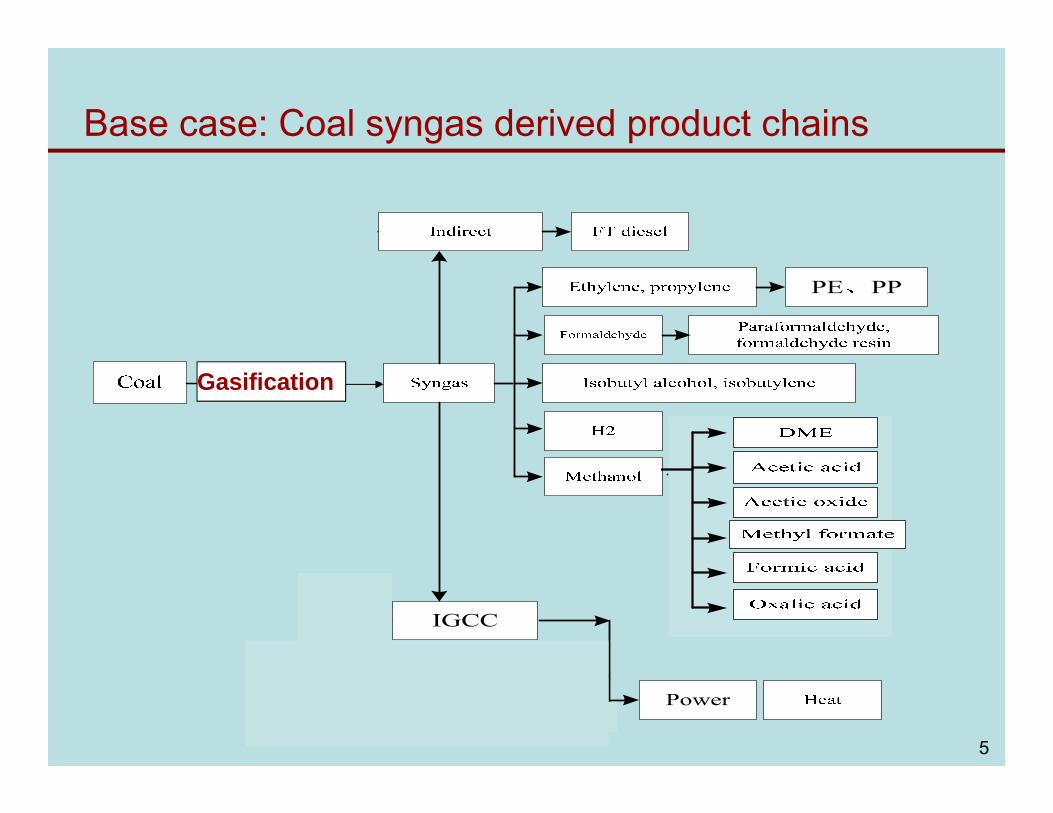
Base case: Coal syngas derived product chains
Gasification
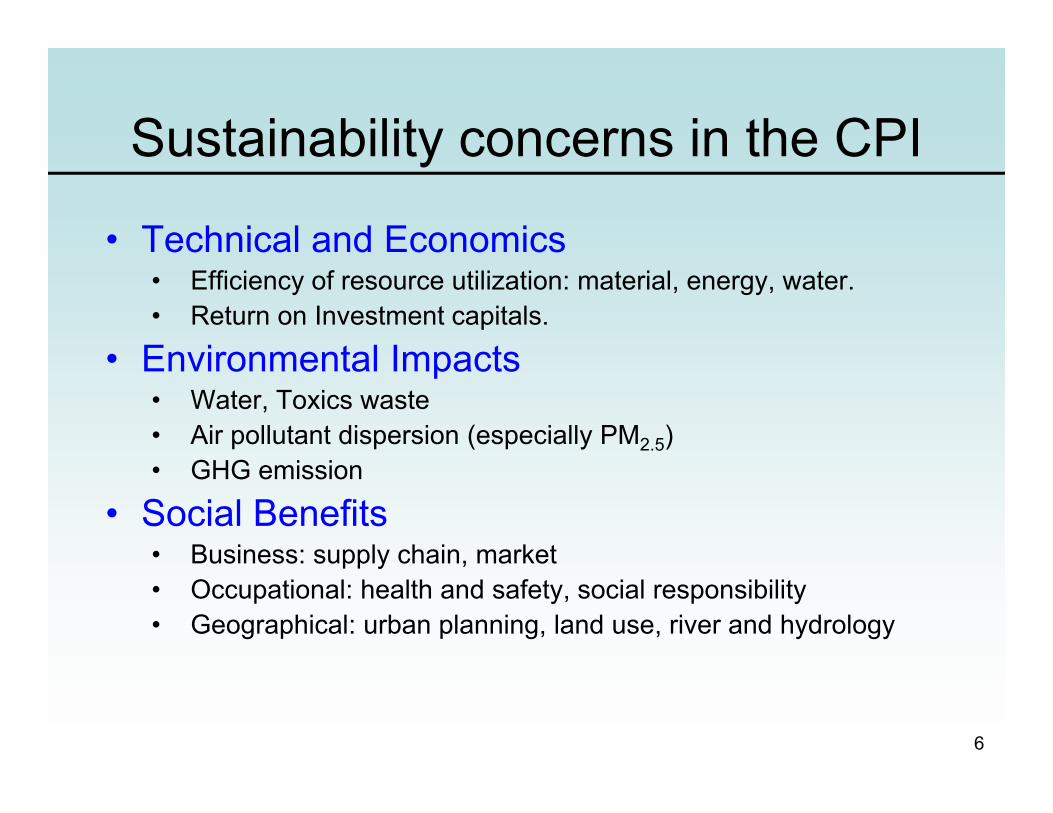
Sustainability concerns in the CPI
• Technical and Economics• Efficiency of resource utilization: material, energy, water. • Return on Investment capitals.
• Environmental Impacts• Water, Toxics waste• Air pollutant dispersion (especially PM2.5) • GHG emission
• Social Benefits• Business: supply chain, market• Occupational: health and safety, social responsibility• Geographical: urban planning, land use, river and hydrology
6
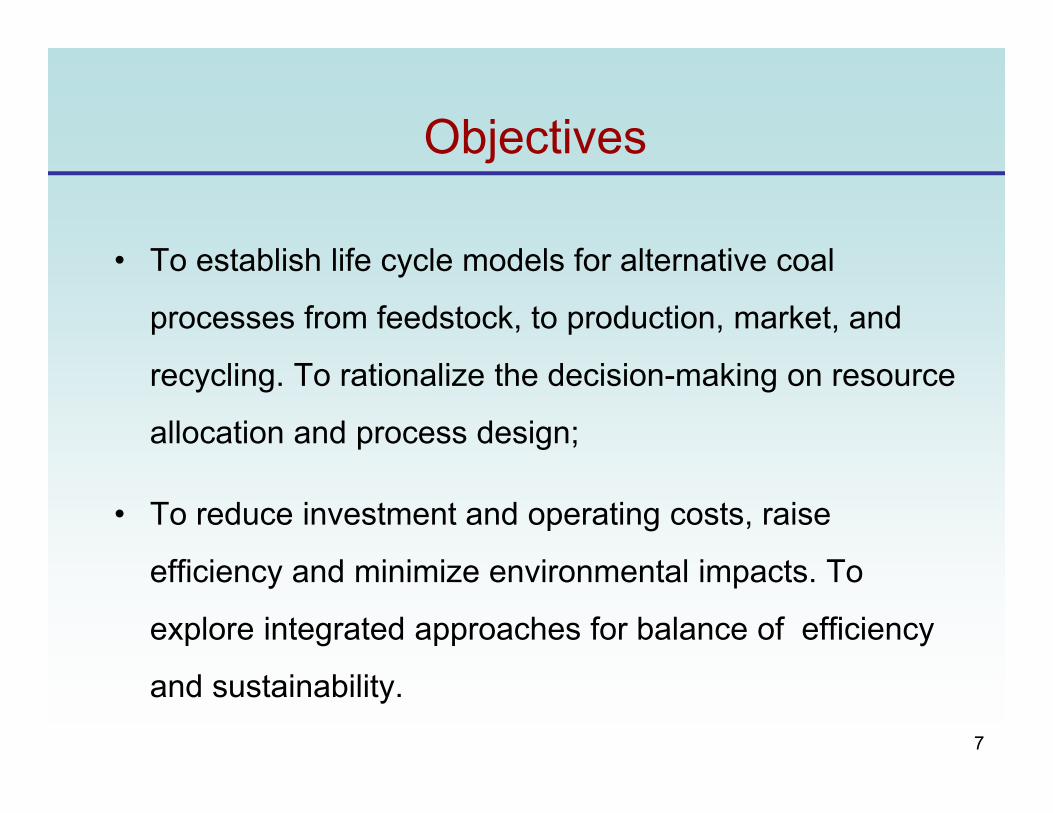
Objectives
• To establish life cycle models for alternative coal
processes from feedstock, to production, market, and
recycling. To rationalize the decision-making on resource
allocation and process design;
• To reduce investment and operating costs, raise
efficiency and minimize environmental impacts. To
explore integrated approaches for balance of efficiency
and sustainability. 7
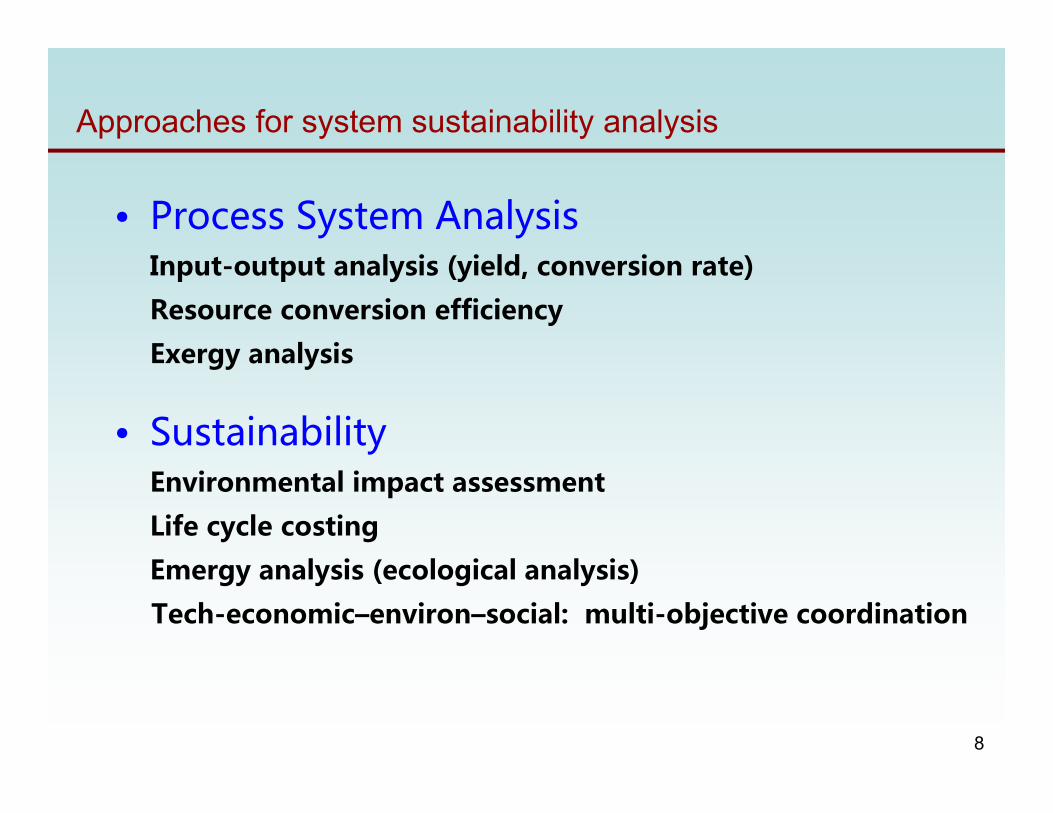
Approaches for system sustainability analysis
• Process�System�AnalysisInput-output analysis (yield, conversion rate)
Resource conversion efficiency
Exergy analysis
• SustainabilityEnvironmental impact assessment
Life cycle costing
Emergy analysis (ecological analysis)
Tech-economic–environ–social: multi-objective coordination
8
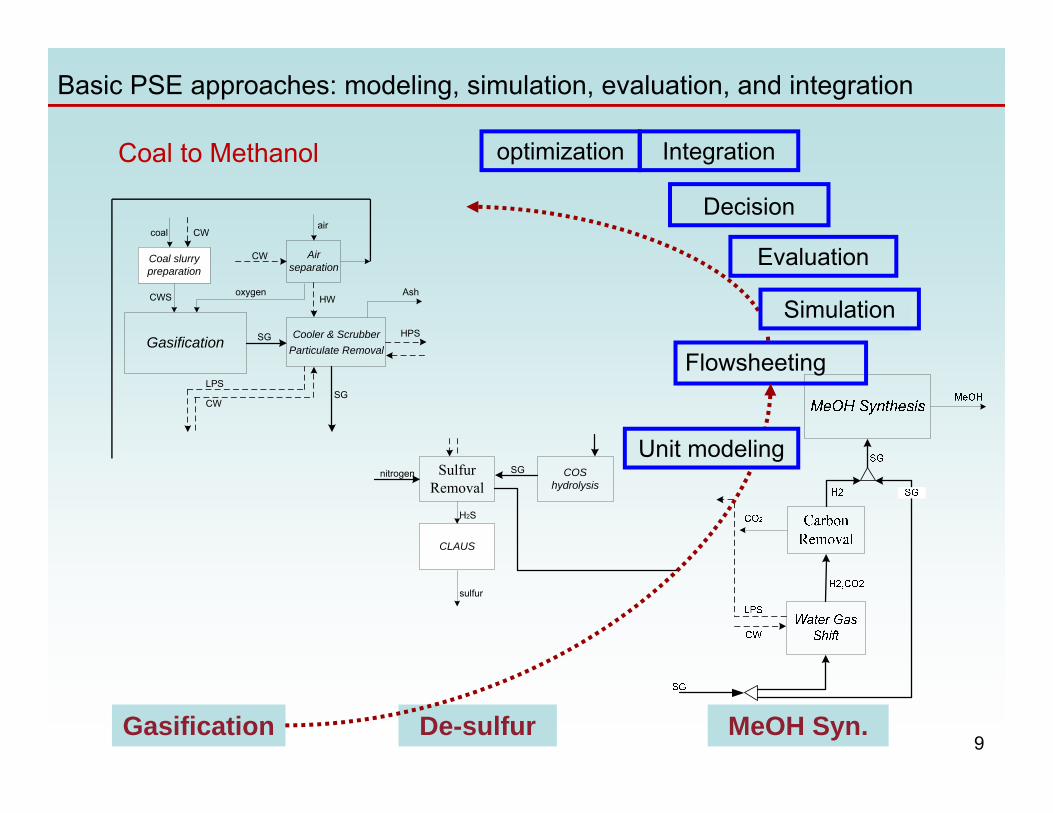
SulfurRemoval
COShydrolysis
CLAUS
sulfur
H2S
nitrogen SG
Air separation
Gasification
Coal slurrypreparation
Cooler & ScrubberParticulate Removal
air
CW
HWoxygenCWS
coal CW
CW
LPS
Ash
HPSSG
SG
Gasification De-sulfur MeOH Syn.
Flowsheeting
Unit modeling
Integration
Evaluation
Simulation
Decision
optimization
Basic PSE approaches: modeling, simulation, evaluation, and integration
Coal to Methanol
9
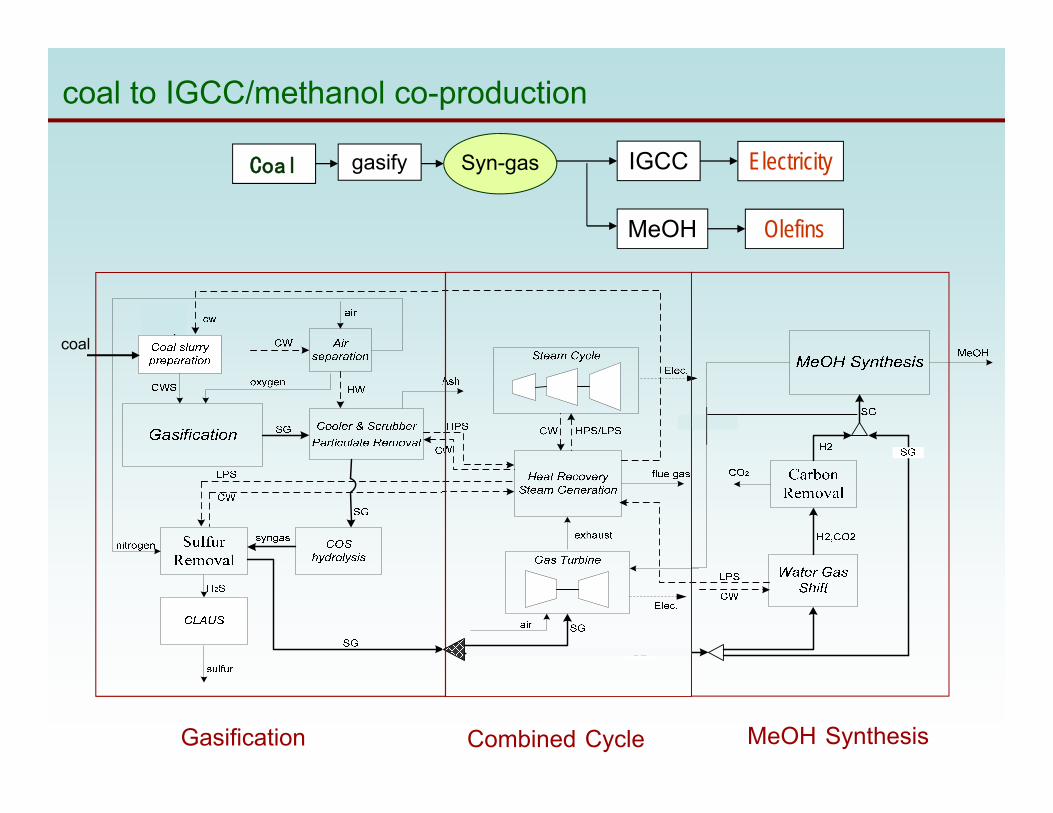
Gasification
coal
coal to IGCC/methanol co-production
Combined Cycle
IGCC Electricity
MeOH Olefins
Coal Syn-gasgasify
MeOH Synthesis
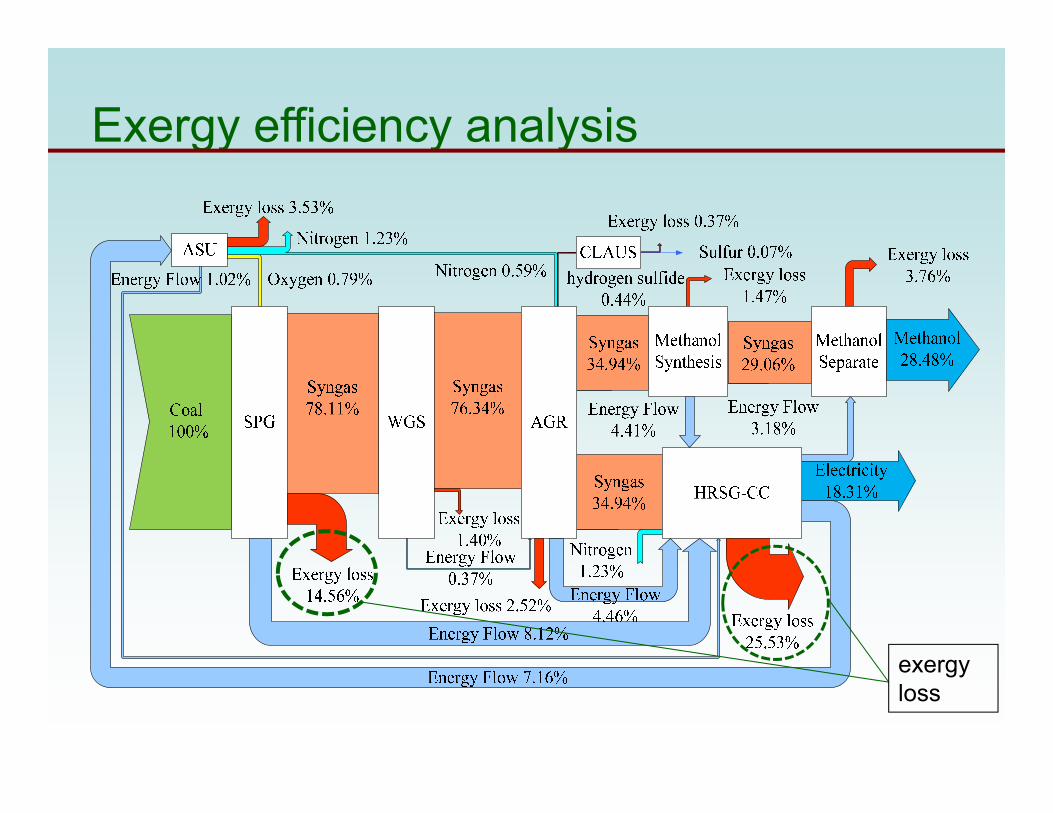
Exergy efficiency analysis
exergy loss
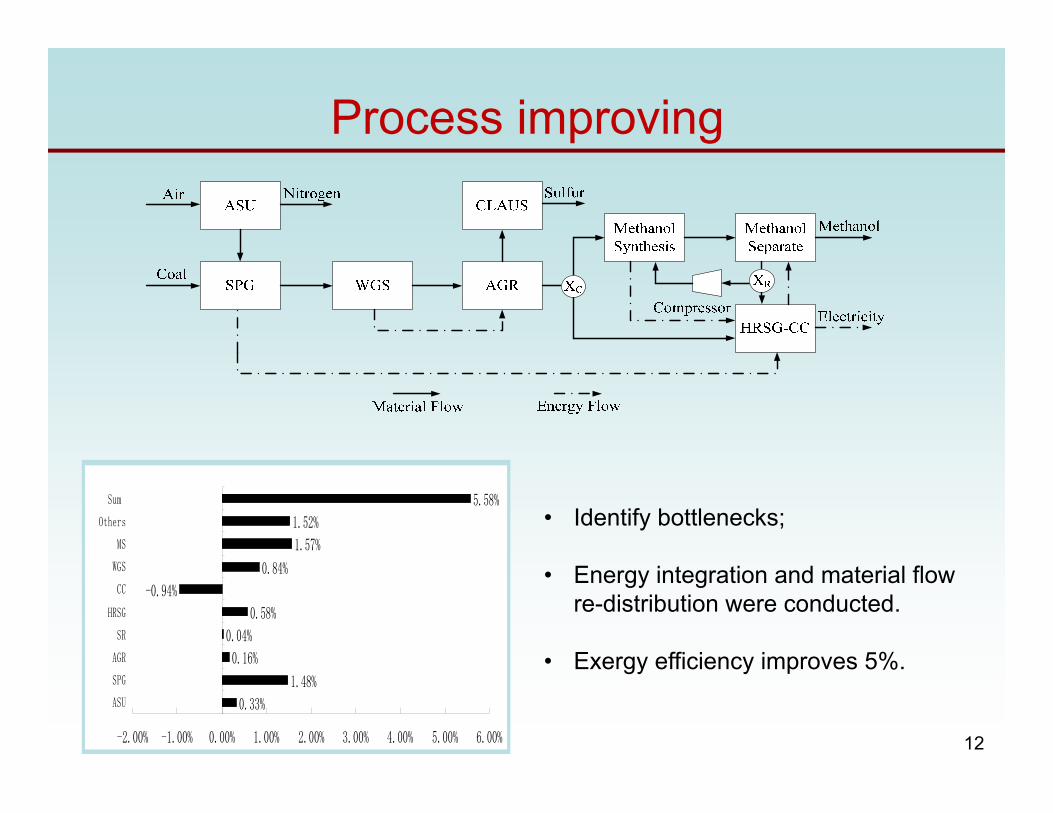
Process improving
0.33%
1.48%
0.16%
0.04%
0.58%
-0.94%
0.84%
1.57%
1.52%
5.58%
-2.00% -1.00% 0.00% 1.00% 2.00% 3.00% 4.00% 5.00% 6.00%
ASU
SPG
AGR
SR
HRSG
CC
WGS
MS
Others
Sum
• Identify bottlenecks;
• Energy integration and material flow re-distribution were conducted.
• Exergy efficiency improves 5%.
12
13
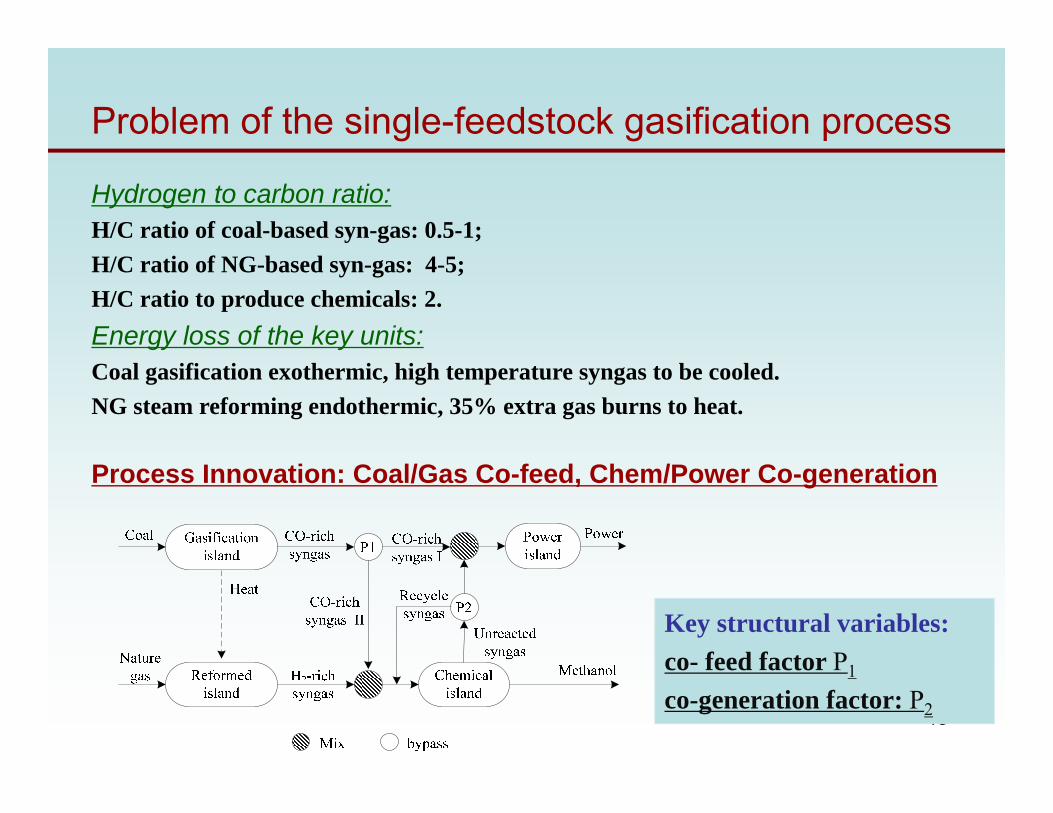
Problem of the single-feedstock gasification process
Hydrogen to carbon ratio:H/C ratio of coal-based syn-gas: 0.5-1; H/C ratio of NG-based syn-gas: 4-5;H/C ratio to produce chemicals: 2. Energy loss of the key units:Coal gasification exothermic, high temperature syngas to be cooled.NG steam reforming endothermic, 35% extra gas burns to heat.
Process Innovation: Coal/Gas Co-feed, Chem/Power Co-generation
Key structural variables: co- feed factor P1
co-generation factor: P2
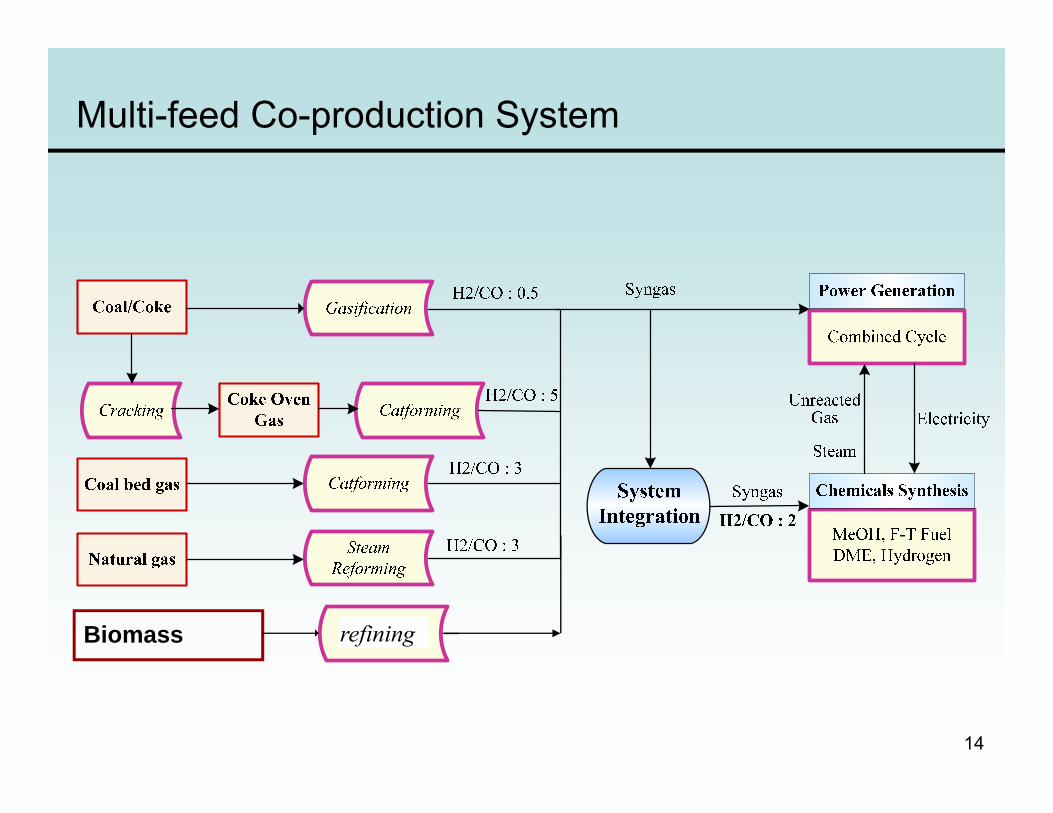
Multi-feed Co-production System
Biomass refining
14
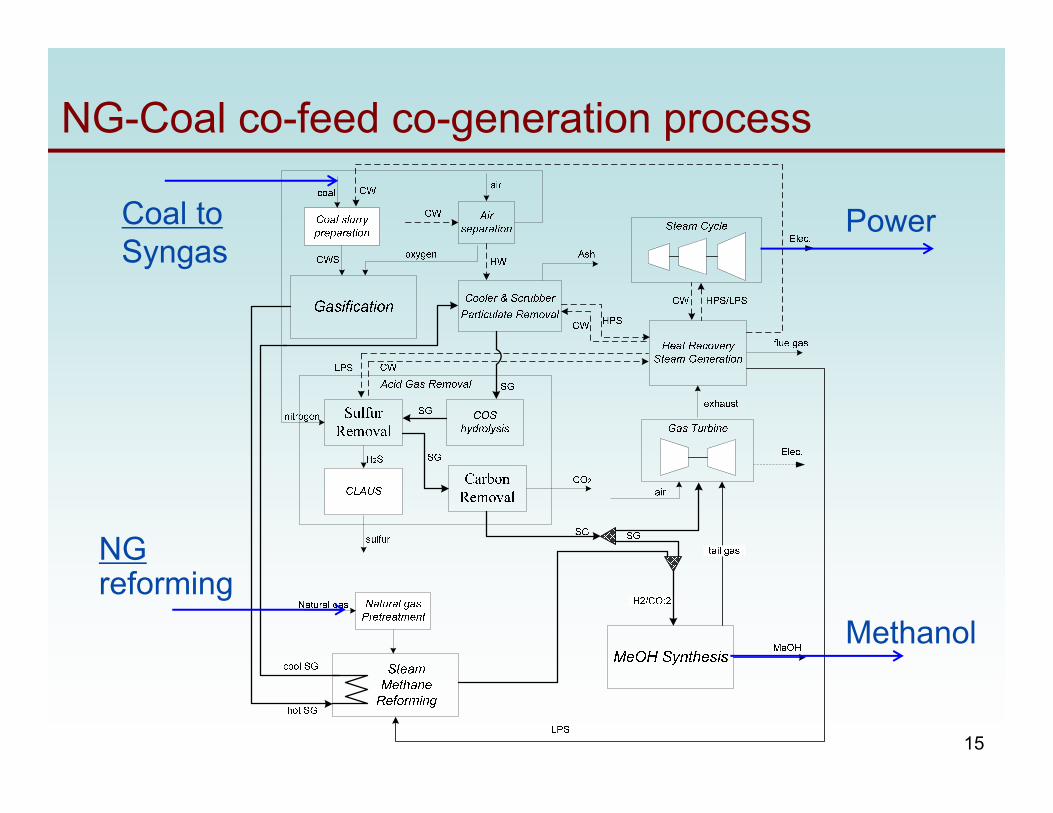
NG-Coal co-feed co-generation process
Coal to Syngas
NG reforming
Power
Methanol
15
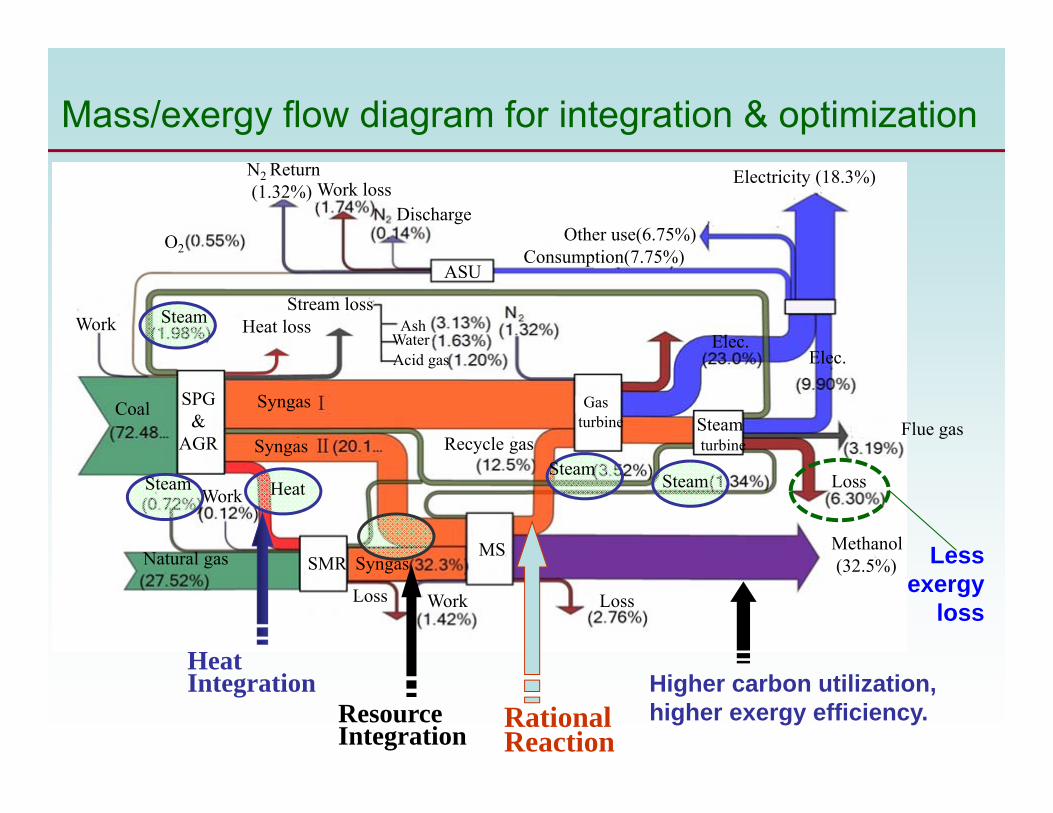
Heat Integration
Resource Integration
Rational Reaction
O2
Steam
Coal
Natural gasMethanol(32.5%)
Electricity (18.3%)
MS
Syngas
Syngas
N2 Return(1.32%) Work loss
ASU
Gasturbine Steam
turbineSteam
Steam
Steam
Other use(6.75%)Consumption(7.75%)
Work
Work
Work Loss
SMR
Loss
Syngas
Recycle gas
Heat
SPG &
AGR
Heat lossStream loss
WaterAcid gas
AshElec.
Elec.
Loss
Flue gas
Mass/exergy flow diagram for integration & optimization
Discharge
Higher carbon utilization, higher exergy efficiency.
Less exergy
loss
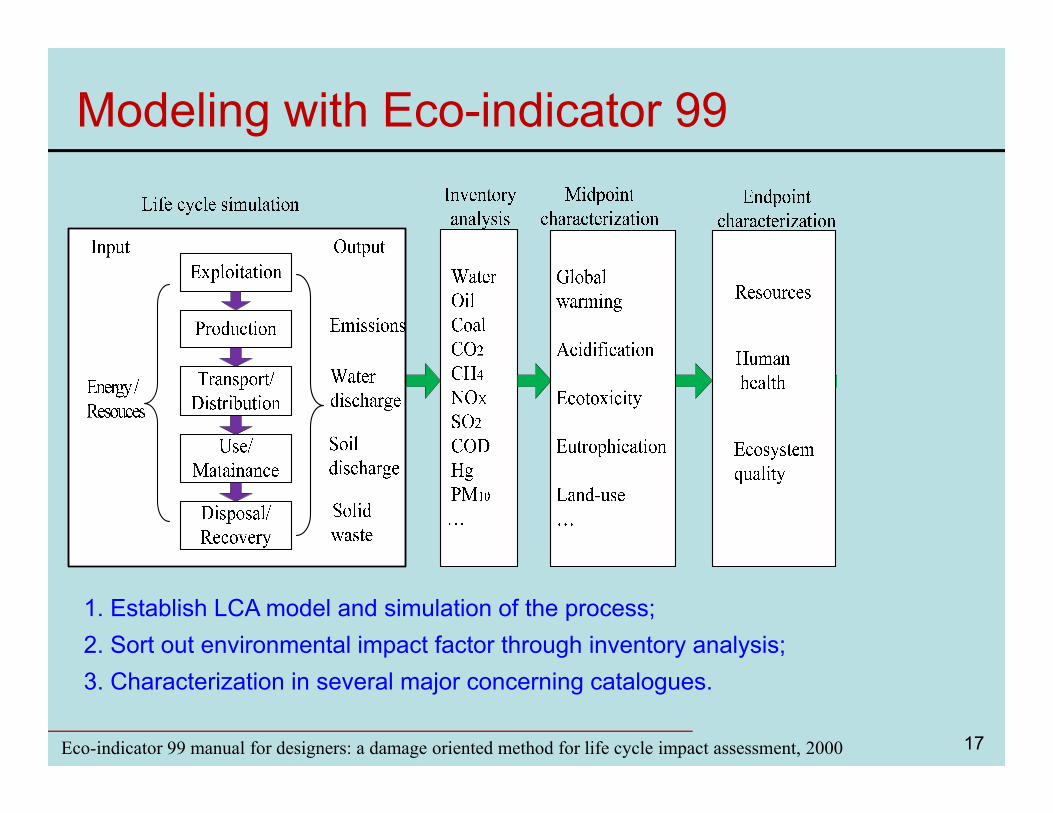
Modeling with Eco-indicator 99
17Eco-indicator 99 manual for designers: a damage oriented method for life cycle impact assessment, 2000
1. Establish LCA model and simulation of the process; 2. Sort out environmental impact factor through inventory analysis;3. Characterization in several major concerning catalogues.
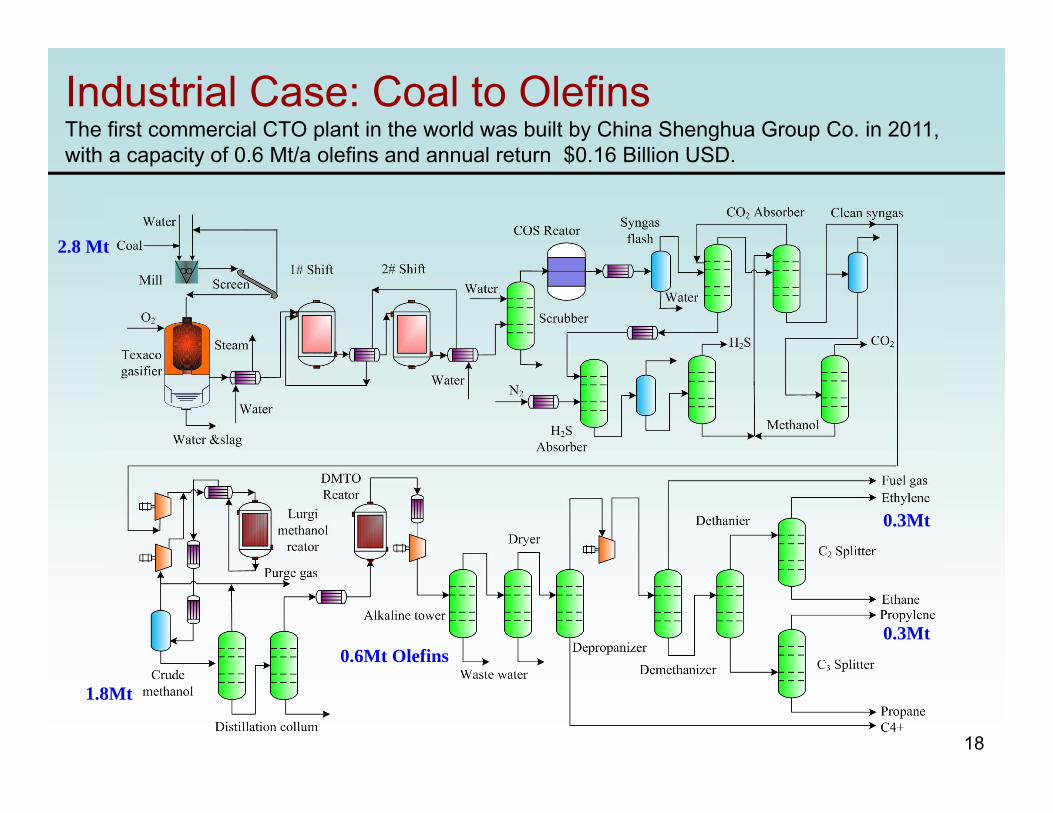
Industrial Case: Coal to Olefins The first commercial CTO plant in the world was built by China Shenghua Group Co. in 2011, with a capacity of 0.6 Mt/a olefins and annual return $0.16 Billion USD.
18
2.8 Mt
1.8Mt
0.6Mt Olefins0.3Mt
0.3Mt
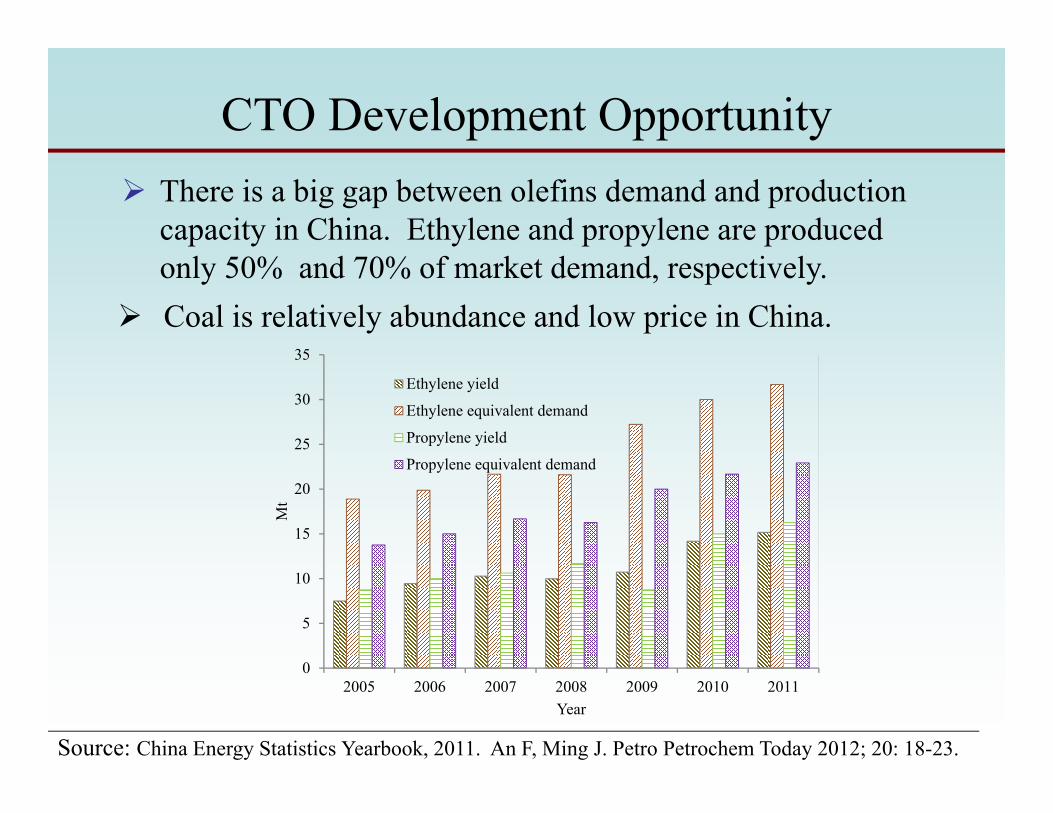
There is a big gap between olefins demand and production capacity in China. Ethylene and propylene are produced only 50% and 70% of market demand, respectively.
Source: China Energy Statistics Yearbook, 2011. An F, Ming J. Petro Petrochem Today 2012; 20: 18-23.
CTO Development Opportunity
0
5
10
15
20
25
30
35
2005 2006 2007 2008 2009 2010 2011
Mt
Year
Ethylene yield
Ethylene equivalent demand
Propylene yield
Propylene equivalent demand
Coal is relatively abundance and low price in China.
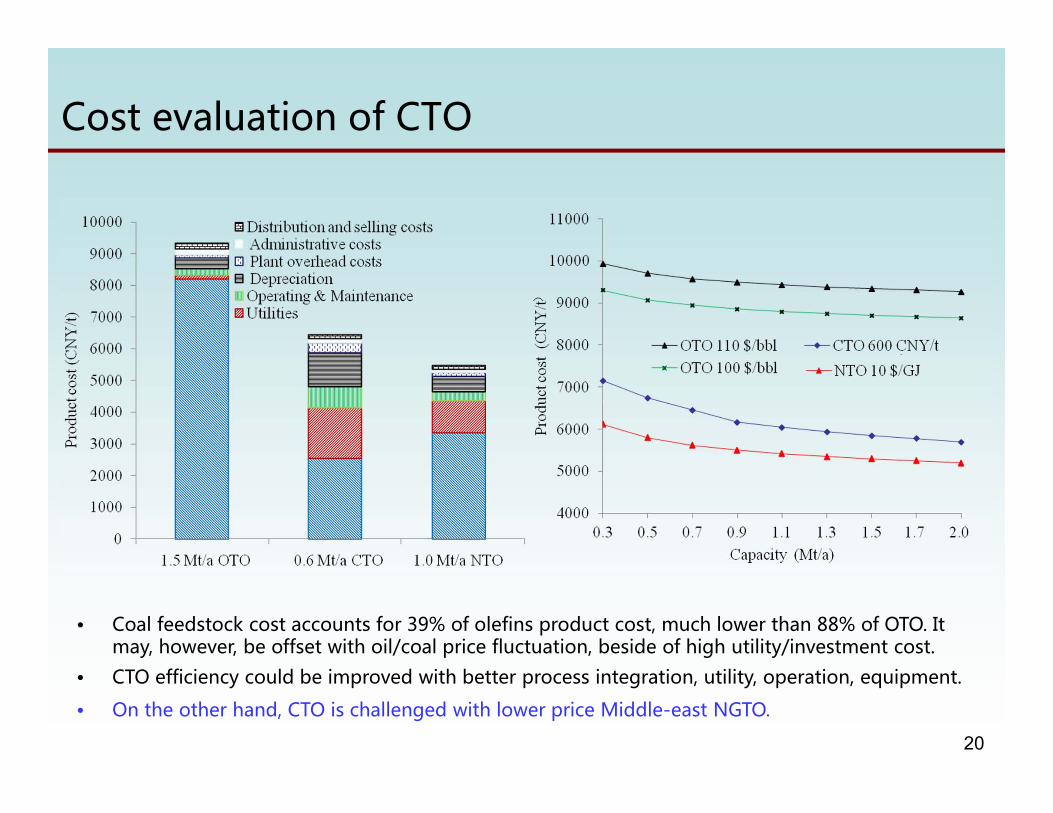
Cost�evaluation�of�CTO
• Coal�feedstock�cost�accounts�for�39%�of�olefins�product�cost,�much�lower�than�88%�of�OTO.�It�may,�however,�be�offset�with�oil/coal�price�fluctuation,�beside�of�high�utility/investment�cost.�
• CTO�efficiency�could�be�improved�with�better�process�integration,�utility,�operation,�equipment.
20
• On�the�other�hand,�CTO�is�challenged�with�lower�price�Middle-east�NGTO.
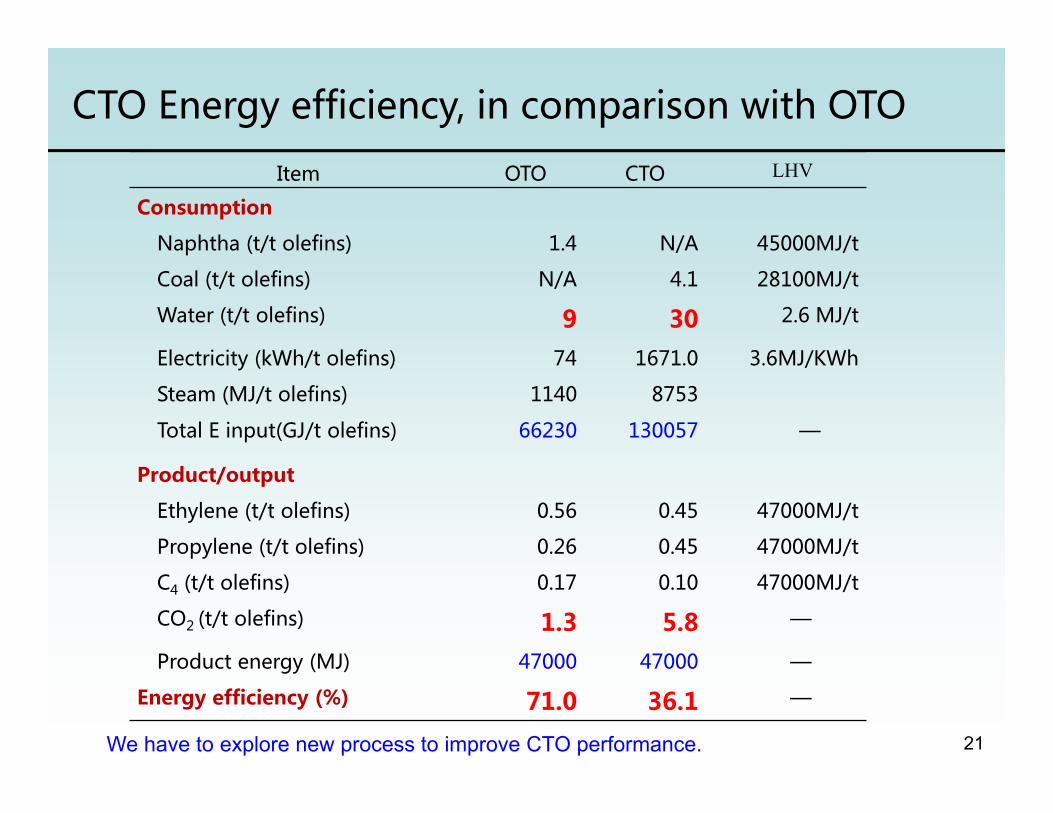
CTO�Energy�efficiency,�in�comparison�with�OTO
We have to explore new process to improve CTO performance.
Item OTO CTO LHV
Consumption
Naphtha (t/t olefins) 1.4 N/A 45000MJ/t
Coal (t/t olefins) N/A 4.1 28100MJ/t
Water (t/t olefins) 9 30 2.6�MJ/t���
Electricity (kWh/t olefins) 74 1671.0 3.6MJ/KWh
Steam (MJ/t olefins) 1140 8753
Total�E�input(GJ/t�olefins) 66230 130057 —
Product/output
Ethylene (t/t�olefins) 0.56 0.45 47000MJ/t
Propylene (t/t olefins) 0.26 0.45 47000MJ/t
C4 (t/t�olefins) 0.17 0.10 47000MJ/t
CO2�(t/t�olefins) 1.3 5.8 —
Product�energy�(MJ) 47000 47000 —
Energy efficiency (%) 71.0 36.1 —
21
22
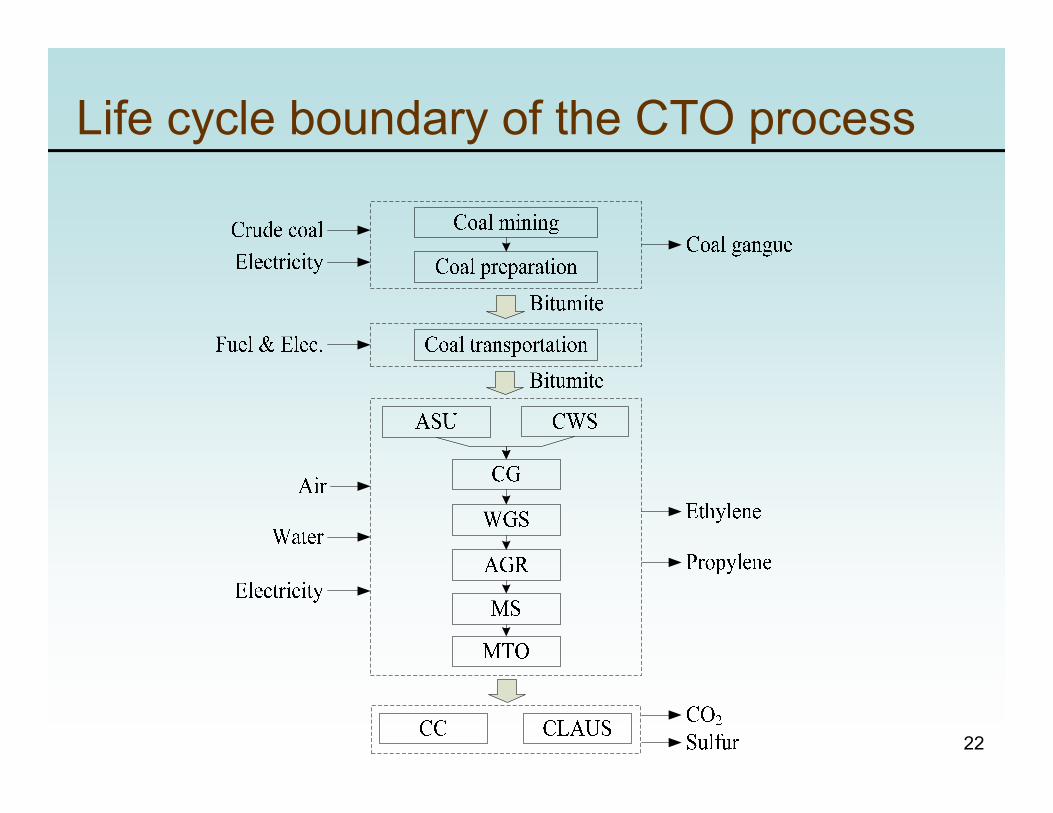
Life cycle boundary of the CTO process

LCA
23
2 31
24
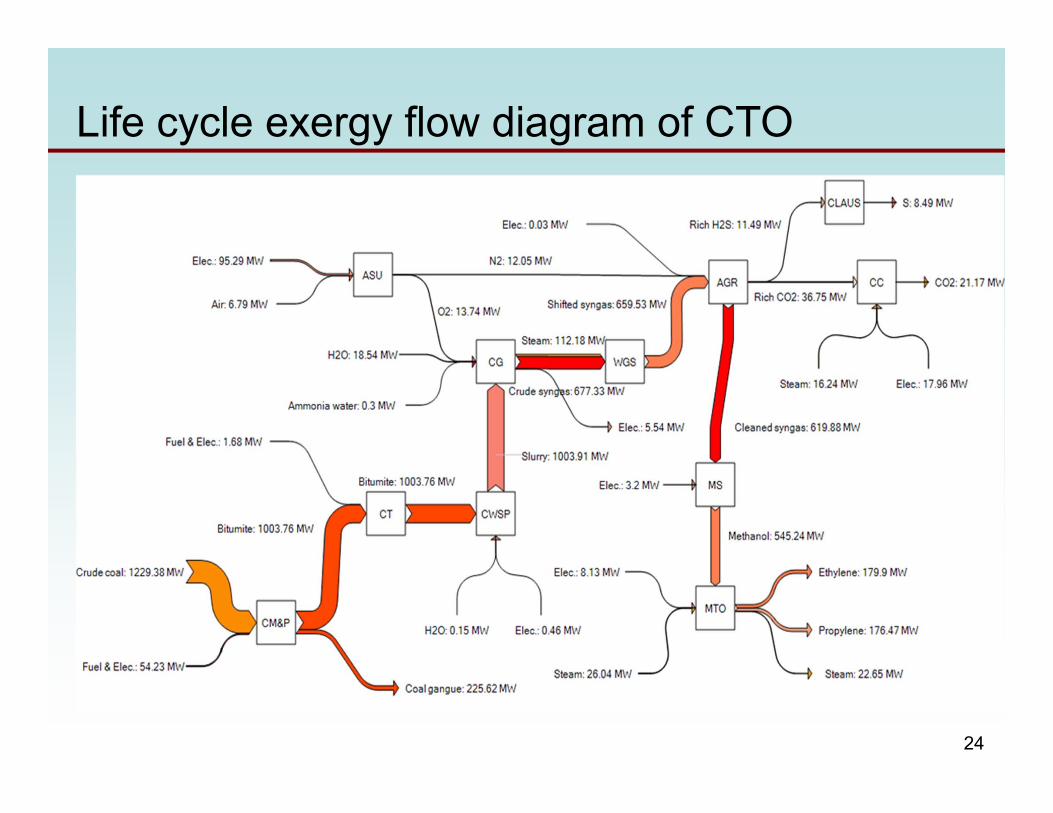
Life cycle exergy flow diagram of CTO
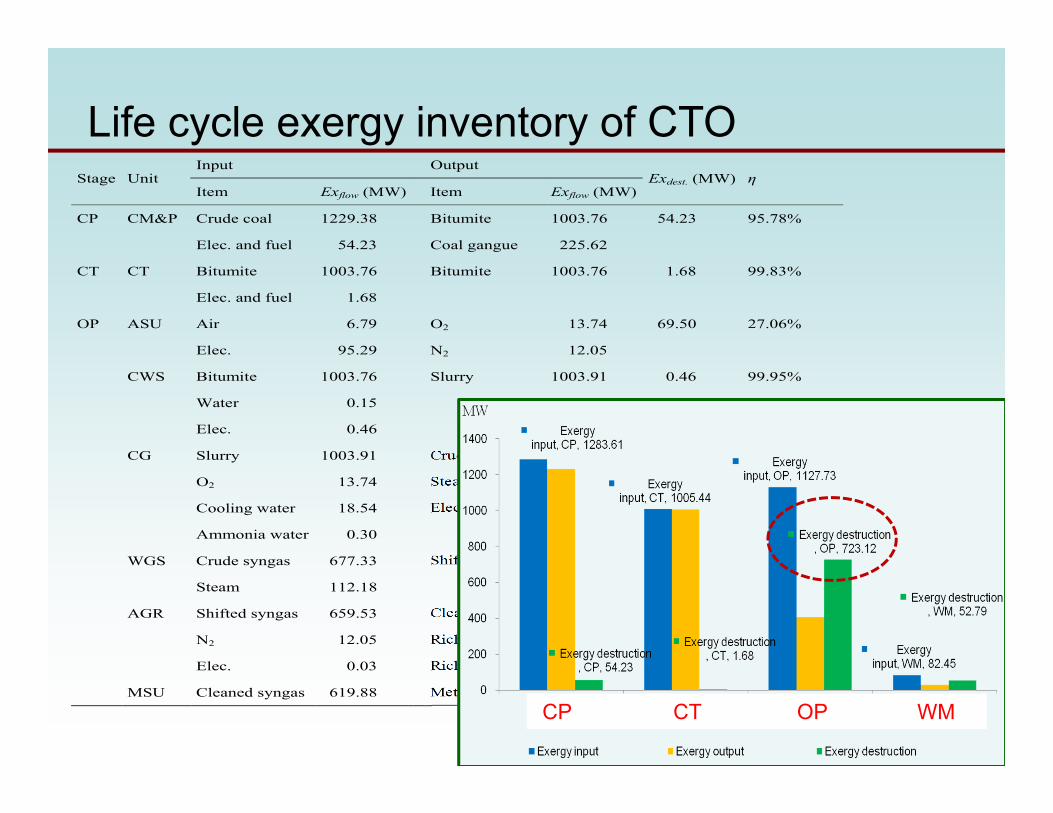
Stage Unit Input Output
Exdest. (MW) η Item Exflow (MW) Item Exflow (MW)
CP CM&P Crude coal 1229.38 Bitumite 1003.76 54.23 95.78%
Elec. and fuel 54.23 Coal gangue 225.62
CT CT Bitumite 1003.76 Bitumite 1003.76 1.68 99.83%
Elec. and fuel 1.68
OP ASU Air 6.79 O2 13.74 69.50 27.06%
Elec. 95.29 N2 12.05
CWS Bitumite 1003.76 Slurry 1003.91 0.46 99.95%
Water 0.15
Elec. 0.46
CG Slurry 1003.91 Crude syngas 677.33 241.45 76.70%
O2 13.74 Steam 112.18
Cooling water 18.54 Elec. 5.54
Ammonia water 0.30
WGS Crude syngas 677.33 Shifted syngas 659.53 129.98 83.54%
Steam 112.18
AGR Shifted syngas 659.53 Cleaned syngas 619.88 3.48 99.48%
N2 12.05 Rich H2S 11.49
Elec. 0.03 Rich CO2 36.75
MSU Cleaned syngas 619.88 Methanol 545.24 77.85 87.51%
Life cycle exergy inventory of CTO
CP CT OP WM
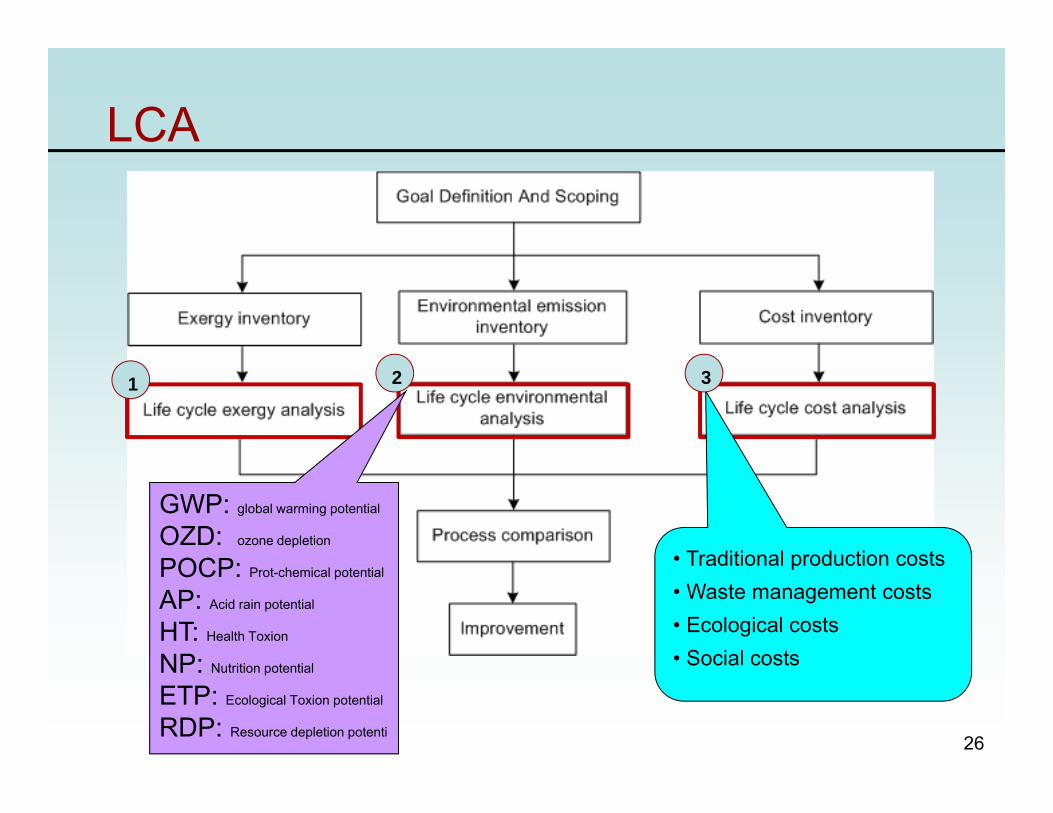
LCA
GWP: global warming potential
OZD: ozone depletion
POCP: Prot-chemical potential
AP: Acid rain potential
HT: Health Toxion
NP: Nutrition potential
ETP: Ecological Toxion potential
RDP: Resource depletion potenti
• Traditional production costs • Waste management costs • Ecological costs • Social costs
26
2 31
27
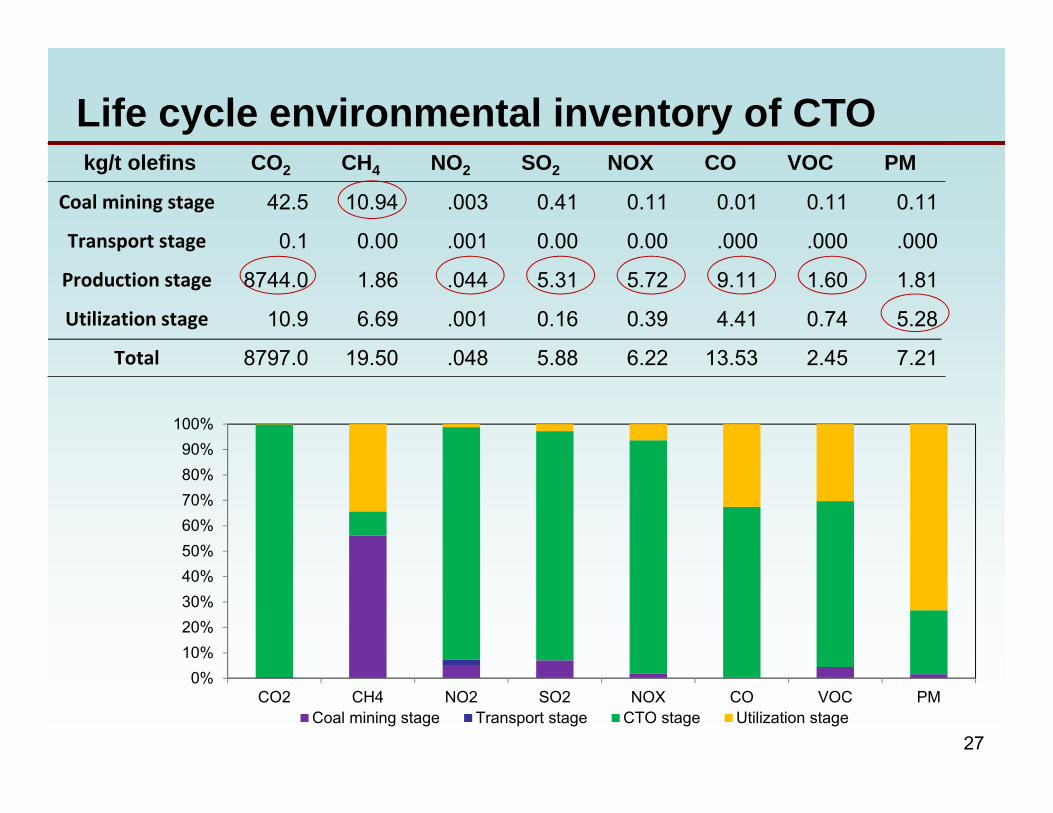
Life cycle environmental inventory of CTO
0%10%20%30%40%50%60%70%80%90%
100%
CO2 CH4 NO2 SO2 NOX CO VOC PMCoal mining stage Transport stage CTO stage Utilization stage
kg/t olefins CO2 CH4 NO2 SO2 NOX CO VOC PM
Coal mining stage 42.5 10.94 .003 0.41 0.11 0.01 0.11 0.11
Transport stage 0.1 0.00 .001 0.00 0.00 .000 .000 .000
Production stage 8744.0 1.86 .044 5.31 5.72 9.11 1.60 1.81
Utilization stage 10.9 6.69 .001 0.16 0.39 4.41 0.74 5.28
Total 8797.0 19.50 .048 5.88 6.22 13.53 2.45 7.21
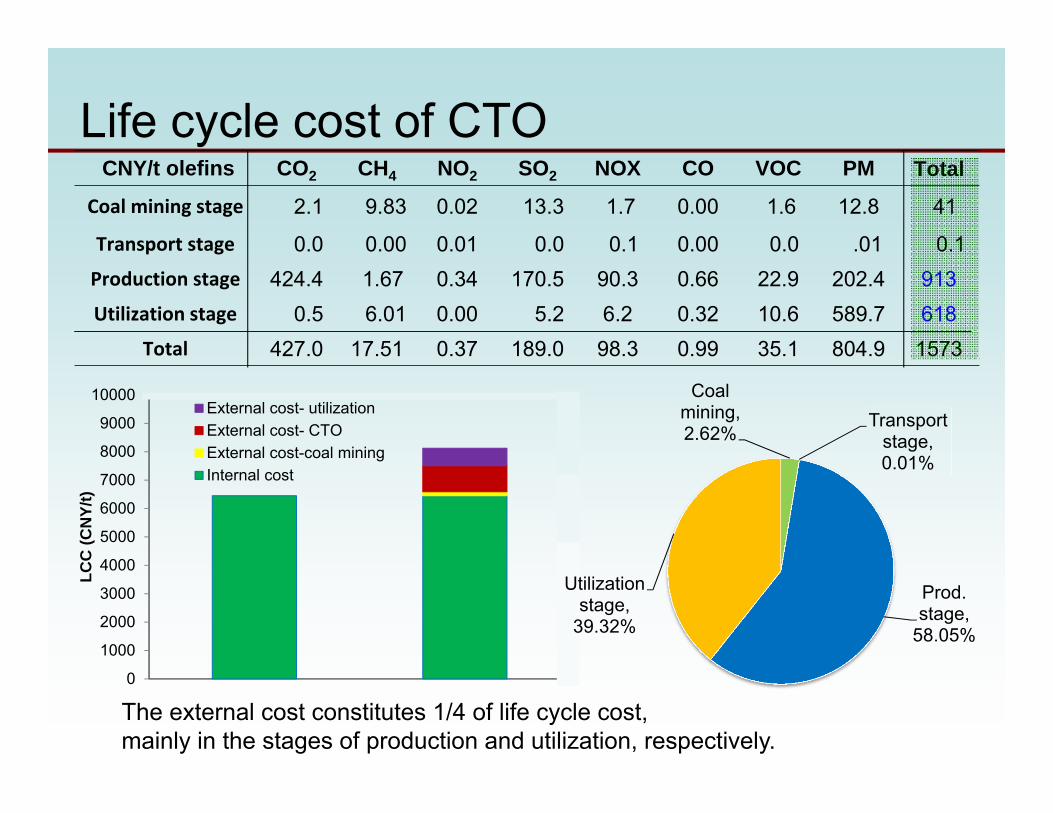
Life cycle cost of CTO CNY/t olefins CO2 CH4 NO2 SO2 NOX CO VOC PM Total
Coal mining stage 2.1 9.83 0.02 13.3 1.7 0.00 1.6 12.8 41
Transport stage 0.0 0.00 0.01 0.0 0.1 0.00 0.0 .01 0.1Production stage 424.4 1.67 0.34 170.5 90.3 0.66 22.9 202.4 913Utilization stage 0.5 6.01 0.00 5.2 6.2 0.32 10.6 589.7 618
Total 427.0 17.51 0.37 189.0 98.3 0.99 35.1 804.9 1573
0
1000
2000
3000
4000
5000
6000
7000
8000
9000
10000
LCC
(CN
Y/t)
External cost- utilizationExternal cost- CTOExternal cost-coal miningInternal cost
The external cost constitutes 1/4 of life cycle cost, mainly in the stages of production and utilization, respectively.
Coal mining, 2.62%
Transport stage, 0.01%
Prod. stage,
58.05%
Utilization stage,
39.32%
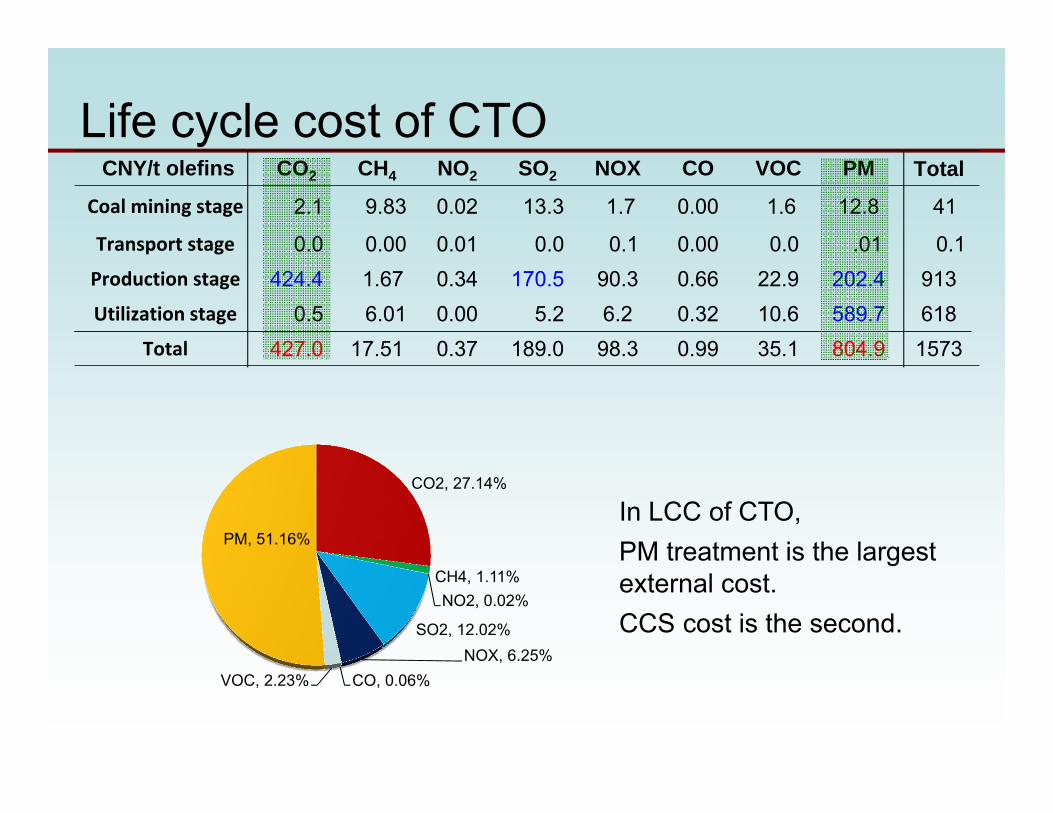
Life cycle cost of CTO
CO2, 27.14%
CH4, 1.11%NO2, 0.02%
SO2, 12.02%NOX, 6.25%
CO, 0.06%VOC, 2.23%
PM, 51.16%In LCC of CTO, PM treatment is the largest external cost. CCS cost is the second.
CNY/t olefins CO2 CH4 NO2 SO2 NOX CO VOC PM TotalCoal mining stage 2.1 9.83 0.02 13.3 1.7 0.00 1.6 12.8 41
Transport stage 0.0 0.00 0.01 0.0 0.1 0.00 0.0 .01 0.1Production stage 424.4 1.67 0.34 170.5 90.3 0.66 22.9 202.4 913Utilization stage 0.5 6.01 0.00 5.2 6.2 0.32 10.6 589.7 618
Total 427.0 17.51 0.37 189.0 98.3 0.99 35.1 804.9 1573
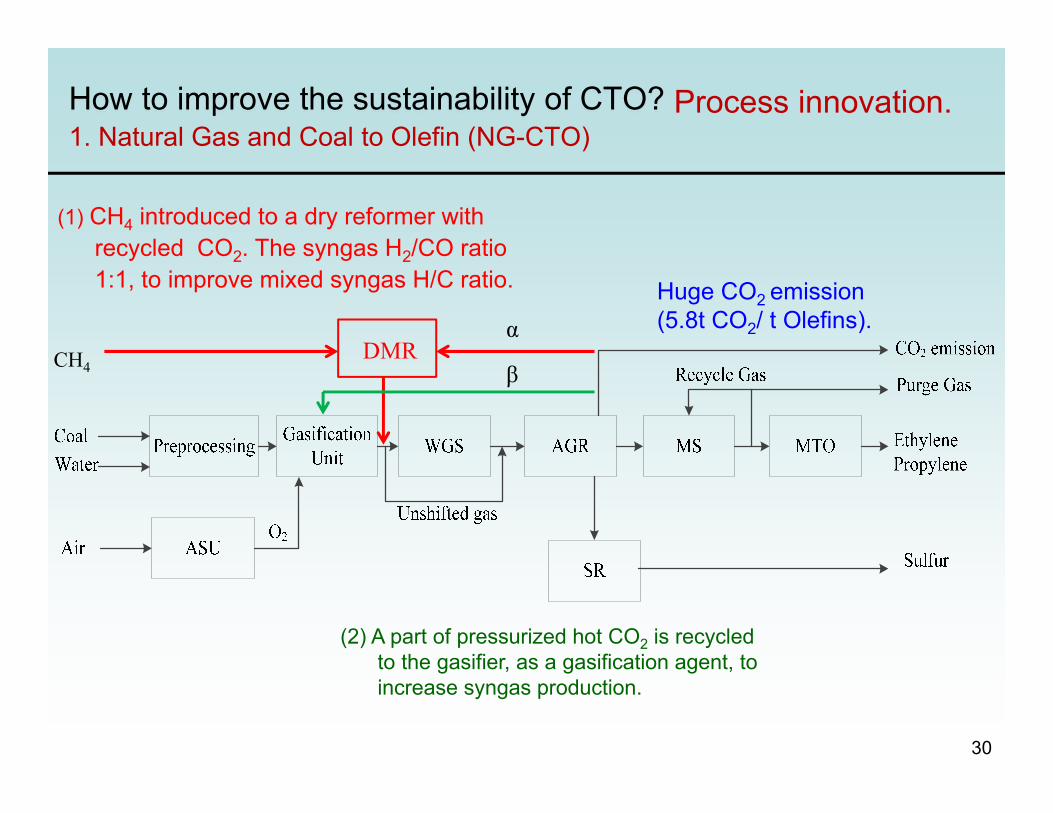
How to improve the sustainability of CTO? Process innovation. 1. Natural Gas and Coal to Olefin (NG-CTO)How to improve the sustainability of CTO?
30
(1) CH4 introduced to a dry reformer with recycled CO2. The syngas H2/CO ratio 1:1, to improve mixed syngas H/C ratio.
DMRCH4
α
β
(2) A part of pressurized hot CO2 is recycled to the gasifier, as a gasification agent, to increase syngas production.
Huge CO2 emission (5.8t CO2/ t Olefins).
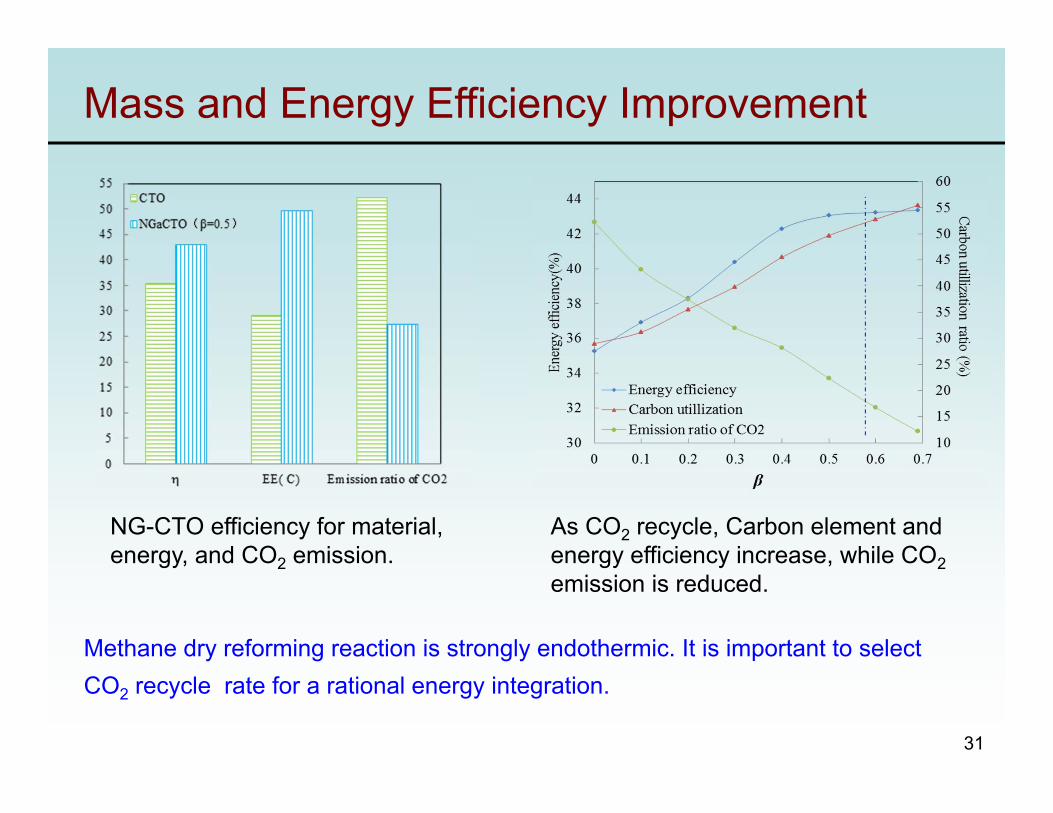
Mass and Energy Efficiency Improvement
Methane dry reforming reaction is strongly endothermic. It is important to select CO2 recycle rate for a rational energy integration.
NG-CTO efficiency for material, energy, and CO2 emission.
As CO2 recycle, Carbon element and energy efficiency increase, while CO2emission is reduced.
31
0
200
400
600
800
1000
1200
CTO NGaCTO(β=0.5)
Tota
l pro
duct
ion
cost(
$/t O
lefin
) Distribution and sellingcosts Administrative costs
Plant overhead costs
Depreciation
Operating &MaintenanceUtilities
Raw material
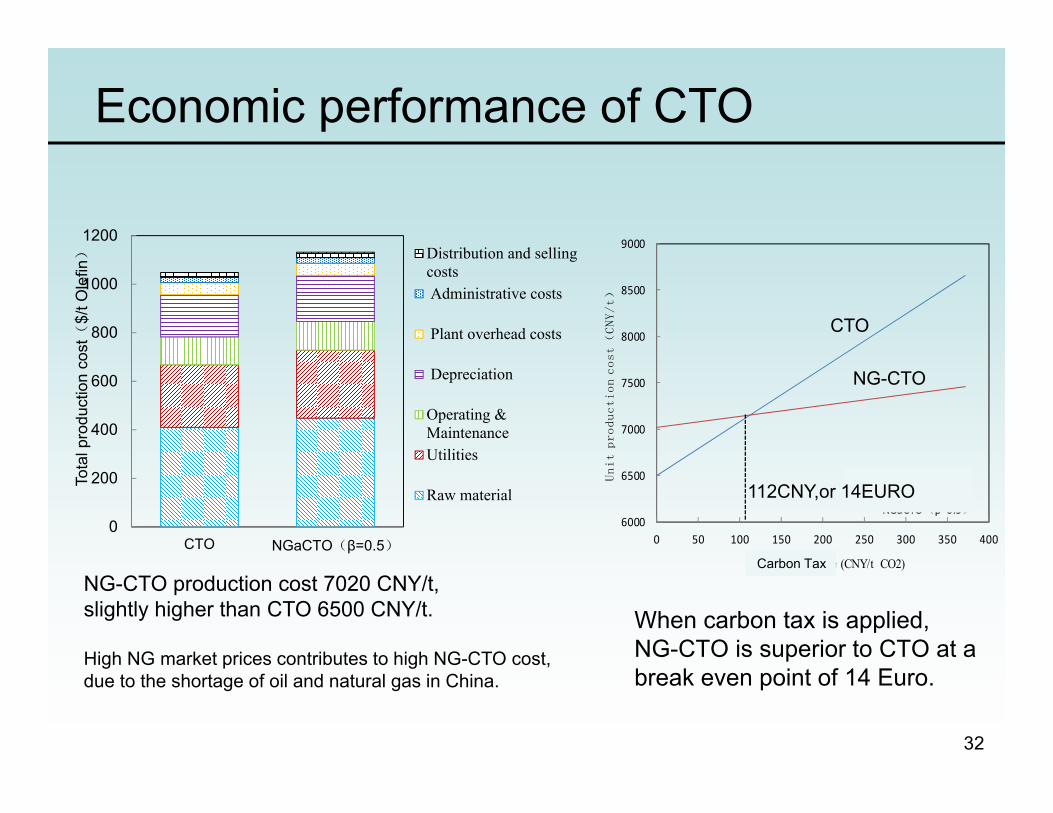
NG-CTO production cost 7020 CNY/t, slightly higher than CTO 6500 CNY/t.
High NG market prices contributes to high NG-CTO cost, due to the shortage of oil and natural gas in China.
6000
6500
7000
7500
8000
8500
9000
0 50 100 150 200 250 300 350 400
Unit production cost(CNY/t)
CO2 credit price (CNY/t CO2)
CTO
NGaCTO(β=0.5)
When carbon tax is applied, NG-CTO is superior to CTO at a break even point of 14 Euro.
Carbon Tax
NG-CTO
CTO
112CNY,or 14EURO
Economic performance of CTO
32
Air Air Seperation
O2
CoalCoal
GasificationAcid Gas Removal
Coal Water Slurry
CLAUS Sulfur recovery process CO2
MEOH,MTO
Sulfide
N2
Syngas 1
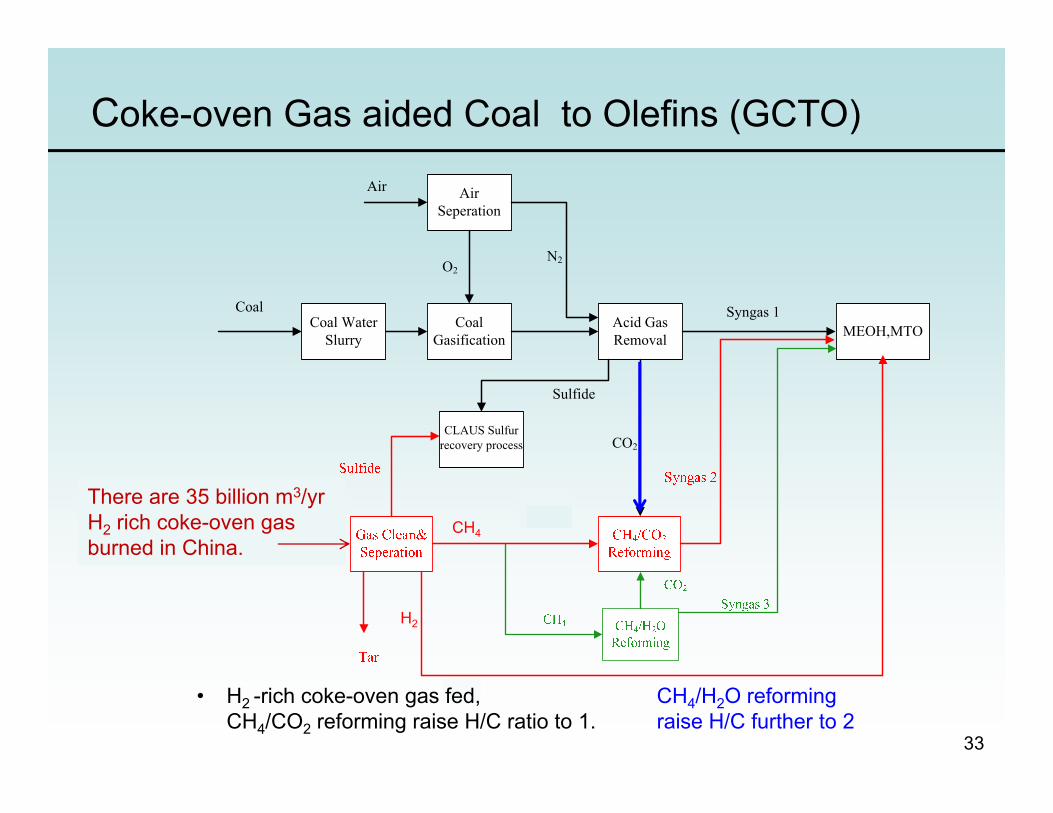
Coke-oven Gas aided Coal to Olefins (GCTO)
H2
CH4
33
• H2 -rich coke-oven gas fed, CH4/CO2 reforming raise H/C ratio to 1.
There are 35 billion m3/yr H2 rich coke-oven gas burned in China.
CH4/H2O reforming raise H/C further to 2
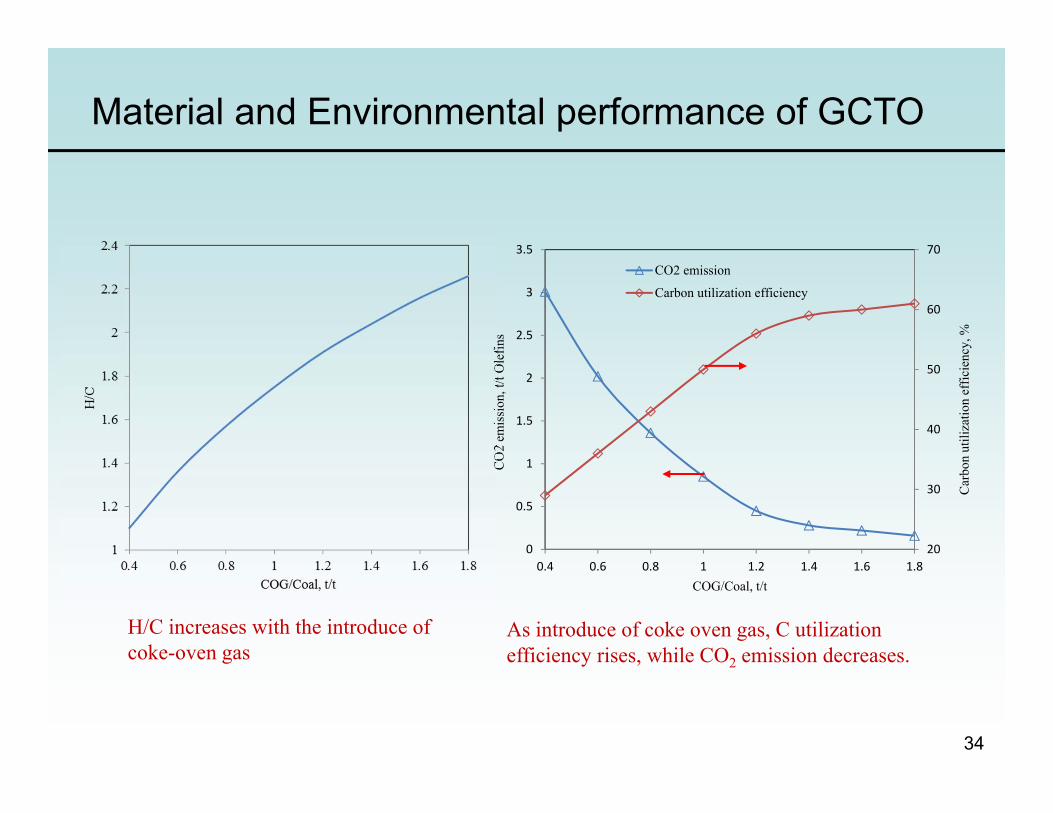
As introduce of coke oven gas, C utilization efficiency rises, while CO2 emission decreases.
Material and Environmental performance of GCTO
20
30
40
50
60
70
0
0.5
1
1.5
2
2.5
3
3.5
0.4 0.6 0.8 1 1.2 1.4 1.6 1.8
Car
bon
utili
zatio
n ef
ficie
ncy,
%
CO
2 em
issi
on, t
/t O
lefin
s
COG/Coal, t/t
CO2 emission
Carbon utilization efficiency
H/C increases with the introduce of coke-oven gas
34

Item CTO CGTO LHV
Consumption
Coal (t/t olefins) 4.10 0.97 28100.0 MJ/t
Coke-oven gas (m3/t olefins) N/A 3288 17.4 MJ/m3
Water (t/t olefins) 30.00 48.00 2.6 MJ/t
Electricity(kWh/t olefins) 1671 2064 3.6 MJ/kWh
Steam (MJ/t olefins) 8753 12498 —
Total energy input (MJ) 130056 104521 —
Products output
Ethylene (t/t olefins) 0.45 0.45 47000.0 MJ/t
Propylene (t/t olefins) 0.45 0.45 47000.0 MJ/t
C4+ (t/t olefins) 0.10 0.10 47000.0 MJ/t
CO2 emission(t/t olefins) 5.80 0.30 —
Olefins energy (MJ) 47000 47000 —
Energy efficiency (%) 36.10 50.70 —
Energy efficiency and CO2 release of GCTO
35
6000
6500
7000
7500
8000
0 50 100 150 200 250 300Pr
oduc
t cos
t, CN
Y/t
Ole
fins
Carbon tax, CNY
CTO
GCTO
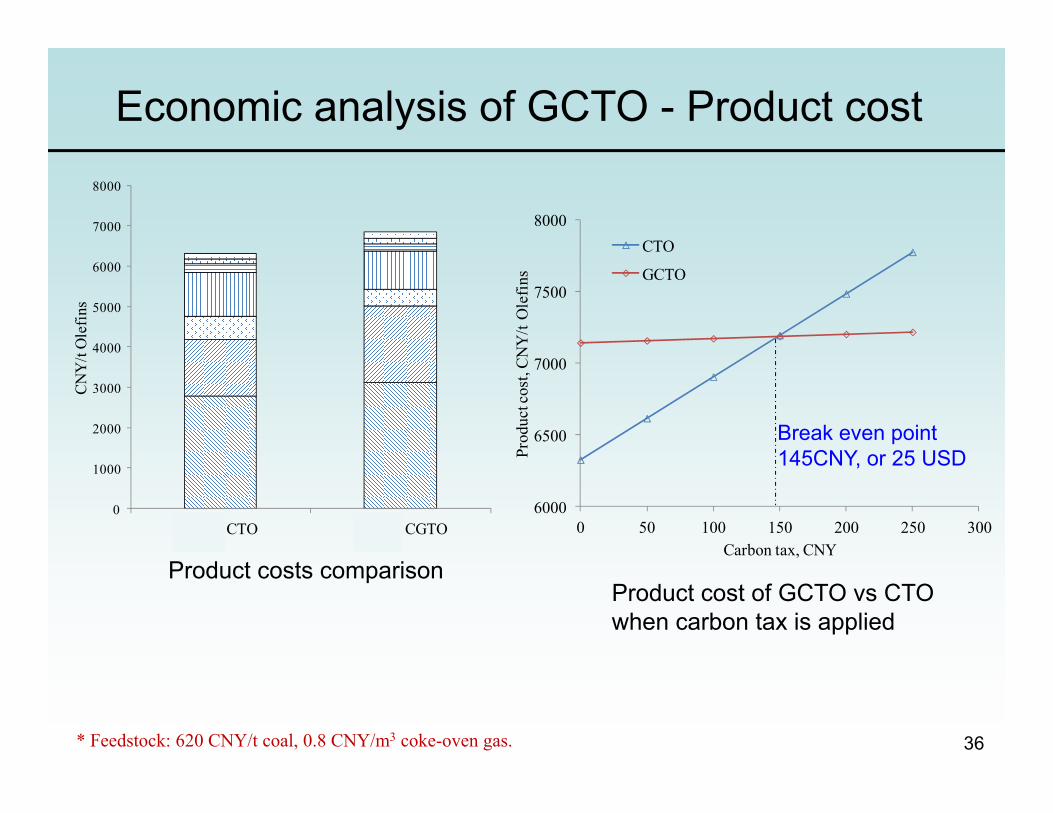
Economic analysis of GCTO - Product cost
Product costs comparison
0
1000
2000
3000
4000
5000
6000
7000
8000
0.6Mt CTO 2.67Mt CGTO
CNY
/t O
lefin
s
Product cost of GCTO vs CTO when carbon tax is applied
36
Break even point 145CNY, or 25 USD
* Feedstock: 620 CNY/t coal, 0.8 CNY/m3 coke-oven gas.
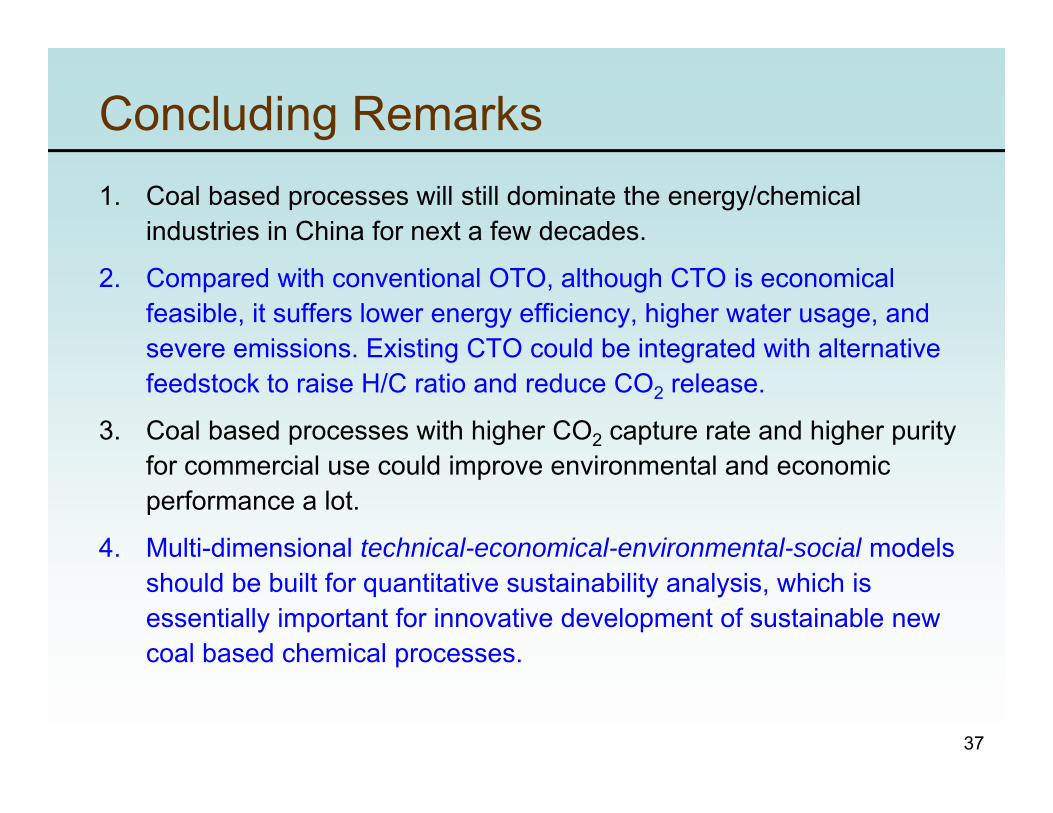
Concluding Remarks1. Coal based processes will still dominate the energy/chemical
industries in China for next a few decades.
2. Compared with conventional OTO, although CTO is economical feasible, it suffers lower energy efficiency, higher water usage, and severe emissions. Existing CTO could be integrated with alternative feedstock to raise H/C ratio and reduce CO2 release.
3. Coal based processes with higher CO2 capture rate and higher purity for commercial use could improve environmental and economic performance a lot.
4. Multi-dimensional technical-economical-environmental-social models should be built for quantitative sustainability analysis, which is essentially important for innovative development of sustainable new coal based chemical processes.
37
2014: Techno-economic analysis of the coal-to-olefins process in comparison with the oil-to-olefins process, Applied Energy, 113, 639-647(2014).
2014 Sustainability assessment of the coal/biomass to Fischer−Tropsch fuel processes, Sustainable Chem. Eng., 2(1) 80-87, 2014.
2014 Techno-economics of the CTO process with CCS, Chem Eng J., 240, 45-54(2014). 2013: A revision and extension of Eco-LCA metrics for sustainability assessment of chemical
processes, Environ. Sci. Technol., 47(24) 14450–14458, 2013.2013: A composite efficiency metrics for resource utilization, Energy.61, 455-462 (2013)2013: Conceptual design and analysis of a nature gas assisted coal-to-olefins process for CO2
reuse, Ind. Eng. Chem. Res., 52, 14406-14414(2013). 2012: Integrated modeling, synthesis, & optimization of coal gasification based energy and
chemical processes, Ind. Eng. Chem. Res. 51: 15763-15777, 2012.2011: Dynamic flexibility analysis of chemical reaction systems with time delay: using a
modified finite element collocation method, Chem. Eng. Res. Des., 89, 1938-1946.2010: Development, simulation, and industrialization of a new coal-gasification process to
remove phenol and ammonia,. Ind. Eng. Chem. Res.2009: Pan/Qian, New approach for scheduling crude oil operations, Chem Eng Sci.2009: Feng/Qian, A novel stripper to remove ammonia for coal-gasification treatment and the
industrial implementation, Ind. Eng. Chem. Res.2009: Qian/Liu/Huang, Conceptual design and system analysis of a poly-generation system for
power and olefin production, Applied Energy.
Recent Publications
Acknowledgements• National Science Foundation of China (21136003);
• China Major Fundamental Research Project (973).
• My colleagues and PhD students at South China University of Tech.

Outline
• Background
• Objectives and approaches of sustainability analysis
• Energy efficiency analysis and process integration
• Sustainability analysis
– Industrial Case: coal to olefins
• Concluding remarks
41
42
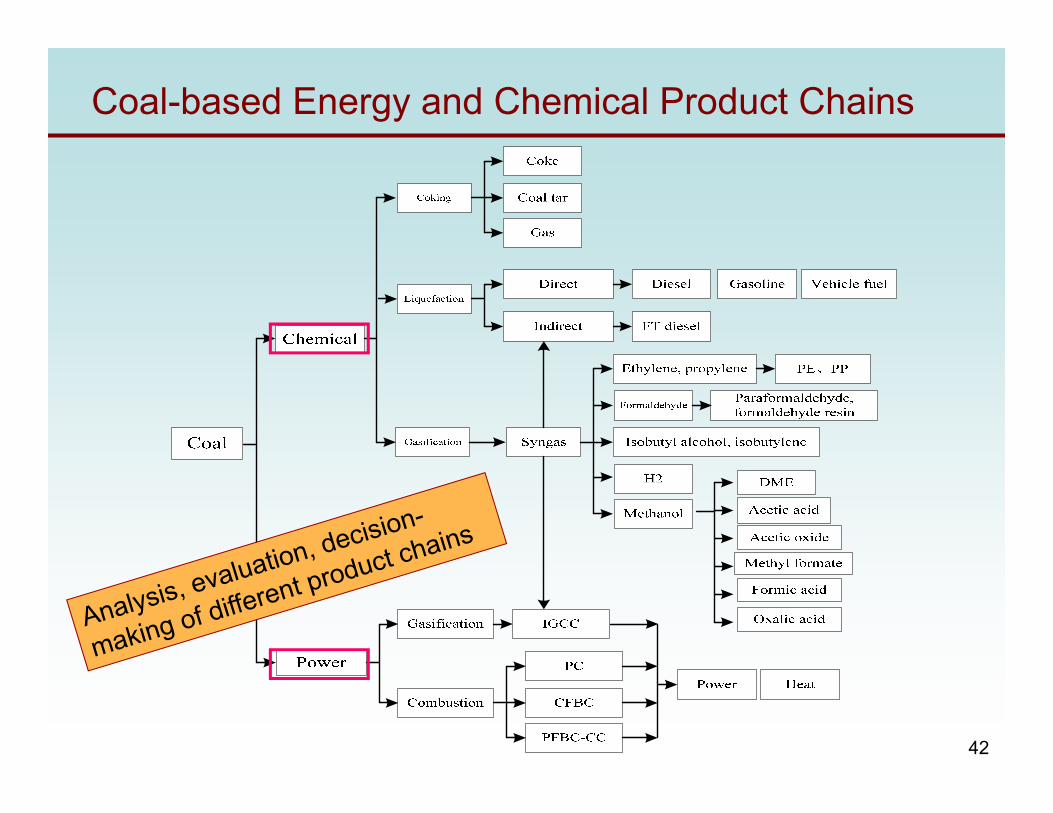
Coal-based Energy and Chemical Product Chains
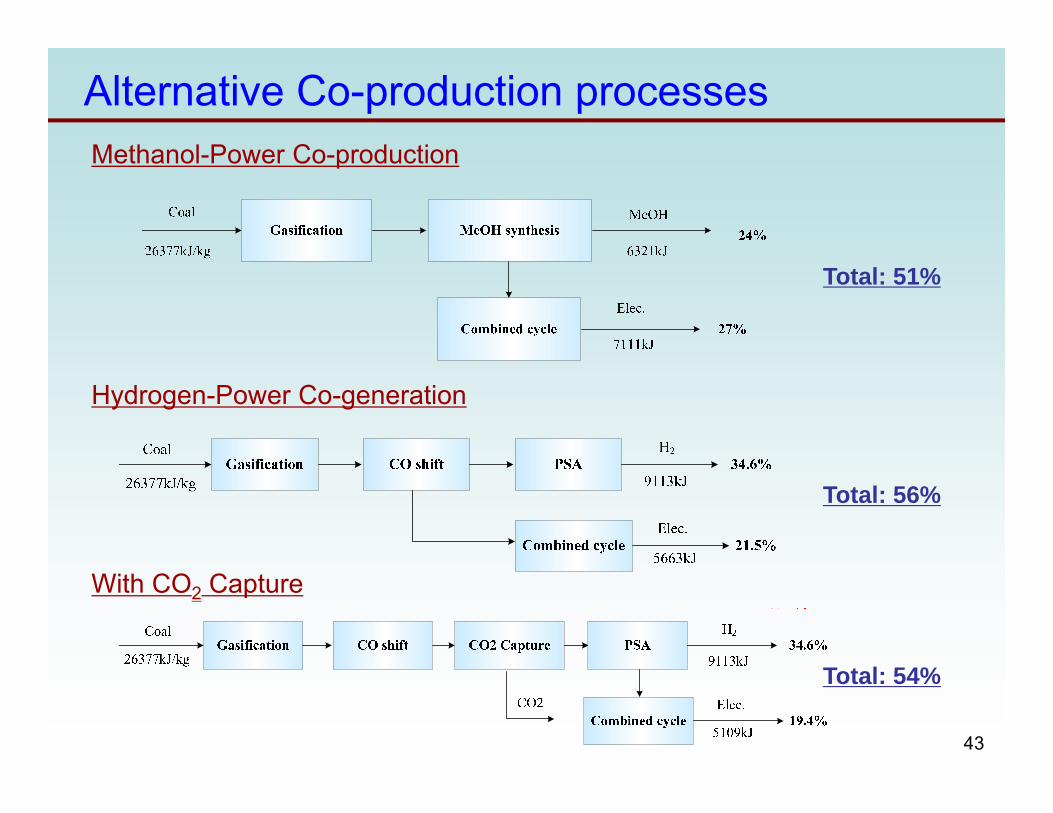
Methanol-Power Co-production
Total: 51%
Hydrogen-Power Co-generation
Total: 56%
With CO2 Capture
Total: 54%
Alternative Co-production processes
43
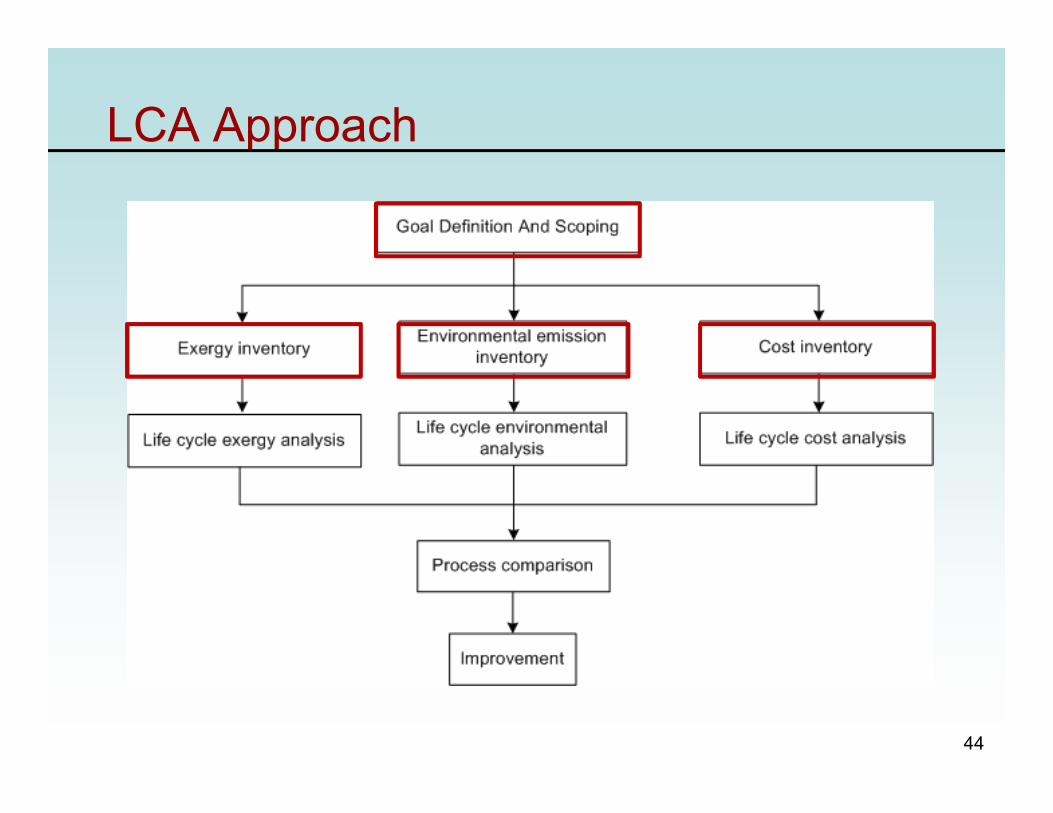
LCA Approach
44
45
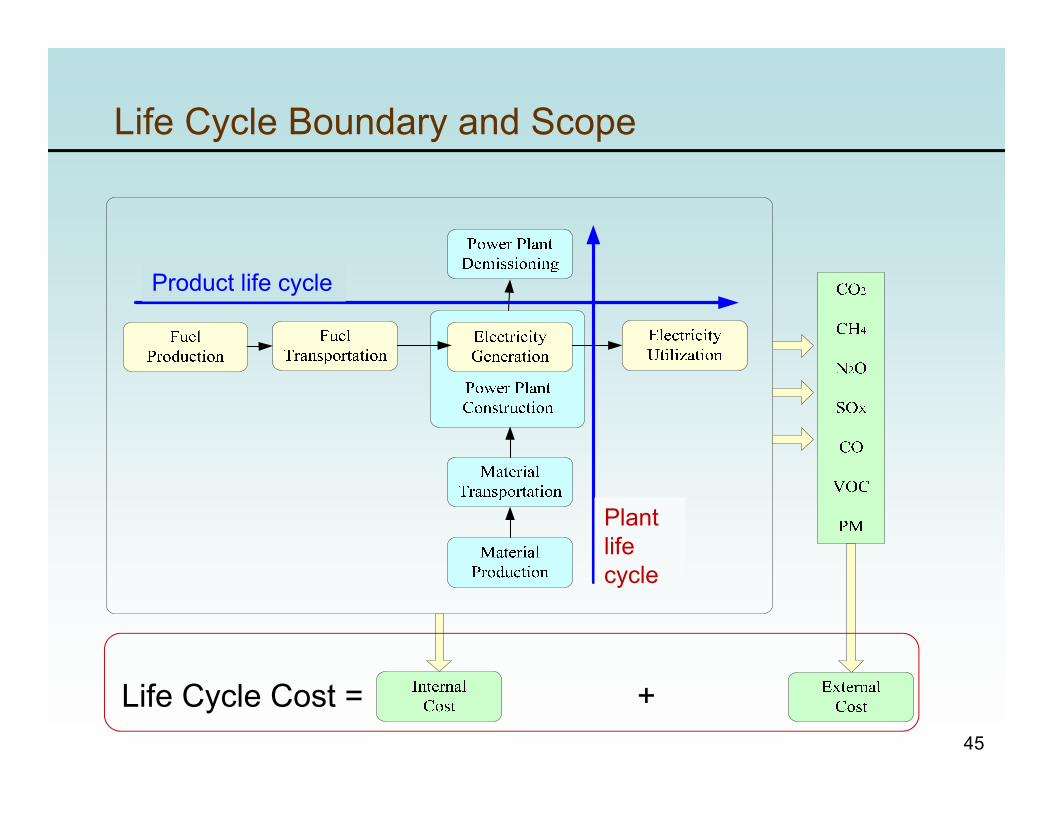
Life Cycle Boundary and Scope
Product life cycle
Plant life cycle
Life Cycle Cost = +
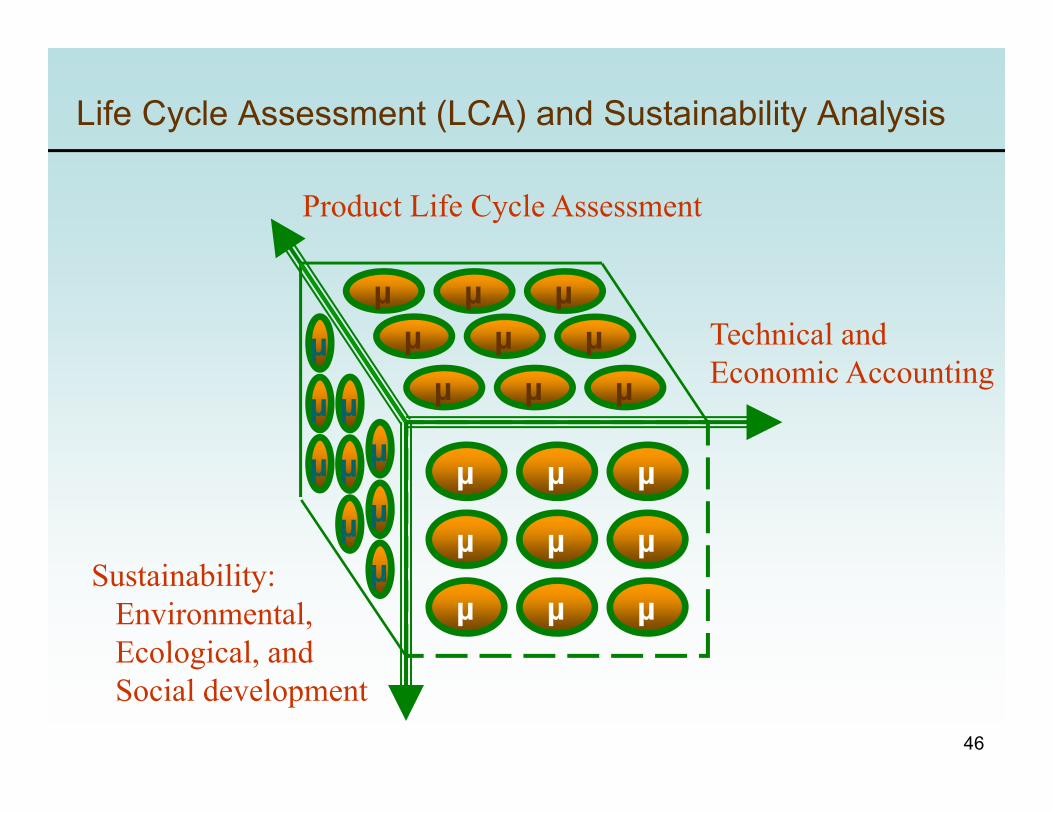
Life Cycle Assessment (LCA) and Sustainability Analysis
µ
µ
µ
µµ
µ
µ µµ
Technical and Economic Accounting
Product Life Cycle Assessment
µ
µµ
µ
µµ
µµ
µ
Sustainability:Environmental, Ecological, and Social development
µ
µ
µ
µ
µ
µµ
µ
µ
46
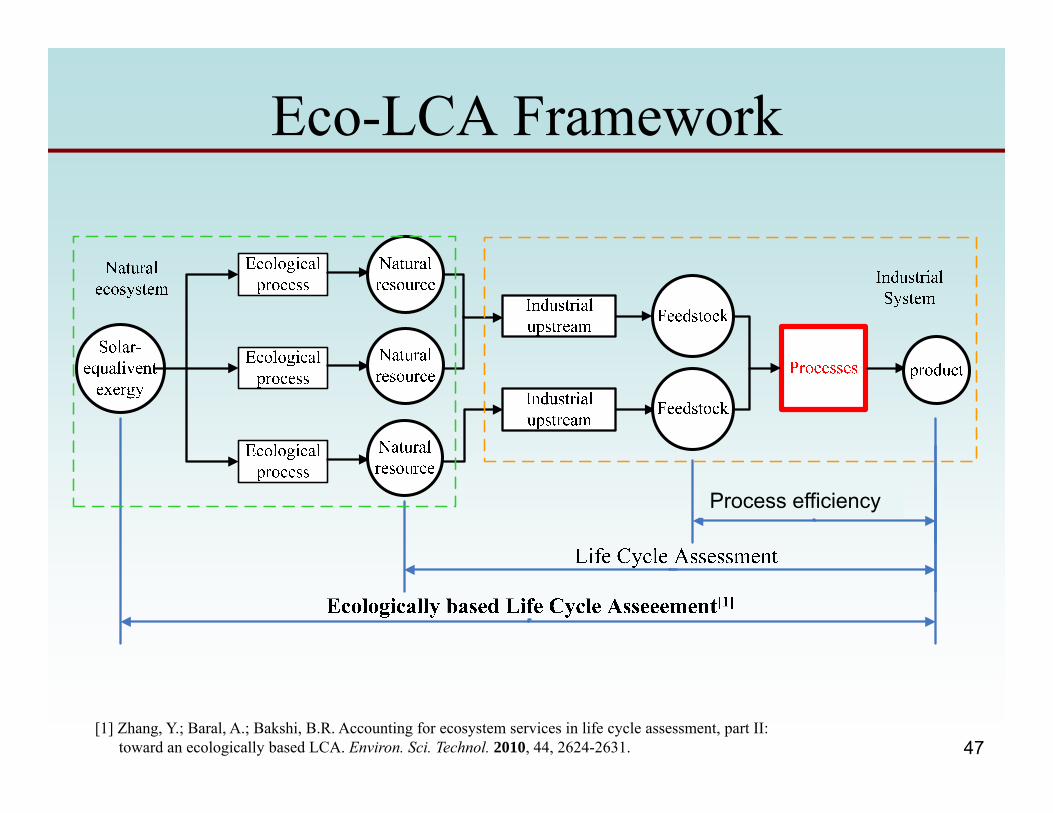
Eco-LCA Framework
47[1] Zhang, Y.; Baral, A.; Bakshi, B.R. Accounting for ecosystem services in life cycle assessment, part II:
toward an ecologically based LCA. Environ. Sci. Technol. 2010, 44, 2624-2631.
Process efficiency

Production process
Industrial upstream
Industrial upstream
Ecological process
Ecological process
Ecological process
Solar-equivalent
exergy
Ecology
Investment
equipment land labour
Products
Waste discharge
Waste treatment
48
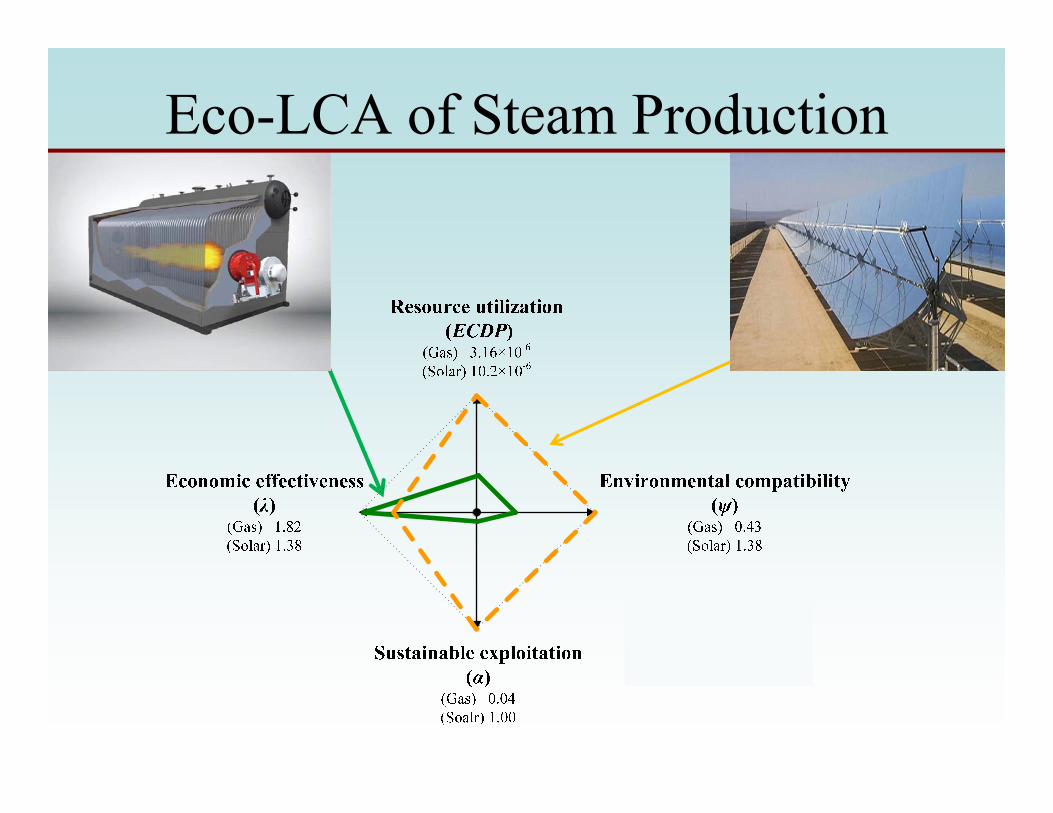
Multi-attribute Eco-LCA Metrics1. Sustainable exploitation
α = aaver·amin2. Economic effectivenessλ = MoneyProd / MoneyInv
4. Resource utilization ECDP = ExProd / ECECProd
3. Environmental compatibilityψ = EMR / IVP
1. Resource abundant factor:Lems, S.; de Swaan Arons, J. The sustainability of resource utilization. Green Chem. 2002, 4, 308-313. 2. EMR is the overall ECEC/Money Ratio, IVP is the ECEC per unit of economic output. ψ = EMR / (ECECProd / MoneyProd)
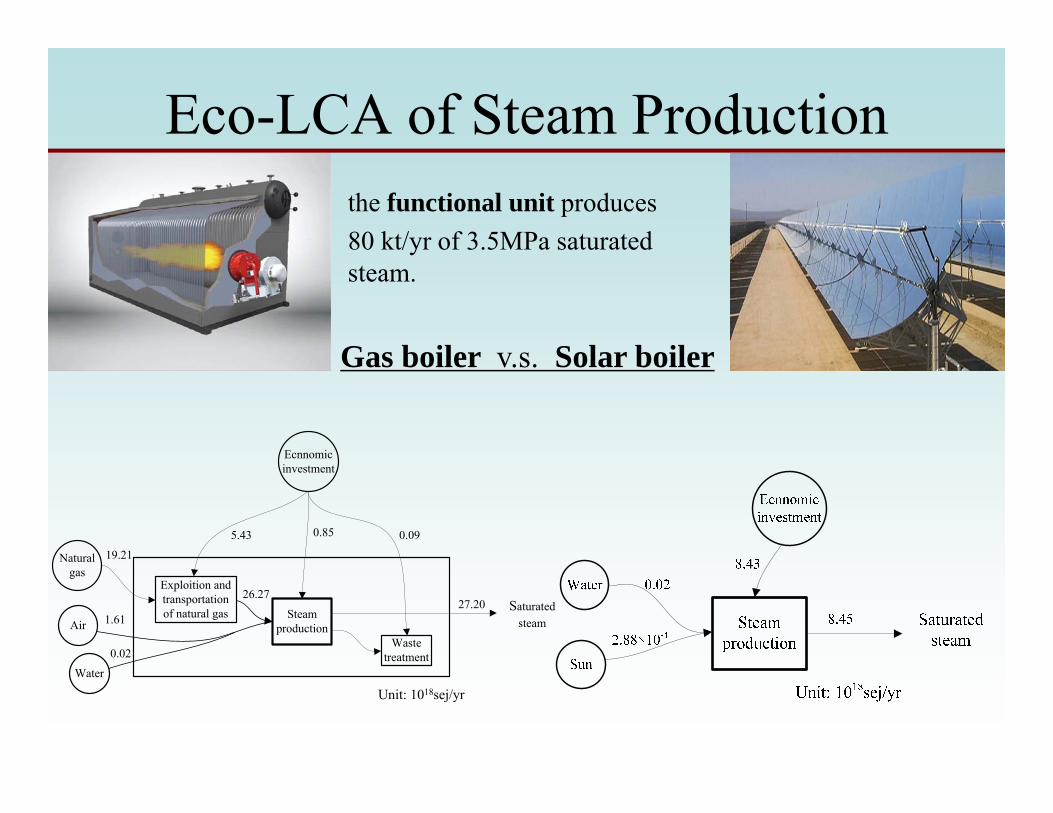
Eco-LCA of Steam Productionthe functional unit produces 80 kt/yr of 3.5MPa saturated steam.
Gas boiler v.s. Solar boiler
Exploition and transportation of natural gas Steam
productionWaste
treatmentWater
Saturated steamAir
19.21
1.61
0.02
5.43 0.85 0.09
26.2727.20
Unit: 1018sej/yr
Ecnnomic investment
Natural gas
Eco-LCA of Steam Production
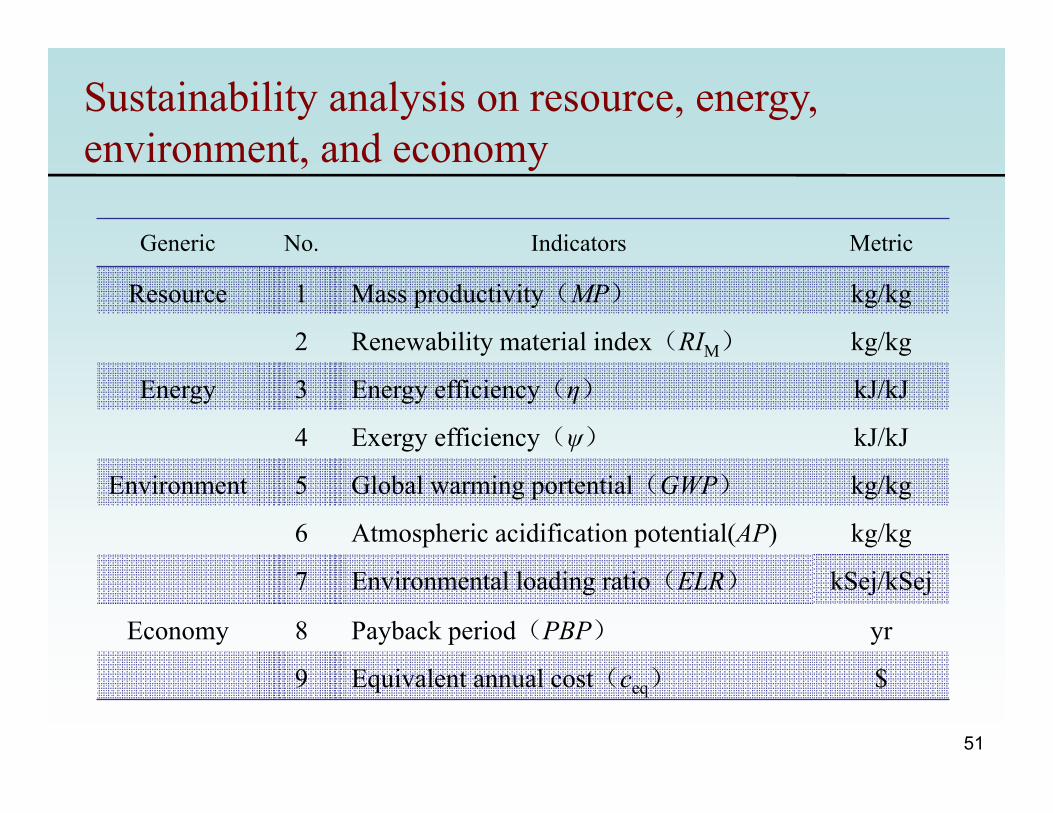
Generic No. Indicators Metric
Resource 1 Mass productivity(MP) kg/kg
2 Renewability material index(RIM) kg/kg
Energy 3 Energy efficiency(η) kJ/kJ
4 Exergy efficiency(ψ) kJ/kJ
Environment 5 Global warming portential(GWP) kg/kg
6 Atmospheric acidification potential(AP) kg/kg
7 Environmental loading ratio(ELR) kSej/kSej
Economy 8 Payback period(PBP) yr
9 Equivalent annual cost(ceq) $
Sustainability analysis on resource, energy, environment, and economy
51

Case 4: Coal based process with CCS
52
5000550060006500700075008000850090009500
10000
0 30 60 90 120
150
180
210
240
270
300
330
360
400
Prod
uct c
ost (
CN
Y/t)
CO2 tax (CNY/t)
MTO CC 0%CC 80% OTO
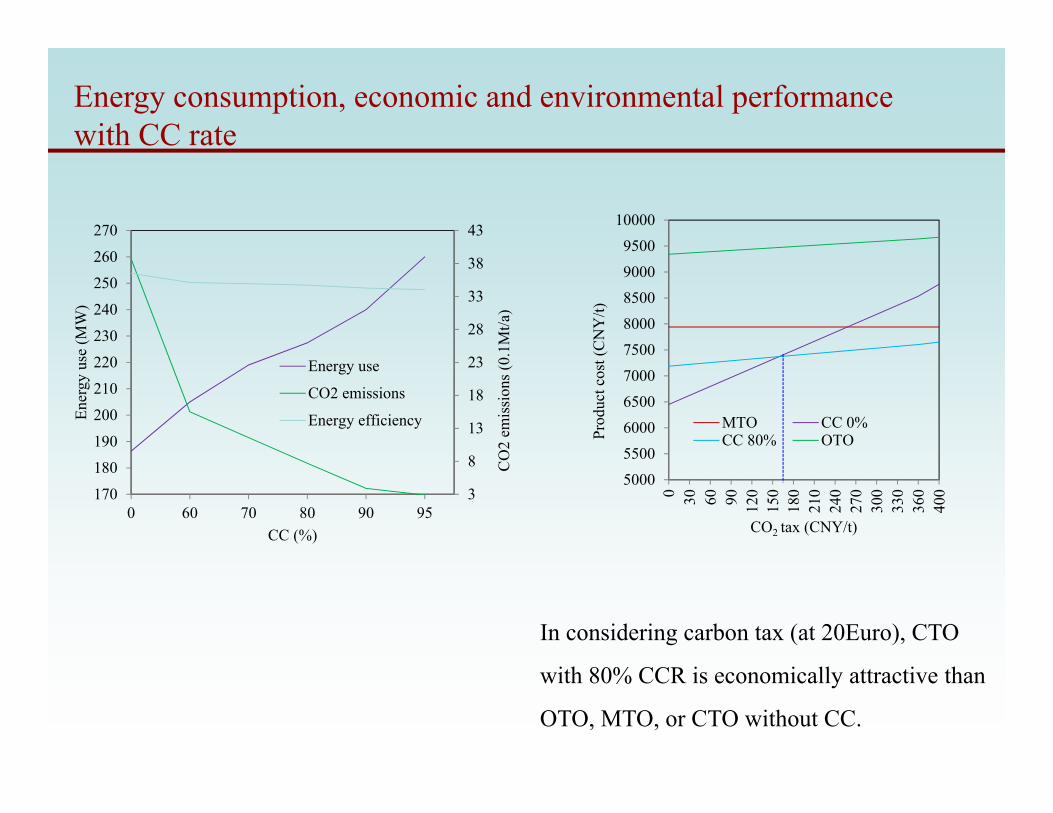
Energy consumption, economic and environmental performance with CC rate
In considering carbon tax (at 20Euro), CTO
with 80% CCR is economically attractive than
OTO, MTO, or CTO without CC.
3
8
13
18
23
28
33
38
43
170
180
190
200
210
220
230
240
250
260
270
0 60 70 80 90 95C
O2
emis
sion
s (0.
1Mt/a
)
Ener
gy u
se (M
W)
CC (%)
Energy use
CO2 emissions
Energy efficiency

• On the other side, CO2 enriched to higher concentration (99%) for commercial usage is better for resource utilization and economic performance.
• As shown in the chart, although GWP reduced, CO2 capture (CC) costs. Captured CO2(90%) for oil extraction/geo-storage are of higher Cost and PayBackPeorid.
Coal gasification with CCS or CCU?
Texaco gasificationTexaco gasification with CC (90% CO2)
MP
η
ψ
GWP
PBP
ceq
Texaco gasification with CC (99% CO2)
0
20
40
60
80
100
PBP
GWP
MP
ψ
ceq η
PBP
GWP
MP
ψ
ceq η
Carbon tax = $20 USD/t equivalentCO2
• Quantitative sustainability analysis helps rational decision making on CCUS approaches.
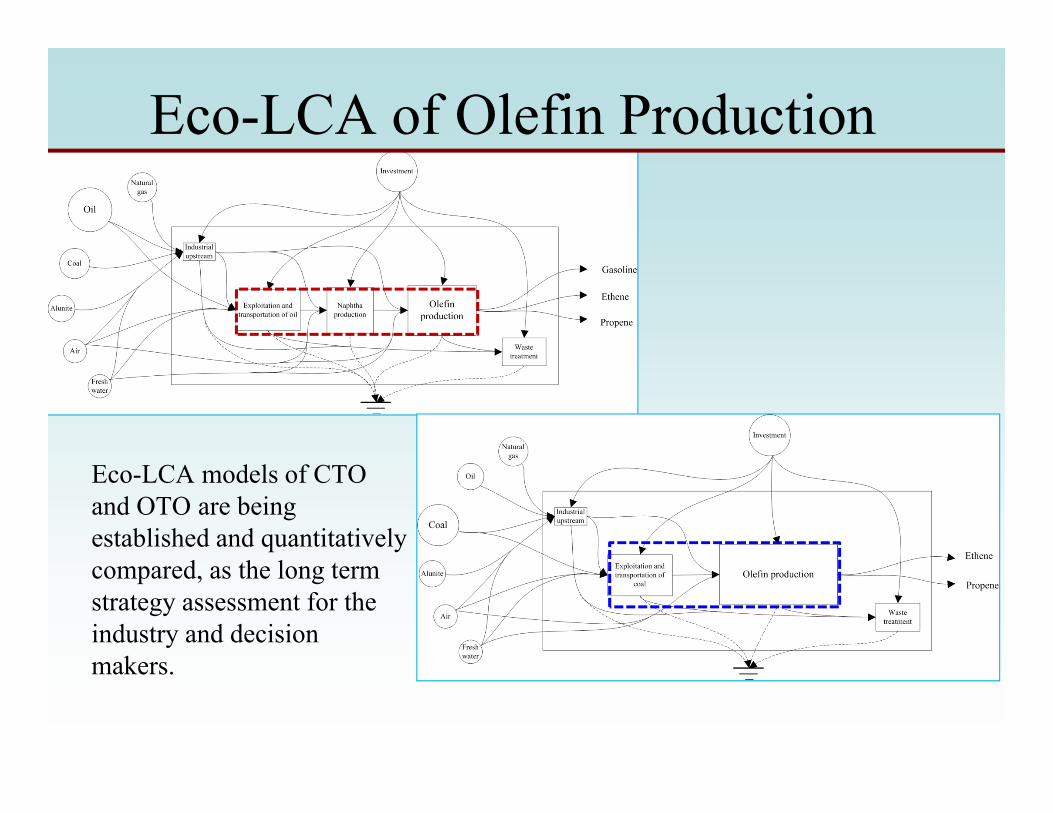
Eco-LCA of Olefin Production
Eco-LCA models of CTO and OTO are being established and quantitatively compared, as the long term strategy assessment for the industry and decision makers.
此处是否可以找一个天平的图?
Efficiency vs. Sustainability
56
Coordinate, Balance, Trade off
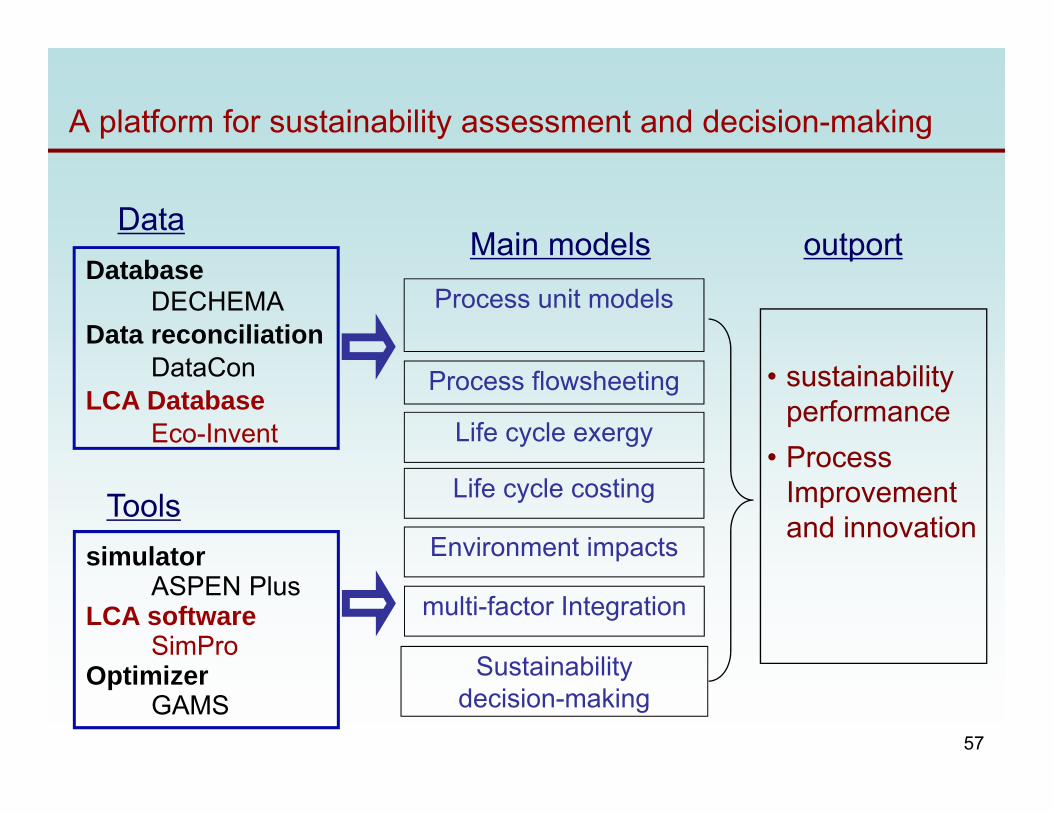
A platform for sustainability assessment and decision-making
• sustainability performance
• Process Improvement and innovation
outportProcess unit models
Life cycle exergy
Process flowsheeting
Sustainability decision-making
Life cycle costing
Environment impacts
Main models
multi-factor Integration
DataDatabase
DECHEMAData reconciliation
DataConLCA Database
Eco-Invent
simulatorASPEN Plus
LCA softwareSimPro
OptimizerGAMS
Tools
57
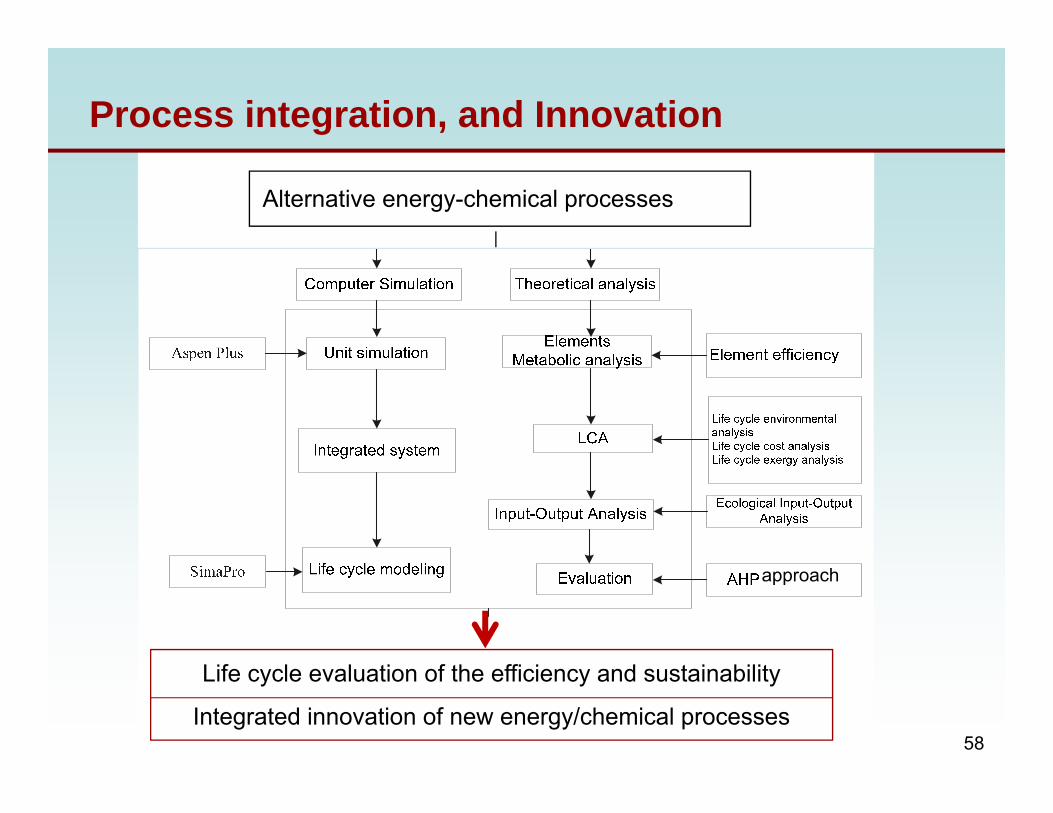
Process integration, and Innovation
Alternative energy-chemical processes
approach
58
Life cycle evaluation of the efficiency and sustainability
Integrated innovation of new energy/chemical processes