suspension plasma sprayed alumina-yttria stabilized...
TRANSCRIPT
Suspension Plasma Sprayed Alumina-Yttria
Stabilized Zirconia Nano-Composite Thermal Barrier Coatings
– Formation and Roles of the Amorphous Phase
Fariba Tarasi
A Thesis
in
The Department
of
Mechanical and Industrial Engineering
Presented in Partial Fulfilment of the Requirements
For the Degree of Doctor of Philosophy at
Concordia University
Montreal, Quebec, Canada
February 2010
© Fariba Tarasi, 2010
iii
Abstract
Suspension Plasma Sprayed Alumina-Yttria Stabilized Zirconia Nano-Composite
Thermal Barrier Coatings-Formation and Roles of the Amorphous Phase
Fariba Tarasi, Ph.D.
Concordia University, 2010
Thermal barrier coatings have been used for the last half century to protect parts in high-
temperature service from premature damage. Thermal barrier coatings are mostly
produced by thermal spray techniques, especially plasma spray processes. They are
widely used in the aerospace and automotive industries and in power plants, applications
in which there is an ever-increasing demand for further improvement of functionality and
durability. In the field of material design, use of composite coatings rather than
monolithic material, and nano-structure instead of conventional grain sizes, are among
the solutions most often considered. Suspension plasma spray is an innovative process for
production of nano-structured thermal barrier coatings.
This research project was directed toward a superior thermal barrier coating using
suspension plasma spray deposition of the alumina-yttria stabilized zirconia composite
material with nano-crystalline structure. Crystallization of the amorphous phase is
introduced as a new route toward nano-crystallinity in ceramics, as was previously
applied in the metals and alloys. The suspension plasma spray process was used in
production of coatings with comparatively high amorphous content. The work
iv
concentrates on three major aspects of thermal barrier coating improvement. The primary
focus of the project is amorphous phase formation and the roles it plays in properties and
structure. This phase, which was found beneficial to nano-crystallinity, improves the
mechanical properties after heat treatment. The second concentration is the suspension
plasma spray process and the versatility of its resulting microstructures, and a comparison
of suspension with the conventional plasma spray process. The third aspect is the
properties of alumina-YSZ composite material as a choice for thermal barrier coating
application. It was found that the material can compete with the present YSZ material in
some aspects (e.g. thermal resistivity and hardness), but suffers from some other
deficiencies (e.g. brittleness and high erosion rate). This suggests considering some other
compositions of the composite, while continuing in microstructural improvement of this
material for thermal barrier application.

v
To my devoted mother and the eternal soul of my father
vi
Acknowledgements
I would like to gratefully thank my supervisors Dr. Mamoun Medraj and Dr. Ali
Dolatabadi for their careful supervision and kind and considerate support within the
course of this research, Dr. Jorg Oberste-Berghaus for his crucial guidelines and Dr.
Christian Moreau for his generous scientific and financial support. I extend my sincere
thanks to all the researchers and technicians in the advanced material group of IMI-NRC
Canada, every single one of whom has played a role in the advancement of this research
project, in addition to Dr. Dmytro Kevorkov for his useful consultation in XRD
techniques.
I also appreciate the kind help of the Liburdi Company, especially, Dr.s Doug. Nagy and
Tiberius Rusan for free testing of the thermal cyclic samples.
vii
Table of Contents
ABSTRACT ..................................................................................................................... III
ACKNOWLEDGEMENTS ........................................................................................... VI
TABLE OF CONTENTS ............................................................................................. VII
LIST OF FIGURES ......................................................................................................... X
LIST OF TABLES ....................................................................................................... XVI
CHAPTER 1 INTRODUCTION AND LITERATURE REVIEW .......................... 1
1.1. TBC Coating Processes ................................................................................................................... 5
1.1.1. Processes for Nano-Feed Application .......................................................................................... 6
1.1.2. Suspension Plasma Spray ............................................................................................................. 8
1.2. Particle Interaction with Plasma Jet ........................................................................................... 11
1.3. TBC System and Materials........................................................................................................... 12
1.4. Failure Mechanisms of TBCs ....................................................................................................... 17
1.5. Graded and Composite Coatings of Zirconia-Alumina ............................................................. 19
1.5.1. As Sprayed YSZ, Alumina and Alumina-Zirconia Composite Coatings ................................... 23
1.5.2. Amorphous Phase in Alumina-Zirconia Composite Coating ..................................................... 24
1.5.3. Thermal Changes of Alumina-Zirconia Composite Coatings .................................................... 25
1.6. Objectives ....................................................................................................................................... 27
CHAPTER 2 EXPERIMENTAL PROCEDURES ................................................. 30
2.1. Spray Systems ................................................................................................................................ 30
2.1.1. Suspension Plasma Spray ........................................................................................................... 30
2.1.2. Atmospheric Plasma Spray......................................................................................................... 32
2.2. Measurement and Monitoring Systems ....................................................................................... 33
2.2.1. Particle Size Measurement ......................................................................................................... 33
2.2.2. Accura-Spray Diagnostic System ............................................................................................... 33
2.2.3. DPV2000 Particle Diagnostic System ........................................................................................ 34
2.3. Mechanical Tests ........................................................................................................................... 36
2.3.1. Microhardness ............................................................................................................................ 36
2.3.2. Fracture Toughness .................................................................................................................... 36
viii
2.3.3. Erosion Resistance ..................................................................................................................... 37
2.4. High Temperature Performance .................................................................................................. 37
2.4.1. Thermal Conductivity ................................................................................................................. 37
2.4.2. Thermal Cyclic Test ................................................................................................................... 38
2.5. Measurement Techniques ............................................................................................................. 39
2.5.1. Microstructure and Porosity ....................................................................................................... 39
2.5.2. Amorphous Phase Measurement ................................................................................................ 40
2.5.3. Grain Size Measurement ............................................................................................................ 43
2.5.4. Phase Analysis ............................................................................................................................ 44
2.5.5. Lattice Parameter Measurement ................................................................................................. 45
CHAPTER 3 CRYSTALLINE STRUCTURE AND AMORPHOUS PHASE
FORMATION IN ATMOSPHERIC PLASMA SPRAY PROCESS ......................... 46
3.1. In-Flight Particle Study ................................................................................................................ 48
3.2. Coating Structure and Amorphous Formation .......................................................................... 56
3.3. Phase Analysis and Amorphous Phase Contents ........................................................................ 60
3.4. Summary ........................................................................................................................................ 62
CHAPTER 4 SUSPENSION PLASMA SPRAY COATING
MICROSTRUCTURE AND CRYSTALLINE/NON-CRYSTALLINE
STRUCTURES AND TRANSFORMATIONS ............................................................ 65
4.1. Controlling the Microstructure of SPS Coatings and Resulting Properties ............................ 65
4.1.1. Roles of the Parameters on Microstructure ................................................................................ 68
4.1.2. The Effect of Porosity on Coating Hardness .............................................................................. 77
4.1.3. The Effect of Porosity on Thermal Diffusivity ........................................................................... 78
4.2. Phase Formation and Transformations in SPS Coatings .......................................................... 80
4.2.1. Crystalline/Amorphous Phases in As-Coated Structure ............................................................. 82
4.2.2. Phase Transformation during Thermal Analysis ........................................................................ 92
4.2.3. Transformation Verification by Heat Treatment ........................................................................ 93
4.2.4. Preferred Phase during Crystallization of the Amorphous Phase ............................................... 96
4.3. Summary ...................................................................................................................................... 100
CHAPTER 5 DEVELOPING AMORPHOUS PHASE IN THE COATINGS ... 102
5.1. Role of Parameters on Amorphous phase Formation .............................................................. 105
5.2. Coatings Amorphous Contents and Crystallite Sizes ............................................................... 116
ix
5.3. Sources of Amorphous and Crystalline Phases in SPS Coatings ............................................ 119
5.3.1. In-Flight Collected Powders ..................................................................................................... 121
5.3.2. Comparison of the Collected Powders in SPS and APS ........................................................... 125
5.3.3. SPS Coatings Using Different Powders ................................................................................... 128
5.3.4. Sources of Crystalline Phases and the Nature of Amorphous Phase ........................................ 131
5.4. Summary ...................................................................................................................................... 138
CHAPTER 6 THERMAL EVOLUTION AND HIGH-TEMPERATURE
PERFORMANCE OF THE MIXED AMORPHOUS/CRYSTALLINE
STRUCTURE 139
6.1. Crystallization and Phase Transformation Temperatures versus Amorphous Content ...... 139
6.2. Crystalline Structure Changes after Heat Treatments ............................................................ 140
6.3. Microstructural Changes after Heat Treatments ..................................................................... 143
6.4. Grain Sizes after Heat Treatment .............................................................................................. 145
6.5. Mechanical Properties before and after 1000°C/10 hrs Heat Treatment ............................... 149
6.5.1. Hardness ................................................................................................................................... 149
6.5.2. Fracture Toughness .................................................................................................................. 150
6.5.3. Erosion ..................................................................................................................................... 152
6.6. Mechanical Properties before and after 1300°C/24 hrs, 1500°C/5 hrs Heat Treatment ....... 154
6.6.1. Hardness ................................................................................................................................... 154
6.6.2. Fracture Toughness .................................................................................................................. 155
6.7. Thermal Conductivity Changes before and after Heat Treatment ......................................... 156
6.8. Thermal Cyclic Test .................................................................................................................... 158
6.8.1. Thermal Cyclic Life ................................................................................................................. 158
6.8.2. Structural Changes ................................................................................................................... 160
6.8.3. Microstructural Changes .......................................................................................................... 162
6.9. Summary ...................................................................................................................................... 163
CHAPTER 7 CONCLUSION, MAIN CONTRIBUTIONS AND FUTURE
WORKS 165
7.1. Conclusions .................................................................................................................................. 165
7.2. Major Contributions ................................................................................................................... 168
7.3. Recommendations for Future Works ........................................................................................ 169
Appendix...................................................................................................... ............................................188
x
List of Figures
Figure 1-1 Typical microstructures of zirconia coated with a) APS [28]; b) EB-PVD over
bond coat [29] ..................................................................................................................... 6
Figure 1-2 Radial injection of the liquid carrier into the plasma jet showing the jet
fluctuations effect on the feed penetration into the plasma core [43] ................................. 9
Figure 1-3 Schematic of a typical TBC system ................................................................ 13
Figure 1-4 The general phase diagram for solution stabilizer metal oxides in zirconia [55]
........................................................................................................................................... 16
Figure 1-5 Binary equilibrium phase diagram of alumina–zirconia system [ACerS-NIST
Phase Equilibria Diagram, CD-ROM Database, Version 3.0] [82] .................................. 22
Figure 2-1 Mettech axial III plasma torch; (a) front and (b) rear view of the combined
injection nozzle and the three plasma torches in axial III system ..................................... 31
Figure 2-2 Simplified Suspension Plasma Spray (SPS) system with axial injection ...... 32
Figure 2-3 The operating basis of the particle velocity and temperature measurement [88]
........................................................................................................................................... 34
Figure 2-4 Physical basis for the Accura-Spray ensemble diagnostic system [88] .......... 35
Figure 2-5 Linear regression of the data from XRD and DSC evaluation methods of
amorphous content ............................................................................................................ 43
Figure 3-1 Feed powders, a) Tosoh powder at 1kX and b) Tosoh powder at 50kX and
back scattered mode; c) Amperite 750 at 1kX and d) Amperite 750 powder at 500X and
back scattered mode .......................................................................................................... 48
Figure 3-2 Variation of Amperite 750 particle temperature with the distance from the
nozzle exit ......................................................................................................................... 49
Figure 3-3 Collected in-flight particles into water after spraying under similar plasma
spray conditions, a) Tosoh and b) Amperite 750 .............................................................. 50
Figure 3-4 Tosoh collected powder: a) unmolten particle; b) fully molten-resolidified
particle and partly molten particle consisting of c) unmolten region indicated by U,
molten region M, and enlarged pores designated by P. .................................................... 51
xi
Figure 3-5 Collected in-flight particles sprayed by conventional plasma spray: a)
unmixed; b) partly mixed and fully mixed particles; c) high resolution microscopy of the
fully mixed particle at 50kX showing no sign of crystalline grain throughout the particle
........................................................................................................................................... 52
Figure 3-6 Fully molten and mixed particle with homogenous composition and no sign of
crystalline grains ............................................................................................................... 53
Figure 3-7 Structural features in an in-flight particle sprayed, solidified and collected into
water: a) a typical particle; b) magnified external part and c) magnified internal part of
the particle; and d) interface area of the two phases ......................................................... 55
Figure 3-8 Coating microstructures: a) using Amperite 750, 6/40 alumina/zirconia; and b)
Tosoh 60/40 alumina/3YSZ powder ................................................................................. 57
Figure 3-9 Intersplat conditions: a) zirconia splat deposited on solidified alumina splat
and b) alumina splat on solidified zirconia ....................................................................... 59
Figure 3-10 XRD patterns of the coatings: a) YSZ coating with tetragonal structure (TZ),
b) Amperite 750 powder coating consisting of tetragonal zirconia (TZ) and alpha alumina
(AA), c) Tosoh powder coating showing (TZ) and monoclinic zirconia (MZ) plus alpha
(AA) and gamma alumina (GA) ....................................................................................... 62
Figure 4-1 The averaged effects of the seven variables on particle characteristics and
microstructural parameters in suspension plasma spray (SPS) process ............................ 69
Figure 4-2 The effect of auxiliary gas, powder size, torch condition and plasma power on
particle velocity and temperature ...................................................................................... 71
Figure 4-3 60/40 wt% alumina/zirconia suspension plasma sprayed coatings: a) resulting
coating using hydrogen auxiliary gas; b) resulting coating using helium auxiliary gas at
100X; c) and d) same coatings as a and b, respectively, at 2kX ....................................... 72
Figure 4-4 Plasma power effect on a) particle velocity and b) particle temperature ........ 74
Figure 4-5 The variation of a) coating porosity vs. particle velocity and b) coating
hardness vs. coating porosity ............................................................................................ 78
Figure 4-6 Thermal diffusivity versus porosity of the coatings ........................................ 79
Figure 4-7 Typical XRD patterns from SPS deposition of 60 Al2O3/40YSZ under various
spray conditions showing cubic zirconia (CZ) in a) 8YSZ and all other crystal structures,
and b) sample with α-alumina (AA) as the major alumina phase or c) γ-alumina (GA) as
the major alumina phase; d) mixture of both GA and AA alumina in addition to cubic
zirconia. ............................................................................................................................. 83
xii
Figure 4-8 Peak splitting as an indication of tetragonal zirconia phase formation and the
planes of each peak ........................................................................................................... 85
Figure 4-9 Alumina component phase formation behaviour within the as-deposited
composite versus in-flight particle state ........................................................................... 86
Figure 4-10 SEM micrographs of the coatings deposited using a) H2 gas with high
particle velocities and b) Helium auxiliary gas with lower particle velocities resulting in
different splat flattening and intersplat contact area (circles show some of the in-flight
solidified particles within the coating) .............................................................................. 87
Figure 4-11 Entrapped unmolten nano-particles inside the large in-flight solidified
particle in the coating ........................................................................................................ 88
Figure 4-12 Correlation between the γ percentage in alumina and the cubic phase
percentage in zirconia ....................................................................................................... 90
Figure 4-13 The γ-alumina phase content versus particle velocity in the samples with
mixed structure showing the role of particle temperature and feed size range ................. 91
Figure 4-14 Heating and cooling DSC curves of a typical SPS coating showing three
different peaks probable in heating process of 60 Al2O3/40YSZ SPS coating ................. 92
Figure 4-15 The effect of heat treatment on a) as-sprayed alumina-YSZ coating, b) heat-
treated coating at 1000°C/1 hr, c) heat-treated at 1200°C/24 hrs ..................................... 95
Figure 4-16 γ- to α-alumina transformation peak area vs. crystallization peak area in the
coatings with the major crystalline alumina phase of γ, α or mixed structure .................. 97
Figure 5-1 SEM micrographs of aggregates in the dried suspensions of a) micron-
powders and b) nano-powders ........................................................................................ 106
Figure 5-2 Collected in-flight particles sprayed into water: a) micron-powder presenting
fully molten round particles and b) nano-powder that contains also semi-molten and
resolidified (SR), as well as unmolten (U) particles ....................................................... 107
Figure 5-3 Microstructures resulting from a) micron- and b) nano-powder deposition
showing more distinctive color and thicker lamella in nano-particle coating compared
with the coating of micron particles with the same spray conditions ............................. 108
Figure 5-4 XRD pattern for the two coating samples resulting from different in-flight
particle temperatures, showing smaller amorphous hump and higher crystallinity at higher
Tp ..................................................................................................................................... 111
Figure 5-5 Substrate preheat effect on the grain size of as-deposited coating ................ 113
xiii
Figure 5-6 Loose interface contact between the coating and substrate, causing lower
cooling rate of the upcoming splats ................................................................................ 115
Figure 5-7 Grain size of different phases versus amorphous phase (according to the
crystallization peak size) in each coating sample deposited under various conditions with
SPS process ..................................................................................................................... 117
Figure 5-8 Crystallization peak area vs. in-flight particle showing formation of smaller
amount of amorphous phase at higher velocities (The in-flight particle temperatures in ºC
are shown on the data points) .......................................................................................... 118
Figure 5-9 In-flight particles collected in water after spraying with SPS process at 3000X
from a) powder #1 (large agglomerated nano-particulates) using system 1; b) powder #2
(loose nano-particles) sprayed using system 1; c) micron-particles by system 1; d) the
same as b, sprayed using system 2; e) the same as c, sprayed using system 2; f) powder
#1 sprayed with APS at 1000X ....................................................................................... 123
Figure 5-10 SPS-sprayed powder #2 (loose nano-powders mixture) showing different
stages of melting and mixing in the plasma jet: a) partly melted with crystalline particles
retained; b) largely melted with extended mixing (grey color) ...................................... 125
Figure 5-11 SPS-sprayed nano-particles collected in water: a) fully dendritic growth in
unmixed particles; b) dendritic growth in partly mixed particle (arrowed); c) non-
crystalline particle ........................................................................................................... 127
Figure 5-12 Unmolten particles collected in-flight from SPS process: a) partial
segregation of components started; b) no segregation accomplished ............................. 128
Figure 5-13 SPS coatings from: a) powder #1 sprayed with system 1; b) powder #2
sprayed with system 1; c) powder #3 sprayed with system 1; d) same as b, sprayed with
system 2; e) same as c, sprayed with system 2; f) 8 wt% YSZ nano-powder coated with
system 2 .......................................................................................................................... 129
Figure 5-14 XRD pattern of as-coated powders: a) typical pattern of the structures
sprayed with system 1; b) coating of powder #3 deposited with system 2; c) coating of
nano-powder of 8 wt% YSZ, where z represents the cubic (or t’ zirconia), m-z is
monoclinic zirconia, G-A shows γ alumina peaks and A-A is α-alumina. ..................... 132
Figure 5-15 XRD pattern of the coating of nano-powder 60 alumina-40 (8 wt% YSZ)
deposited without atomization showing the location of amorphous hump maximums .. 133
Figure 5-16 Lattice parameters of the crystalline portion of the coatings: a) parameter a
for cubic zirconia; b) parameter a for α-alumina; c) parameter c for α-alumina ............ 135
xiv
Figure 6-1 Transformation temperatures versus crystallization peak area, showing that
neither crystallization temperature nor the γ- to α-alumina transformation temperatures
are affected by the amorphous content ........................................................................... 140
Figure 6-2 Comparison of crystalline structure of heat-treated coatings with fully
crystalline and highly amorphous coating: a) coating with 64% amorphous; b) 64%
amorphous coating heat-treated at 1300°C for 24 hrs; c) highly crystalline (11%
amorphous) coating not heat-treated; d) same as c after heat treatment at 1300°C for 24
hrs .................................................................................................................................... 142
Figure 6-3 Microstructure of: a) as-deposited high amorphous coating; b) as-deposited
low amorphous coating; c) high amorphous coating heat-treated at 1300°C/24 hrs; d) low
amorphous coating heat-treated at 1300°C/24 hrs; e) high amorphous coating after
1500°C/5 hrs; f) low amorphous coating after 1500°C/5 hrs ......................................... 144
Figure 6-4 The role of amorphous content on grain size changes during crystallization
heat treatment for a) α-alumina, b) γ-alumina, and c) zirconia ....................................... 147
Figure 6-5 Hardness measures before and after crystallization heat treatment for different
amorphous coatings ........................................................................................................ 149
Figure 6-6 Fracture toughness in coatings with different amorphous content, before and
after heat treatment at 1000°C/12 hrs ............................................................................. 151
Figure 6-7 Brittle fracture of 55% amorphous coating under indentation ...................... 151
Figure 6-8 Erosion losses in two different amorphous coatings before and after heat
treatment at 1000°C/12 hrs and comparison with YSZ coating with the same process . 152
Figure 6-9 Fracture surface of alumina-YSZ coating deposited by SPS process: a) before;
and b) after heat treatment at 1000°C for 10 hours showing annihilation of columns and
sintering of the structure ................................................................................................. 153
Figure 6-10 Comparison of the hardness variation with heat treatment between two
samples with low and high amorphous content and their comparison with the 8 wt% YSZ
......................................................................................................................................... 154
Figure 6-11 The role of amorphous content on fracture toughness before and after heat
treatments at 1300°C/24 hrs and 1500°C/5 hrs ............................................................... 155
Figure 6-12 Thermal conductivity changes before and after heat treatment at 1000°C/10
hrs for coatings with various amorphous contents .......................................................... 158
xv
Figure 6-13 Thermal cyclic test samples after 500 cycles; left sample with 36%
amorphous content, middle sample with 52% amorphous and right sample conventional
YSZ coating .................................................................................................................... 159
Figure 6-14 Oxide layer in top/bond coat interface of a) the porous composite coating
after 20 cycles ................................................................................................................. 160
Figure 6-15 XRD pattern of high amorphous sample (48%): a) before and b) after 500
thermal cycles between room temperature and 1080°C, where C-Z denotes Cubic
Zirconia; t-Z, tetragonal zirconia; AA, α-alumina; GA, γ-alumina and DA, δ-alumina 161
Figure 6-16 High amorphous (52 %) coating of alumina-YSZ composite a) as-deposited
and b) after 500 thermal cycles up to 1080°C ................................................................. 162
Figure A-1 Crystallinity index as a function of either spray condition or composition in
alumina-zirconia composite coating ............................................................................... 193
xvi
List of Tables
Table 3-1 Spray condition for the two types of powders and the resulting particle
condition and coating thicknesses ..................................................................................... 47
Table 4-1 Variables and levels in Taguchi design of experiment ..................................... 66
Table 4-2 Variables evaluated for the effect on phase formation ..................................... 81
Table 5-1 Spray conditions for producing the comparison samples and the resulting
amorphous measurement results ..................................................................................... 104
Table 5-2 The importance of each parameter on the amorphous phase formation within
the alumina-YSZ composite coating using SPS ............................................................. 105
Table 5-3 Powder feed details ......................................................................................... 120
Table 5-4 Spray condition and the resulting amorphous contents .................................. 122
Table 6-1 Role of amorphous content on grain growth during heat treatment ............... 148
Table A-1 SPS spray conditions for the two compositions of alumina-YSZ composite 192
xvii
List of Abbreviations
AHZ Alumina-hardened zirconia
APS Atmospheric plasma spray
CMAS Calcium-magnesium-aluminum-silicon compound
DSC Differential scanning calorimeter
EB-PVD Electron beam-physical vapor deposition
SEM Scanning electron microscope
SPPS Solution precursor plasma spray
SPS Suspension plasma spray
TBC Thermal barrier coating
TGO Thermally grown oxide
XRD X-ray diffraction
YSZ Yttria stabilized zirconia
ZTA Zirconia-toughened alumina
1
Chapter 1 Introduction and Literature Review
Thermal spray processes for coating deposition include the practice of heating and
propelling the molten or heat-softened material toward the substrate at high velocity. The
process results in flattening of the individual splats and their adhesion to the substrate,
and produces the coating [1]. Plasma spray processes are among the most widely used
thermal spray processes in industry. The plasma gun consists of a copper anode and a
tungsten cathode. The electrical potential between the anode and cathode results in severe
ionization of the flowing plasma gas between the two electrodes. This forms a plasma
flame with temperatures of up to 30,000 K, in which the particles of various materials
with any melting point can be melted and accelerated toward the substrate. Such a
process thus suits the deposition of ceramics with a rather high melting point used in
high-temperature applications. Thermal barrier coatings like zirconia, which has a
melting point of about 2700°C, are mostly sprayed with this process.
Thermal barrier coatings (TBCs) have been a key in solving the problem of thermal
stability in high-temperature parts of engines, following three decades of efforts in
improvement of super alloys as the construction material [2]. Thermal stability is
especially critical for parts at high-temperature service with cyclic heat under abrasion,
erosion and, to some extent, corrosive environments, in addition to harmful deposits from
combustion processes. Combustion temperatures in car engines and aerospace gas
2
turbines are limited by the inability of common metallic structural materials to withstand
the high temperatures. The lifetime of blades and vanes, as well as turbine shrouds and
combustor cans, is crucial in performance of the gas turbine engine [3]. These parts have
to be preserved at temperatures roughly above 1000 ºC for as long as possible [4].
Zirconia has been found to be the material most matched with the required characteristics
of a good TBC that include, but are not limited to, high melting point, high thermal, wear
and oxidation resistance, as well as high hardness and fracture toughness and relatively
low density [3]. However, there is a harmful martensitic phase transformation in this
ceramic from tetragonal to monoclinic structure involving about 4% volume expansion
that causes cracking and deterioration of the coating [5,6]. Thus, stabilizing additives
have been used to prevent this unfavourable transformation, normally by formation of
solid solutions [7]. Yttria stabilized zirconia (YSZ) is the most well known solid solution
used as a TBC. Details of the solution forming and other methods of stabilization will be
further explained in this text.
Although application of solution formers is an effective way to achieve stabilization, they
do have some drawbacks. There are two major concerns in this kind of stabilized zirconia
coating. First, the required low thermal conductivity can be achieved only at high
porosity content [8], which in turn adversely affects the mechanical properties such as
hardness [9], erosion [10] or elastic modulus [11]. The second concern is oxygen
diffusion. The elements in solution-forming materials (e.g., yttrium in Y2O3) normally
have lower capacity for oxygen bonding than zirconium, and substitution of these atoms
in the zirconium oxide cells leaves some oxygen vacancy within the unit cell. This
oxygen vacancy tends to enhance the oxygen transparency of the top coat toward the
3
substrate where oxidation of the bond coat in the interface with substrate can happen [12].
This deficiency in yttria-doped zirconia is found to be more severe when the coating is
nano-structured [12], for the reason of enhanced grain boundaries that in this material are
the favoured paths for oxygen diffusion. The oxygen transparency is partly solved by
using the protective bond coat to preserve the substrate from severe oxidation.
Nevertheless, the bond coat itself has many challenges in dealing with diffused oxygen
[13,14] and can result in coating failure due to extensive oxidation of bond coat as will be
explained in section 1.4. Another difficulty facing zirconia as a monolithic top coat is the
elimination of the microstructural defects due to sintering by increasing the service
temperature or heat treatment at high temperature. These processes lead to enhanced
thermal conductivity [15] as well as facilitating catastrophic crack propagation in the
coating [16].
Zirconia in TBC application is an example of durability over performance, meaning that
this material was selected in spite of the existence of other materials with lower thermal
conductivity [17]. However these materials are not able to withstand thermal cycling, or
do not have the high temperature stability as zirconia. Therefore, although the application
of materials such as multiple dopants (solution formers) has succeeded in lowering
thermal conductivity [2,18], the effort to find proper substitutes is continuously in
progress and the present work is in line with this goal.
Graded and composite structures for TBC are among the most used means of meeting the
various needs of a successful TBC system. An important composite under investigation
for replacing the present YSZ TBC is its combination with alumina. Alumina is chosen
4
for a number of reasons that will be detailed later in this thesis. Alumina-YSZ is the
material of interest in this research (section 1.5).
On the other hand, the benefits of the nano-crystalline structure of materials are now well
confirmed [19,20]. Plasma spray processes are among the production practices during
which nano-crystallinity is attainable by extremely high cooling rates of the molten
particles that impact the substrate at high velocities and flatten into thin lamella.
Application of nanometric feed materials is expected to be one of the ways to extend
nano-crystallinity. Nevertheless, the agglomeration of nanometric feed particulates into
large particles introduces difficulties in the injection process.
In the plasma spray process, the particles can be injected into the plasma jet in the form
of either dry powder, or wet condition dissolved or suspended in a liquid carrier.
Suspension plasma spray (SPS) is one of the most recent and innovative plasma spray
processes designed to circumvent the application complexity of nano-size dry feed
stocks. Briefly, it includes application of a carrier suspension liquid for injection of the
solid powders into the plasma jet to produce a nano-structured coating.
Amorphous phase formation is an interesting aspect in thermal spray deposition of
composite materials, and often accompanies nano-crystallinity. It involves several
components that retard each others’ crystallization during rapid solidification and results
in the creation of non-crystalline structures. Consequently, in plasma spray deposition of
the material of concern in this study, i.e., pseudo-eutectic alumina-YSZ composite,
considerable amorphous phase formation is highly probable. Many reports support the
observation of amorphous phase in alumina-YSZ composite deposition [21-24]. It is now
5
well known that the deep eutectic composition of eutectic systems, including the present
system, is more likely to form amorphous phases than other compositions.
This study was organized mainly to investigate amorphous phase formation and its roles
in phase transformations and nano-crystallinity of pseudo-eutectic alumina-YSZ
composite coating deposited by plasma spray process, particularly suspension plasma
spray process. Furthermore, since the material is thought of as a potential TBC, some of
the prominent TBC properties have been investigated and compared with YSZ (the
present TBC material), while trying to understand the role of amorphous phase.
1.1. TBC Coating Processes
There are a great number of methods for coating production. Thermal spray includes a
versatile group of these processes. Montavon in his taxonomy [25] introduces about
twenty different thermal spray methods and techniques. However, for industrial
production of TBCs, the processes most often used are physical vapour deposition
(mainly using electron beam for evaporation of the material concerned) known as EB-
PVD, and thermal spray processes consisting of high velocity oxy-fuel (HVOF) spray and
atmospheric plasma spray (APS). Of these, the APS and EB-PVD processes are the most
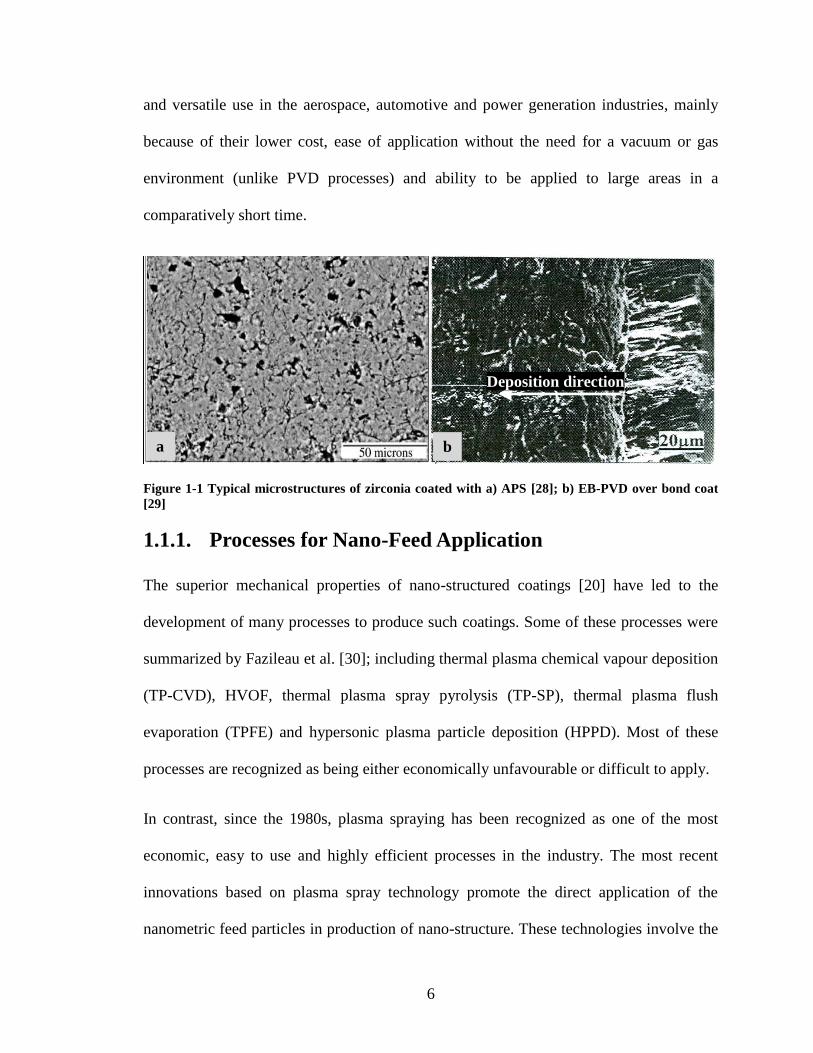
competitive. Typical microstructures of these coatings are shown in Figure 1-1(a) and (b),
respectively.
The APS coatings are more thermal resistant than EB-PVD [17], while the unique comb-
like microstructure of EB-PVD coatings, as shown in Figure 1-1(b), gives them a better
strain tolerance and consequently a longer thermal cyclic life [26]. These coatings,
however, are more expensive than APS [27]. APS processes have attracted more attention
6
and versatile use in the aerospace, automotive and power generation industries, mainly
because of their lower cost, ease of application without the need for a vacuum or gas
environment (unlike PVD processes) and ability to be applied to large areas in a
comparatively short time.
Figure 1-1 Typical microstructures of zirconia coated with a) APS [28]; b) EB-PVD over bond coat
[29]
1.1.1. Processes for Nano-Feed Application
The superior mechanical properties of nano-structured coatings [20] have led to the
development of many processes to produce such coatings. Some of these processes were
summarized by Fazileau et al. [30]; including thermal plasma chemical vapour deposition
(TP-CVD), HVOF, thermal plasma spray pyrolysis (TP-SP), thermal plasma flush
evaporation (TPFE) and hypersonic plasma particle deposition (HPPD). Most of these
processes are recognized as being either economically unfavourable or difficult to apply.
In contrast, since the 1980s, plasma spraying has been recognized as one of the most
economic, easy to use and highly efficient processes in the industry. The most recent
innovations based on plasma spray technology promote the direct application of the
nanometric feed particles in production of nano-structure. These technologies involve the
a b
Deposition direction

7
application of a liquid carrier for transporting the nano – or a few micron – size feed into
the plasma jet. Due to technical difficulties in the transport process of such fine powders,
especially issues with aggregation and clogging, presently the only way to apply powder
feeds of this size range (i.e., <5 µm) is the use of a carrier liquid instead of gas. In
response, two technologies have recently been developed: the solution precursor plasma
spray (SPPS) and suspension plasma spray (SPS) processes. Although it is possible to
apply nano-sized powder accumulated in large agglomerated or spray-dried masses of
nano-particulates by conventional APS [31-33], the liquid-carrier-based techniques are
preferred for producing denser microstructures [34]. Furthermore, these techniques using
extra-small particles can yield thinner lamella with almost no inter-lamellar cracks and
lower residual stresses compared with the large-sized lamella produced in gas carrier
techniques [25]. The liquid carrier processes have been superior to APS process also in
the application of materials prone to decomposition, such as LaMnO3 Perovskite, where
the thermal load imposed on the plasma due to liquid evaporation reduces the plasma
temperature and prevents overheating of the material [35].
In the SPPS technique [36-39], the liquids are salt solutions of the material; in the case of
yttria stabilized zirconia these are zirconium and yttrium salts. In this process, the liquid
precursors have normally been injected radially into the plasma flame. The precursor
droplets, after atomization during injection or in the plasma jet, undergo acceleration,
break-up and rapid liquid evaporation, followed by precipitation, gelation and pyrolysis
in the plasma flame [38]. The accelerated particles in the plasma flow impact the
substrate and incorporate into the coating.
8
The liquid carrier processes of SPS and SPPS are quite similar, with the main difference
appearing in the decomposition of the liquid; in SPS the liquid composition is fixed until
evaporation takes place. Many common features exist in the two processes, including the
formation of very dense microstructures as well as the explosion phenomena. The particle
explosion happens during deposition of porous powders due to entrapped liquid in the
core of the melted particle. It has manifested as shell-like splats in SPPS [20], while the
SPS process is reported to end with smaller particle sizes than expected [40]. SPS, as the
major process used in this study, is discussed in more detail in the following section.
1.1.2. Suspension Plasma Spray
As mentioned earlier, SPS consists of the injection of a liquid carrier containing the
suspended solid powders into the plasma jet. Therefore, particles must be properly
dispersed to provide a stable suspension without excessive agglomeration or settlement,
or both. This is achieved with the help of appropriate dispersant and using milling
processes before and mixing during the injection process to prevent overly enlarged
agglomerates and to break them up if formed.
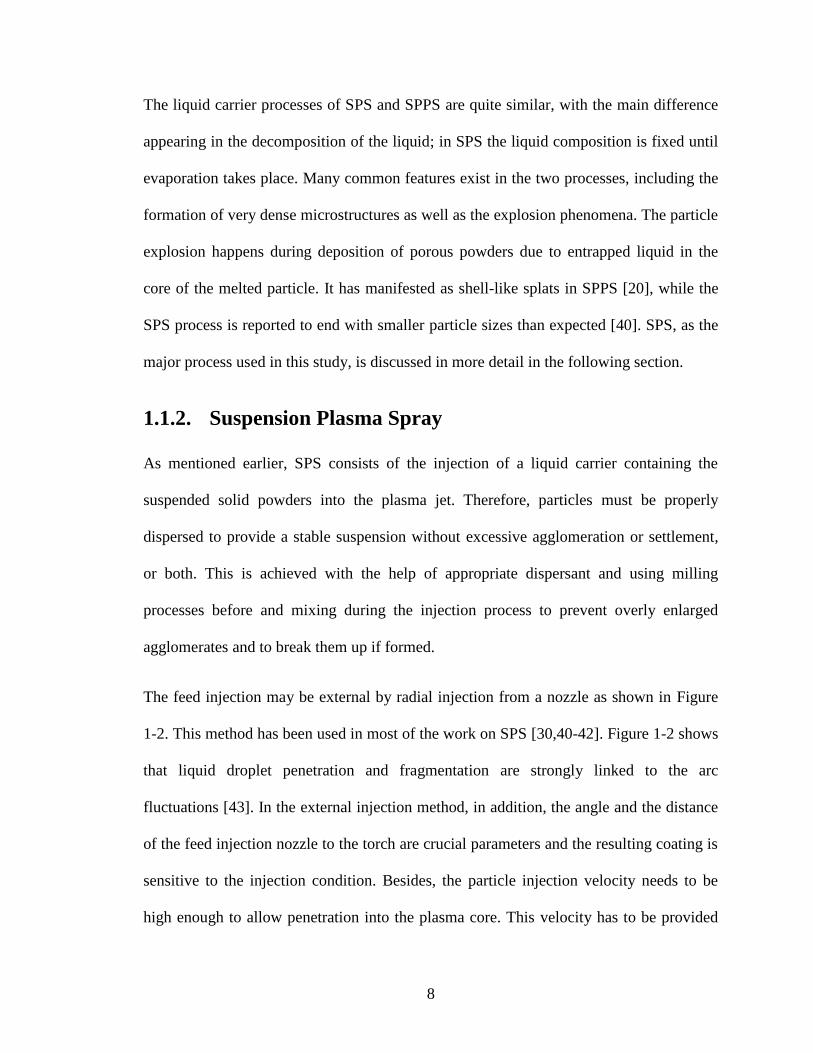
The feed injection may be external by radial injection from a nozzle as shown in Figure
1-2. This method has been used in most of the work on SPS [30,40-42]. Figure 1-2 shows
that liquid droplet penetration and fragmentation are strongly linked to the arc
fluctuations [43]. In the external injection method, in addition, the angle and the distance
of the feed injection nozzle to the torch are crucial parameters and the resulting coating is
sensitive to the injection condition. Besides, the particle injection velocity needs to be
high enough to allow penetration into the plasma core. This velocity has to be provided
9
by high injection gas pressure that can disturb the plasma jet; this factor is of major
importance [44].
Figure 1-2 Radial injection of the liquid carrier into the plasma jet showing the jet fluctuations effect
on the feed penetration into the plasma core [43]
The second injection method consists of axial injection, which is not applicable to the
ordinary plasma spray torches. Axial injection can be used with specific designs of
torches such as hollow cathode radio frequency plasma in which the hollow core of the
torch allows the passage of the liquid injection tube [45]. One of the recent technologies
(used in the Industrial Material Institute of the National Research Council of Canada in
Boucherville, Quebec) uses a Mettech axial III torch plasma system in which three
torches converge at a focal point where the liquid feed is axially emerging at high
pressure. This system will be discussed in more detail in Chapter 2, because it is the one
used in this study.
The spray distance in SPS process has to be rather short, since the feed particle sizes in
SPS are much smaller than those used in APS and can lose their absorbed heat and
momentum more rapidly [45]. The optimum spray distance (from the spray nozzle exit to
the substrate) was found to be between 40-60 mm for efficient interaction between the
10
particle and plasma where melting is completed and in-flight solidification does not
happen [40]. The interaction between the particle and the plasma flame is also affected by
the droplet size that is injected into the plasma flow. Thus the atomization of liquid
droplets can be important for the resulting coatings and spray outcomes.
There are two atomization methods during liquid injection into plasma flame. The first is
air- (or gas-) assisted atomization that, according to Jordan et al. [46], using an argon
flow in the atomizing probe can produce droplets of 20 to 45 µm. This kind of
atomization mixes the air or gas with the liquid before the injection nozzle exit and the
gas expansion upon emerging from the nozzle results in fragmentation of the liquid
droplets into smaller ones. This method tends to require a high gas pressure and
introduces some difficulties when used with conventional plasma spray, since the method
involves external injection and such high gas pressure can end up with strong
perturbation of the plasma jet. Gas-assisted atomization seems more appropriate when the
gun design allows the use of axial injection, as does the gun used in this study, Mettech
axial III. In this gun, based on the orientation of the three plasma torches that leave a
hollow core in the center, axial injection is possible. The geometry of the Mettech axial
III gun will be discussed further in Chapter 2.
The second atomization method is direct liquid injection, which is more appropriate for
conventional plasma process to avoid disruption of the flame. This injection employs a
high back pressure to the liquid container to expel the liquid from the exit point with
small droplet size. Using this method, Wittmann et al. [47] could force the water droplets
with pressures below 0.8 MPa to form in dimensions of about 200 µm at a distance of 15
mm from the injection nozzle exit. They found a droplet velocity of 15 to 25 m/s
11
adequate for penetration into the plasma core. In continuation of the same study, using
ethanol suspension the droplets were found to be further fragmented (i.e., secondary
atomization) into dimensions of a few micrometers because of the effect of the plasma
jet. Secondary atomization by plasma jet was also reported by Fauchais et al.[48], where
droplets of YSZ suspension with dimensions of a few hundred micrometers were
fragmented into droplets 0.5 to 5 µm in diameter. In this work both methods, i.e., direct
injection and gas-assisted atomization, were applied and the result of the particle
interaction with the plasma jet was scrutinized using the collected sprayed powders and
coatings.
1.2. Particle Interaction with Plasma Jet
The interaction between the in-flight particle and the plasma jet has a direct effect on the
quality of the resulting coatings. Since the characteristic heat and momentum transfer to
the particles are directly linked to the mass of the particles, Fauchais et al. [48] addressed
the importance of the particle size on its complete melting. According to them, the small
submicron particles are more sensitive than large particles to the plasma arc fluctuations.
This causes their irregular treatment (variation in heating and acceleration), and
drastically affects the coating quality in this process where small particles are involved.
Delbos et al. [49] also reported that uneven size distribution is an important reason for
non-uniform treatment of the particles [49]. Particles in the powders have a wide size
range, and accordingly receive different thermal treatment by the plasma. This situation is
intensified when dealing with materials of low thermal conductivity such as zirconia or
alumina ceramics [50]. Material with low thermal conductivity requires longer time for
12
complete melting throughout the particle bulk. It may seem that for small particles this
should not be an issue. However, it was noticed that even when correctly injected into the
plasma core, the small particles can escape from the core and travel in the cold fringes of
the flame [40], thus receiving less heat for thorough melting.
In addition, plasma fluctuations are known to be a major reason for broad diversity in
particle temperature and velocity. In APS, it is possible that these fluctuations vary the
temperature and velocity of alumina particles by 600°C and 200 m/s and of zirconia
particles by 400°C and 60 m/s, respectively [51]. Such evaluation for individual in-flight
nano-particles currently is not possible by the present diagnostic systems. However, it
may be expected that smaller particles and/or low density (porous particles) with low
mass or mass density are more severely affected by these fluctuations. The in-flight
particle velocity and temperature can also affect the composition distribution of the
resulting coatings. It was suggested that longer dwelling time in the plasma flame results
in increased alloying in Hydroxiapotaite (Ca10 (PO4)6(OH)2) and Al-Ni-Mo alloys [52].
1.3. TBC System and Materials
A TBC system as schematically shown in Figure 1-3 consists of three main components.
The first two of these are a top coat as the thermal barrier, and a bond coat that reduces
the thermal expansion mismatch between the substrate and top coat and has a good
adhesion to the substrate. The common materials for bond coat are MCrAlY alloy, in
which M is one of the Co or Ni metals, and Pt-aluminide [17]. The bond coat, containing
aluminium element, is also the source of material for environmental protective aluminium
oxide. The aluminium oxide layer is the main constituent of the third component in a
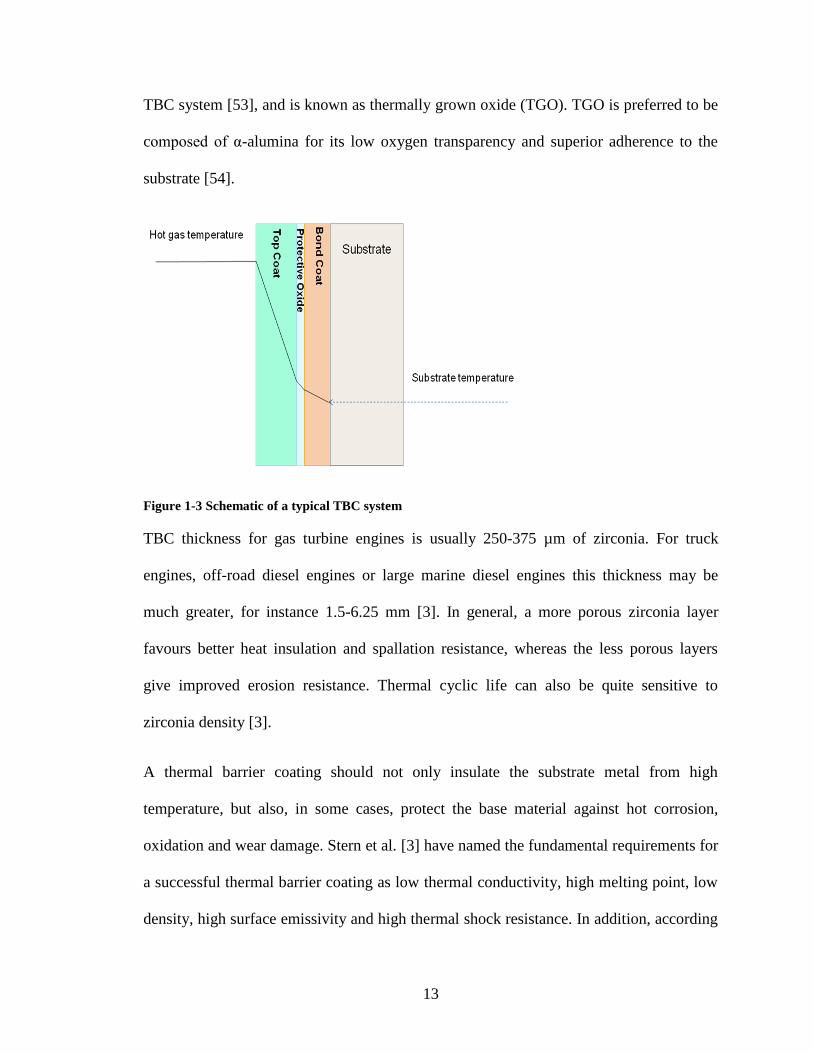
13
TBC system [53], and is known as thermally grown oxide (TGO). TGO is preferred to be
composed of α-alumina for its low oxygen transparency and superior adherence to the
substrate [54].
Figure 1-3 Schematic of a typical TBC system
TBC thickness for gas turbine engines is usually 250-375 µm of zirconia. For truck
engines, off-road diesel engines or large marine diesel engines this thickness may be
much greater, for instance 1.5-6.25 mm [3]. In general, a more porous zirconia layer
favours better heat insulation and spallation resistance, whereas the less porous layers
give improved erosion resistance. Thermal cyclic life can also be quite sensitive to
zirconia density [3].
A thermal barrier coating should not only insulate the substrate metal from high
temperature, but also, in some cases, protect the base material against hot corrosion,
oxidation and wear damage. Stern et al. [3] have named the fundamental requirements for
a successful thermal barrier coating as low thermal conductivity, high melting point, low
density, high surface emissivity and high thermal shock resistance. In addition, according

14
to Stern et al., resistance to oxidation and corrosion, high coefficient of thermal
expansion, and resistance to gaseous and particulate erosion are other characteristics for a
favourable TBC. Further characteristics of an ideal TBC that can be added to these are
being preventive to corrosives and oxygen diffusion, and resistant to the diffusion of fuel
combustion and corrosion deposits.
The success of zirconia as a thermal barrier coating is due to its properties being
relatively well compromised for the requirements of a TBC. These properties, measured
against the requirements mentioned for a favourable TBC, have made zirconia the first
choice for TBC coating. However, several other materials have been examined for this
application. Ma et al. [39] listed some of them as zirconium phosphate and zirconates
with a perovskite structure (such as SrZrO3, BaZrO3) or a fluorite structure (La2Zr2O7,
Nd2Zr2O7), and yttria-alumina garnet based ceramics (such as Y3Al5O12, Y3Fe5O12,
Y3Al0.7Fe4.3O12). Nonetheless, these have not been as efficient, long lasting or easy to
apply as zirconia, although some of them have been used by some manufacturers [39].
As mentioned before, the effective performance of zirconia TBC is strongly affected by
its phase transformation from tetragonal to monoclinic. Undoped zirconia goes through
the following phase transformations by heating up to temperatures that are not in a
complete consistency in different references. Monoclinic zirconia transforms to
tetragonal at 1114-1180°C [55-58] and the transformation of tetragonal to cubic happens
at around 2370°C, finally melting at 2710°C [58]. Tetragonal to monoclinic phase
transformation of zirconia happens during a martensitic transformation with almost 4%
volume expansion [3] and causes the deterioration of the coating properties by increasing
the residual stresses and crack formation.
15
Three different forms of tetragonal zirconia (t, t’, t”) have been discussed by Yashima et
al. [58]. These authors have resolved some ambiguities in the changes of the unit cell
parameter of tetragonal zirconium oxide, which was previously considered a cubic
structure. The tetragonal phases t and t’ (t’ is called non-transformable tetragonal
zirconia) are mostly followed and reported in different works, whereas for the t”
tetragonal no report was found to show different characteristics from the two other
tetragonal phases. The t” phase is also categorized as cubic structure [59], and in this
study this designation is followed. A great number of efforts have focused on prevention
of the tetragonal to monoclinic transformation. Solutions to this problem can be
categorized in the following three groups:
a) Solid solution stabilization by substituting for some of the Zr atoms the base element
of oxides of alkali metal atoms like CaO, MgO or transient metals as in Y2O3, Sc2O3,
Er2O3 [58] or rare-earths such as CeO, Yb2O3 and or the whole Lanthanides group [17] in
the oxide cells. The stabilizing effect and thermal resistance increase with increasing the
amount of solution former [7]. Figure 1-4 demonstrates the general equilibrium phase
diagram for solution-former oxides in zirconia. It shows that at higher amounts of metal
oxides, the high-temperature cubic structure is stabilized at ambient temperature. Zirconia
stabilized with various amounts of yttria is the most applied TBC, and hence is known as
YSZ.

16
Figure 1-4 The general phase diagram for solution stabilizer metal oxides in zirconia [55]
b) Grain size controlled stabilization may be explained based on the calculations by
Garvie [5] and followed by the experimental works reported in [56,60], it was revealed
that the prerequisite for tetragonal to monoclinic transformation of zirconia at any
specific temperature is a grain growth to a critical size; at smaller grain sizes, the
transformation from tetragonal to monoclinic (t-m) is prohibited. Thus, for (t-m) phase
transformation control, it is enough to control the grain size. Controlling the dimension to
prohibit the (t-m) transformation was used in the graded layer of the alumina/zirconia
coating system [57,61]. In this system, the layers of alumina, between the zirconia nano-
layers (less than 23 nm), served as the termination surface for the zirconia crystallites and
could eliminate the (t-m) transformation [60].
c) Insoluble oxide stabilization with a material like alumina (Al2O3) is another solution
for preventing the unfavourable transformation of zirconia. Alumina can form a rigid
matrix around the ZrO2 crystals and impose a compressive stress against the expansion
17
involved in the martensitic transformation of tetragonal to monoclinic, thus preventing
the autocatalytic reaction by volume change control [6].
In addition to stabilization for higher quality of the coatings, the study of the failure
mechanisms in TBC systems helps selection of more appropriate materials for this
application.
1.4. Failure Mechanisms of TBCs
TBCs are used in two major domains: a) power generation plants where there is high
temperature but minimum thermal cycles; and b) aero engines where extensive thermal
cycling exists [27]. In each of these applications, Evans et al. [27] have extensively
discussed the mechanisms of failure. Based on their discussion, excessive TGO growth
has a prominent role on the lifetime of TBCs. In addition, Schlichting et al. [62] suggest a
simple failure model based on the crack formation and growth in TGO, in which
thickening of the TGO layer is known as “the key progressive process responsible for
failure.” According to Schlichting et al. [62], thermal expansion mismatch and elastic
modulus mismatch between the thick TGO and the bond or top coat results in cracking.
The cracks at the bond/top coat interface with TGO at undulation crests formed due to
out-of-plane tensile stresses that arise from the compressed TGO that continues
thickening. Thus top coat materials with more resistance to oxygen diffusion can be
beneficial to a longer lasting TBC system.
A second major source of failure of the TBCs is produced during operation. Calcia,
magnesia, alumina and silica are combustion products of gas turbine engines where TBCs
are applied. When present, at high temperatures these products form a compound referred
18
to as CMAS. They can form a eutectic of low melting temperature of about 1190°C [63]
or 1240°C [64]. Upon formation at high-temperature service conditions, they are
amorphous. The CMAS melt infiltrates into the vertical asperities of comb-like EB-PVD
microstructure, and after solidification, forms a solid with a large thermal-expansion
mismatch with the TBC. This leads to formation of large horizontal cracks in the TBC
and delamination of the system during service. Higher concentrations of alumina increase
the melting point and, consequently, the higher viscosity of the mixture. The result is a
lower infiltration capability of the CMAS melt into the coating, which in turn means a
lower depth of penetration. It should be noted that for the CMAS to end up with coating
spallation, a minimum depth of penetration is required for the stresses originated from
CMAS to result in crack formation and propagation [65].
Efforts in producing dense vertically cracked (DVC) structures in plasma sprayed
coatings are currently in progress [64,65]. DVCs in the APS coatings are intended to
produce a segmented structure, similar to the comb-like grains in EB-PVD coatings, to
increase the strain tolerance of these coatings. It can be concluded that in the same way,
CMAS can be a danger for vertical cracks in plasma sprayed coatings. Using alumina in
the coating is expected to help overcoming this problem.
Graded layer and composite materials were previously listed among the structures that
could lead to superior TBCs with better performance and longer lifetime. However,
because of the importance of these coatings in this research, the discussion of these
structures was reserved until after the details given above.
19
1.5. Graded and Composite Coatings of Zirconia-
Alumina
The requirements of a TBC material, as listed earlier, are so versatile that it seems quite
unlikely to find them all in one single material. Therefore, the idea of multilayer and/or
composite coatings became the subject of many investigations [38,66-68]. Alumina for
several reasons is widely used as the alternative layer in the graded and/or composite
structures with zirconia that are mentioned below.
Graded and composite alumina with yttria-stabilized zirconia (alumina-YSZ) has shown
the capability of larger temperature drop in the substrate from the coating surface and
superior thermal shock resistance than YSZ [67]. Moreover, composites of alumina with
zirconia possess lower residual stress [69], higher hardness, lower porosity and improved
adhesion [70]. Other reasons may be summarized as follows.
Alumina acts as the stabilizer for tetragonal zirconia by two mechanisms: grain-size
control in nano-structure coatings by virtue of its higher elastic modulus than zirconia;
and solid solution formation [56]. By playing the stabilizer role, it allows the use of lower
amounts of other stabilizers and thus may reduce their harmful effects, such as oxygen
diffusion. Alumina presents higher resistance to oxygen diffusion than does zirconia [70].
Hence, it lowers the transparency of the whole coating, resulting in controlled growth of
TGO and other unwanted oxides [14]. It also improves the resistance of the coating
against the damaging effects of CMAS [39] according to the above details. In addition,
the detrimental effects of sintering of the zirconia at high temperatures (e.g., enhanced
thermal conductivity) can be eliminated by nano-laminates of alumina [61,71]. Finally,
20
alumina can prevent the diffusion of harmful elements like sulfur from the bond coat or
substrate into the top coat [14].
Furthermore, alumina-YSZ composite has shown the potential of some degree of
amorphous phase formation [33,72,73]. It is expected that upon appropriate heat
treatment, crystallization of one phase (e.g., alumina or zirconia) and precipitation of the
additionally dissolved proportion of the other component from the amorphous state
happens. This means that the amorphous phase transforms into a combined
microstructure of alumina matrix with zirconia precipitates (i.e. alumina-hardened
zirconia (AHZ)) and zirconia matrix with alumina precipitates (i.e. zirconia-toughened
alumina (ZTA)). Hence, one purpose of this work is to produce a combined structure that
benefits from the properties of both. Thus, knowledge of the possible phases for each
component of the composite that form during heating is beneficial. The structures of
zirconia having previously been discussed, here the stable phases of alumina at different
temperatures will be reviewed.
Alumina has been found in several crystallographic forms. The major forms are γ, δ, θ
and α-alumina [74]. The phases γ, δ and θ-alumina are the metastable phases and are
called transient phases before the crystallization of the stable α-alumina phase takes
place. γ-alumina has a cubic structure, where the anion oxygen atoms occupy the atomic
sites and aluminium cations are distributed in octahedral and tetrahedral interstices. The
α-alumina has a hexagonal close-packed (HCP) structure; and the transient phases δ and θ
show an orthorhombic and β-Ge2O3 structure type, respectively [75]. The θ-phase has
also been known as monoclinic structure [76].The sequence of phase transformations
starting from γ has been reported as γ to δ at 850°C, δ to θ at 1100°C and finally θ to α at
21
above 1200°C [74,77]. In thermal spray coatings, the as-deposited structures have been in
form of either γ or α phase. In addition, the transformation upon heat treatment beyond
the transformation temperature was reported to be directly from γ to α, without
intermediate phase formation [44].
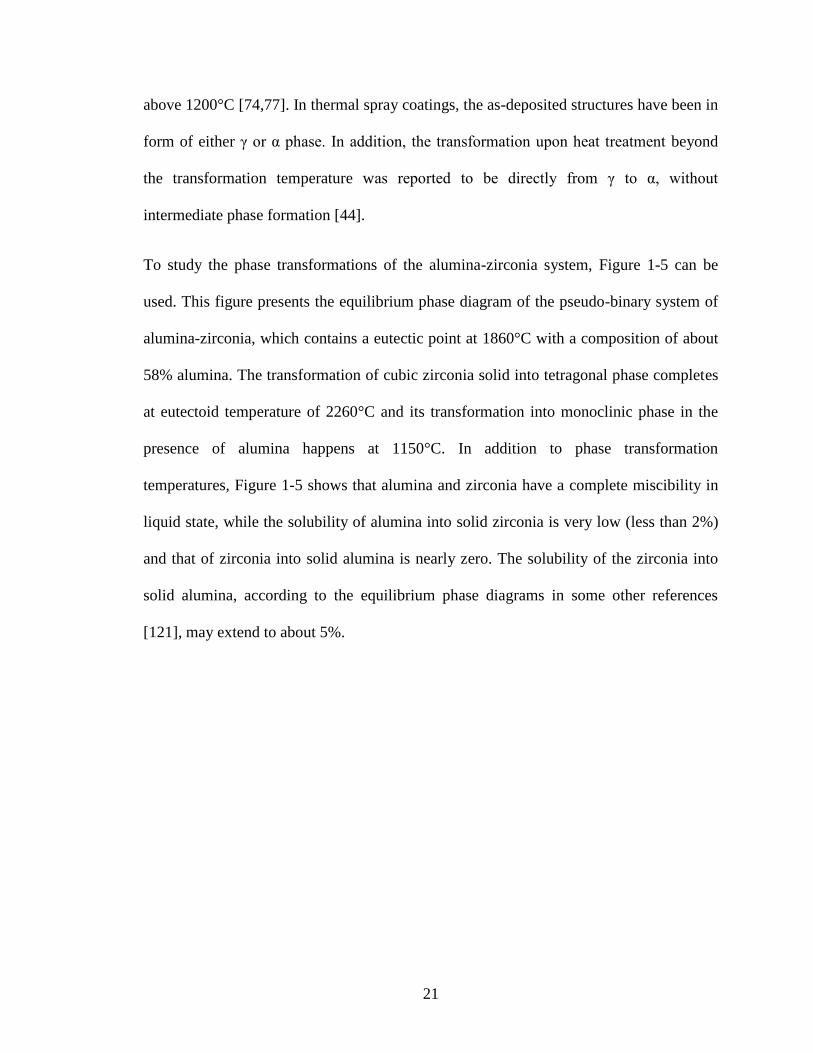
To study the phase transformations of the alumina-zirconia system, Figure 1-5 can be
used. This figure presents the equilibrium phase diagram of the pseudo-binary system of
alumina-zirconia, which contains a eutectic point at 1860°C with a composition of about
58% alumina. The transformation of cubic zirconia solid into tetragonal phase completes
at eutectoid temperature of 2260°C and its transformation into monoclinic phase in the
presence of alumina happens at 1150°C. In addition to phase transformation
temperatures, Figure 1-5 shows that alumina and zirconia have a complete miscibility in
liquid state, while the solubility of alumina into solid zirconia is very low (less than 2%)
and that of zirconia into solid alumina is nearly zero. The solubility of the zirconia into
solid alumina, according to the equilibrium phase diagrams in some other references
[121], may extend to about 5%.
22
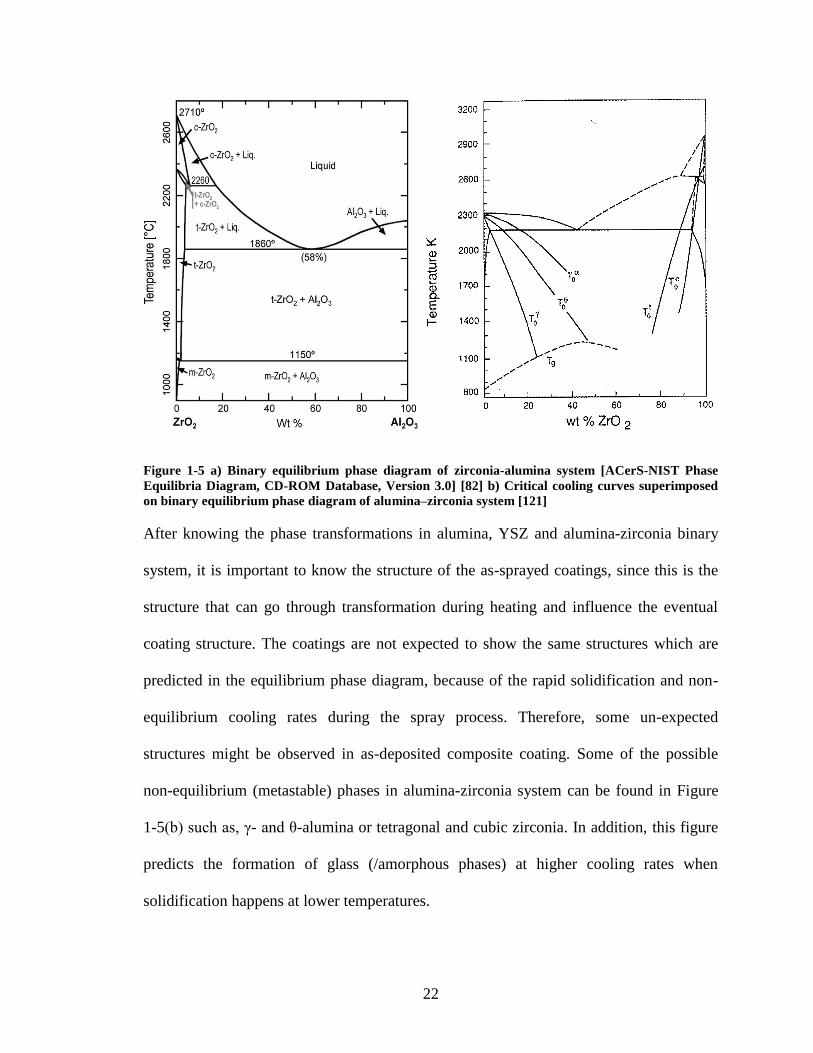
Figure 1-5 a) Binary equilibrium phase diagram of zirconia-alumina system [ACerS-NIST Phase
Equilibria Diagram, CD-ROM Database, Version 3.0] [82] b) Critical cooling curves superimposed
on binary equilibrium phase diagram of alumina–zirconia system [121]
After knowing the phase transformations in alumina, YSZ and alumina-zirconia binary
system, it is important to know the structure of the as-sprayed coatings, since this is the
structure that can go through transformation during heating and influence the eventual
coating structure. The coatings are not expected to show the same structures which are
predicted in the equilibrium phase diagram, because of the rapid solidification and non-
equilibrium cooling rates during the spray process. Therefore, some un-expected
structures might be observed in as-deposited composite coating. Some of the possible
non-equilibrium (metastable) phases in alumina-zirconia system can be found in Figure
1-5(b) such as, γ- and θ-alumina or tetragonal and cubic zirconia. In addition, this figure
predicts the formation of glass (/amorphous phases) at higher cooling rates when
solidification happens at lower temperatures.
23
The formation of such phases (such as solid solution of zirconia or alumina with
extensive solubility of the other constituent in solid state) is reported in this work.
1.5.1. As Sprayed YSZ, Alumina and Alumina-Zirconia
Composite Coatings
According to the literature [44,54,68,78], as-deposited YSZ coating, applied by APS
process, shows mainly tetragonal along with some cubic structure. Alumina, on the other
hand, presents a cubic γ-crystal structure regardless of the plasma spray technique and
powder feed size. Nonetheless, some reports show that application of nano-powder feed
can end up with mainly hexagonal α-structure in conventional plasma spray [32].
During the spray process of alumina-YSZ composite coatings, the splats may be found in
at least three conditions: splats formed of unmelted or partially melted feed particles;
splats consisting of melted particles of either alumina or YSZ without mixing; or blended
splats composed of melted and mixed alumina-YSZ. The unmelted particles in the
coating may preserve the crystalline structure of the feed materials. Using APS process,
the melted particles of unmixed alumina or zirconia in the coatings transform into
structures almost the same as those described above, which means that zirconia in the
composite coating is reported to change from mainly monoclinic to larger amounts of
tetragonal, and the alumina appears as γ or δ-phase (that is, the transient phase before α-
alumina forms out of γ) [79]. In addition, in quench-assisted APS coating the zirconia
forms tetragonal along with cubic structure, while alumina is not observed in the XRD
pattern [80]. Liquid injection processes, on the other hand, have presented mainly
24
tetragonal plus some cubic crystalline YSZ and γ-alumina [34,70,72,73,81]. The blended
splats are strongly prone to amorphous phase formation [81,82].
1.5.2. Amorphous Phase in Alumina-Zirconia Composite
Coating
Formation of non-crystalline phases is a notable feature of the as-deposited structure in
composite materials such as alumina-zirconia. These phases, as mostly inseparable part of
as-sprayed coatings have not been well considered. Amorphous structure is normally
formed as a result of rapid solidification. Kim et al. [24], for the splat cooling rate in
atmospheric plasma spray process, refer to an about 106
K/s, based on heat transfer
calculations. On the other hand, the experimental results by Fauchais et al. [83] suggest a
cooling rate of (100 to 600)106
K/s, which is more than two orders of magnitude
higher. At such high cooling rates the chances for ordering into crystalline structure
during solidification from the melt are greatly reduced. In composite systems with low
solubility such as the current system, this effect is more severe, because of a large atomic
number (size) difference between Al and Zr, so that there are reports of almost fully
amorphous coating during APS deposition of alumina-stabilized zirconia composite
powders [24,82].
Kim et al. [24] sprayed alumina-zirconia with 42 wt% ZrO2 stabilized with 2.3 wt% TiO2
and 58wt% Al2O3 by APS using micron-size powder and obtained a fully amorphous
coating. Sodeoka [33] reported the presence of the amorphous phase in 50/50 volume
ratio of alumina/3YSZ (zirconia stabilized with 3 mol% yttria) spray dried nano-powders
coated using the same process (APS). Alexander et al. [72] stated the same observation in
25
the SPPS composite coating of alumina-zirconia in either binary composite [73] or
ternary with yttria [72], both with 10 and 20 mol% of alumina. They could observe the
amorphous phase through transmission electron microscopy studies. Oberste-Berghaus et
al. [81] sprayed both nano-powder and some comparatively larger particles (a few
micron) of alumina-zirconia (zirconia was stabilized with 8 wt% yttria) using SPS
process. They went farther and calculated the amorphous content based on the XRD
pattern measurements. SPS coating of the nano-particles presented no amorphous phase,
while the amount of this phase for the larger particles was as high as 55 vol%.
These studies revealed some trends for the possible sources of amorphous phase
formation in various processes. However, for each specific process the factors leading to
amorphous phase formation have to be determined. Therefore, one goal of this study is to
investigate the parameters of the feed, system and substrate in SPS process that can
effectively vary the amorphous content in the resulting coating.
1.5.3. Thermal Changes of Alumina-Zirconia Composite
Coatings
Considering the high-temperature application of the TBC coatings, investigation of the
as-deposited coatings characteristics may not be enough for evaluating the coating
effectiveness [38]. This is because during the first service operation the as-deposited
phases and the microstructural features (porosity, crack, inter-splat bonds, etc.) may
undergo many changes. Such changes can severely affect thermal and mechanical
properties during the next service operation.
26
YSZ [78,84], alumina [21,22,44,68] and their composite (alumina-zirconia) [24,70,85,86]
have all been extensively investigated for crystalline and microstructural changes upon
heat treatment, in addition to thermal cycling [84]. A summary of those results follows. In
the experiment done by Sodeoka et al. [33] with 50/50 volume ratio of alumina/3YSZ
after heat treatment at 1000°C for only 30 minutes the crystallization of the amorphous
phase was completed. However, no further phase transformation from (γ-alumina + t’-
zirconia) happened, even after 100 hours at 1500°C. By contrast, Chen et al. [78], in
plasma sprayed crystalline γ-alumina, observed the phase transformation into α-alumina
after half an hour at 1200°C. Moreover, Damani et al. [48] reported almost the same
temperature for this transformation that means a heat treatment at 1180°C, for 12 hours.
Nazeri et al. [86], in fully amorphous alumina/pure zirconia composite deposited by sol-
gel process, reported the appearance of crystalline cubic phase of zirconia at 600°C.
Nevertheless, up to 1100°C (which was the maximum temperature in this experiment) no
crystalline alumina showed up and the transformation from cubic to monoclinic phase
started at 900°C (noticing that the zirconia was not stabilized).
In a part of their experiment, Kirsch et al. [87] studied the performance of amorphous
alumina shell over zirconia nano-powders. The powders were heated, and while using in-
situ X-ray diffraction the structural changes were monitored. When the powder consisted
of amorphous zirconia within the amorphous alumina shell, the crystallization of cubic
zirconia started at 700°C, transformation to tetragonal seemed to be at 950°C, and the
monoclinic phase appeared at 1100°C. Nevertheless, since the maximum temperature in
this study was 1100°C, the crystallization of alumina did not happen. On the other hand,
starting with the tetragonal crystalline zirconia powder in the same shell of amorphous
27
alumina phase, the only observed transformation was the γ-alumina crystalline phase
formation out of the amorphous shell; no phase change in zirconia was distinguished. In
contrast to the above studies, Kim et al. [24], in Al2O3 / 2.3 wt% TiO2-stabilized zirconia,
reported the simultaneous crystallization of both alumina and zirconia at 945~946°C.
It can be seen that few of these investigations share the same transformation
temperatures. No work was found, to the knowledge of the writer, to explain the possible
reasons for these discrepancies in transformation temperatures. However, Kim et al. in
1999 [24] and Kirsch in 2004 [87] predicted that the apparent contradictions in the
literature about the crystallization temperature of the amorphous phase in alumina-
zirconia are based on the different amounts of this phase within the structure. However,
no effort has been since made to investigate the ways that this content (if any) may affect
the crystallization temperature and whether this can affect other transformation
temperatures and possibly the resulting crystal structures. Therefore, an objective of this
study was to find the way(s) in which the amount of the amorphous phase may affect the
crystallization, the following phase transformation temperatures and the consequent
crystal structures.
1.6. Objectives
Based on the above-mentioned details, the objectives of this project can be summarized
as:
1) To enable the control of the coating microstructure by identification of influential
parameters on microstructural features of the composite coating using the new
technology of suspension plasma spray (SPS) with Mettech axial III torch;
28
2) To pursue larger amounts of amorphous formation or manipulate the amorphous
content through parametric studies of the process as well as investigation of the
sources for crystalline and amorphous phase in the composite material;
3) To determine the possible roles of the amorphous phase on the crystallization
temperature and consequent transformation temperatures;
4) To investigate the changes in thermal and mechanical properties during heat treatment
of the composite coating with focus on the roles of the amorphous phase;
5) To produce a new composite of alumina hardened zirconia (AHZ) and zirconia
toughened alumina (ZTA) with nano-grains out of amorphous structure. Such
composite structure may present the benefits of both structures.
Accordingly, this thesis started with chapter 1 containing background knowledge and the
motivations for this research. In chapter 2 the general experimental procedures for tests,
monitoring and measurement techniques are explained. Chapter 3 covers APS deposition
of the composite to verify which powder size can produce higher amorphous content and
to justify the use of nano-powder feed and involvement of SPS process. Some insights
into the main sources of amorphous and crystalline phases in spraying the large and small
particles have opened the way for production of larger amounts of amorphous phase.
Chapter 4 considers the suspension plasma sprayed coatings and in-flight particles. It
starts with determining the role of different process parameters in the newly developed
system of deposition with suspension plasma spray and provides an efficient set of tools
(parameters) for managing the coating microstructure. This chapter then presents the
study of the crystalline phases formed in the alumina-YSZ composite coating under
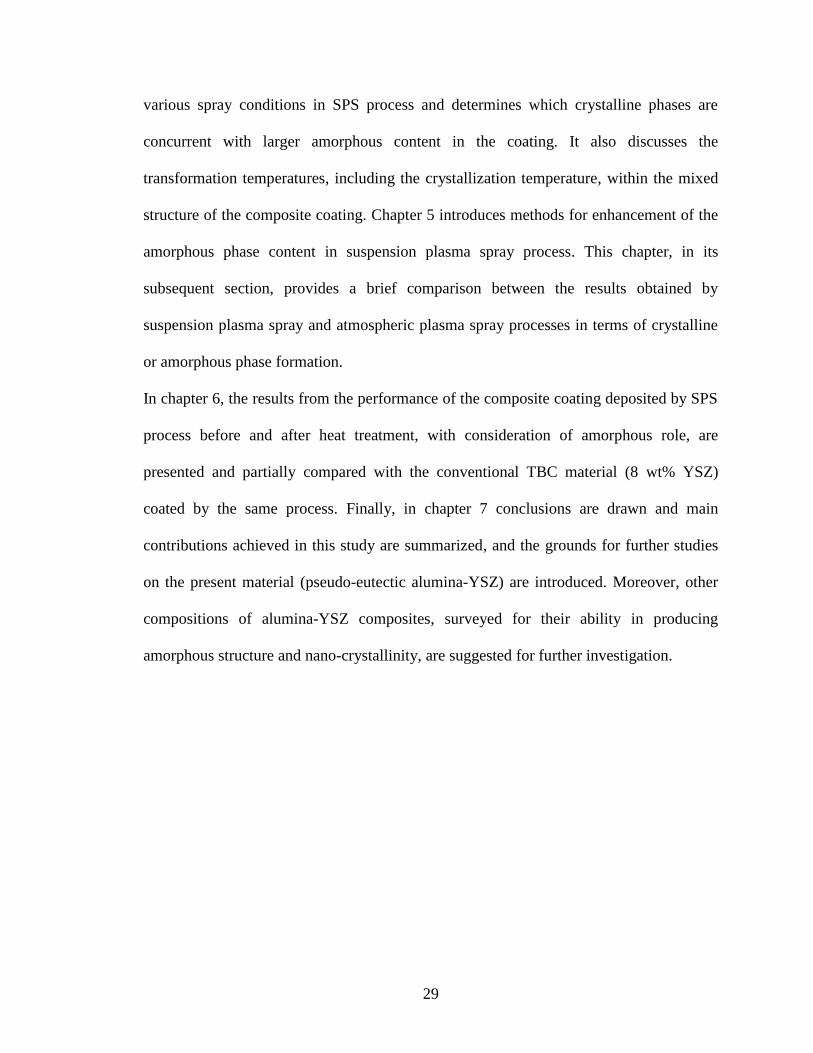
29
various spray conditions in SPS process and determines which crystalline phases are
concurrent with larger amorphous content in the coating. It also discusses the
transformation temperatures, including the crystallization temperature, within the mixed
structure of the composite coating. Chapter 5 introduces methods for enhancement of the
amorphous phase content in suspension plasma spray process. This chapter, in its
subsequent section, provides a brief comparison between the results obtained by
suspension plasma spray and atmospheric plasma spray processes in terms of crystalline
or amorphous phase formation.
In chapter 6, the results from the performance of the composite coating deposited by SPS
process before and after heat treatment, with consideration of amorphous role, are
presented and partially compared with the conventional TBC material (8 wt% YSZ)
coated by the same process. Finally, in chapter 7 conclusions are drawn and main
contributions achieved in this study are summarized, and the grounds for further studies
on the present material (pseudo-eutectic alumina-YSZ) are introduced. Moreover, other
compositions of alumina-YSZ composites, surveyed for their ability in producing
amorphous structure and nano-crystallinity, are suggested for further investigation.
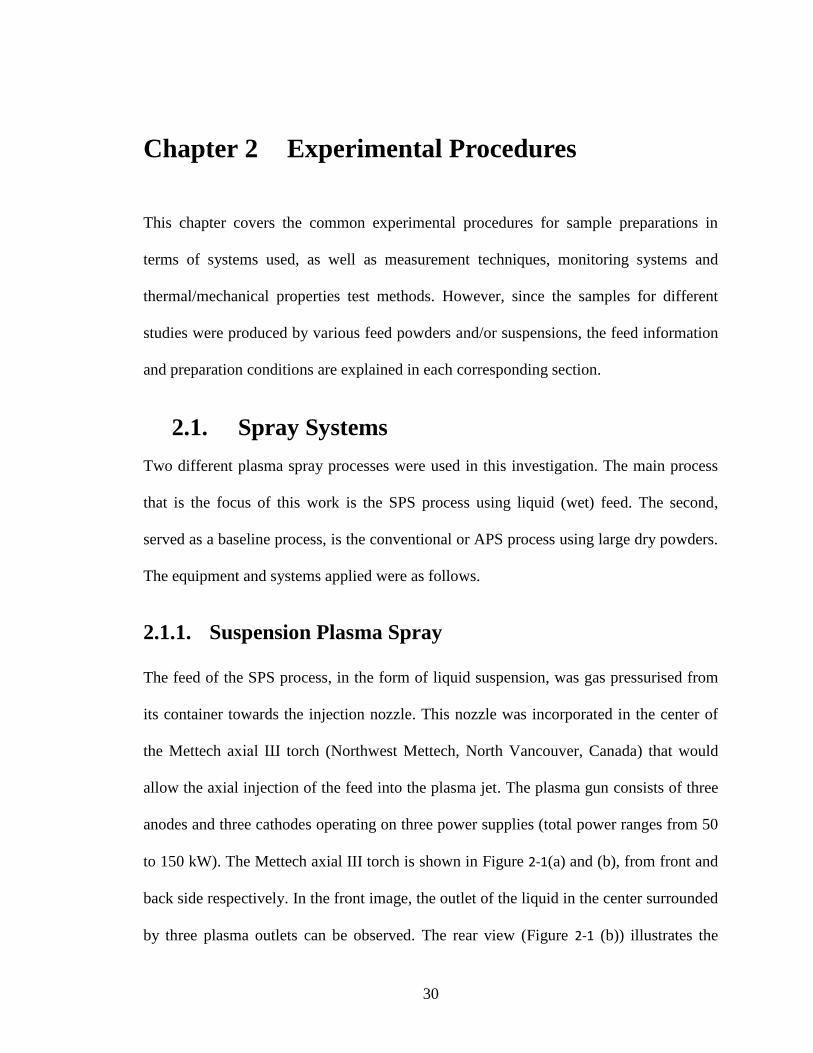
30
Chapter 2 Experimental Procedures
This chapter covers the common experimental procedures for sample preparations in
terms of systems used, as well as measurement techniques, monitoring systems and
thermal/mechanical properties test methods. However, since the samples for different
studies were produced by various feed powders and/or suspensions, the feed information
and preparation conditions are explained in each corresponding section.
2.1. Spray Systems
Two different plasma spray processes were used in this investigation. The main process
that is the focus of this work is the SPS process using liquid (wet) feed. The second,
served as a baseline process, is the conventional or APS process using large dry powders.
The equipment and systems applied were as follows.
2.1.1. Suspension Plasma Spray
The feed of the SPS process, in the form of liquid suspension, was gas pressurised from
its container towards the injection nozzle. This nozzle was incorporated in the center of
the Mettech axial Ш torch (Northwest Mettech, North Vancouver, Canada) that would
allow the axial injection of the feed into the plasma jet. The plasma gun consists of three
anodes and three cathodes operating on three power supplies (total power ranges from 50
to 150 kW). The Mettech axial III torch is shown in Figure 2-1(a) and (b), from front and
back side respectively. In the front image, the outlet of the liquid in the center surrounded
by three plasma outlets can be observed. The rear view (Figure 2-1 (b)) illustrates the
31
inlet of the suspension liquid and atomizing gas in the center, encircled by the three
plasma gas inlets.
Figure 2-1 Mettech axial III plasma torch; (a) front and (b) rear view of the combined injection
nozzle and the three plasma torches in axial III system
The liquid is gas pressurized into the nozzle, where it atomizes by either the plasma
outside the liquid injector (in the center of the nozzle) or by an atomizing gas. In the latter
case a thinner tube passes in the center of the liquid injector and carries the atomizing
gas. The liquid flow rate is controlled by computer, so that the gas pressure automatically
varies based on the specified liquid flow rate to keep it constant. A simplified
arrangement of the system is shown in Figure 2-2.
The spray distance was fixed at 50 mm from the nozzle exit in all experiments.
Deposition passes had a 3 mm overlap. A cooling procedure was used to prevent
overheating the substrate; this was especially necessary because of the short spray
distance of the torch. The elements of the cooling process included front air pressure,
nitrogen gas pressure from the back of the sample, and inter-pass pauses. The use and the
pressure of the cooling gasses as well as the inter-pass pauses were manually varied to
keep the substrate temperatures in the favourable range. In almost no case did the
a b Suspension outlet Injection nozzle
32
substrate temperature exceed 600°C in the various samples, and for the most part it
reached a maximum of 400°C.
Plasma &
Atomizing gases
Back pressure
Su
sp
en
sio
n
Axial III Mettech
Plasma Torch
Figure 2-2 Simplified Suspension Plasma Spray (SPS) system with axial injection
2.1.2. Atmospheric Plasma Spray
For atmospheric or conventional plasma spray using dry powders the same Mettech axial
III torch was used. The dry powder injection was performed from a 7/16” (11 mm) nozzle
size with a feed rate of 21 g/min using an Argon carrier gas flow of 6 slm (standard litre
per minute) . The depositions were done with 4 mm overlap and at 0.63 m/s spray robot
speed.
50mm
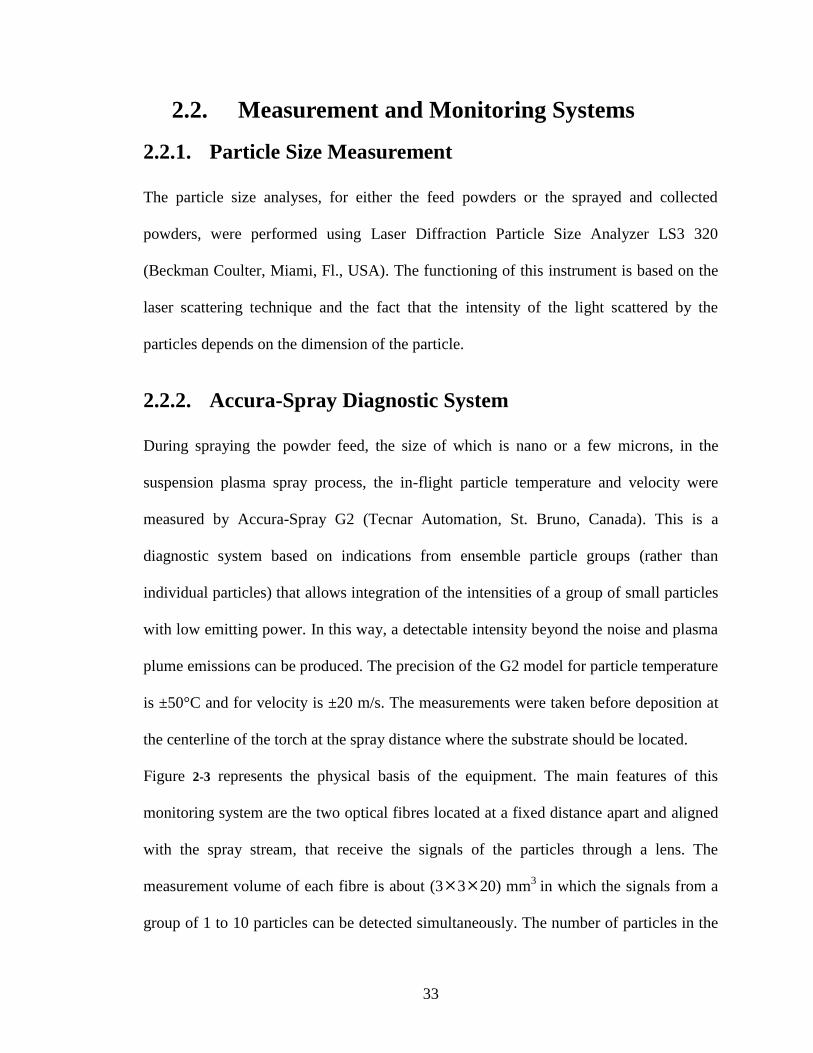
33
2.2. Measurement and Monitoring Systems
2.2.1. Particle Size Measurement
The particle size analyses, for either the feed powders or the sprayed and collected
powders, were performed using Laser Diffraction Particle Size Analyzer LS3 320
(Beckman Coulter, Miami, Fl., USA). The functioning of this instrument is based on the
laser scattering technique and the fact that the intensity of the light scattered by the
particles depends on the dimension of the particle.
2.2.2. Accura-Spray Diagnostic System
During spraying the powder feed, the size of which is nano or a few microns, in the
suspension plasma spray process, the in-flight particle temperature and velocity were
measured by Accura-Spray G2 (Tecnar Automation, St. Bruno, Canada). This is a
diagnostic system based on indications from ensemble particle groups (rather than
individual particles) that allows integration of the intensities of a group of small particles
with low emitting power. In this way, a detectable intensity beyond the noise and plasma
plume emissions can be produced. The precision of the G2 model for particle temperature
is ±50°C and for velocity is ±20 m/s. The measurements were taken before deposition at
the centerline of the torch at the spray distance where the substrate should be located.
Figure 2-3 represents the physical basis of the equipment. The main features of this
monitoring system are the two optical fibres located at a fixed distance apart and aligned
with the spray stream, that receive the signals of the particles through a lens. The
measurement volume of each fibre is about (3320) mm3
in which the signals from a
group of 1 to 10 particles can be detected simultaneously. The number of particles in the
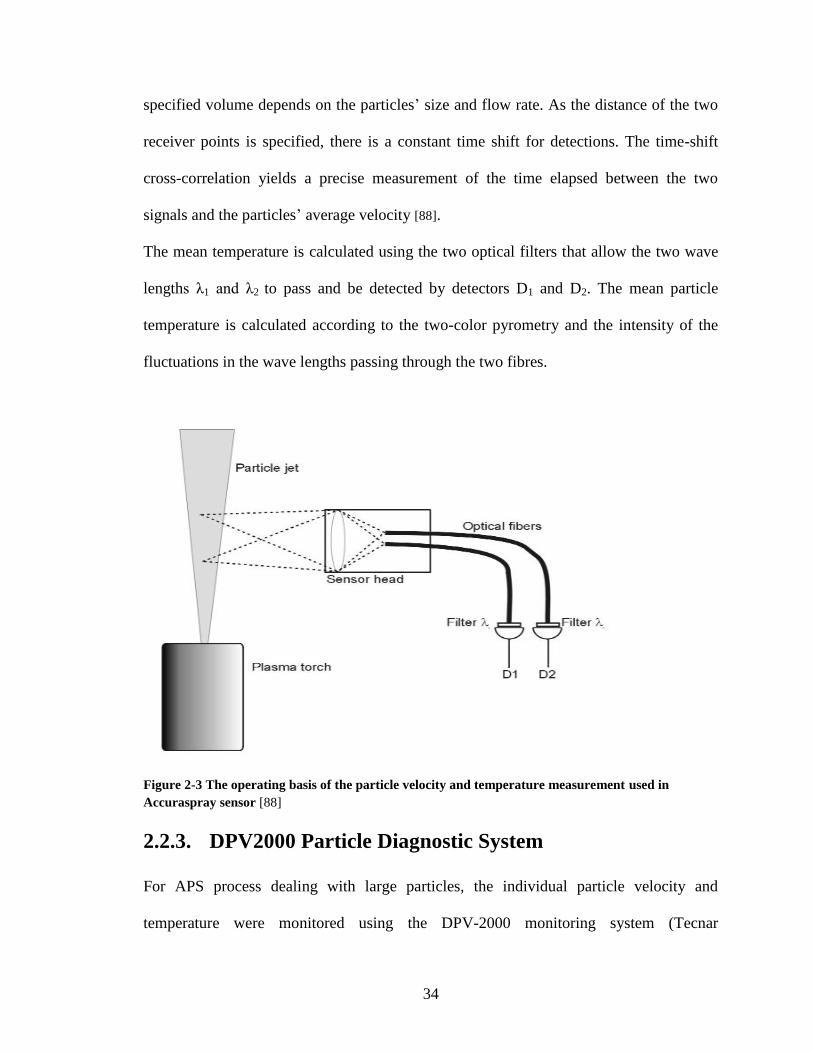
34
specified volume depends on the particles’ size and flow rate. As the distance of the two
receiver points is specified, there is a constant time shift for detections. The time-shift
cross-correlation yields a precise measurement of the time elapsed between the two
signals and the particles’ average velocity [88].
The mean temperature is calculated using the two optical filters that allow the two wave
lengths λ1 and λ2 to pass and be detected by detectors D1 and D2. The mean particle
temperature is calculated according to the two-color pyrometry and the intensity of the
fluctuations in the wave lengths passing through the two fibres.
Figure 2-3 The operating basis of the particle velocity and temperature measurement used in
Accuraspray sensor [88]
2.2.3. DPV2000 Particle Diagnostic System
For APS process dealing with large particles, the individual particle velocity and
temperature were monitored using the DPV-2000 monitoring system (Tecnar
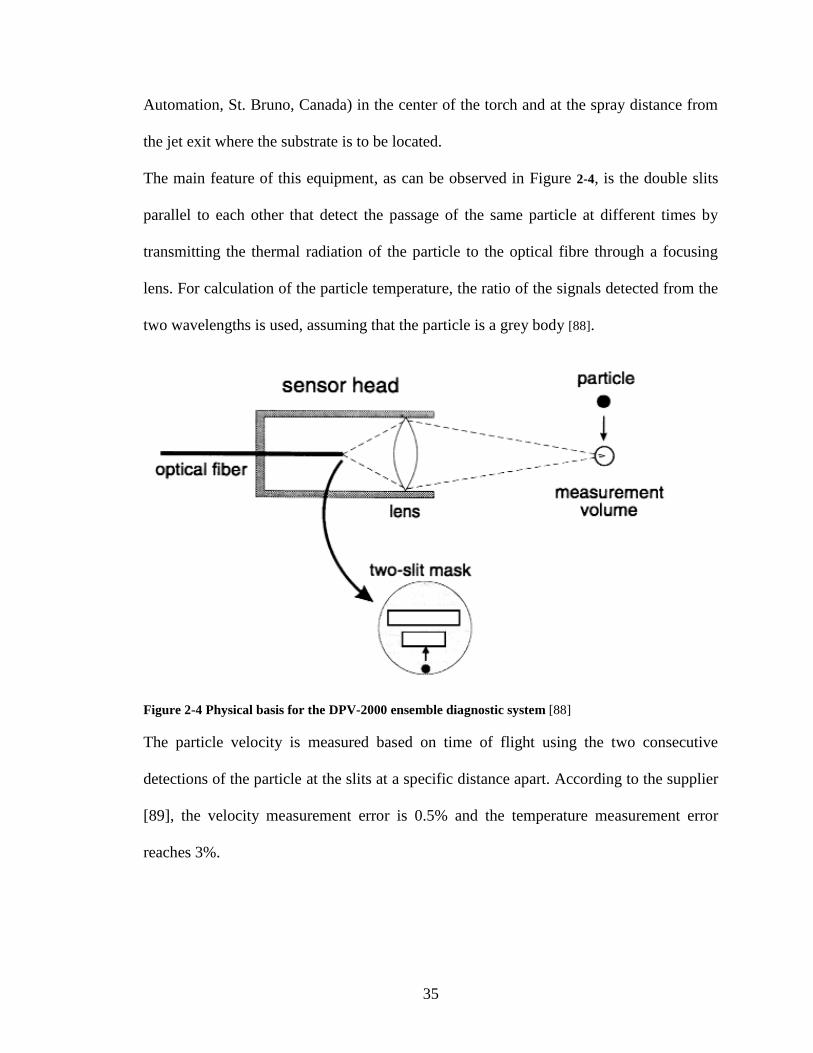
35
Automation, St. Bruno, Canada) in the center of the torch and at the spray distance from
the jet exit where the substrate is to be located.
The main feature of this equipment, as can be observed in Figure 2-4, is the double slits
parallel to each other that detect the passage of the same particle at different times by
transmitting the thermal radiation of the particle to the optical fibre through a focusing
lens. For calculation of the particle temperature, the ratio of the signals detected from the
two wavelengths is used, assuming that the particle is a grey body [88].
Figure 2-4 Physical basis for the DPV-2000 ensemble diagnostic system [88]
The particle velocity is measured based on time of flight using the two consecutive
detections of the particle at the slits at a specific distance apart. According to the supplier
[89], the velocity measurement error is 0.5% and the temperature measurement error
reaches 3%.
36
2.3. Mechanical Tests
2.3.1. Microhardness
The microhardness test was performed using the AB-Buehler hardness testing machine
(Buehler, Illinois, USA) at 300 grf for 15 seconds at 10 different locations with minimum
distance of 3 times the indent diagonal in the cross section of the coatings. The basis for
the functioning of the system is the Vickers hardness method with pyramidal indenter. A
computer-aided camera provides the micrographs of the indent and electronically
transmits them to the computer monitor where the hardness is calculated according to the
operator’s choice of the indent dimensions, and the result is directly digitalized. The
probable errors are considered as the standard deviation calculated from the 10 readings.
2.3.2. Fracture Toughness
Fracture toughness comparisons were done using 10 kgf load based on the formula in
Equation 2-1 [70].
2
3016.0
C
P
H
EK C Equation 2-1
Where E and H are respectively the Young modulus and the hardness, both in GPa, P
represents the applied load and C is the average of half crack lengths from 10
indentations. For H values the measured hardness results in this experiment were applied.
For Young modulus, a constant value of 28 GPa for 60/40 wt% alumina/YSZ composite
was used based on the rule of mixtures and applying the data for plasma sprayed coatings
from [90,91]. The H value for YSZ extracted from [90,91] was equal to 2.5 GPa.
37
2.3.3. Erosion Resistance
Erosion resistance tests were done for the coatings on Inconel 625 substrates bound
coated with NiCrAlY, based on determination of material loss by gas-entrained solid
particle impingement, and according to amended ASTM standard test method G76-83
[92]. The standard practice uses a small nozzle that impacts the abrasive-containing gas
to the surface of the test specimen. This, results in a comparable measure of erosion in
different samples that may be used to rank the materials based on this property. In this
experiment the alumina abrasive powder of 100 grits was blasted with air pressure of 10
LPM (litre per minute). The exposure was done at a 30º angle (instead of 90º mentioned
in the standard) for 30 seconds (instead of 10 minutes), spraying about 3.7 g/min of
erodent powder to the coating surface. The shorter time was used for the sake of thinness
of the coatings. Three replicates were used for each evaluation. The results were reported
based on the volume loss of the material per unit weight mass of applied erodent solid.
The errors bars are calculated from standard deviation of the three measurements.
2.4. High Temperature Performance
2.4.1. Thermal Conductivity
In order to study the thermal conductivity variation, the laser flash thermal diffusivity
measurement was employed [93]. In this method, a thermal pulse generated by laser
beam is applied on one face of the free-standing coating of 7 mm square (detached from
the substrate using boiling hydrochloric acid with 50% concentration) and the
temperature history on the opposite side is used for calculations of thermal diffusivity
38
through the coating thickness, as well as the specific heat capacity. The formula for
correlating the thermal diffusivity to the thermal conductivity is given in Equation 2-2.
pCk Equation 2-2
Where k is the thermal conductivity, Cp is the specific heat capacity at room temperature
and constant pressure, and ρ is the density of the coating calculated based on the formula
in Equation 2-3 and α is the thermal diffusivity.
%P1ltheoritica Equation 2-3
In Equation 2-3, P% is the porosity percentage that was measured by image analysis
techniques under the SEM with 500X magnification. In addition, ρtheoritical was calculated
based on the rule of mixtures and according to the individual densities of the components
and the proportion of each phase within the initial mixture. The value used for theoretical
density of alumina is 3.55 g/cm3 and for zirconia it is 5.8 g/cm3.
2.4.2. Thermal Cyclic Test
Thermal cyclic tests for coatings, on Inconel 625 substrates bound coated with NiCrAlY,
was done for 20, 100, 250 and 500 cycles on sets of 3 samples. The cycles included
heating the samples in an induction furnace to 1080 ºC in a 15-minute time period,
holding at temperature under air atmosphere for 1 hour to allow homogenous temperature
profile through the coatings and then cooling down in 15 minutes to room temperature
using air jet cooling. The life time and the resulting structural and microstructural
changes were then studied.
39
2.5. Measurement Techniques
2.5.1. Microstructure and Porosity
Field Emission-Scanning Electron Microscope (FE-SEM; Hitachi S4700) was used to
image the coating microstructures in both secondary electron (SE) and back scattered
(BS) modes. This microscope, in addition, was used for energy dispersive spectroscopic
(EDS) chemical analysis, compositional mapping, and for high-resolution microscopy
(HR-SEM).
SEM (Jeols JSM-610) microscope was utilized for image analysis at 500X magnification
and the average porosity was determined from measurements in 10 locations. Calibration
thresholds were selected between two reference materials, namely aluminium foil and the
mounting material. This method is useful for large porosities in the coating. It is, thus,
unable to detect porosities with a dimension of less than 0.5 µm at this magnification
[28]. All microscopic evaluations and micrographs on the coatings were done on the
cross section of the samples.
In addition, the in-flight particles were studied using the same microscopes and
microscopic techniques. The in-flight particles were provided by spraying the powder
into a large container of water, collecting and eventually air drying the resulting particles.
The microscopic investigations were done in two different methods. In the first method,
the particles were glued to a polished stainless still substrate using conductive glue and
coated with gold, and then the micrographs were taken to view the morphology and a
rough estimation of their sizes. The second method of particle studies was done on the
sectioned view of the particles. For this purpose, the collected and dried powder particles
were mounted in resin and polished, and then gold coated.
40
2.5.2. Amorphous Phase Measurement
Two distinct methods were used to evaluate the amorphous content that resulted from
changing the spraying conditions. The first method uses the XRD patterns, which in this
work are provided by Bruker D8-Discovery diffractometer (Bruker AXS, Inc., Madison,
WI, USA). The second is based on the differential scanning calorimetric (DSC) graphs
produced by the TG96 (SETARAM Inc., Newark, Ca, USA) machine. Description of
each method is as follows.
2.5.2.1. Measurement Based on XRD Patterns
In the first method the X-ray patterns from the coating surface using Cu-Kα radiation and
acquisition of 0.01°/sec were used. In this method, the area under the humps in the
background of the XRD patterns that are characteristic of the non-crystalline structure
were measured. The ratio of the hump area to the total area of the XRD pattern, including
hump and sharp peak areas, represents the amorphous percentage in the structure. This
ratio was measured within the range of 20° to 90°, unlike the usual method used for
mainly amorphous materials with comparatively small number of crystalline peaks that
are measured in a small range of angles below 40° [94]. For this measurement, the peak-
fitting program GRAMS/AI from Galactic package [95] was used. The peak types
selected for hump areas (diffused peaks of amorphous phase) were Gaussian and the
sharp peaks (crystalline phase) were mixed Gaussian-Loranzian. This selection was based
on trial and error for the maximum correlation factor of greater than 99% and chi factor
(representing the goodness of the fitting process) mostly less than 0.5 in the overall
resulting curve fits. The iterative curve fittings selected to be up to 50 runs were done by
41
the software. The standard deviation of the calculations based on 5 to 7 readings were
considered as the probable error in the results.
2.5.2.2. Measurement Based on DSC Graphs
The second method for comparison of the amorphous contents in this study used the DSC
graphs. These curves were also used for determining the transformation temperatures, and
they were the basis for selecting the heat treatment temperatures as well.
The heating and cooling rates were selected as 5°C/min, which is the minimum attainable
with the present equipment, to allow any unexpected transformation to be detected and
the role of superheating and undercooling to be at a minimum. This rate was kept
constant throughout the entire work to eliminate its role on transformation temperatures.
The tests were undertaken in a range from room temperature up to the maximum
temperature of 1500°C to find any possible delayed transformations in metasble phases.
This is also the temperature before which the tetragonal to monoclinic zirconia
transformation should happen.
The application of DSC curves in amorphous phase measurement was based on [96],
where the area under the endothermic peak at the crystallization temperatures, known as
the “crystallization peak,” is employed in the calculation of the amorphous content. The
curves with larger crystallization peak area represent larger amorphous content [24,97].
Likewise, the area under the peak for any other transformation was basically selected as a
representative of the amount of the initial phase in that transformation. The fixed error of
8%, suggested by the equipment supplier was considered as the probable error for these
measurements.
42
To measure the absolute value for the amorphous content in this method, a fully
amorphous reference sample would be necessary. However, since these measurements of
amorphous phase were for comparison purpose, the crystallization peak areas with
arbitrary units are used.
2.5.2.3. Data Validation
Study has shown that amorphous phase evaluations based on XRD pattern are more
accurate when the amorphous contents are less than about 20 percent, whereas DSC
crystallization peak is more reliable for larger proportions of this phase [97]. It is
important, also, to note that the results from thermal analysis are mass-based while the
XRD results are volume-based data. So the absolute values of the changes in the results
from the two methods cannot be directly compared and only the trend of the changes can
support the other test results.
A linear regression for a group of randomly selected data from various experiments in
this work was used to investigate the correlation between the results from the two
methods. Figure 2-5 illustrates a reasonable agreement and close values to the linear
relation. Thus, both methods can be applicable for comparison purposes and long DSC
analyses are alternatively replaced by XRD pattern calculations.
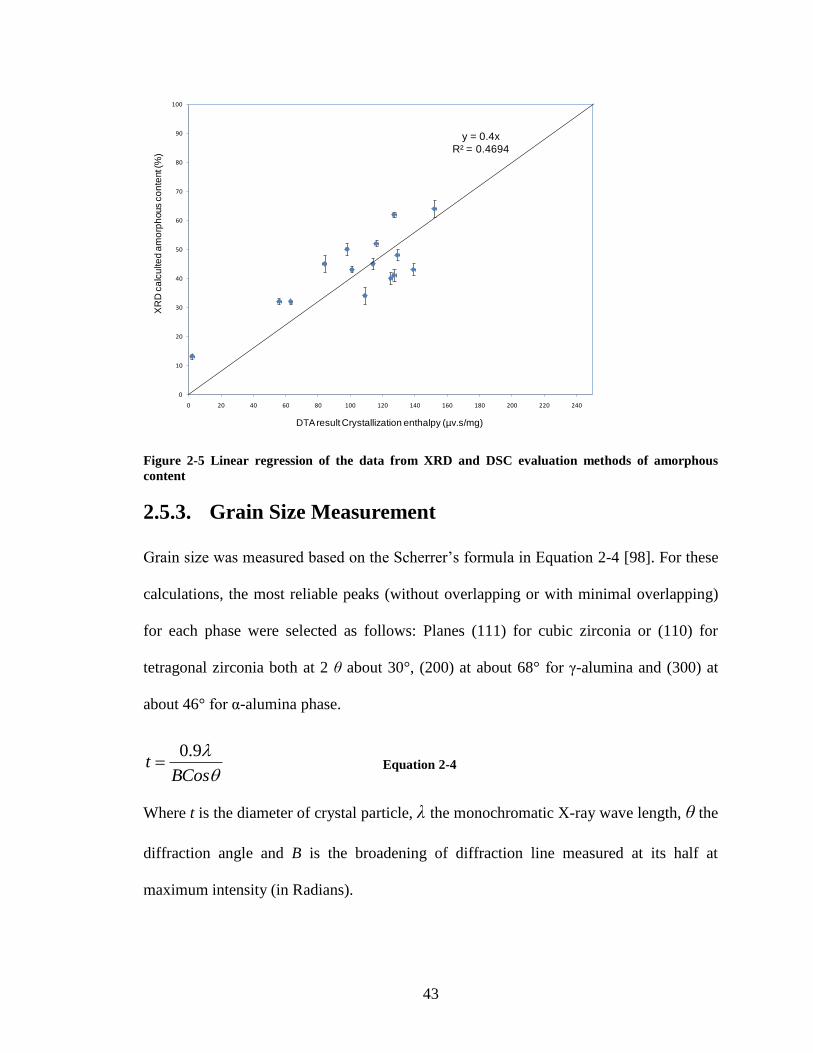
43
y = 0.4x
R² = 0.4694
0
10
20
30
40
50
60
70
80
90
100
0 20 40 60 80 100 120 140 160 180 200 220 240
XR
D c
alc
ulte
d a
mo
rph
ous c
on
tent (
%)
DTA result Crystallization enthalpy (µv.s/mg)
Figure 2-5 Linear regression of the data from XRD and DSC evaluation methods of amorphous
content
2.5.3. Grain Size Measurement
Grain size was measured based on the Scherrer’s formula in Equation 2-4 [98]. For these
calculations, the most reliable peaks (without overlapping or with minimal overlapping)
for each phase were selected as follows: Planes (111) for cubic zirconia or (110) for
tetragonal zirconia both at 2 θ about 30°, (200) at about 68° for γ-alumina and (300) at
about 46° for α-alumina phase.
BCost
9.0 Equation 2-4
Where t is the diameter of crystal particle, λ the monochromatic X-ray wave length, θ the
diffraction angle and B is the broadening of diffraction line measured at its half at
maximum intensity (in Radians).
44
The best curve fitting using the “peak fitting” function of GRAMS software [95] was
used for peak measurements (width and angle). Smoothing process for some scans was
necessary, when an overly corrugated appearance could cause erroneous peak
measurements. The necessary data in terms of peak positions, concerning planes and
FWHM (full width at half maximum) for each phase, after corrections with machine
broadening data, are then used for grain-size calculation. To eliminate the machine
broadening effect, the formula in Equation 2-5 was used.
22 bB Equation 2-5
Where b is the peak width at FWHM and β is the machine broadening effect.
Machine broadenings are determined from the corresponding peaks of the above-
mentioned planes in a LaB6 single crystal. It is expected that the peaks in a perfect single
crystal are without broadening by different crystallite orientations. Hence, if instead of an
extremely sharp peak (line) a peak with width β appears in the XRD pattern, it can be
related to the machine broadening effect.
2.5.4. Phase Analysis
To measure the amount of each crystalline phase within the crystalline portion of the
structure, XRD patterns have been used. In this application, the peak intensities have
been used for calculation of the phase ratios. However, in this study coatings normally
include some amorphous phase, which results in a background hump that can vary the
peak intensities at specific locations where the humps are distributed. In addition, the
texture (preferred orientation) is another issue in the coatings that results in intensifying
some specific peaks related to the planes with larger number of repetitions. As a result,
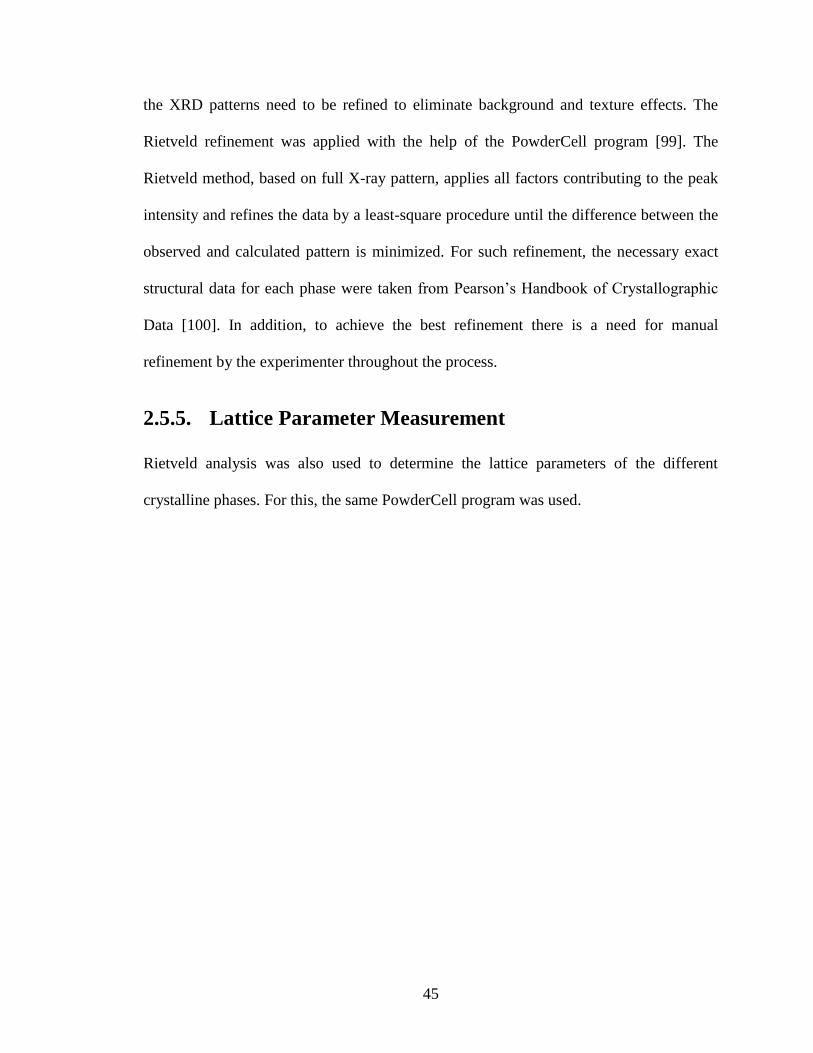
45
the XRD patterns need to be refined to eliminate background and texture effects. The
Rietveld refinement was applied with the help of the PowderCell program [99]. The
Rietveld method, based on full X-ray pattern, applies all factors contributing to the peak
intensity and refines the data by a least-square procedure until the difference between the
observed and calculated pattern is minimized. For such refinement, the necessary exact
structural data for each phase were taken from Pearson’s Handbook of Crystallographic
Data [100]. In addition, to achieve the best refinement there is a need for manual
refinement by the experimenter throughout the process.
2.5.5. Lattice Parameter Measurement
Rietveld analysis was also used to determine the lattice parameters of the different
crystalline phases. For this, the same PowderCell program was used.
46
Chapter 3 Crystalline Structure and Amorphous
Phase Formation in Atmospheric Plasma
Spray Process
This part of the study investigates the more appropriate feed size (nano or micron) for
production of larger amounts of amorphous phase using conventional plasma spray
process, and to justify the application of SPS process in this research. In addition, some
initial insights into the amorphous phase formation during plasma spray process could be
acquired to be eventually compared with the results of SPS process.
For this purpose, two different types of powder, Tosoh TZ3460A composed of 60/40
wt% alumina/3YSZ (Tosoh Inc. Grove City, OH, USA) and Amperite 750 consisting of
Al2O3-ZrO2 60/40 fused (nominal size range 5-22 μm) (H.C. Starck, Sarnia, ON, CA)
were axially injected into the Mettech axial III plasma torch. The powders were sprayed
under the conditions summarized in Table 3-1.
Coatings were deposited on mild steel coupons (2.5 × 2.5 cm2 with 0.5 cm thickness)
bound-coated with NiCrCoAlY. Each coating was produced by 12 deposition passes.
After finishing each coating, the torch head was directed to a large water reservoir and for
about one minute spraying was done into the water at a 30-50 cm distance from the torch
exit. The resulting in-flight particles, cooled down in water, were next collected and air
dried. The collected powders went through size distribution analysis. In both the collected
powders and the coatings, the amorphous contents were measured using the XRD and
DSC techniques.
47
Table 3-1 Spray condition for the two types of powders and the resulting particle condition and
coating thicknesses
Spray
Condition Total
Gas
(slm)
Plasma
Current (A)
Gas
Composition
(Ar/N2/H2)
Spray
Distance
(mm)
Tp
(°C)
Vp
(m/s)
Coating
Thickness
(mm) Powder
Amperite
Tosoh 120 200 10/80/10 100
2455
2250
245
222
302
463
Figure 3-1(a) to (d) presents the morphology of the feed powders and suggests that the
approximate size ratio for Tosoh to Amperite powder is 3 and the average size of the
Tosoh powder is initially 45 μm.
Figure 3-1(a) shows the Tosoh powder as large agglomerates of nano-particulates with a
large number of nano-pores that are clearer in the magnified image in Figure 3-1(b). This
figure also suggests a loose connection among the particulates of the agglomerate. Figure
3-1(c) presents the Amperite 750, a powder of comparatively large fused and crushed
particles with sharp corners and dense structure. In this powder, no stabilizer was
observed, based on XRD pattern assessment. Figure 3-1(b) from Tosoh powder at 100
times higher magnification than in Figure 3-1(d), clearly shows the particulate size
differences. The XRD phase analysis of the initial powders showed that the Amperite 750
powder consists of a combination of monoclinic and tetragonal zirconia (with no trace of
stabilizing agents, e.g., yttria), and α- and γ-alumina phases. Tosoh powder, on the other
hand, shows tetragonal YSZ and γ-alumina.
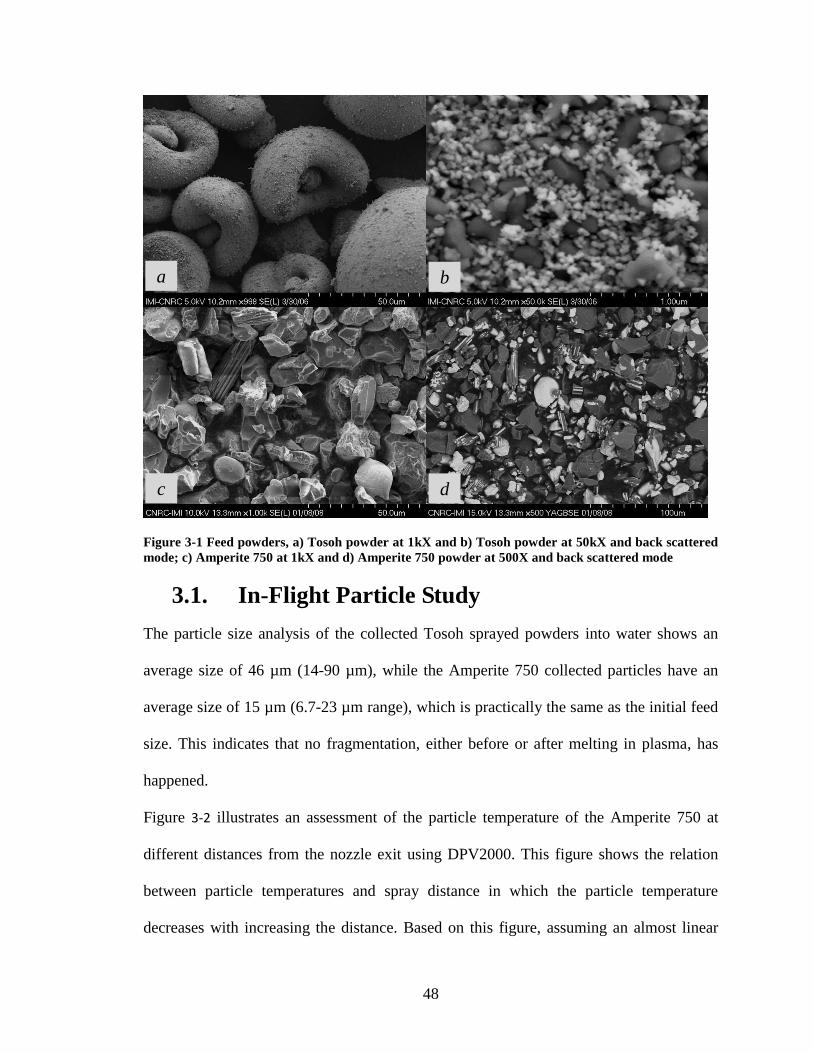
48
Figure 3-1 Feed powders, a) Tosoh powder at 1kX and b) Tosoh powder at 50kX and back scattered
mode; c) Amperite 750 at 1kX and d) Amperite 750 powder at 500X and back scattered mode
3.1. In-Flight Particle Study
The particle size analysis of the collected Tosoh sprayed powders into water shows an
average size of 46 µm (14-90 µm), while the Amperite 750 collected particles have an
average size of 15 µm (6.7-23 µm range), which is practically the same as the initial feed
size. This indicates that no fragmentation, either before or after melting in plasma, has
happened.
Figure 3-2 illustrates an assessment of the particle temperature of the Amperite 750 at
different distances from the nozzle exit using DPV2000. This figure shows the relation
between particle temperatures and spray distance in which the particle temperature
decreases with increasing the distance. Based on this figure, assuming an almost linear
a b
c d
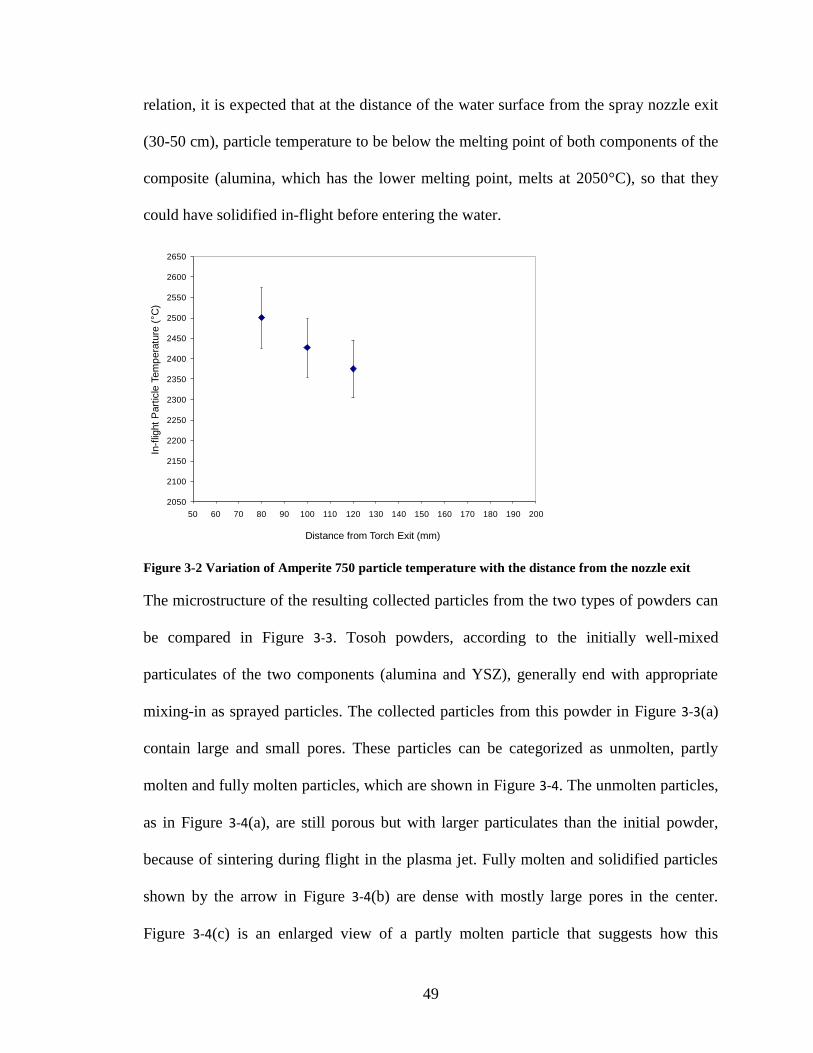
49
relation, it is expected that at the distance of the water surface from the spray nozzle exit
(30-50 cm), particle temperature to be below the melting point of both components of the
composite (alumina, which has the lower melting point, melts at 2050°C), so that they
could have solidified in-flight before entering the water.
2050
2100
2150
2200
2250
2300
2350
2400
2450
2500
2550
2600
2650
50 60 70 80 90 100 110 120 130 140 150 160 170 180 190 200
Pa
rtic
le T
em
pe
ratu
re °
C
Distnace from Torch Exit (mm)Distance from Torch Exit (mm)
In-f
light
Part
icle
Tem
pera
ture
( C
)
Figure 3-2 Variation of Amperite 750 particle temperature with the distance from the nozzle exit
The microstructure of the resulting collected particles from the two types of powders can
be compared in Figure 3-3. Tosoh powders, according to the initially well-mixed
particulates of the two components (alumina and YSZ), generally end with appropriate
mixing-in as sprayed particles. The collected particles from this powder in Figure 3-3(a)
contain large and small pores. These particles can be categorized as unmolten, partly
molten and fully molten particles, which are shown in Figure 3-4. The unmolten particles,
as in Figure 3-4(a), are still porous but with larger particulates than the initial powder,
because of sintering during flight in the plasma jet. Fully molten and solidified particles
shown by the arrow in Figure 3-4(b) are dense with mostly large pores in the center.
Figure 3-4(c) is an enlarged view of a partly molten particle that suggests how this
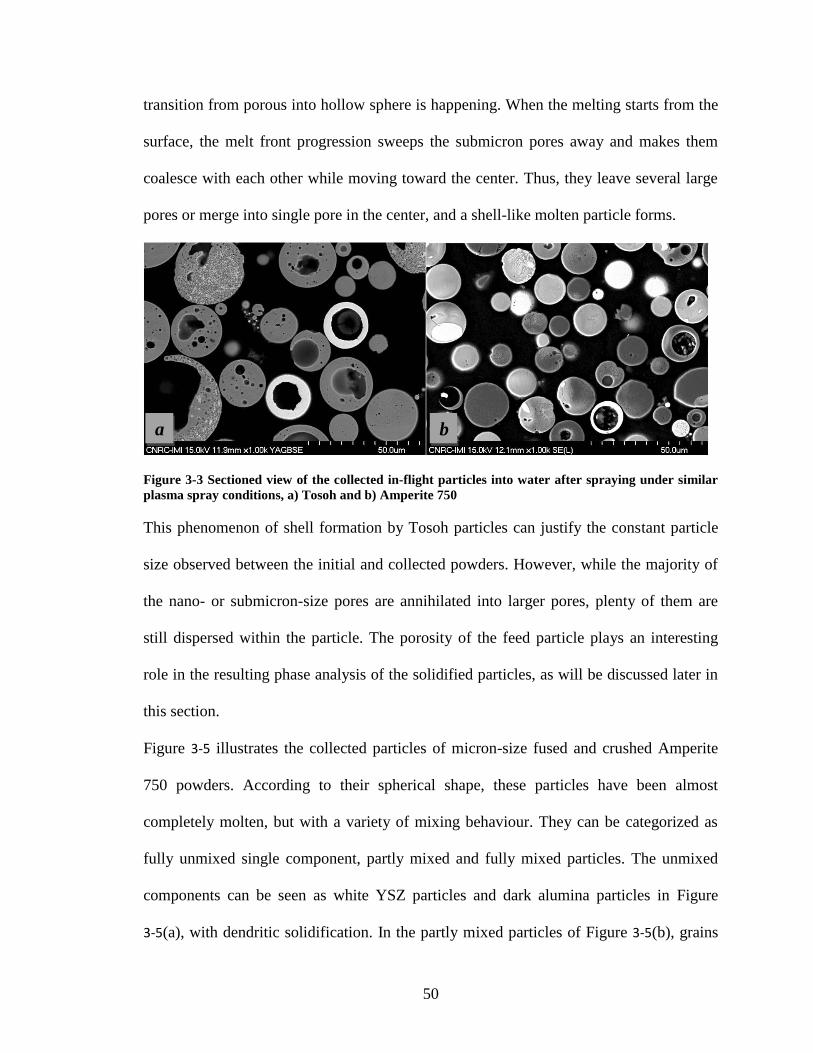
50
transition from porous into hollow sphere is happening. When the melting starts from the
surface, the melt front progression sweeps the submicron pores away and makes them
coalesce with each other while moving toward the center. Thus, they leave several large
pores or merge into single pore in the center, and a shell-like molten particle forms.
Figure 3-3 Sectioned view of the collected in-flight particles into water after spraying under similar
plasma spray conditions, a) Tosoh and b) Amperite 750
This phenomenon of shell formation by Tosoh particles can justify the constant particle
size observed between the initial and collected powders. However, while the majority of
the nano- or submicron-size pores are annihilated into larger pores, plenty of them are
still dispersed within the particle. The porosity of the feed particle plays an interesting
role in the resulting phase analysis of the solidified particles, as will be discussed later in
this section.
Figure 3-5 illustrates the collected particles of micron-size fused and crushed Amperite
750 powders. According to their spherical shape, these particles have been almost
completely molten, but with a variety of mixing behaviour. They can be categorized as
fully unmixed single component, partly mixed and fully mixed particles. The unmixed
components can be seen as white YSZ particles and dark alumina particles in Figure
3-5(a), with dendritic solidification. In the partly mixed particles of Figure 3-5(b), grains
a
b

51
of unmixed portion are dendritic, and no grain can be seen in the mixed area at the left
side or in the fully mixed particles (indicated by arrows in the same figure). Ultra-high
magnification at 50kX by SEM in Figure 3-5(c) of the fully mixed particle presents no
sign of the crystalline grains that would suggest the structure to be amorphous.
Figure 3-4 Sectioned view of Tosoh collected powder: a) unmolten particle; b) fully molten-
resolidified particle and partly molten particle consisting of c) unmolten region indicated by U,
molten region M, and enlarged pores designated by P.
Particles with complete melting and mixing were the common category between the two
types of powders. Figure 3-6 is an SEM micrograph with EDS (Energy Dispersive
Spectroscopy) elemental mapping of the same particle observed in Figure 3-5(c). It shows
almost complete homogeneity in the composition and uniform distribution for both
aluminium and zirconium atoms resulted from full mixing of the two components. Since
U
P
M
c
Fully molten
Partly molten
b a
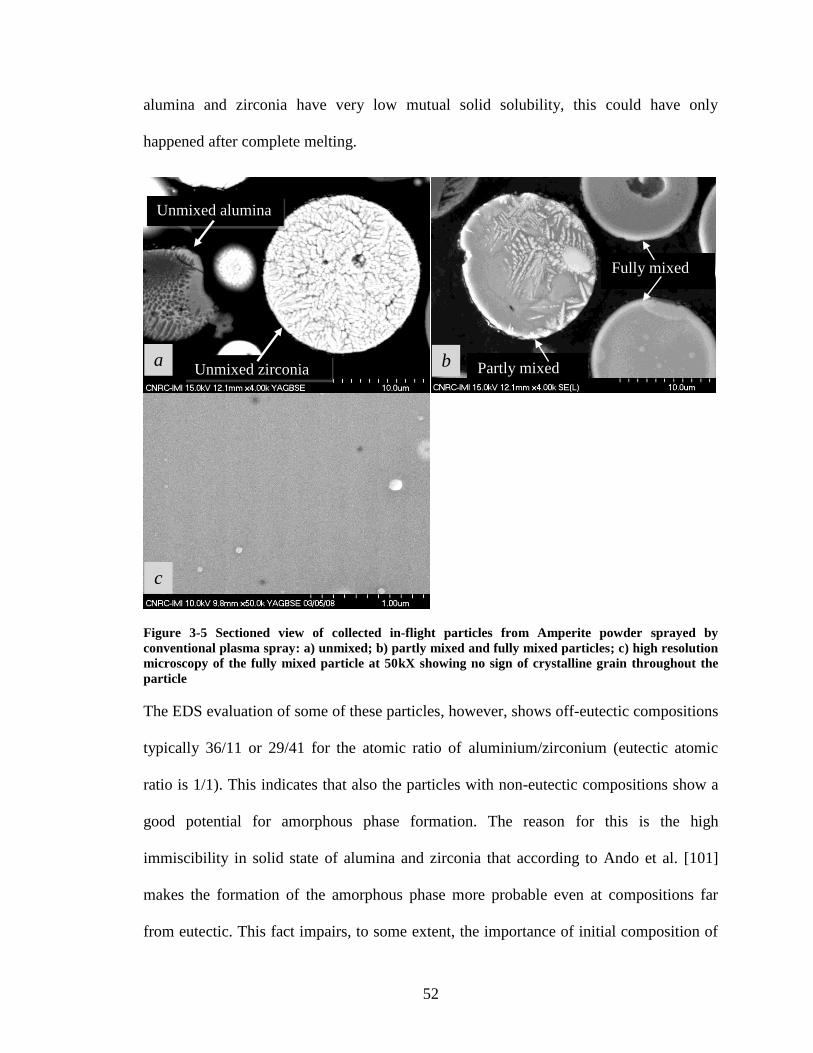
52
alumina and zirconia have very low mutual solid solubility, this could have only
happened after complete melting.
Figure 3-5 Sectioned view of collected in-flight particles from Amperite powder sprayed by
conventional plasma spray: a) unmixed; b) partly mixed and fully mixed particles; c) high resolution
microscopy of the fully mixed particle at 50kX showing no sign of crystalline grain throughout the
particle
The EDS evaluation of some of these particles, however, shows off-eutectic compositions
typically 36/11 or 29/41 for the atomic ratio of aluminium/zirconium (eutectic atomic
ratio is 1/1). This indicates that also the particles with non-eutectic compositions show a
good potential for amorphous phase formation. The reason for this is the high
immiscibility in solid state of alumina and zirconia that according to Ando et al. [101]
makes the formation of the amorphous phase more probable even at compositions far
from eutectic. This fact impairs, to some extent, the importance of initial composition of
Fully mixed
Partly mixed b a
c
Unmixed zirconia
Unmixed alumina
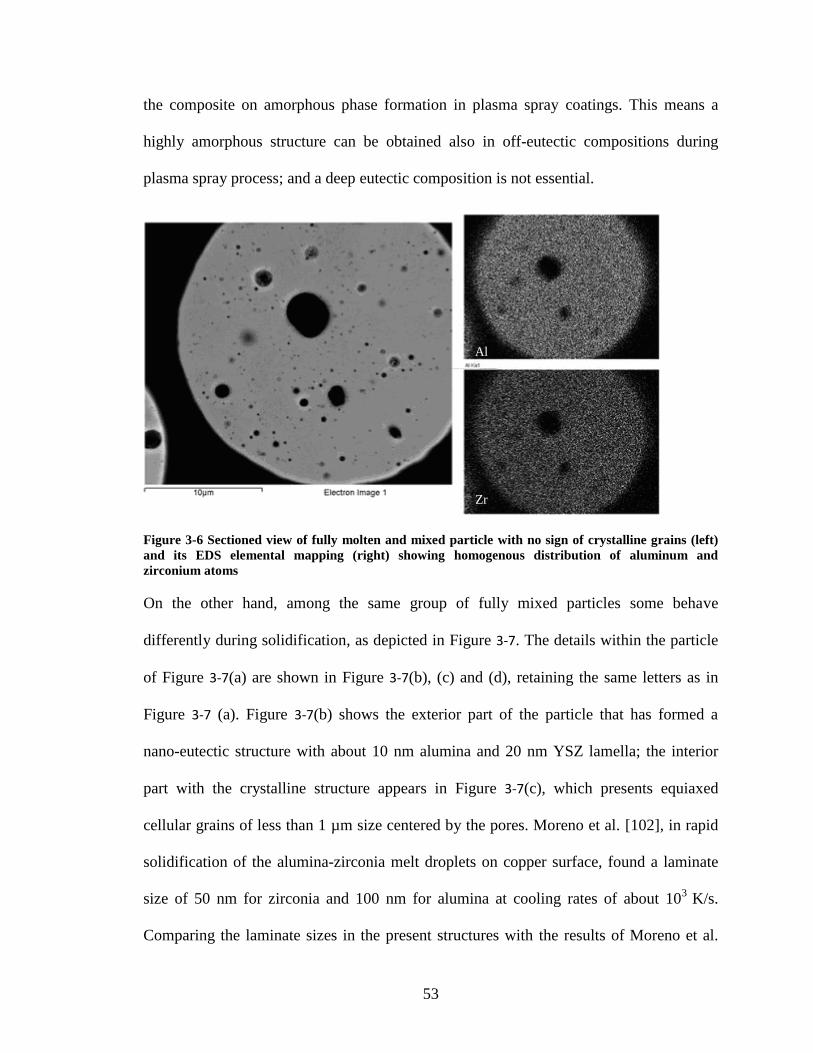
53
the composite on amorphous phase formation in plasma spray coatings. This means a
highly amorphous structure can be obtained also in off-eutectic compositions during
plasma spray process; and a deep eutectic composition is not essential.
Figure 3-6 Sectioned view of fully molten and mixed particle with no sign of crystalline grains (left)
and its EDS elemental mapping (right) showing homogenous distribution of aluminum and
zirconium atoms
On the other hand, among the same group of fully mixed particles some behave
differently during solidification, as depicted in Figure 3-7. The details within the particle
of Figure 3-7(a) are shown in Figure 3-7(b), (c) and (d), retaining the same letters as in
Figure 3-7 (a). Figure 3-7(b) shows the exterior part of the particle that has formed a
nano-eutectic structure with about 10 nm alumina and 20 nm YSZ lamella; the interior
part with the crystalline structure appears in Figure 3-7(c), which presents equiaxed
cellular grains of less than 1 µm size centered by the pores. Moreno et al. [102], in rapid
solidification of the alumina-zirconia melt droplets on copper surface, found a laminate
size of 50 nm for zirconia and 100 nm for alumina at cooling rates of about 103
K/s.
Comparing the laminate sizes in the present structures with the results of Moreno et al.
Al
Zr
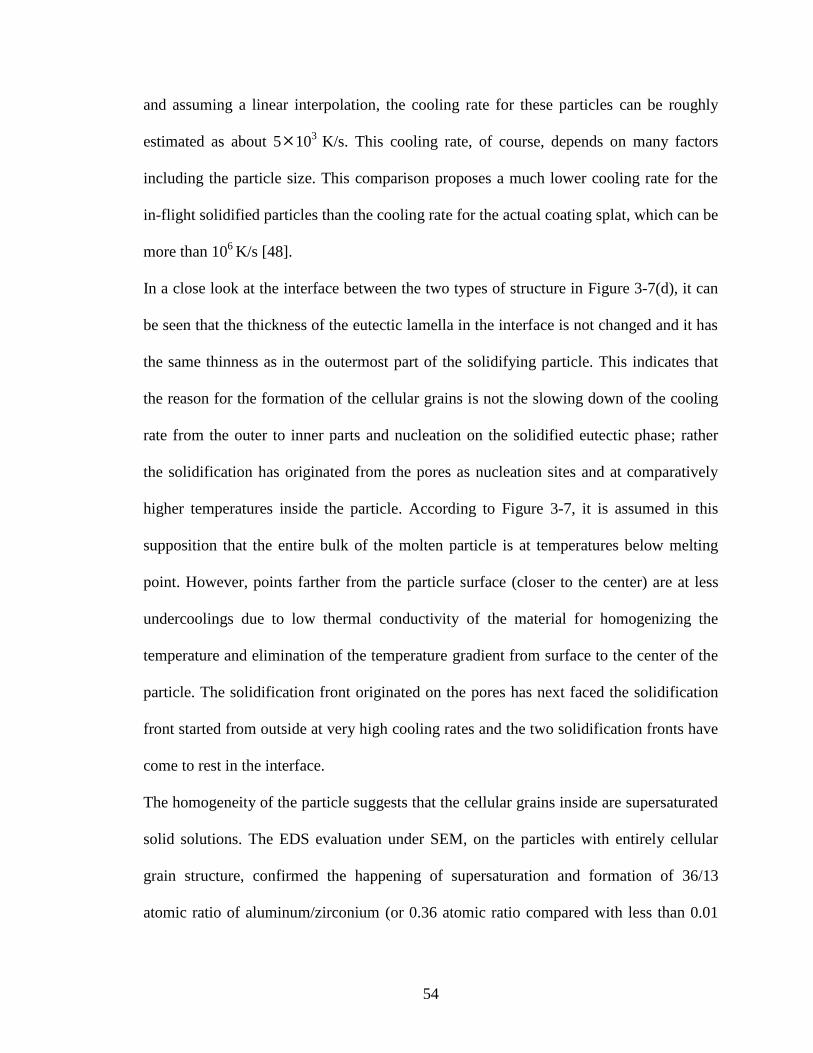
54
and assuming a linear interpolation, the cooling rate for these particles can be roughly
estimated as about 5103
K/s. This cooling rate, of course, depends on many factors
including the particle size. This comparison proposes a much lower cooling rate for the
in-flight solidified particles than the cooling rate for the actual coating splat, which can be
more than 106
K/s [48].
In a close look at the interface between the two types of structure in Figure 3-7(d), it can
be seen that the thickness of the eutectic lamella in the interface is not changed and it has
the same thinness as in the outermost part of the solidifying particle. This indicates that
the reason for the formation of the cellular grains is not the slowing down of the cooling
rate from the outer to inner parts and nucleation on the solidified eutectic phase; rather
the solidification has originated from the pores as nucleation sites and at comparatively
higher temperatures inside the particle. According to Figure 3-7, it is assumed in this
supposition that the entire bulk of the molten particle is at temperatures below melting
point. However, points farther from the particle surface (closer to the center) are at less
undercoolings due to low thermal conductivity of the material for homogenizing the
temperature and elimination of the temperature gradient from surface to the center of the
particle. The solidification front originated on the pores has next faced the solidification
front started from outside at very high cooling rates and the two solidification fronts have
come to rest in the interface.
The homogeneity of the particle suggests that the cellular grains inside are supersaturated
solid solutions. The EDS evaluation under SEM, on the particles with entirely cellular
grain structure, confirmed the happening of supersaturation and formation of 36/13
atomic ratio of aluminum/zirconium (or 0.36 atomic ratio compared with less than 0.01
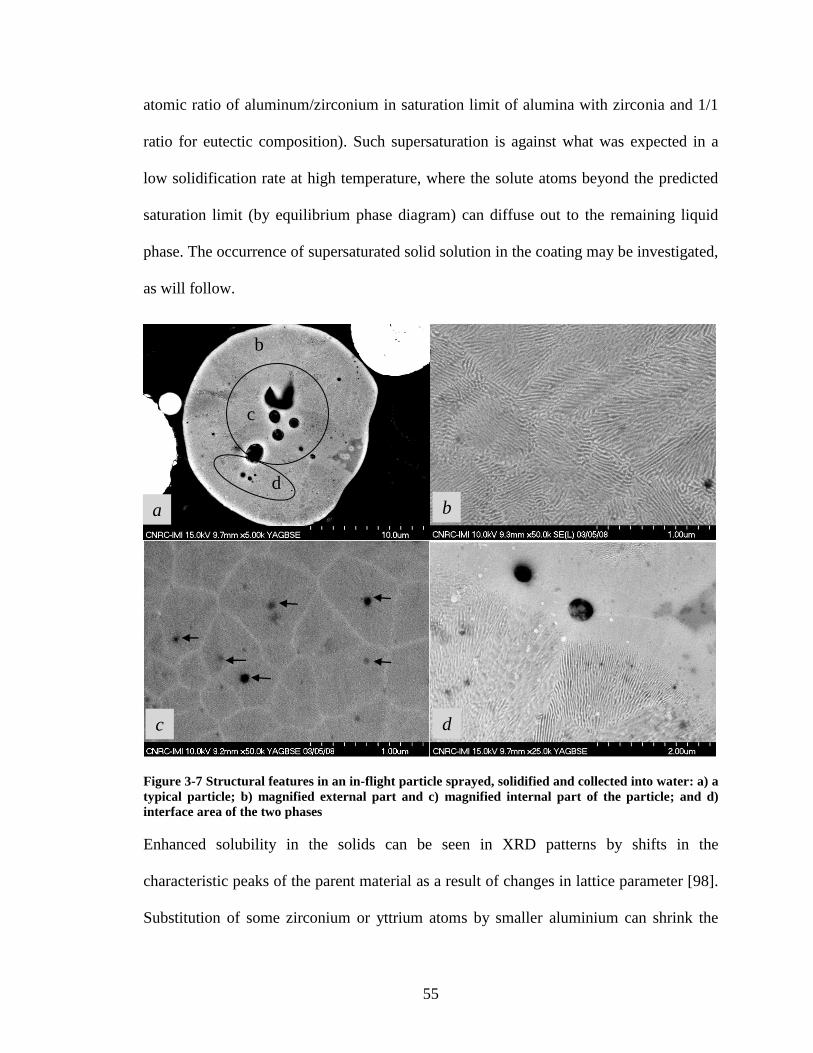
55
atomic ratio of aluminum/zirconium in saturation limit of alumina with zirconia and 1/1
ratio for eutectic composition). Such supersaturation is against what was expected in a
low solidification rate at high temperature, where the solute atoms beyond the predicted
saturation limit (by equilibrium phase diagram) can diffuse out to the remaining liquid
phase. The occurrence of supersaturated solid solution in the coating may be investigated,
as will follow.
Figure 3-7 Structural features in an in-flight particle sprayed, solidified and collected into water: a) a
typical particle; b) magnified external part and c) magnified internal part of the particle; and d)
interface area of the two phases
Enhanced solubility in the solids can be seen in XRD patterns by shifts in the
characteristic peaks of the parent material as a result of changes in lattice parameter [98].
Substitution of some zirconium or yttrium atoms by smaller aluminium can shrink the
b
)
c
)
d
) a
d c
b
56
unit cell of the YSZ structure. The other possibility for this dissolution is the allocation of
much smaller aluminium atoms in the interstitial positions of the YSZ structure (either
cubic or tetragonal), which can result in expansion of the unit cell. The former case can
bring a positive shift to specific peaks and the latter results in a negative peak shift
toward smaller angles. Thus the peak shifts are decided based on YSZ crystal structure
and the position that the aluminum atom can take within the unit cell. In this, study such
structural investigation is done based on the Rietveld analysis using PowderCell software.
3.2. Coating Structure and Amorphous Formation
The resulting coatings from the two different powders can be compared in Figure 3-8(a)
and (b), that show the coatings from Amperite 750 and Tosoh powders, respectively.
There is a considerable difference in the coating microstructures, including clearly higher
porosity and surface roughness in the coating from Tosoh powder. The reason can be
related to the formation of a large number of shell-like particles with large core
porosities. In such particles (forming hollow droplets) bursting upon impact can cause
splashing that results in both more porosity and a rough surface.
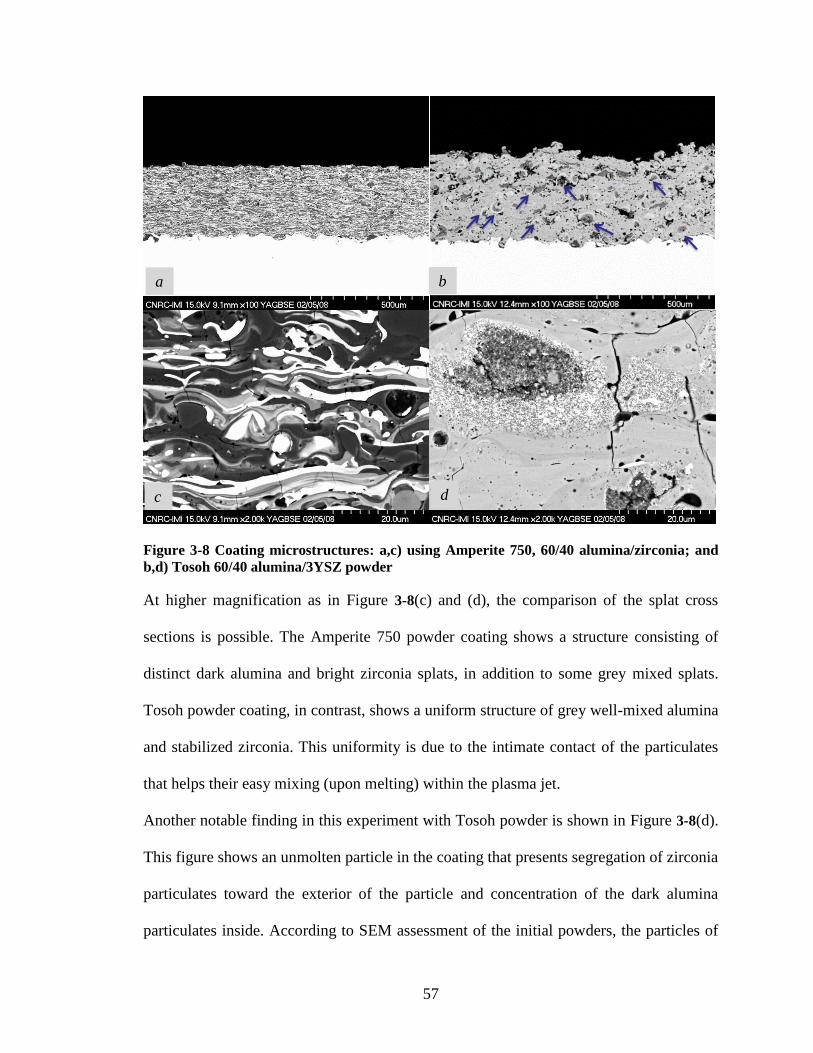
57
Figure 3-8 Coating microstructures: a,c) using Amperite 750, 60/40 alumina/zirconia; and
b,d) Tosoh 60/40 alumina/3YSZ powder
At higher magnification as in Figure 3-8(c) and (d), the comparison of the splat cross
sections is possible. The Amperite 750 powder coating shows a structure consisting of
distinct dark alumina and bright zirconia splats, in addition to some grey mixed splats.
Tosoh powder coating, in contrast, shows a uniform structure of grey well-mixed alumina
and stabilized zirconia. This uniformity is due to the intimate contact of the particulates
that helps their easy mixing (upon melting) within the plasma jet.
Another notable finding in this experiment with Tosoh powder is shown in Figure 3-8(d).
This figure shows an unmolten particle in the coating that presents segregation of zirconia
particulates toward the exterior of the particle and concentration of the dark alumina
particulates inside. According to SEM assessment of the initial powders, the particles of
a
d c
b
58
this composite powder were formed of uniformly distributed alumina and zirconia nano-
particulates. Therefore, this segregation has to have happened during the plasma spray
process. The reoccurrence of the segregated particles in the coating is shown by arrows in
Figure 3-8(b). This segregation of zirconia toward exterior regions was previously
reported in the collected powders after melting and re-solidification, as well as in the
coatings of this composite [81]. This phenomenon in both solid and liquid state may be
attributed to the higher electrical polarity (stronger dipole) of zirconia molecules that
causes a higher tendency of zirconia to expose itself to the ionic environment of plasma at
the exterior parts of the particle. According to basic chemistry [103], molecules with
covalent bonding between dissimilar atoms form electrical dipoles. These dipoles are the
result of the higher density of the shared electrons around the ions of atoms with smaller
size (atomic number) and/or higher electronegativity. The larger the difference between
the atomic number and the electronegativity of the atoms involved in the bond, the higher
the polarity of the dipole [103], so that in extreme conditions the bonding turns to ionic
type. Thus the degree of polarity of the dipole translates to the degree of ionic character
of the bond or molecule. In the bond with oxygen (atomic number 8 and electronegativity
3.44), Zr (atomic number 40 and electronegativity 1.33) shows a higher ionic
characteristic compared with Al (atomic number 13 and electronegativity 1.61). On the
other hand, the materials can best dissolve in electrolytes of similar polarity (i.e.,
molecules with higher ionic character can more readily dissolve in ionic electrolytes).
Therefore, a higher affinity from zirconium oxide toward the plasma (as an ionic
electrolyte) can be expected, which causes a stronger attraction toward the surface of the
particle and/or melt.
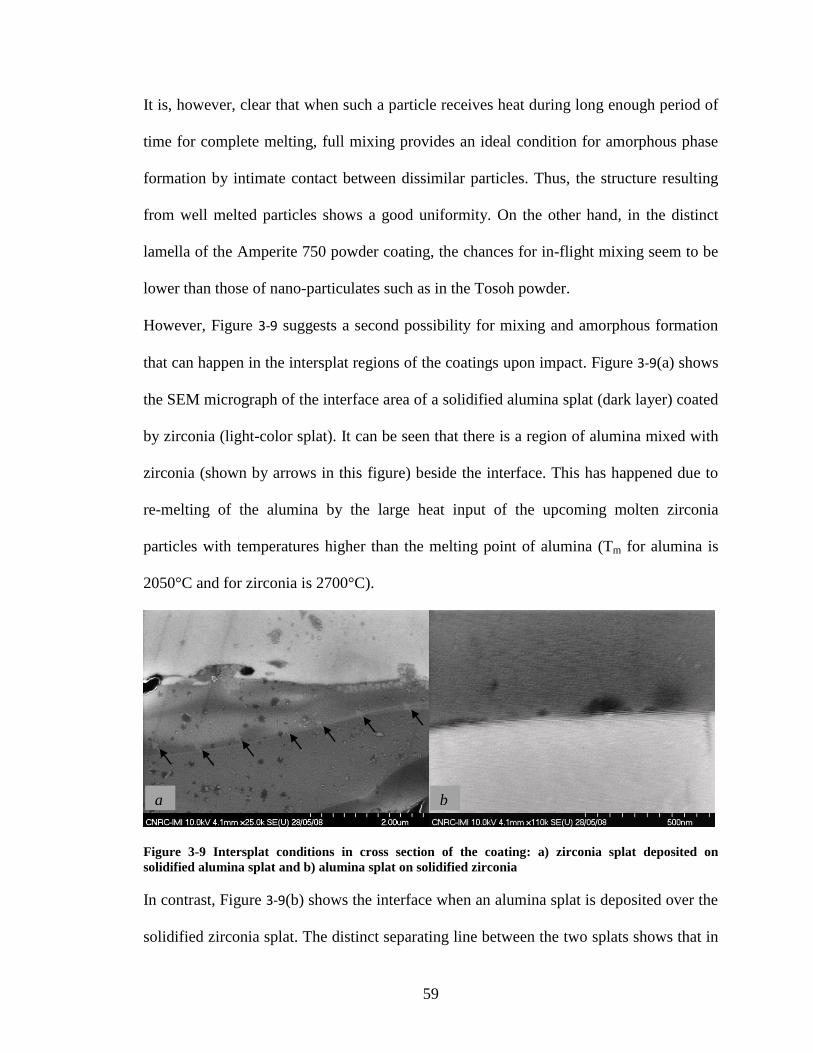
59
It is, however, clear that when such a particle receives heat during long enough period of
time for complete melting, full mixing provides an ideal condition for amorphous phase
formation by intimate contact between dissimilar particles. Thus, the structure resulting
from well melted particles shows a good uniformity. On the other hand, in the distinct
lamella of the Amperite 750 powder coating, the chances for in-flight mixing seem to be
lower than those of nano-particulates such as in the Tosoh powder.
However, Figure 3-9 suggests a second possibility for mixing and amorphous formation
that can happen in the intersplat regions of the coatings upon impact. Figure 3-9(a) shows
the SEM micrograph of the interface area of a solidified alumina splat (dark layer) coated
by zirconia (light-color splat). It can be seen that there is a region of alumina mixed with
zirconia (shown by arrows in this figure) beside the interface. This has happened due to
re-melting of the alumina by the large heat input of the upcoming molten zirconia
particles with temperatures higher than the melting point of alumina (Tm for alumina is
2050°C and for zirconia is 2700°C).
Figure 3-9 Intersplat conditions in cross section of the coating: a) zirconia splat deposited on
solidified alumina splat and b) alumina splat on solidified zirconia
In contrast, Figure 3-9(b) shows the interface when an alumina splat is deposited over the
solidified zirconia splat. The distinct separating line between the two splats shows that in
a b
60
this case such a mixed region has not formed. Amorphous phase formation at the
interface area of the zirconia splat on the solid NiCoCrAlY surface was previously
reported by Bartuli et al. [104]. They explained this as the result of re-melting and
intermixing of aluminium and other bound coat elements into the upcoming zirconia
splat. These observations, however, do not override the possibility of in-flight mixing in
this kind of particle.
In mixing and amorphous phase formation upon impact, it should be considered that the
total area of the interfaces (involved in the interface mixing) compared with the entire
bulk of the splats (involved in the in-flight mixing) is limited. In addition, in this kind of
mixing, it is mainly the splat with higher melting point that causes the intermixing upon
impact. Thus, the chances for amorphous formation in this way are considerably lower
than in the case of in-flight mixing.
3.3. Phase Analysis and Amorphous Phase
Contents
The measurement of the crystallization peak area in DSC graphs from the two powders
shows an amount of 109 units for Tosoh powder coating, against 49 units for Amperite
750 powder coating. This indicates a considerably higher amorphous content within the
coating by Tosoh powder, which is simply due to the enhanced mixing resulting from the
intimate contact between dissimilar nanometric size particulates.
According to the linear relation introduced in section 2.5.2.3 for the estimation of the
amorphous content, a line slope of 0.4 can be used to convert the DSC results into XRD
data. Based on this, the estimated amorphous phase for coating of Tosoh powder is less
than 44 vol%. An approximation of the unmolten portion of the structure for Tosoh
61
coatings was possible using image analysis technique (assuming the area percentage to be
equal to volume percent), which shows less than 25 vol% for unmolten part. The balance,
equal to 31 vol% of the structure, which is neither amorphous nor unmolten solid, has to
be in the form of solid solution formed according to the mechanism described above. This
will be further investigated using lattice parameter measurements.
Figure 3-10 shows XRD patterns of the coatings from both powders, and the observed
structures of the coatings are compared with the 7YSZ coating deposited by the same
spray conditions. In the patterns of Figure 3-10(a) and (b), stabilized zirconia, either with
alumina or without it, presents tetragonal structure as previously observed in APS process
[19,105]. In the graph for Tosoh powder coating shown in Figure 3-10(b), although the 3
mol% yttria is just enough for partial stabilization, the stabilizing role of alumina
dissolution in this structure has completely prevented any formation of monoclinic
zirconia. By contrast, the XRD pattern of the Amperite 750 coating in Figure 3-10(c)
shows a considerable amount of monoclinic phase. This is due to unmolten feed powders,
the absence of yttria stabilizing agent, and the lack of extended dissolution of alumina in
zirconia splats as seen in the micrograph in Figure 3-8(c).
Quantitative evaluation of unit cell parameters using the PowderCell program [99] allows
comparison of the lattice parameters a and c for 8 wt% YSZ-60 wt% alumina with those
of 8 wt% YSZ without the addition of alumina. It was found that parameter a decreases
from 3.6345 to 3.6306 and parameter c from 5.1196 to 5.0928. This suggests that the
dissolution of alumina into tetragonal zirconia has to be substitutional so that the smaller
radius of alumina has resulted in reduced parameters. The observed shifting in Tosoh
powder coating with tetragonal structure has some deviation from the report of
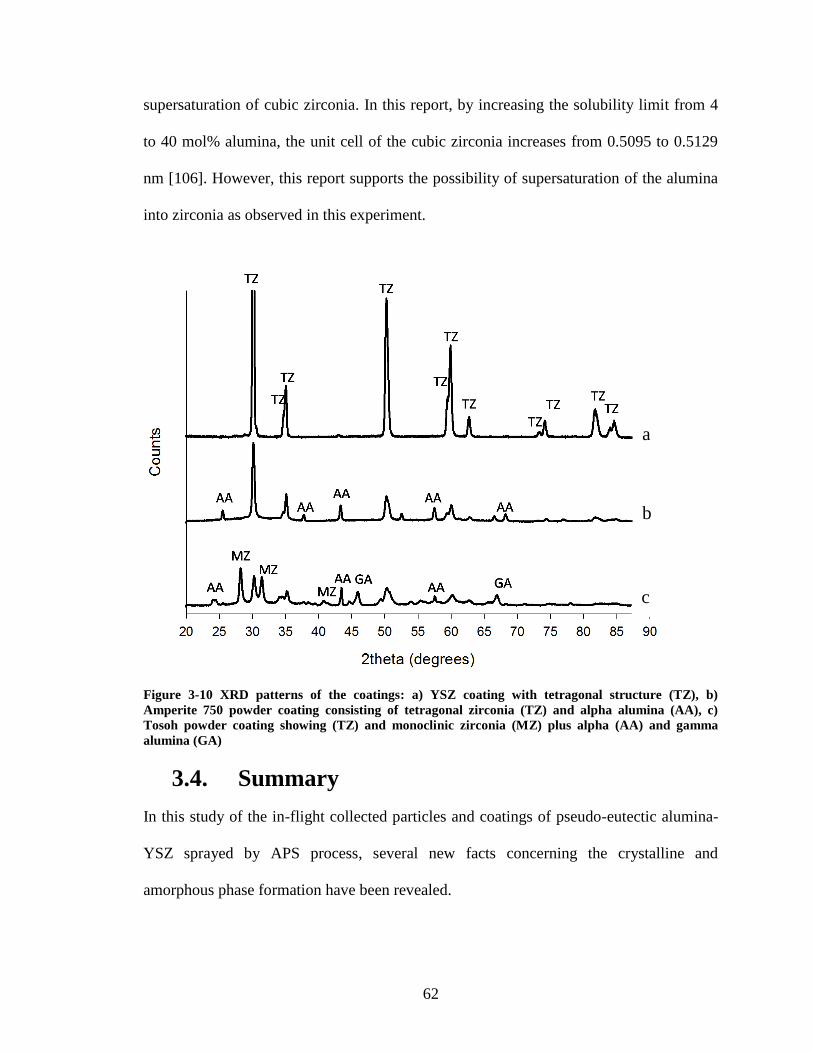
62
supersaturation of cubic zirconia. In this report, by increasing the solubility limit from 4
to 40 mol% alumina, the unit cell of the cubic zirconia increases from 0.5095 to 0.5129
nm [106]. However, this report supports the possibility of supersaturation of the alumina
into zirconia as observed in this experiment.
Figure 3-10 XRD patterns of the coatings: a) YSZ coating with tetragonal structure (TZ), b)
Amperite 750 powder coating consisting of tetragonal zirconia (TZ) and alpha alumina (AA), c)
Tosoh powder coating showing (TZ) and monoclinic zirconia (MZ) plus alpha (AA) and gamma
alumina (GA)
3.4. Summary
In this study of the in-flight collected particles and coatings of pseudo-eutectic alumina-
YSZ sprayed by APS process, several new facts concerning the crystalline and
amorphous phase formation have been revealed.
a
b
c
63
Since the sizes of feed particles and of particles collected after spraying were constant, it
can be proposed that in dry deposition of the powders by APS process, no considerable
fragmentation of the particles in the plasma jet has happened.
The formation of supersaturated solid solution of alumina-YSZ was observed in the
collected particles. The cellular grains nucleated on the pores, and solidification at slow
rates started from inside the melted particle, but these grains were stopped at the border
of the eutectic solidification front without releasing their excessive solute atoms, which in
this case would have to diffuse into the solid rather than melt. Unit cell parameter
measurements based on XRD patterns supported the formation of such a crystalline phase
in the coating. This can be proposed as a new source of crystallinity in the sprayed
coatings. Moreover, it suggests that in addition to amorphous phase, some of the alumina,
which is absent in some XRD patterns, can be dissolved in crystalline zirconia phase with
surprisingly high ratios (as high as eutectic composition).
Two major sources of amorphous phase were introduced. They include the in-flight
melting and mixing of dissimilar materials, in addition to upon-impact mixing when there
is a considerable difference between the melting points of the two components.
Segregation of zirconia from alumina in unmolten Tosoh particles and its migration
toward the exterior regions of the particle, which was previously reported in melted
particles, was also found in solid state. The reason is suggested to be the higher polarity
of the zirconia molecules in the electric field of the ionic plasma environment.
Agglomerates of nano-particulates yielded higher amounts of amorphous phase. Thus for
the sake of amorphous studies and enhancement of this phase in the coatings, application

64
of nano-powders using the suspension plasma spray process was selected to be used for
the remaining parts of the work.
65
Chapter 4 Suspension Plasma Spray Coating
Microstructure and Crystalline/Non-
Crystalline Structures and Transformations
4.1. Controlling the Microstructure of SPS
Coatings and Resulting Properties
Since SPS is a newly developed process, there is not enough information on the optimum
condition for production of sound coatings. Therefore, the main goal of this part of the
study was to identify the major parameters in the SPS process that can be used in
manipulating the microstructure and help production of coatings with favourable integrity
and reproducibility. To this end, Taguchi statistical method [107] has been used in design
of experiment (DOE) to evaluate the importance of seven selected variables in
microstructural characteristics of the coatings. The variables included feed, plasma torch
and substrate-related parameters. The need to investigate a wide range of variables with
the minimum number of experimental runs suggested the application of this DOE [107].
The variables and their two selected levels are listed in Table 4-1. Among the variables in
this table, the levels for solid content, torch condition and feed rate were selected based
on the initial data suggested by the torch supplier, followed by preliminary trial and error
to establish favourable working conditions. Additionally, the substrate roughness was in
the range of what is used in the industry, and the robot speed was changed from medium
to the maximum obtainable. The microstructural features and in-flight particle
characteristics on which the effects of variables are studied include:
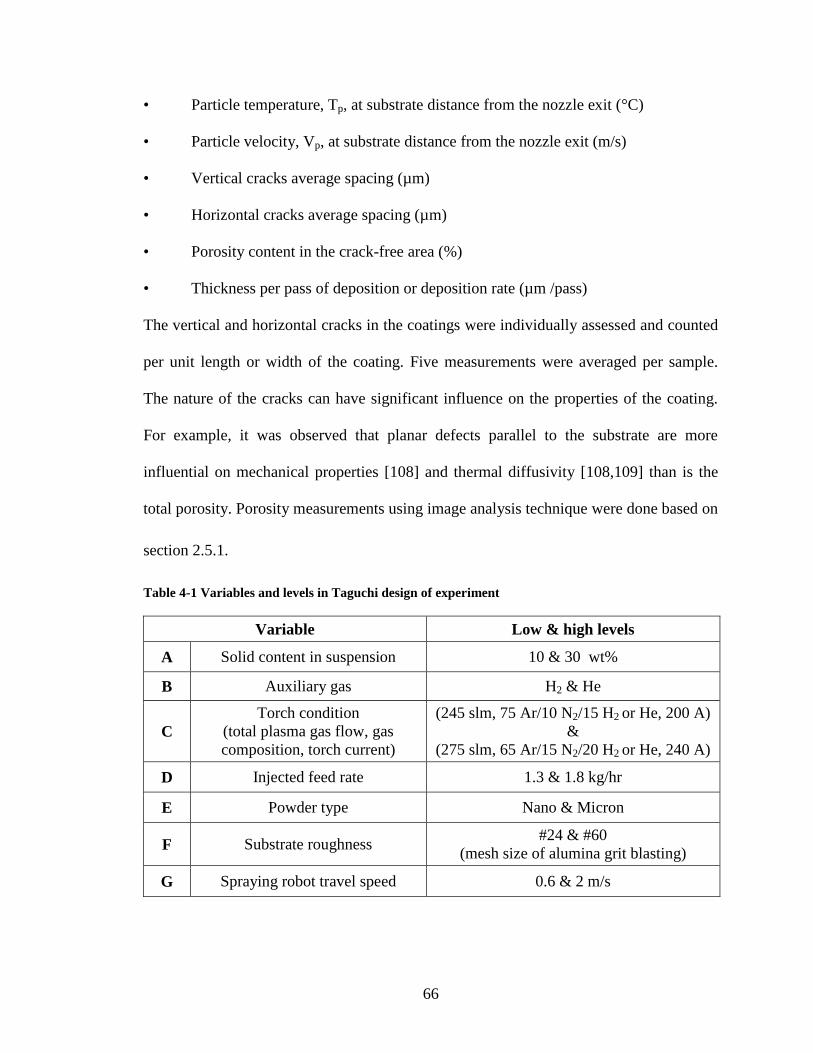
66
• Particle temperature, Tp, at substrate distance from the nozzle exit (°C)
• Particle velocity, Vp, at substrate distance from the nozzle exit (m/s)
• Vertical cracks average spacing (µm)
• Horizontal cracks average spacing (µm)
• Porosity content in the crack-free area (%)
• Thickness per pass of deposition or deposition rate (µm /pass)
The vertical and horizontal cracks in the coatings were individually assessed and counted
per unit length or width of the coating. Five measurements were averaged per sample.
The nature of the cracks can have significant influence on the properties of the coating.
For example, it was observed that planar defects parallel to the substrate are more
influential on mechanical properties [108] and thermal diffusivity [108,109] than is the
total porosity. Porosity measurements using image analysis technique were done based on
section 2.5.1.
Table 4-1 Variables and levels in Taguchi design of experiment
Variable Low & high levels
A Solid content in suspension 10 & 30 wt%
B Auxiliary gas H2 & He
C
Torch condition
(total plasma gas flow, gas
composition, torch current)
(245 slm, 75 Ar/10 N2/15 H2 or He, 200 A)
&
(275 slm, 65 Ar/15 N2/20 H2 or He, 240 A)
D Injected feed rate 1.3 & 1.8 kg/hr
E Powder type Nano & Micron
F Substrate roughness #24 & #60
(mesh size of alumina grit blasting)
G Spraying robot travel speed 0.6 & 2 m/s
67
Following the parametric study of the process and the resulting microstructures, the role
of microstructure on the mechanical properties (hardness) and thermal conductivity of the
composite coating was investigated. Vickers micro hardness test according to section
2.3.1 was evaluated for selected samples. Thermal conductivity was evaluated by laser
flash method [93] according to section 2.4.1.
To produce the feed material for SPS coating, first the nano-size powders were
proportionally mixed to produce 5 mol% YSZ (equal to 8 wt% YSZ), which is the
common TBC material in gas turbines and diesel engines. The powders used in this
mixture included 3 mol% YSZ nano-power (Nano-Composite Powder, Inframat
Advanced Materials, Farmington, USA; nominal size 30-60 nm) and 8 mol% YSZ
(Nano-Composite Powder, Inframat Advanced Materials, Farmington, USA; size 30-60
nm). The resulting doped zirconia powders were then mixed with two different sizes of
alumina powders. The alumina component was either nano-size (Nanostructured &
amorphous Materials Inc. USA; nominal size 27-43 nm) or micron-size (Malakoff,
Texas, USA; size 1.4 µm). The terms “Nano” and “Micron,” respectively, will be used
here for these mixtures. The mixtures with the larger size powders were ball milled in a
concentrated suspension of 60 wt% solid for 24 hours before dilution to the final solid
concentration. This procedure ensured homogeneous mixing and stabilization of the
suspension. The nano-mixture was only milled for the same period for enhanced stability
of the suspension. A weight ratio of 60/40 for the alumina/8 wt% YSZ was prepared and
suspended in ethanol at 10 and 30 wt% concentrations. This resulted in four suspensions
with different powder size ranges and solid contents. Suspension dispersion was done
68
using 9 cc Poly-ethylene-eimine (MW 25000, Alfa Aesar, Ward Hill, MA) and 4.5 cc
Nitric acid (both with 10% concentration) for every 150 g of solids.
The wet analyses of the agglomerate size in different suspensions diluted in ethanol
showed that the size ranges were closely comparable regardless of the initial particle size
or solid concentration, and were all in the range of 10 µm. Specifically, the measurements
showed 0.2~3 µm in 30%wt solid of micron-sized particle suspension, 0.2~9 µm in 10
wt% solid of the same powder and 0.2~5 µm in nano-size powder in 10 wt% solid
suspension.
4.1.1. Roles of the Parameters on Microstructure
The summary of the evaluation results is shown in bar chart diagrams in Figure 4-1. The
first column for every variable shows the effect of its variation from the low level to high
level (as defined in Table 4-1) on the corresponding parameter shown in this figure. The
second column for each variable is the standard error to help compare the significance of
the effects with the error. In this figure, the increasing or decreasing effects are specified
as follows. When changing the variable (e.g., solid weight%) from low to high level has
caused an increase in the specific structural parameter (e.g., vertical crack spacing) in the
coating, the corresponding column is shown on the positive side of the Y-axis, and the
decreasing effects of variables on the measured parameter are shown on the negative side
of this axis.
By relating the particle temperature and velocity to the spray conditions, some general
trends can be observed and will be discussed in the following sections.
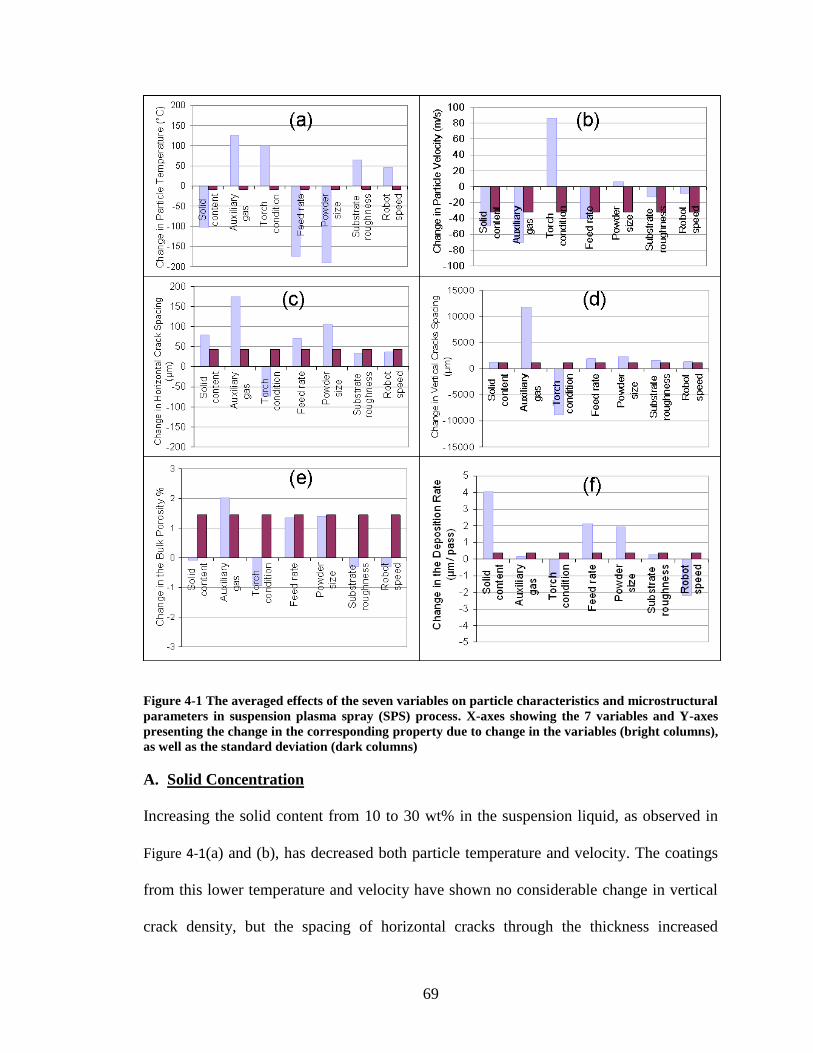
69
Figure 4-1 The averaged effects of the seven variables on particle characteristics and microstructural
parameters in suspension plasma spray (SPS) process. X-axes showing the 7 variables and Y-axes
presenting the change in the corresponding property due to change in the variables (bright columns),
as well as the standard deviation (dark columns)
A. Solid Concentration
Increasing the solid content from 10 to 30 wt% in the suspension liquid, as observed in
Figure 4-1(a) and (b), has decreased both particle temperature and velocity. The coatings
from this lower temperature and velocity have shown no considerable change in vertical
crack density, but the spacing of horizontal cracks through the thickness increased
70
slightly, as presented in the diagrams of Figure 4-1(c) and (d). Within the range of
porosity detectable by the method used in these experiments (as explained in section
2.5.1), the porosity content of the coatings was not affected by the solid concentration.
However, the solid concentration is found to be the most effective factor on deposition
rate, as shown in Figure 4-1(e) and (f). The higher solid content in the liquid feed has
produced thicker layers per pass, which can be translated to a higher rate of material
deposition.
B. Plasma Auxiliary Gas
The plasma auxiliary gas was changed from the commonly used hydrogen to helium, to
induce more porous microstructures suitable for applications like thermal barrier
coatings. Helium is known to increase the plasma stability with its high viscosity at high
temperature [5]. It also has a higher conductivity than hydrogen and generally produces a
wider hot core area that promotes entrapment of a larger number of small particles, which
could otherwise escape from the particle jet without deposition. The observed effects of
replacing hydrogen with helium are summarized in Figure 4-1(a) to (f).
Interestingly, changing from hydrogen to helium auxiliary gas has shown the most drastic
effect on almost all of the measured parameters in this work. By replacing H2 with He
gas, the average particle temperature increases and the average velocity decreases. One
by one comparison, however, provides additional information, which may be extracted
from Figure 4-2. This figure shows that at the same plasma torch conditions (in terms of
total gas flow rate, plasma gases ratio and arc current) using He has dropped the resulting
plasma power by 20 to 40 kW. This can be observed in the two different plasma
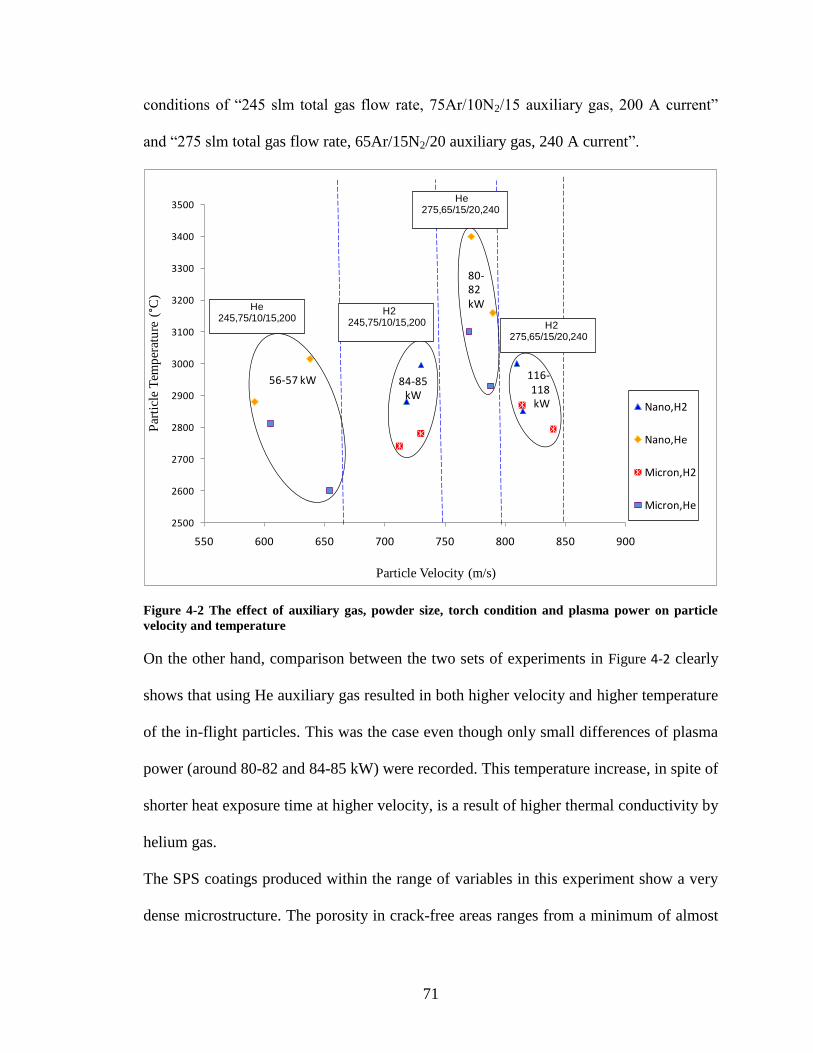
71
conditions of “245 slm total gas flow rate, 75Ar/10N2/15 auxiliary gas, 200 A current”
and “275 slm total gas flow rate, 65Ar/15N2/20 auxiliary gas, 240 A current”.
2500
2600
2700
2800
2900
3000
3100
3200
3300
3400
3500
550 600 650 700 750 800 850 900
Par
ticl
e T
emp
erat
ure
(°C
)
Particle Velocity (m/s)
Nano,H2
Nano,He
Micron,H2
Micron,He
84-85 kW
80-82 kW
56-57 kW
He245,75/10/15,200
H2275,65/15/20,240
116-118 kW
He275,65/15/20,240
H2245,75/10/15,200
Figure 4-2 The effect of auxiliary gas, powder size, torch condition and plasma power on particle
velocity and temperature
On the other hand, comparison between the two sets of experiments in Figure 4-2 clearly
shows that using He auxiliary gas resulted in both higher velocity and higher temperature
of the in-flight particles. This was the case even though only small differences of plasma
power (around 80-82 and 84-85 kW) were recorded. This temperature increase, in spite of
shorter heat exposure time at higher velocity, is a result of higher thermal conductivity by
helium gas.
The SPS coatings produced within the range of variables in this experiment show a very
dense microstructure. The porosity in crack-free areas ranges from a minimum of almost
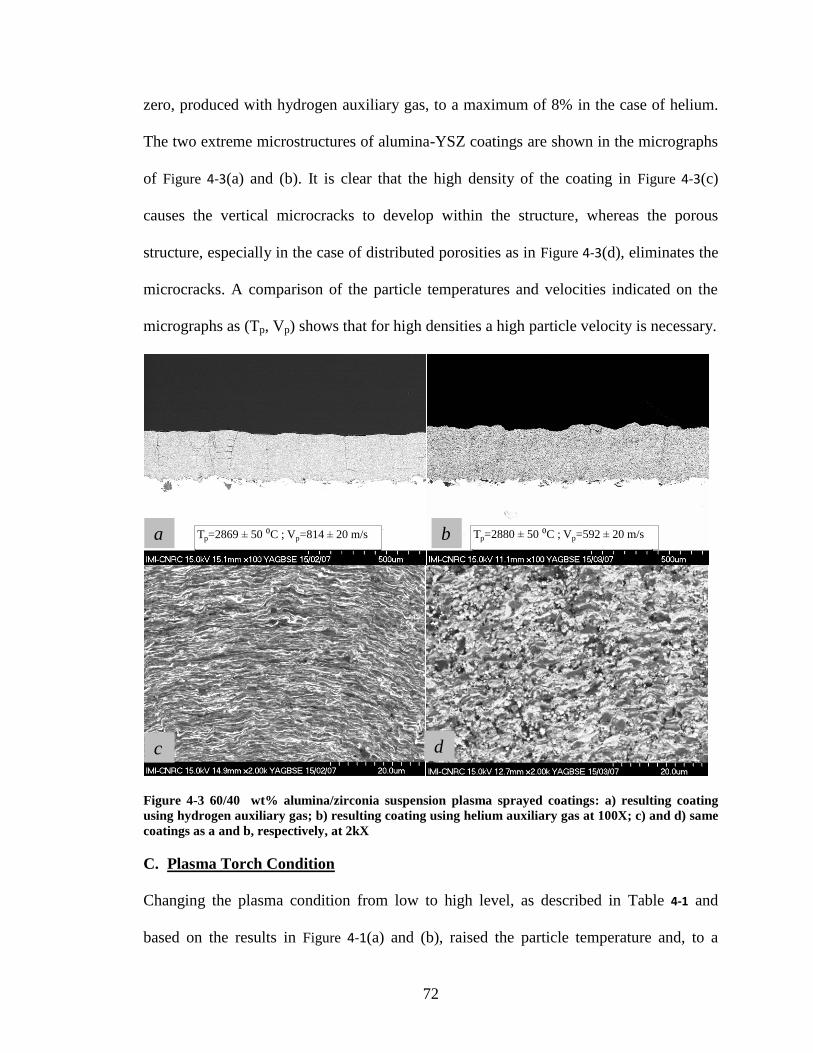
72
zero, produced with hydrogen auxiliary gas, to a maximum of 8% in the case of helium.
The two extreme microstructures of alumina-YSZ coatings are shown in the micrographs
of Figure 4-3(a) and (b). It is clear that the high density of the coating in Figure 4-3(c)
causes the vertical microcracks to develop within the structure, whereas the porous
structure, especially in the case of distributed porosities as in Figure 4-3(d), eliminates the
microcracks. A comparison of the particle temperatures and velocities indicated on the
micrographs as (Tp, Vp) shows that for high densities a high particle velocity is necessary.
Tp=2869 50 ⁰C ; Vp=814 20 m/s Tp=2880 50 ⁰C ; Vp=592 20 m/s
Figure 4-3 60/40 wt% alumina/zirconia suspension plasma sprayed coatings: a) resulting coating
using hydrogen auxiliary gas; b) resulting coating using helium auxiliary gas at 100X; c) and d) same
coatings as a and b, respectively, at 2kX
C. Plasma Torch Condition
Changing the plasma condition from low to high level, as described in Table 4-1 and
based on the results in Figure 4-1(a) and (b), raised the particle temperature and, to a
b
d c
a

73
greater degree, increased the particle velocity. At higher particle temperature and
velocity, the density of both vertical and horizontal cracks increases. This may originate
from formation of thinner splats that can more readily form vertical cracks during the
cooling process. The horizontal cracks branch from the vertical cracks. In this way, the
similar behaviour from both types of cracks may also be justified. The porosity remains
invariant and the deposition rate decreases slightly.
A direct comparison, however, is difficult since the parameters of spray torch condition
and auxiliary gas are not independent. To gain further insight into the effect, deposition
runs can be grouped into four ranges of plasma power of 56-57, 80-82, 84-85 and 116-
118 kW. Accordingly, the effect of plasma power on the particle characteristics is
summarized in Figure 4-4. In this figure and its following discussion, the roles of other
parameters are not considered. However, other parameters could have played their role in
variation of the outcomes among the grouped samples (inside the ellipses in Figure 4-4).
It can be seen that an increase in plasma power generally increases the particle velocity.
At similar plasma power (81-84 kW), particle velocity in helium exceeds that in
hydrogen, as shown in Figure 4-4(a). Nonetheless, the highest particle velocities are
obtained with hydrogen. The temperature of the particles, however, does not follow a
definitive trend, as seen in Figure 4-4(b). Generally, it was observed that the feed
parameters are better tools for controlling the particle temperature than are the torch
operating parameters.
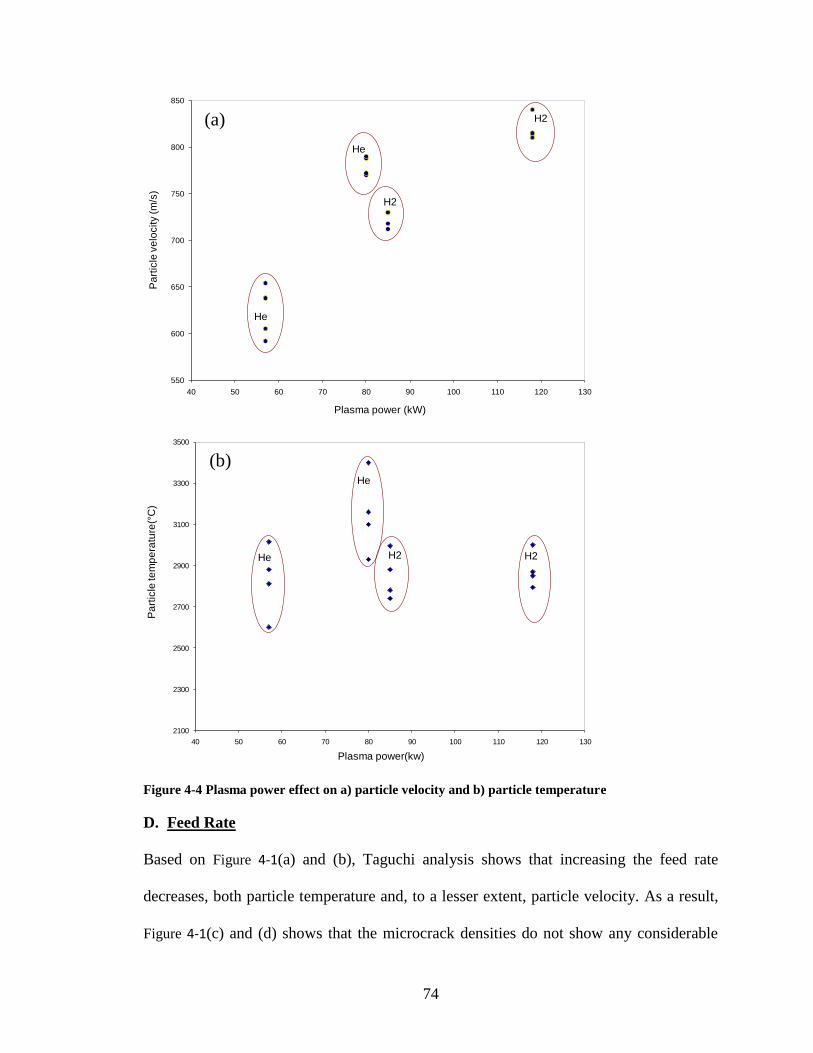
74
550
600
650
700
750
800
850
40 50 60 70 80 90 100 110 120 130
Pa
rtic
le v
elo
city (m
/s)
Plasma power (kW)
H2
He
He
H2
2100
2300
2500
2700
2900
3100
3300
3500
40 50 60 70 80 90 100 110 120 130
Pa
rtic
le te
mp
era
ture
(°C
)
Plasma power(kw)
H2
He
H2He
Figure 4-4 Plasma power effect on a) particle velocity and b) particle temperature
D. Feed Rate
Based on Figure 4-1(a) and (b), Taguchi analysis shows that increasing the feed rate
decreases, both particle temperature and, to a lesser extent, particle velocity. As a result,
Figure 4-1(c) and (d) shows that the microcrack densities do not show any considerable
(a)
(b)
75
variation. The porosity also was not affected by this change, as represented in Figure
4-1(e). This characteristic of the process that can tolerate the increase of the feed rate and
deposition rate without introducing more structural defects in the coating is promising for
higher production rates. It is noteworthy that the feed rate and the solid content have
shown similar effects and may be interchangeably used in controlling the coating
microstructure in the SPS process.
E. Powder Size Distribution
The effect of the initial particle size range on the coating microstructure was studied by
changing nano- to micron-size alumina powders mixed with nano-size 8 wt% YSZ. This
variation showed a recurring drop in particle temperature (Tp), in spite of the similar
agglomerate size in the suspension that can be seen in Figure 4-2 and resulting average
particle temperature shown in Figure 4-1(a). However, Figure 4-1(b) shows no significant
velocity drop due to feed particle size change. The lower temperature from larger particle
feed stock may be explained by the formation of dense particles within the plasma plume
in comparison with the hollow particles that can result from nano-size suspension feed
stock [110]. A second reason for higher Tp can be that the nano-particles which form
loose aggregates are of considerably higher surface area, thus showing lower energy
barrier for melting than solid micron-size particles in the aggregates. Experiencing the
same velocity and spray distance, the nano-aggregates, more rapidly melted, will have
more possibility to rise to higher temperatures.
In the resulting coating microstructure, while the density of vertical microcracks
remained almost constant (Figure 4-1(d)), the horizontal microcrack spacing increased
remarkably (Figure 4-1(c)). The lower microcrack densities observed with larger particles
76
can also be justified by the lower Tp, as the high particle temperatures can cause higher
thermal stresses. The porosity content looks indifferent to the powder size variation
(Figure 4-1(e)), which is somewhat unexpected. Considering the large standard error, a
possible underlying effect may not be captured. The limited sensitivity of the porosity
measurement method, also, has restricted the observation of the smaller pores (nano-
pores) that might have affected the results.
F. Substrate Roughness
Keeping in mind that the substrate roughness has no effect on in-flight particle
characteristics, this experiment shows that its variation is one of the least effective
parameters on the microstructural features, as seen in Figure 4-1. Neither the porosity
(Figure 4-1(e)) nor the deposition rate (Figure 4-1(f)) has changed, and even the
microcrack densities (vertical/ horizontal; Figure 4-1(c/d)) have not been considerably
altered by changing the substrate roughness.
Additionally, the averages of coating roughness on the substrates blasted with #60
alumina grit (Ra=3 to 4 µm) and #24 grit (Ra=6 to 7 µm) are almost the same, namely
Ra=5.5 and 6 µm, respectively. The absence of strict correlation between the initial
substrate roughness and the resulting coatings roughness is attributed to the small
aggregate sizes comparable with the size of substrate roughness. The small particles at
high velocity diffuse into the roughness asperities and after the first few runs of
deposition the role of the substrate roughness diminishes significantly. This
independency of the roughness between the substrate and coating suggests that the
coating roughness can be controlled by spray condition for various substrate roughnesses.
On the other hand, changing the initial particle size from nano- to micron-size powders
77
causes a slightly more considerable effect on coating roughness, namely, from Ra=5.1 to
6.3 µm.
G. Robot Travel Speed
The robot travel speed has changed neither the porosity (Figure 4-1(e)) nor the
vertical/horizontal microcrack density (Figure 4-1(d/c)). A drop in deposition rate (Figure
4-1(f)) is simply related to less mass deposition time at higher robot travel speed.
The importance of the microstructural characteristics can be revealed when their effect on
mechanical and/or thermal properties is investigated. Therefore, the role of porosity
changes (due to variation of particle velocity) on hardness, as well as thermal diffusivity
of the coatings was studied and summarized as follows.
4.1.2. The Effect of Porosity on Coating Hardness
Figure 4-5(a) presents the effect of particle velocity on the coating density, showing that
coating density increases as a result of higher particle velocity. High particle velocity
provides higher momentum for the splat flattening and results in enhanced intersplat
bonding that has clearly improved the hardness of the resulting coating as illustrated in
Figure 4-5 (b). This figure shows that with even less than 5% porosity the coating
hardness drops to less than one third of the highly dense structure.
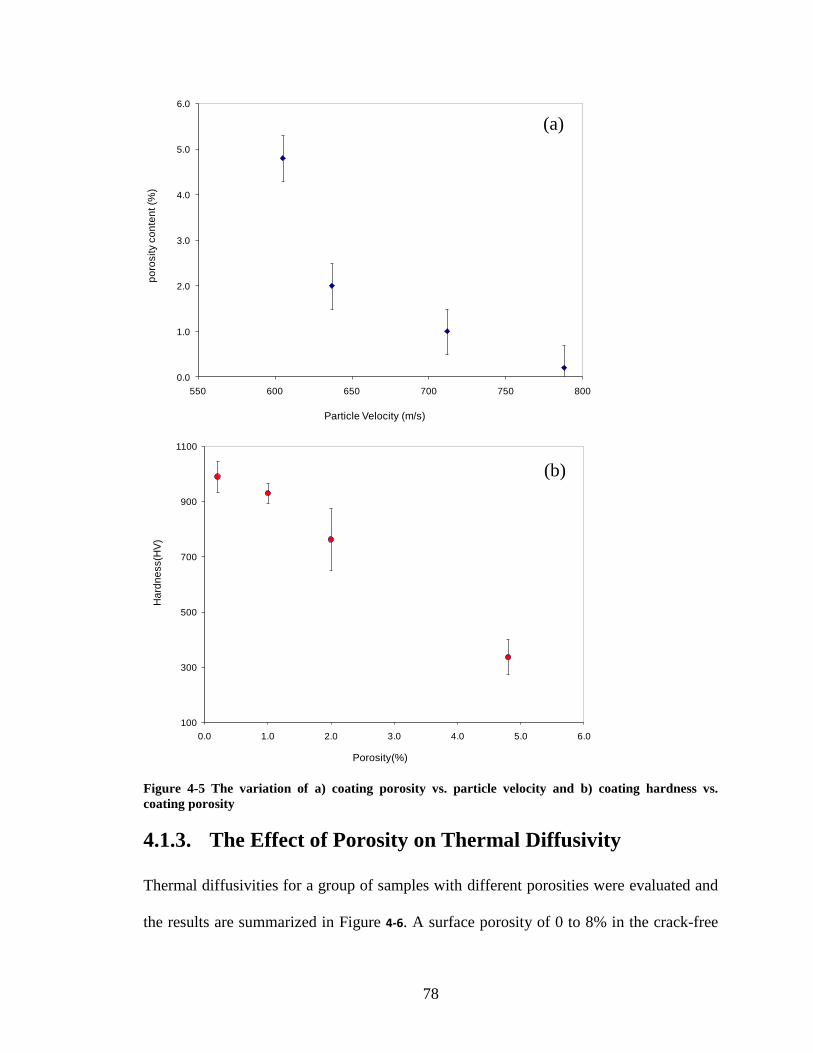
78
0.0
1.0
2.0
3.0
4.0
5.0
6.0
550 600 650 700 750 800
po
rosity c
on
ten
t (%
)
Particle Velocity (m/s)
100
300
500
700
900
1100
0.0 1.0 2.0 3.0 4.0 5.0 6.0
Ha
rdn
ess(H
V)
Porosity(%)
Figure 4-5 The variation of a) coating porosity vs. particle velocity and b) coating hardness vs.
coating porosity
4.1.3. The Effect of Porosity on Thermal Diffusivity
Thermal diffusivities for a group of samples with different porosities were evaluated and
the results are summarized in Figure 4-6. A surface porosity of 0 to 8% in the crack-free
(b)
(a)
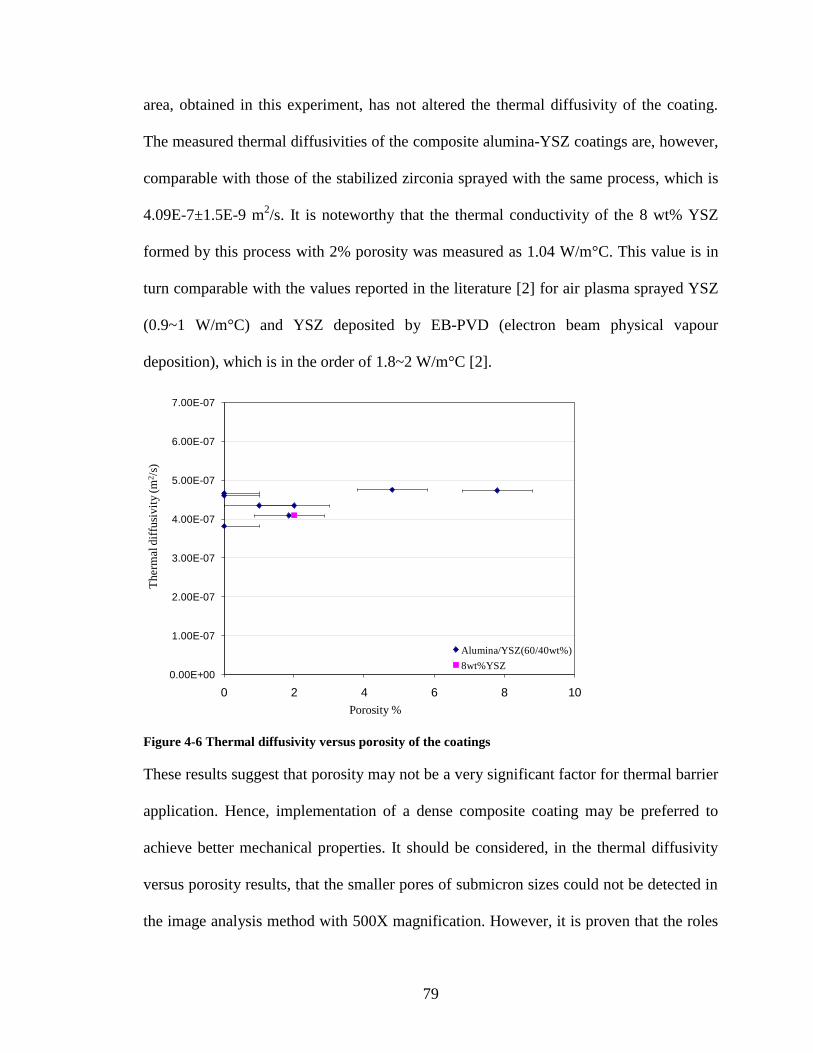
79
area, obtained in this experiment, has not altered the thermal diffusivity of the coating.
The measured thermal diffusivities of the composite alumina-YSZ coatings are, however,
comparable with those of the stabilized zirconia sprayed with the same process, which is
4.09E-7±1.5E-9 m2/s. It is noteworthy that the thermal conductivity of the 8 wt% YSZ
formed by this process with 2% porosity was measured as 1.04 W/m°C. This value is in
turn comparable with the values reported in the literature [2] for air plasma sprayed YSZ
(0.9~1 W/m°C) and YSZ deposited by EB-PVD (electron beam physical vapour
deposition), which is in the order of 1.8~2 W/m°C [2].
0.00E+00
1.00E-07
2.00E-07
3.00E-07
4.00E-07
5.00E-07
6.00E-07
7.00E-07
0 2 4 6 8 10
Th
erm
al d
iffu
siv
ity
(m
2/s
)
Porosity %
Alumina/YSZ(60/40wt%)
8wt%YSZ
Figure 4-6 Thermal diffusivity versus porosity of the coatings
These results suggest that porosity may not be a very significant factor for thermal barrier
application. Hence, implementation of a dense composite coating may be preferred to
achieve better mechanical properties. It should be considered, in the thermal diffusivity
versus porosity results, that the smaller pores of submicron sizes could not be detected in
the image analysis method with 500X magnification. However, it is proven that the roles
80
of size, shape and densities of the intersplat pores on thermal diffusivity are more
important than the total porosity content [111].
In conclusion, in this part of the study, the importance of key variables in suspension
plasma spraying of multi-component alumina-YSZ coatings was evaluated. It was
observed that the variables that directly affect the particle velocity and temperature were
the most influential on the microstructure. Considering the greater significance of particle
velocity in this regard, variables with more prominent effect on this parameter were of
prime importance. On the other hand, the substrate roughness and robot speed do not play
any role on neither Tp nor Vp, and consequently do not affect the coating microstructure.
It was experienced that for variations in particle velocity, the plasma torch parameters,
e.g., total gas flow rate and plasma gas composition, were most important. On the other
hand, particle temperature is more readily manipulated by feed parameters like solid
content, particle size and feed rate.
Helium auxiliary gas was successfully used as a tool to achieve a wider microstructural
variety in the SPS coatings. It especially helped to introduce higher porosity content in
the coating. The porosity, however, increases at the expense of reducing the coating
hardness. Thermal diffusivity in SPS coating for a multi-component system of 60
alumina / 40 YSZ is reasonably low and it does not change with up to 8% porosity.
4.2. Phase Formation and Transformations in SPS
Coatings
This part of the study is to investigate how as-deposited coating structure, either
crystalline or non-crystalline, can vary according to the spray conditions. For this
purpose, the samples provided in section 4.1 were used. The initial powders as well as the
81
coating samples went through XRD and the coatings underwent DSC evaluations
according to sections 2.5.2.1 and 2.5.2.2 for amorphous phase and crystalline phase
analysis respectively.
Investigation of the XRD patterns from the powders used in this experiment shows that
the zirconia powder consists of cubic structure and the alumina nano-powder contains
both rhombohedral (i.e., α) and cubic (i.e., γ) structure. The ratio of α/γ, according to the
supplier, is equal to 95/5 wt%, while the micron-size alumina powder shows only α
structure. The loose nano- and/or micron-size powders were mixed and suspended in
ethanol for injection into the plasma jet. The 13 wt% YSZ nano-powder was also
deposited separately using the same process as a reference point and to investigate the
preferred crystalline structure of the material in SPS process without the alumina
addition. The sample preparation conditions are summarized in Table 4-2. In this table,
also, the resulting plasma power and in-flight particle velocity and temperature are listed.
Table 4-2 Variables evaluated for the effect on phase formation
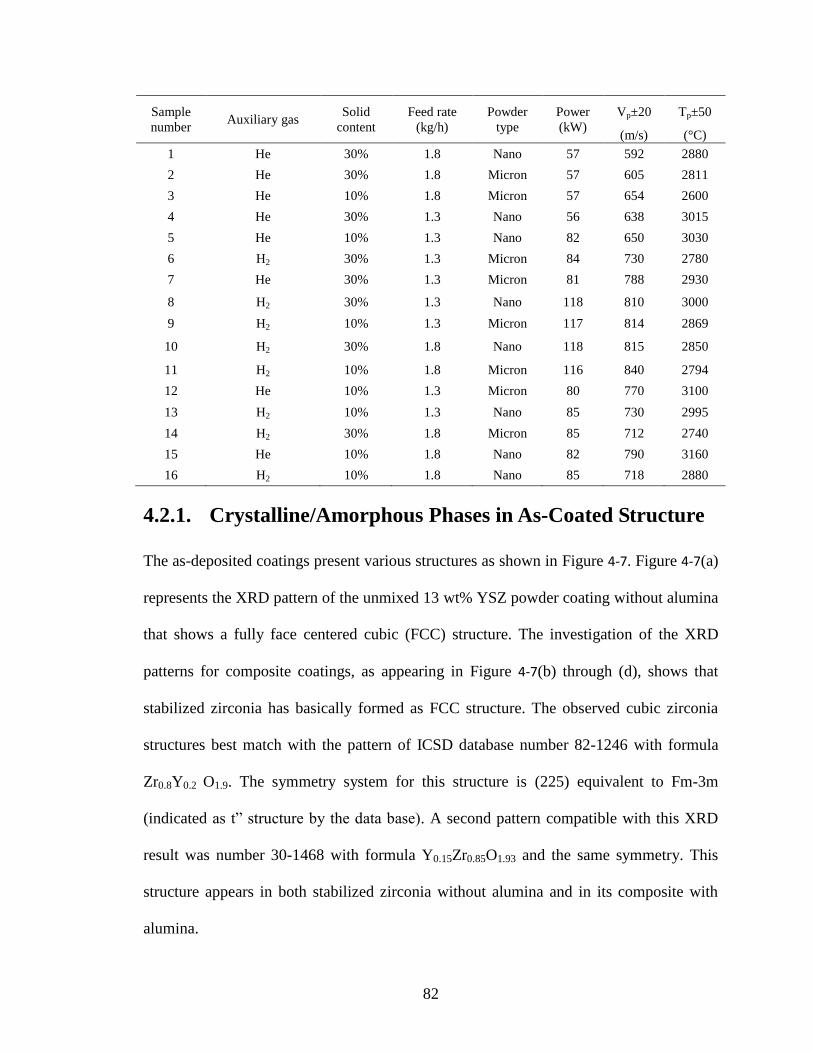
82
Sample
number Auxiliary gas
Solid
content
Feed rate
(kg/h)
Powder
type
Power
(kW)
Vp±20
(m/s)
Tp±50
(°C)
1 He 30% 1.8 Nano 57 592 2880
2 He 30% 1.8 Micron 57 605 2811
3 He 10% 1.8 Micron 57 654 2600
4 He 30% 1.3 Nano 56 638 3015
5 He 10% 1.3 Nano 82 650 3030
6 H2 30% 1.3 Micron 84 730 2780
7 He 30% 1.3 Micron 81 788 2930
8 H2 30% 1.3 Nano 118 810 3000
9 H2 10% 1.3 Micron 117 814 2869
10 H2 30% 1.8 Nano 118 815 2850
11 H2 10% 1.8 Micron 116 840 2794
12 He 10% 1.3 Micron 80 770 3100
13 H2 10% 1.3 Nano 85 730 2995
14 H2 30% 1.8 Micron 85 712 2740
15 He 10% 1.8 Nano 82 790 3160
16 H2 10% 1.8 Nano 85 718 2880
4.2.1. Crystalline/Amorphous Phases in As-Coated Structure
The as-deposited coatings present various structures as shown in Figure 4-7. Figure 4-7(a)
represents the XRD pattern of the unmixed 13 wt% YSZ powder coating without alumina
that shows a fully face centered cubic (FCC) structure. The investigation of the XRD
patterns for composite coatings, as appearing in Figure 4-7(b) through (d), shows that
stabilized zirconia has basically formed as FCC structure. The observed cubic zirconia
structures best match with the pattern of ICSD database number 82-1246 with formula
Zr0.8Y0.2 O1.9. The symmetry system for this structure is (225) equivalent to Fm-3m
(indicated as t” structure by the data base). A second pattern compatible with this XRD
result was number 30-1468 with formula Y0.15Zr0.85O1.93 and the same symmetry. This
structure appears in both stabilized zirconia without alumina and in its composite with
alumina.
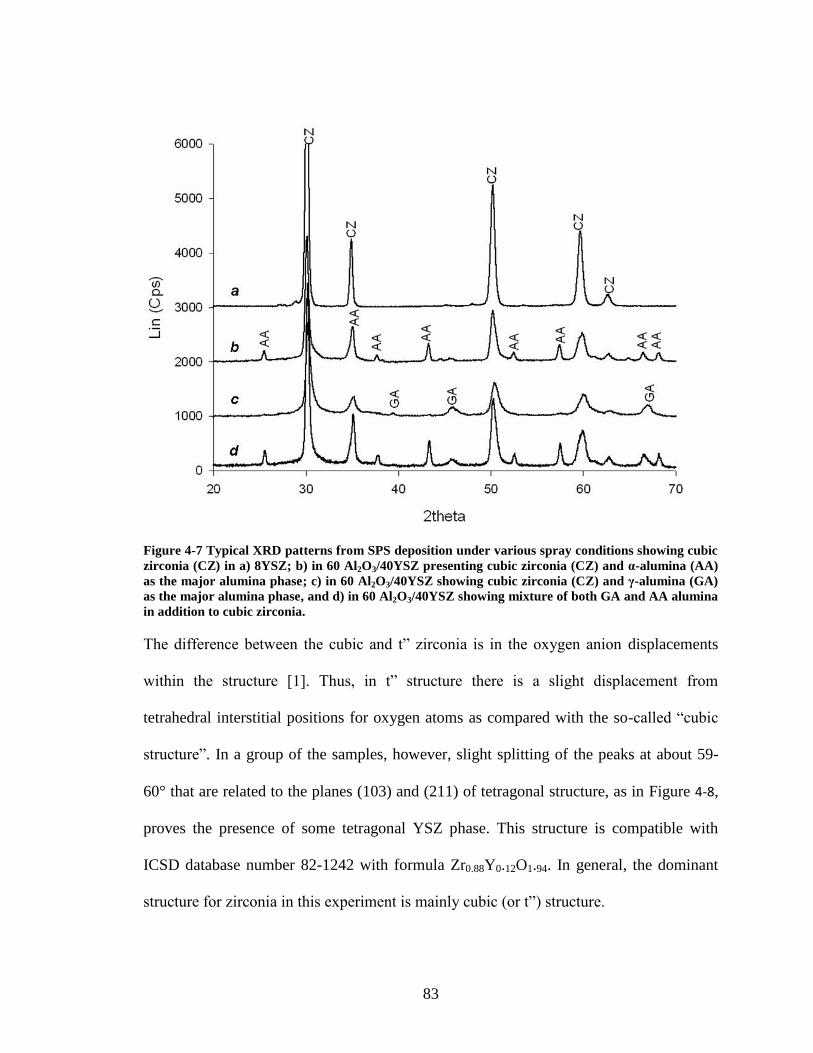
83
Figure 4-7 Typical XRD patterns from SPS deposition under various spray conditions showing cubic
zirconia (CZ) in a) 8YSZ; b) in 60 Al2O3/40YSZ presenting cubic zirconia (CZ) and α-alumina (AA)
as the major alumina phase; c) in 60 Al2O3/40YSZ showing cubic zirconia (CZ) and γ-alumina (GA)
as the major alumina phase, and d) in 60 Al2O3/40YSZ showing mixture of both GA and AA alumina
in addition to cubic zirconia.
The difference between the cubic and t” zirconia is in the oxygen anion displacements
within the structure [1]. Thus, in t” structure there is a slight displacement from
tetrahedral interstitial positions for oxygen atoms as compared with the so-called “cubic
structure”. In a group of the samples, however, slight splitting of the peaks at about 59-
60° that are related to the planes (103) and (211) of tetragonal structure, as in Figure 4-8,
proves the presence of some tetragonal YSZ phase. This structure is compatible with
ICSD database number 82-1242 with formula Zr0.88Y0.12O1.94. In general, the dominant
structure for zirconia in this experiment is mainly cubic (or t”) structure.
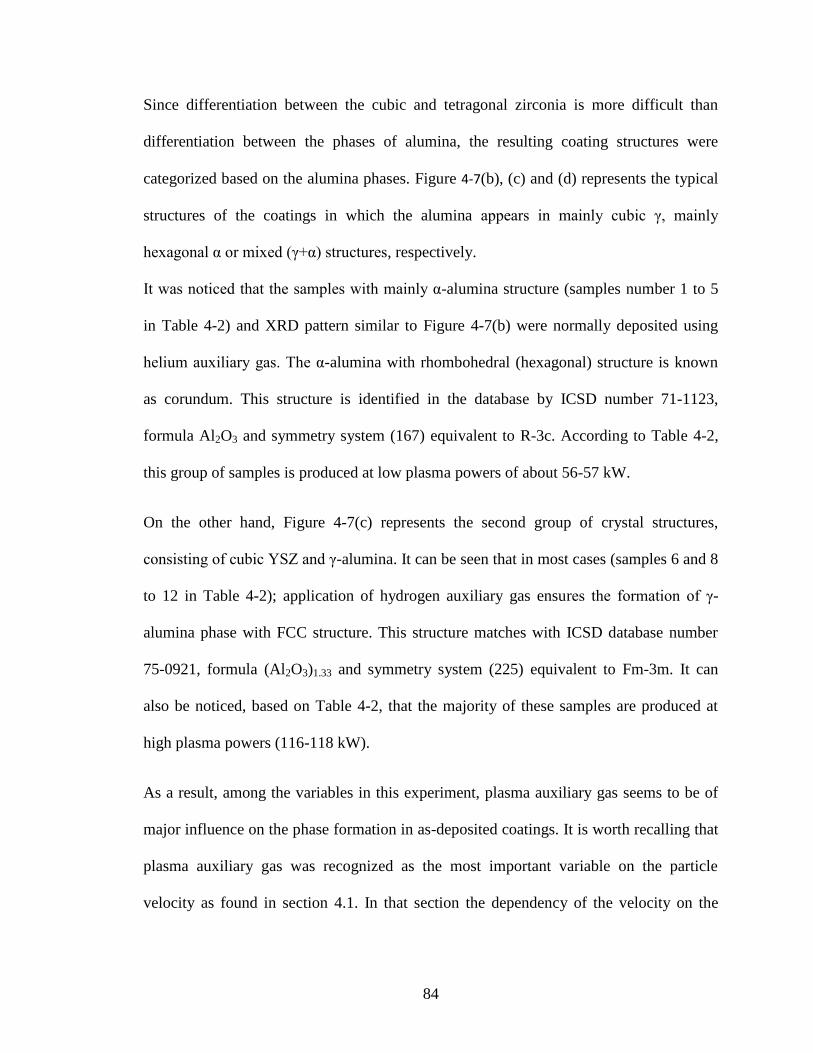
84
Since differentiation between the cubic and tetragonal zirconia is more difficult than
differentiation between the phases of alumina, the resulting coating structures were
categorized based on the alumina phases. Figure 4-7(b), (c) and (d) represents the typical
structures of the coatings in which the alumina appears in mainly cubic γ, mainly
hexagonal α or mixed (γ+α) structures, respectively.
It was noticed that the samples with mainly α-alumina structure (samples number 1 to 5
in Table 4-2) and XRD pattern similar to Figure 4-7(b) were normally deposited using
helium auxiliary gas. The α-alumina with rhombohedral (hexagonal) structure is known
as corundum. This structure is identified in the database by ICSD number 71-1123,
formula Al2O3 and symmetry system (167) equivalent to R-3c. According to Table 4-2,
this group of samples is produced at low plasma powers of about 56-57 kW.
On the other hand, Figure 4-7(c) represents the second group of crystal structures,
consisting of cubic YSZ and γ-alumina. It can be seen that in most cases (samples 6 and 8
to 12 in Table 4-2); application of hydrogen auxiliary gas ensures the formation of γ-
alumina phase with FCC structure. This structure matches with ICSD database number
75-0921, formula (Al2O3)1.33 and symmetry system (225) equivalent to Fm-3m. It can
also be noticed, based on Table 4-2, that the majority of these samples are produced at
high plasma powers (116-118 kW).
As a result, among the variables in this experiment, plasma auxiliary gas seems to be of
major influence on the phase formation in as-deposited coatings. It is worth recalling that
plasma auxiliary gas was recognized as the most important variable on the particle
velocity as found in section 4.1. In that section the dependency of the velocity on the
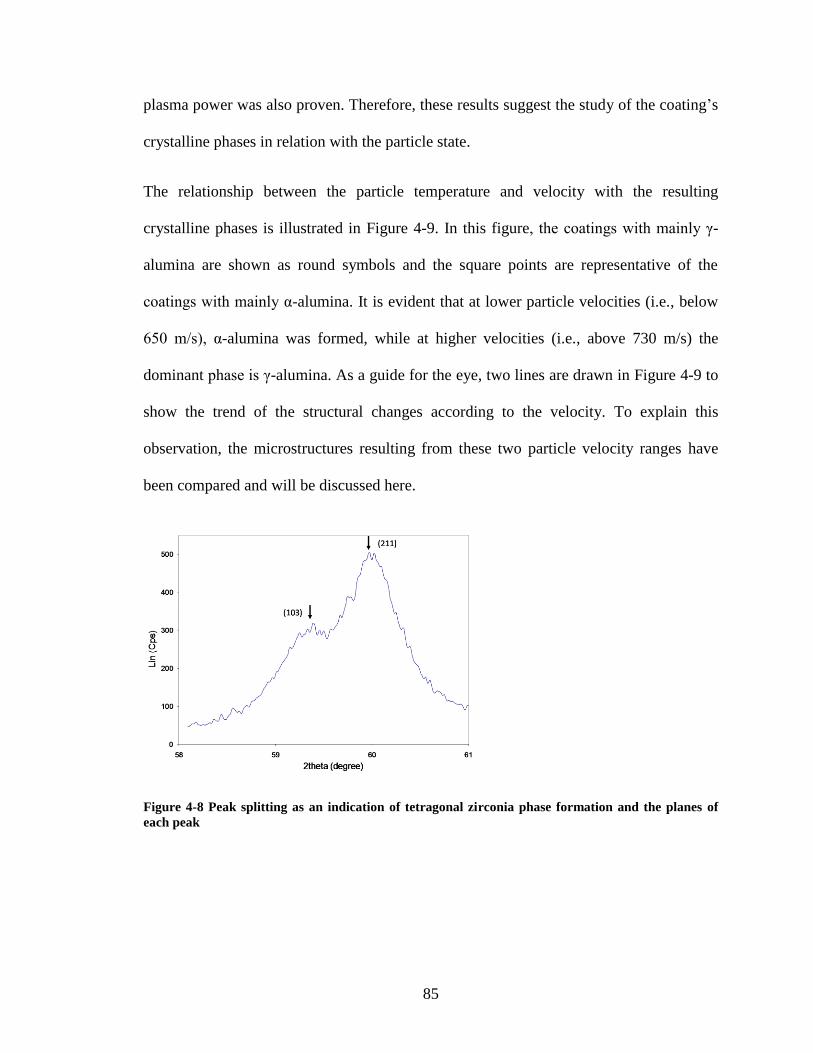
85
plasma power was also proven. Therefore, these results suggest the study of the coating’s
crystalline phases in relation with the particle state.
The relationship between the particle temperature and velocity with the resulting
crystalline phases is illustrated in Figure 4-9. In this figure, the coatings with mainly γ-
alumina are shown as round symbols and the square points are representative of the
coatings with mainly α-alumina. It is evident that at lower particle velocities (i.e., below
650 m/s), α-alumina was formed, while at higher velocities (i.e., above 730 m/s) the
dominant phase is γ-alumina. As a guide for the eye, two lines are drawn in Figure 4-9 to
show the trend of the structural changes according to the velocity. To explain this
observation, the microstructures resulting from these two particle velocity ranges have
been compared and will be discussed here.
Figure 4-8 Peak splitting as an indication of tetragonal zirconia phase formation and the planes of
each peak
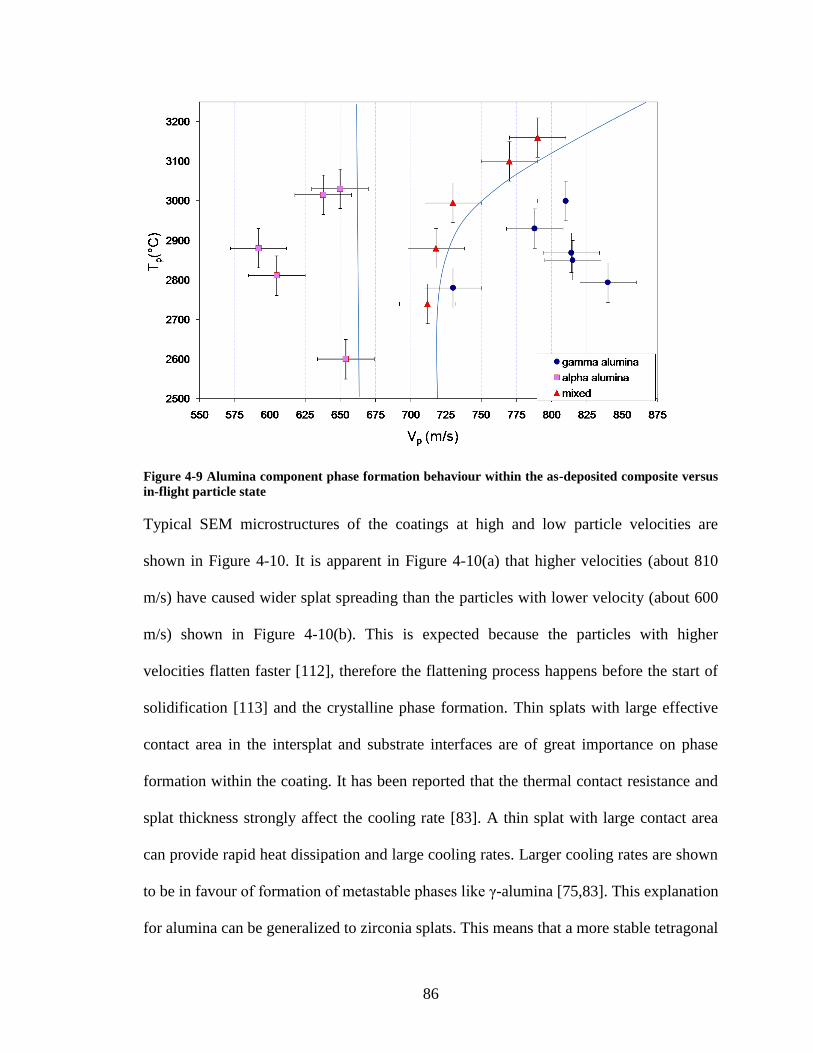
86
Figure 4-9 Alumina component phase formation behaviour within the as-deposited composite versus
in-flight particle state
Typical SEM microstructures of the coatings at high and low particle velocities are
shown in Figure 4-10. It is apparent in Figure 4-10(a) that higher velocities (about 810
m/s) have caused wider splat spreading than the particles with lower velocity (about 600
m/s) shown in Figure 4-10(b). This is expected because the particles with higher
velocities flatten faster [112], therefore the flattening process happens before the start of
solidification [113] and the crystalline phase formation. Thin splats with large effective
contact area in the intersplat and substrate interfaces are of great importance on phase
formation within the coating. It has been reported that the thermal contact resistance and
splat thickness strongly affect the cooling rate [83]. A thin splat with large contact area
can provide rapid heat dissipation and large cooling rates. Larger cooling rates are shown
to be in favour of formation of metastable phases like γ-alumina [75,83]. This explanation
for alumina can be generalized to zirconia splats. This means that a more stable tetragonal
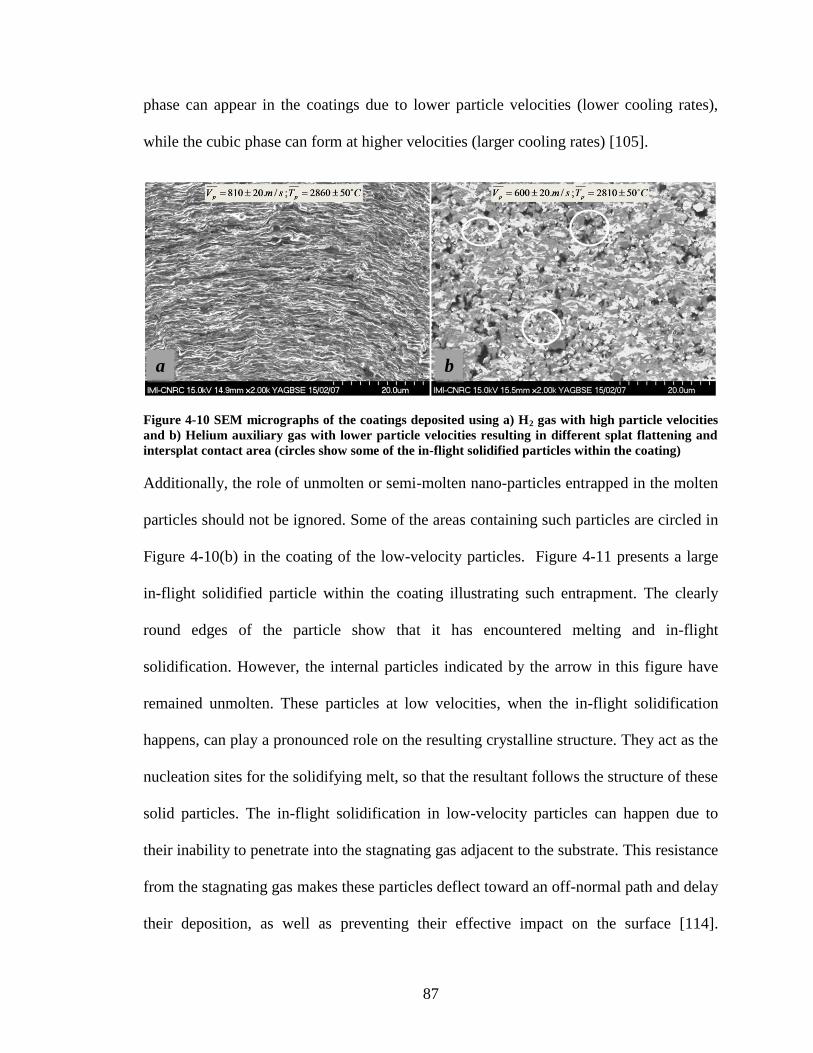
87
phase can appear in the coatings due to lower particle velocities (lower cooling rates),
while the cubic phase can form at higher velocities (larger cooling rates) [105].
Figure 4-10 SEM micrographs of the coatings deposited using a) H2 gas with high particle velocities
and b) Helium auxiliary gas with lower particle velocities resulting in different splat flattening and
intersplat contact area (circles show some of the in-flight solidified particles within the coating)
Additionally, the role of unmolten or semi-molten nano-particles entrapped in the molten
particles should not be ignored. Some of the areas containing such particles are circled in
Figure 4-10(b) in the coating of the low-velocity particles. Figure 4-11 presents a large
in-flight solidified particle within the coating illustrating such entrapment. The clearly
round edges of the particle show that it has encountered melting and in-flight
solidification. However, the internal particles indicated by the arrow in this figure have
remained unmolten. These particles at low velocities, when the in-flight solidification
happens, can play a pronounced role on the resulting crystalline structure. They act as the
nucleation sites for the solidifying melt, so that the resultant follows the structure of these
solid particles. The in-flight solidification in low-velocity particles can happen due to
their inability to penetrate into the stagnating gas adjacent to the substrate. This resistance
from the stagnating gas makes these particles deflect toward an off-normal path and delay
their deposition, as well as preventing their effective impact on the surface [114].
a
b
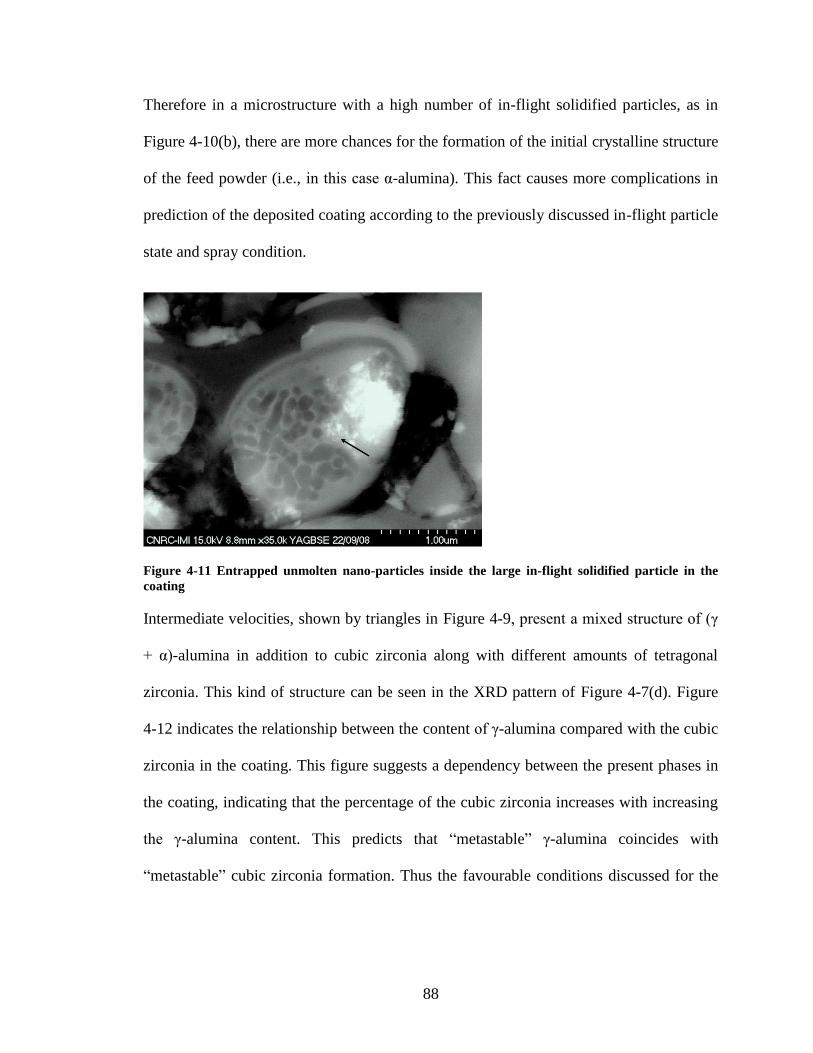
88
Therefore in a microstructure with a high number of in-flight solidified particles, as in
Figure 4-10(b), there are more chances for the formation of the initial crystalline structure
of the feed powder (i.e., in this case α-alumina). This fact causes more complications in
prediction of the deposited coating according to the previously discussed in-flight particle
state and spray condition.
Figure 4-11 Entrapped unmolten nano-particles inside the large in-flight solidified particle in the
coating
Intermediate velocities, shown by triangles in Figure 4-9, present a mixed structure of (γ
+ α)-alumina in addition to cubic zirconia along with different amounts of tetragonal
zirconia. This kind of structure can be seen in the XRD pattern of Figure 4-7(d). Figure
4-12 indicates the relationship between the content of γ-alumina compared with the cubic
zirconia in the coating. This figure suggests a dependency between the present phases in
the coating, indicating that the percentage of the cubic zirconia increases with increasing
the γ-alumina content. This predicts that “metastable” γ-alumina coincides with
“metastable” cubic zirconia formation. Thus the favourable conditions discussed for the
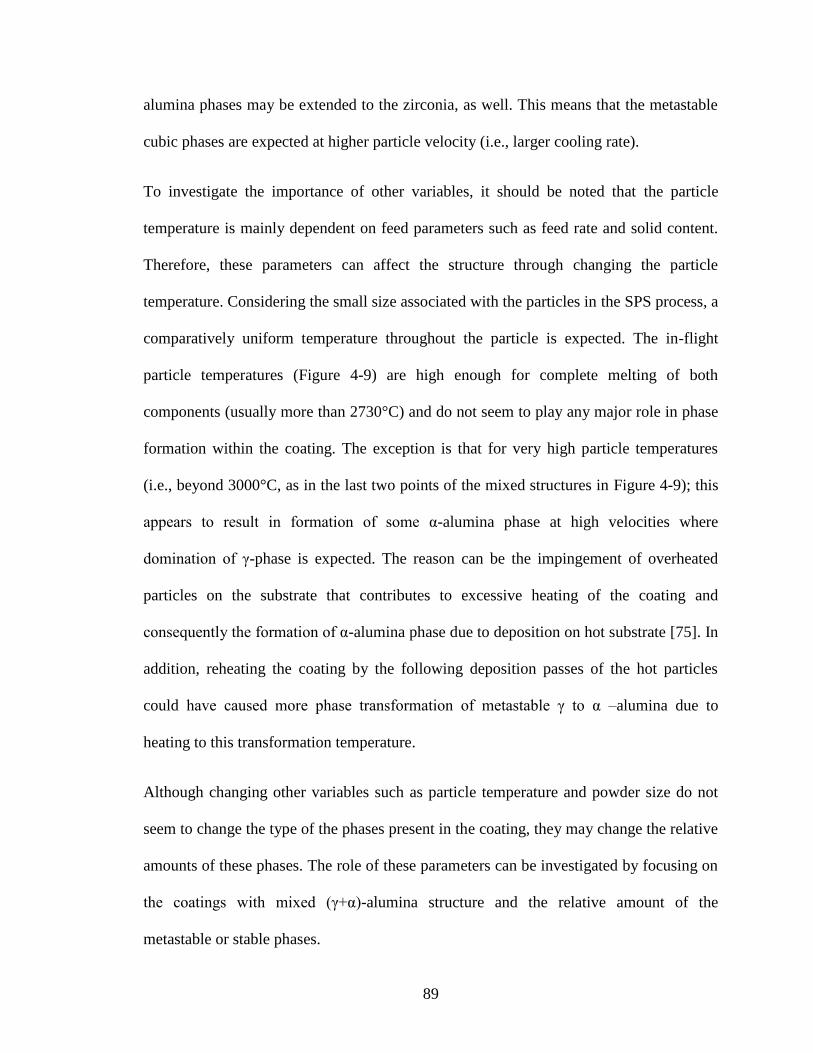
89
alumina phases may be extended to the zirconia, as well. This means that the metastable
cubic phases are expected at higher particle velocity (i.e., larger cooling rate).
To investigate the importance of other variables, it should be noted that the particle
temperature is mainly dependent on feed parameters such as feed rate and solid content.
Therefore, these parameters can affect the structure through changing the particle
temperature. Considering the small size associated with the particles in the SPS process, a
comparatively uniform temperature throughout the particle is expected. The in-flight
particle temperatures (Figure 4-9) are high enough for complete melting of both
components (usually more than 2730°C) and do not seem to play any major role in phase
formation within the coating. The exception is that for very high particle temperatures
(i.e., beyond 3000°C, as in the last two points of the mixed structures in Figure 4-9); this
appears to result in formation of some α-alumina phase at high velocities where
domination of γ-phase is expected. The reason can be the impingement of overheated
particles on the substrate that contributes to excessive heating of the coating and
consequently the formation of α-alumina phase due to deposition on hot substrate [75]. In
addition, reheating the coating by the following deposition passes of the hot particles
could have caused more phase transformation of metastable γ to α –alumina due to
heating to this transformation temperature.
Although changing other variables such as particle temperature and powder size do not
seem to change the type of the phases present in the coating, they may change the relative
amounts of these phases. The role of these parameters can be investigated by focusing on
the coatings with mixed (γ+α)-alumina structure and the relative amount of the
metastable or stable phases.
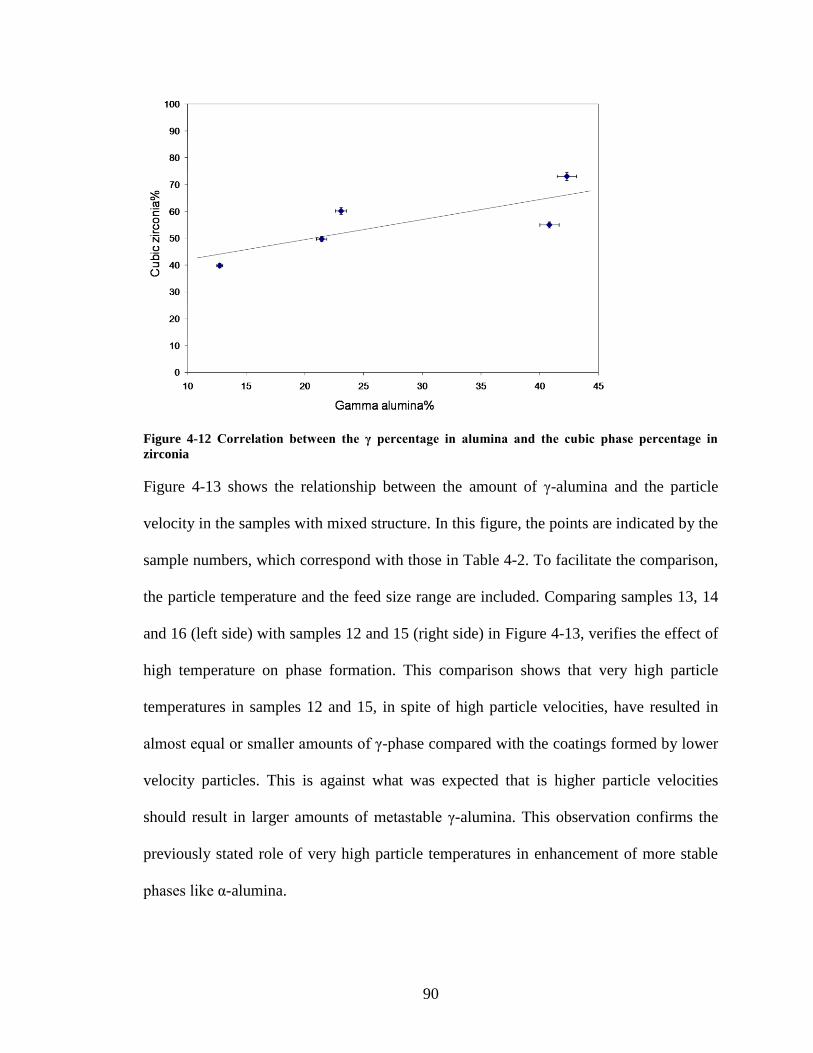
90
Figure 4-12 Correlation between the γ percentage in alumina and the cubic phase percentage in
zirconia
Figure 4-13 shows the relationship between the amount of γ-alumina and the particle
velocity in the samples with mixed structure. In this figure, the points are indicated by the
sample numbers, which correspond with those in Table 4-2. To facilitate the comparison,
the particle temperature and the feed size range are included. Comparing samples 13, 14
and 16 (left side) with samples 12 and 15 (right side) in Figure 4-13, verifies the effect of
high temperature on phase formation. This comparison shows that very high particle
temperatures in samples 12 and 15, in spite of high particle velocities, have resulted in
almost equal or smaller amounts of γ-phase compared with the coatings formed by lower
velocity particles. This is against what was expected that is higher particle velocities
should result in larger amounts of metastable γ-alumina. This observation confirms the
previously stated role of very high particle temperatures in enhancement of more stable
phases like α-alumina.
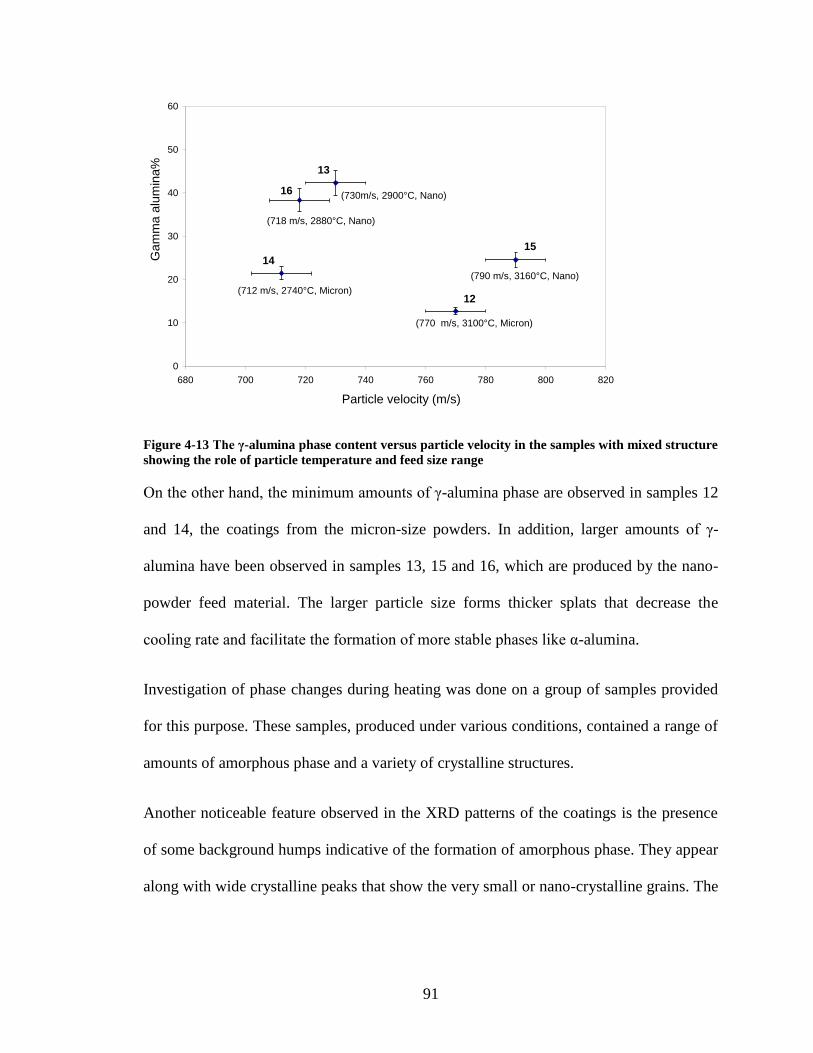
91
0
10
20
30
40
50
60
680 700 720 740 760 780 800 820
Particle velocity (m/s)
Ga
mm
a a
lum
ina
%
14
15
12
13
16 (730m/s, 2900°C, Nano)
(718 m/s, 2880°C, Nano)
(712 m/s, 2740°C, Micron)
(770 m/s, 3100°C, Micron)
(790 m/s, 3160°C, Nano)
Figure 4-13 Theγ-alumina phase content versus particle velocity in the samples with mixed structure
showing the role of particle temperature and feed size range
On the other hand, the minimum amounts of γ-alumina phase are observed in samples 12
and 14, the coatings from the micron-size powders. In addition, larger amounts of γ-
alumina have been observed in samples 13, 15 and 16, which are produced by the nano-
powder feed material. The larger particle size forms thicker splats that decrease the
cooling rate and facilitate the formation of more stable phases like α-alumina.
Investigation of phase changes during heating was done on a group of samples provided
for this purpose. These samples, produced under various conditions, contained a range of
amounts of amorphous phase and a variety of crystalline structures.
Another noticeable feature observed in the XRD patterns of the coatings is the presence
of some background humps indicative of the formation of amorphous phase. They appear
along with wide crystalline peaks that show the very small or nano-crystalline grains. The
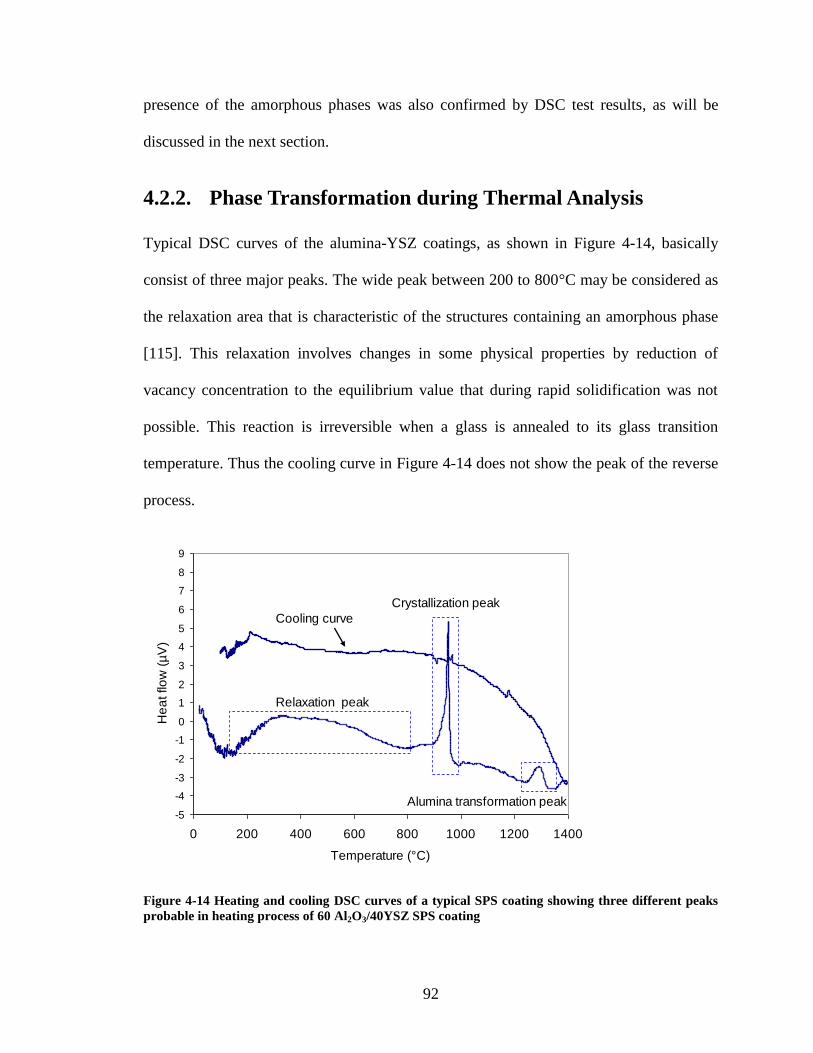
92
presence of the amorphous phases was also confirmed by DSC test results, as will be
discussed in the next section.
4.2.2. Phase Transformation during Thermal Analysis
Typical DSC curves of the alumina-YSZ coatings, as shown in Figure 4-14, basically
consist of three major peaks. The wide peak between 200 to 800°C may be considered as
the relaxation area that is characteristic of the structures containing an amorphous phase
[115]. This relaxation involves changes in some physical properties by reduction of
vacancy concentration to the equilibrium value that during rapid solidification was not
possible. This reaction is irreversible when a glass is annealed to its glass transition
temperature. Thus the cooling curve in Figure 4-14 does not show the peak of the reverse
process.
-5
-4
-3
-2
-1
0
1
2
3
4
5
6
7
8
9
0 200 400 600 800 1000 1200 1400
Temperature (°C)
He
at flo
w (
µV
)
Alumina transformation peak
Relaxation peak
Crystallization peak
Cooling curve
Figure 4-14 Heating and cooling DSC curves of a typical SPS coating showing three different peaks
probable in heating process of 60 Al2O3/40YSZ SPS coating
93
However, since these peaks were sometimes observed in almost fully crystalline samples,
it is expected that some additional effects are contributing to this phenomenon. For
instance, there may have been some relieving of thermal residual stresses and/or
reorientation of the crystalline planes to eliminate the texture.
The second peak is sharp and related to crystallization phenomenon that is expected to
happen simultaneously from amorphous into alumina and zirconia crystals at about
950°C [24]. The third peak is anticipated to represent γ- to α-alumina phase
transformation, which takes place at around 1200°C [44]. The peak identifications can be
verified by studying the heat-treated samples at 700, 1000 and 1200°C, as will be
explained further in this work.
4.2.3. Transformation Verification by Heat Treatment
Heat-treated samples at 700°C for 12 hours show the same XRD patterns as the initial
coating. Besides, the pattern does not show any peak shift or change in grain size,
according to XRD evaluation. This suggests that for such samples the relaxation
phenomenon in the DSC curve of Figure 4-14 does not involve any crystallographic
phase transformation or thermal residual stress relief.
It was noticed that for most of the heat-treated coatings, even at higher temperatures,
peak shifting did not happen. This suggests the low level of the residual stresses in these
samples. This stress in the coatings with the microstructure as in Figure 4-10(a) should
have been released by extensive cracking [72]. On the other hand, the microstructures
such as that in Figure 4-10(b), with comparatively loose and small splats, do not
94
accumulate any considerable residual stresses. Therefore, these SPS coatings which are
formed of smaller in-flight particles than the conventional plasma spray process (as will
be explained in section 5.3) do not involve any large accumulated residual stresses.
Heat treatment at 1000°C for 1 hour has been carried out to investigate the crystallization
phenomenon noticed in the DSC spectra. The XRD pattern of the heat-treated sample was
similar to that in Figure 4-15(a), consisting of cubic zirconia and γ-alumina. In addition,
background humps of some amorphous phases were observed. Following the heat
treatment at 1000°C for 1 hour, the amorphous humps were largely reduced; meanwhile
the coating showed wider peaks that were more obvious in the peaks of γ-alumina phase
as shown in Figure 4-15(b). Since the primary alumina structure formed from the
amorphous phase is expected to be γ-alumina [116], wider peaks indicate smaller average
grain size as a result of crystallization of amorphous phase into nano-crystalline structure.
The quantitative investigation of the grain sizes according to the amorphous phase
content will be presented in section 6.4.
Heat treatment at 1200°C for 24 hours (on the detached samples from the substrate)
results in the appearance of α-alumina at the expense of diminishing the γ-alumina peaks.
This observation supports the proposed identity for the related peak that takes place
within the range of 1200 to 1400 ºC in the DSC spectrum of Figure 4-14. In contrast, in
the coatings with mainly α-alumina in the as-deposited condition, this heat treatment did
not result in any changes in the crystalline phases.
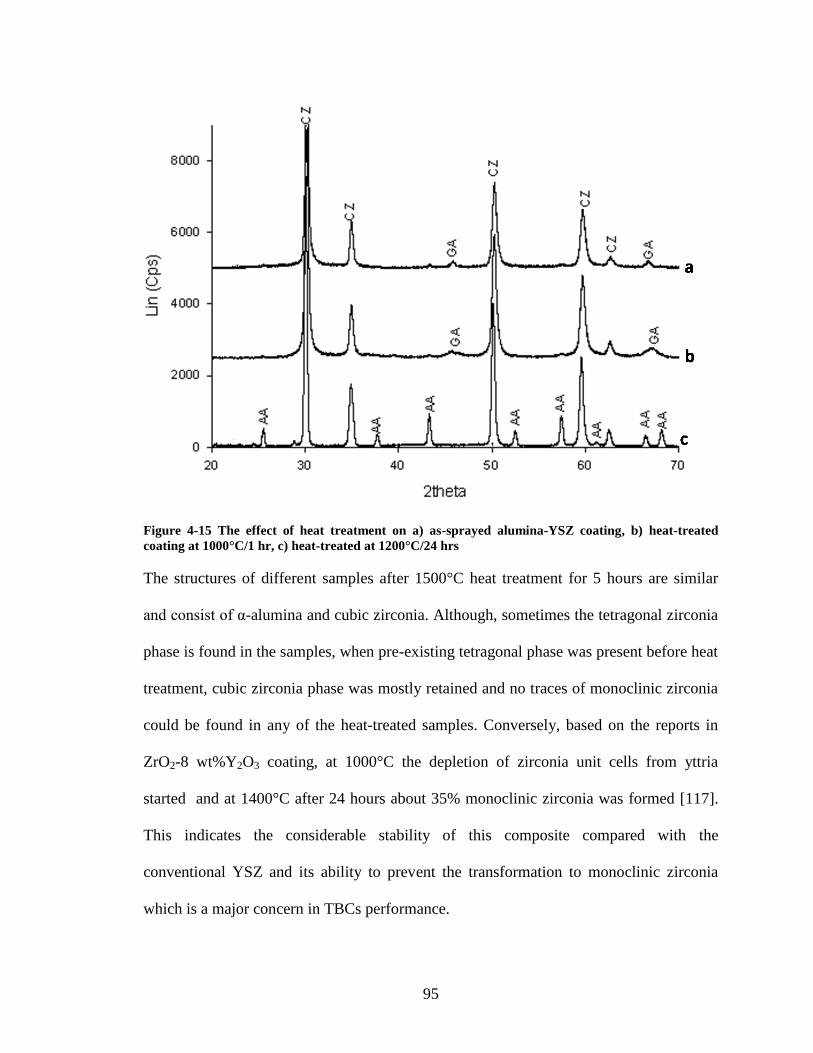
95
Figure 4-15 The effect of heat treatment on a) as-sprayed alumina-YSZ coating, b) heat-treated
coating at 1000°C/1 hr, c) heat-treated at 1200°C/24 hrs
The structures of different samples after 1500°C heat treatment for 5 hours are similar
and consist of α-alumina and cubic zirconia. Although, sometimes the tetragonal zirconia
phase is found in the samples, when pre-existing tetragonal phase was present before heat
treatment, cubic zirconia phase was mostly retained and no traces of monoclinic zirconia
could be found in any of the heat-treated samples. Conversely, based on the reports in
ZrO2-8 wt%Y2O3 coating, at 1000°C the depletion of zirconia unit cells from yttria
started and at 1400°C after 24 hours about 35% monoclinic zirconia was formed [117].
This indicates the considerable stability of this composite compared with the
conventional YSZ and its ability to prevent the transformation to monoclinic zirconia
which is a major concern in TBCs performance.
96
4.2.4. Preferred Phase during Crystallization of the
Amorphous Phase
To investigate the preferred structure during crystallization of the amorphous phases upon
heating, the transformation peak areas in DSC curves were used. This helped to obtain
the relative amount of each specific phase undergoing the transformation. A larger peak
area indicates a higher amount of the phase undergoing the corresponding transformation.
Therefore, the larger crystallization peak area stands for higher amorphous content and
the larger γ- to α-alumina phase transformation peak represents the larger amount of the
γ-phase. The γ-phase can form during the deposition process and/or as a result of
crystallization of alumina out of amorphous phase during heating the DSC sample.
Figure 4-16 is a summary of the relation between transformation peak for γ- to α-alumina
and the crystallization peak that represents the amorphous content in the coating. In these
coatings, the alumina in as-deposited condition has either γ- or α-structure, or a mixture
of both phases. This figure shows that when the as-sprayed structure contains mainly γ-
alumina, there is a steep linear relationship between the crystallization peak (the
amorphous content) and the γ to α transformation peak (that represents the amount of γ
alumina after crystallization process). This clearly indicates that increasing the
amorphous content increases the amount of transformable γ- to α-phase.
Conversely, when the as-deposited alumina is of mainly α-structure, even at larger
amorphous contents, the transformation peak from γ to α is not increasing. To the
contrary, it is normally almost equal to that of the crystalline samples with no amorphous
phase (indicated as point A in Figure 4-16 where the crystallization peak area is almost
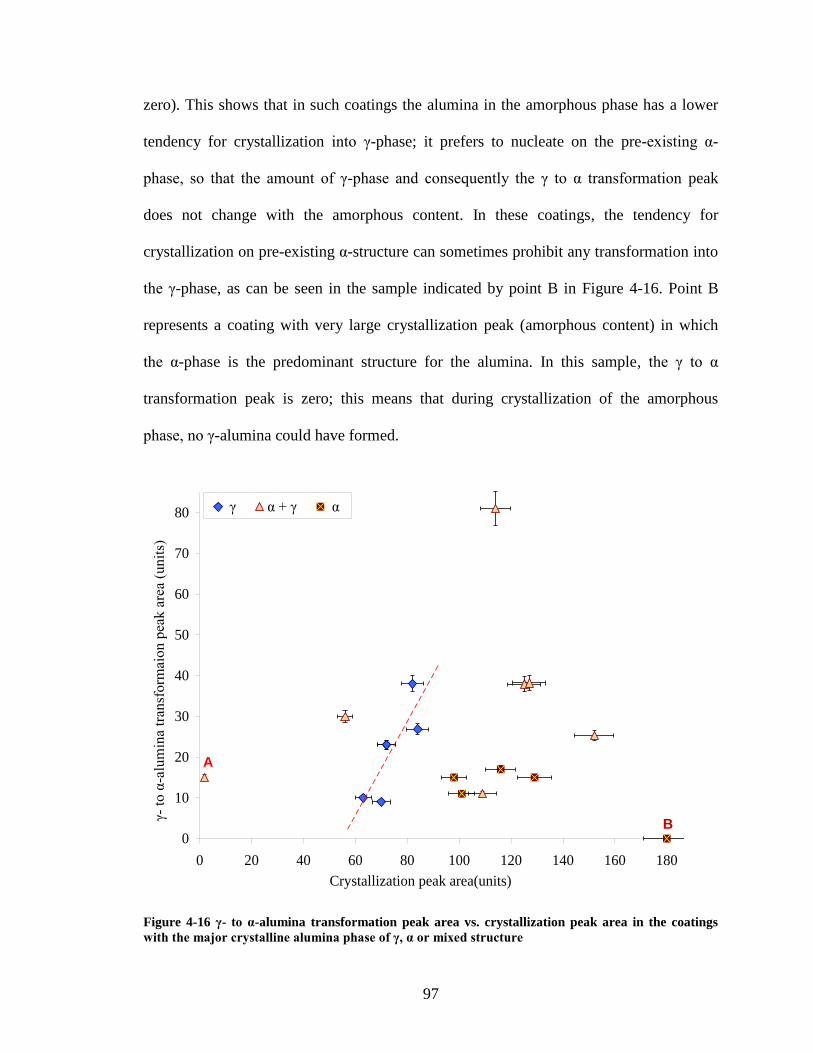
97
zero). This shows that in such coatings the alumina in the amorphous phase has a lower
tendency for crystallization into γ-phase; it prefers to nucleate on the pre-existing α-
phase, so that the amount of γ-phase and consequently the γ to α transformation peak
does not change with the amorphous content. In these coatings, the tendency for
crystallization on pre-existing α-structure can sometimes prohibit any transformation into
the γ-phase, as can be seen in the sample indicated by point B in Figure 4-16. Point B
represents a coating with very large crystallization peak (amorphous content) in which
the α-phase is the predominant structure for the alumina. In this sample, the γ to α
transformation peak is zero; this means that during crystallization of the amorphous
phase, no γ-alumina could have formed.
0
10
20
30
40
50
60
70
80
0 20 40 60 80 100 120 140 160 180
Crystallization peak area(units)
γ- to α-alumina transform
aion peak area (units)
γ α + γ α
B
A
Figure 4-16 γ- to α-alumina transformation peak area vs. crystallization peak area in the coatings
withthemajorcrystallinealuminaphaseofγ,αormixedstructure
98
These observations suggest that the preferred phase during crystallization of the
amorphous phase is dependent on the initial crystalline structure, which acts as the
nucleation site. Thus, in the coatings with mixed structure a compromise between the
amounts of the two structures (α- and γ-alumina) in the as-deposited coating is expected
to determine the proportion of the resulting phases after the crystallization process.
The stabilized zirconia after crystallization did not go through any phase transformation.
Thus, this sort of evaluation for the zirconia component was not possible. However, the
XRD pattern of the heat-treated sample, as will be discussed later, shows that the
resulting structure after crystallization is not different from the crystalline YSZ initially
present in the as-deposited coating.
Another noticeable observation in Figure 4-16 is that the coatings with mainly α-alumina
structure show a high amount of amorphous phase. The reason for this concurrence must
be due to the lower particle velocity that was found here to favour the formation of α-
alumina. The lower particle velocity results in longer dwelling time at high temperature,
which in turn could provide the possibility for better mixing. The amorphous formation in
a multi-component system is influenced by the ratio of dissolution of the components. On
the other hand, alumina and YSZ are almost immiscible in solid state and can mix only
after melting. As a result, the lower particle velocity that causes a longer time at high
temperature leads to the ideal conditions for melting and mixing of the components
simultaneously. This issue will be investigated further in sections Chapter 5.
99
Briefly, it was explained in this section that the particle velocity is a crucial parameter
which can dictate the crystalline structure of the resulting coatings. Particle velocity can
be controlled by plasma parameters such as plasma gas type and plasma condition that in
turn determine the plasma power. However, particle temperature, as long as it is high
enough for complete melting of the particles, does not play an explicit role in the type of
phases present. It, however, can affect the phase ratios, when raised far beyond the
melting points of the components. Feed size also can affect the phase ratios, so that the
larger particles result in formation of more stable phases in the coating. Other feed
parameters including feed rate and solid content influence the results through variation of
the particle temperature. The presence of unmolten nano particles increases the intricacy
of phase prediction in the as-deposited coating.
In addition, it was found that thermal evolution of the combined crystalline/amorphous
structure results in crystallization of the amorphous phases, as dictated by the pre-existing
crystalline phases in the as-deposited coatings. Thus the in-flight particle velocity can
also play a significant role on the final coating structure after crystallization, as it
determines the initial phases in the as-deposited state.
Heat treatment at the alumina transformation temperature (1200°C for 24 hours) leads to
a coating composed of mainly α-alumina in addition to the cubic zirconia. Upon heat
treatment at about crystallization temperature, the amorphous structure seems to form
smaller crystalline nano-grains than what could be produced during plasma spray
deposition. This is investigated more in section 6.4.
100
A somewhat surprising observation in this section was that samples with mainly α-
alumina phase (that form at lower cooling rates) are coincident with higher amorphous
phase (which is the preferred state at high cooling rates). To explain this, a more detailed
investigation of amorphous phase formation seemed necessary, and will follow in
Chapter 5.
4.3. Summary
Microstructural studies of the SPS coatings showed that the spray parameters can be
related to the resulting microstructures, mainly through their effect on in-flight particle
characteristics (Tp, Vp). The more prominent parameter is Vp, whereas Tp does not play a
very significant role. Therefore, spray parameters ruling Vp are the ones that are most
suitable for microstructural control. Some of these parameters are plasma gas
composition, total plasma gas pressure and/or plasma power.
In addition, while working with alumina-YSZ composite, it was observed that porosity,
as a major microstructural characteristic, may affect the mechanical properties (e.g.,
increasing hardness in the coating with decreasing porosity). Nonetheless, its role on
thermal diffusivity (up to 8% porosity) is not significant. The material also showed about
the same thermal diffusivity as YSZ at all porosity contents. Thus this composite may be
used even at very high density as a TBC without concern for reduced thermal resistance.
In addition, SPS process has the ability to produce extremely high-density coatings with
near-zero porosity, as well as porous structures if required.
Investigation of phase analysis in the as-deposited SPS coatings revealed that particle
velocity plays a crucial role on the type of the resulting crystalline phases, as it did on the
microstructure. Higher particle velocity increased the formation of metastable phases
101
(such as γ-alumina and cubic zirconia). In contrast, particle temperature only affected the
phase ratios and not their type. Very high particle temperatures caused the formation of
less metastable phases. Upon heating to crystallization temperature, the amorphous
portion of the coating transforms into crystalline phases that are dictated by pre-existing
crystals in the as-deposited coating. This means that the main part of the amorphous
phase will crystallize into structures which were already present in the crystalline state.
102
Chapter 5 Developing Amorphous Phase in the
Coatings
This part of the study aims at finding the ways that the amount of the amorphous phase
can be varied within the alumina-YSZ composite coatings using SPS process. For this
purpose, a group of most probably effective variables were selected. These variables are
the in-flight particle velocity and temperature, feed powder size, substrate preheating,
travel speed of the spray robot, and bond coat (presence and absence). These parameters
seemed to be influential on the amorphous content, based on the process nature and the
pre-assessment of the variables. In this work, the samples from three sets of experiments
were used. The coatings were deposited on small mild steel coupon substrates of (2.5×2.5
cm2
with 0.05 cm thickness). Details of the material and sample preparation in the three
sets of samples are summarized in Table 5-1.
Set1
This set of samples was to compare the different feed particle sizes and to find the role of
the spray robot speed on the amount of amorphous phase in the coating. In addition, the
coatings prepared for evaluation of the role of particle velocity were mostly selected from
this group, as will be explained later.
Powders used in this part were a mixture of micron-size powders, 13 wt% YSZ (Unitec
Ceramics, Stanford, England) nominal size 1 μm, combined with the proportional amount
of 5 wt% YSZ (Tosoh TZ-3YS, Tokyo, Japan) to produce 8 wt% YSZ and mixed with
alumina powder (Malakoff, TX, USA) nominal size 1.4 μm in a weight ratio of 60
103
alumina / 40 YSZ. The resulting mixed powder size range was about 1 to 2 μm. This
mixture was next suspended in ethanol with a solid weight of 30%. Another suspension
with the same solid content was prepared using the nano-size powders, 13 wt% YSZ
(Inframat, Farmington, CT, USA) with proportional weight of 5 wt% YSZ to produce 8
wt% YSZ and alumina nano-powder (Nanostructured & Amorphous Materials, Houston,
TX, USA) with the same alumina-to-YSZ ratio. The nano-powder mixture size was 20-60
nm. As the dispersing material, polyethylen-eimine (PEI) (MW 25,000 Alfa Aesar, Ward
Hill, MA, USA) and Nitric acid both with 10% concentration were used. Suspensions
were lightly ball milled for more than 24 hours at 120 rpm roll to avoid large aggregate
sizes.
The amorphous contents were measured alternatively with XRD and DSC evaluations for
the coatings from the two types of suspension, “Nano” and “Micron.” In addition, the in-
flight particles were collected after spraying under similar conditions into a large water
pot. The powders were next air dried and their micrographic pictures were provided using
high-resolution FE-SEM technique. Sample preparation conditions for this group are
listed in Table 5-1 with numbers 1 to 6.
Set2
The second set of samples with production conditions listed in Table 5-1 as numbers 7 to
10 was to evaluate the role of preheating and of particle temperature on amorphous
content. The samples were in couples, where one was preheated with laser flash to an
initial temperature of 350°C and the other was at room temperature when deposition
started. Three different spray conditions were used to produce different particle
temperatures.
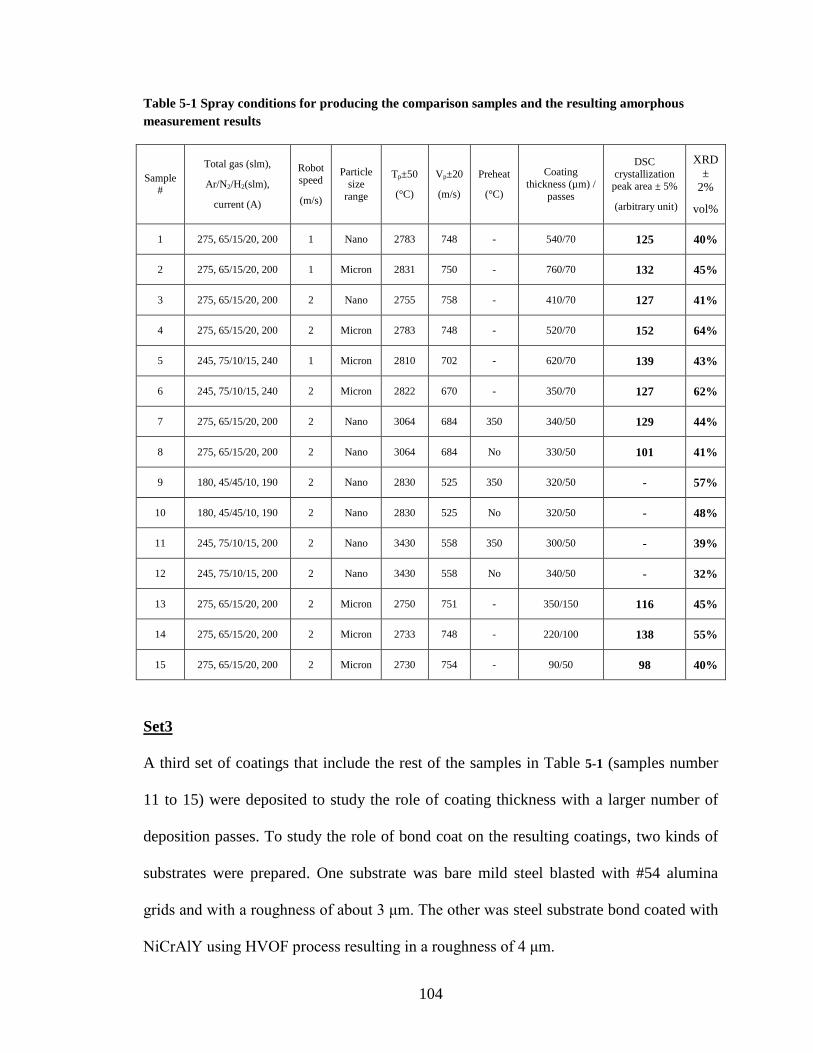
104
Table 5-1 Spray conditions for producing the comparison samples and the resulting amorphous
measurement results
Sample #
Total gas (slm),
Ar/N2/H2(slm),
current (A)
Robot
speed
(m/s)
Particle
size
range
Tp±50
(°C)
Vp±20
(m/s)
Preheat
(°C)
Coating
thickness (µm) /
passes
DSC
crystallization peak area ± 5%
(arbitrary unit)
XRD
±
2%
vol%
1 275, 65/15/20, 200 1 Nano 2783 748 - 540/70 125 40%
2 275, 65/15/20, 200 1 Micron 2831 750 - 760/70 132 45%
3 275, 65/15/20, 200 2 Nano 2755 758 - 410/70 127 41%
4 275, 65/15/20, 200 2 Micron 2783 748 - 520/70 152 64%
5 245, 75/10/15, 240 1 Micron 2810 702 - 620/70 139 43%
6 245, 75/10/15, 240 2 Micron 2822 670 - 350/70 127 62%
7 275, 65/15/20, 200 2 Nano 3064 684 350 340/50 129 44%
8 275, 65/15/20, 200 2 Nano 3064 684 No 330/50 101 41%
9 180, 45/45/10, 190 2 Nano 2830 525 350 320/50 - 57%
10 180, 45/45/10, 190 2 Nano 2830 525 No 320/50 - 48%
11 245, 75/10/15, 200 2 Nano 3430 558 350 300/50 - 39%
12 245, 75/10/15, 200 2 Nano 3430 558 No 340/50 - 32%
13 275, 65/15/20, 200 2 Micron 2750 751 - 350/150 116 45%
14 275, 65/15/20, 200 2 Micron 2733 748 - 220/100 138 55%
15 275, 65/15/20, 200 2 Micron 2730 754 - 90/50 98 40%
Set3
A third set of coatings that include the rest of the samples in Table 5-1 (samples number
11 to 15) were deposited to study the role of coating thickness with a larger number of
deposition passes. To study the role of bond coat on the resulting coatings, two kinds of
substrates were prepared. One substrate was bare mild steel blasted with #54 alumina
grids and with a roughness of about 3 μm. The other was steel substrate bond coated with
NiCrAlY using HVOF process resulting in a roughness of 4 μm.
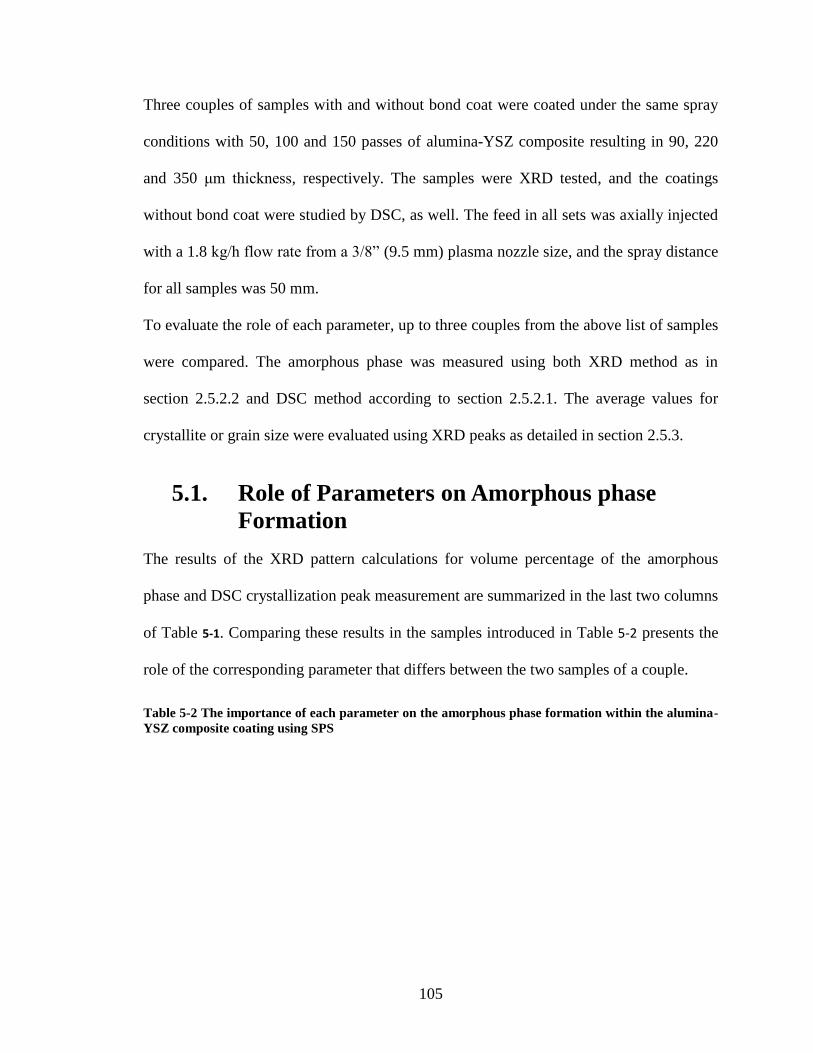
105
Three couples of samples with and without bond coat were coated under the same spray
conditions with 50, 100 and 150 passes of alumina-YSZ composite resulting in 90, 220
and 350 μm thickness, respectively. The samples were XRD tested, and the coatings
without bond coat were studied by DSC, as well. The feed in all sets was axially injected
with a 1.8 kg/h flow rate from a 3/8” (9.5 mm) plasma nozzle size, and the spray distance
for all samples was 50 mm.
To evaluate the role of each parameter, up to three couples from the above list of samples
were compared. The amorphous phase was measured using both XRD method as in
section 2.5.2.2 and DSC method according to section 2.5.2.1. The average values for
crystallite or grain size were evaluated using XRD peaks as detailed in section 2.5.3.
5.1. Role of Parameters on Amorphous phase
Formation
The results of the XRD pattern calculations for volume percentage of the amorphous
phase and DSC crystallization peak measurement are summarized in the last two columns
of Table 5-1. Comparing these results in the samples introduced in Table 5-2 presents the
role of the corresponding parameter that differs between the two samples of a couple.
Table 5-2 The importance of each parameter on the amorphous phase formation within the alumina-
YSZ composite coating using SPS
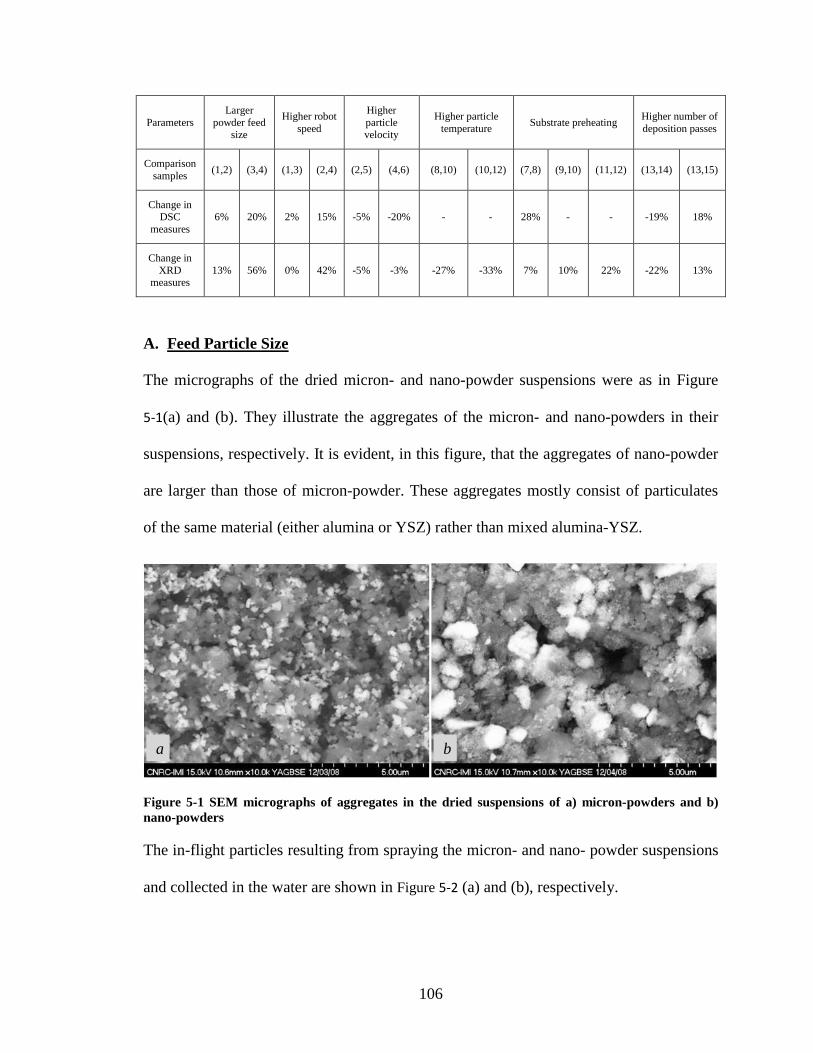
106
Parameters
Larger
powder feed size
Higher robot
speed
Higher
particle velocity
Higher particle
temperature Substrate preheating
Higher number of
deposition passes
Comparison
samples (1,2) (3,4) (1,3) (2,4) (2,5) (4,6) (8,10) (10,12) (7,8) (9,10) (11,12) (13,14) (13,15)
Change in DSC
measures
6% 20% 2% 15% -5% -20% - - 28% - - -19% 18%
Change in
XRD measures
13% 56% 0% 42% -5% -3% -27% -33% 7% 10% 22% -22% 13%
A. Feed Particle Size
The micrographs of the dried micron- and nano-powder suspensions were as in Figure
5-1(a) and (b). They illustrate the aggregates of the micron- and nano-powders in their
suspensions, respectively. It is evident, in this figure, that the aggregates of nano-powder
are larger than those of micron-powder. These aggregates mostly consist of particulates
of the same material (either alumina or YSZ) rather than mixed alumina-YSZ.
Figure 5-1 SEM micrographs of aggregates in the dried suspensions of a) micron-powders and b)
nano-powders
The in-flight particles resulting from spraying the micron- and nano- powder suspensions
and collected in the water are shown in Figure 5-2 (a) and (b), respectively.
a b

107
Figure 5-2 Collected in-flight particles sprayed into water: a) micron-powder presenting fully molten
round particles and b) nano-powder that contains also semi-molten and resolidified (SR), as well as
unmolten (U) particles
In this figure, it is clear that the in-flight particle size resulting from the smaller
aggregates of micron-powder suspension is smaller than that of the nano- powder
suspension. This means that the smaller aggregate size before spraying will end up with a
smaller sprayed particle. In addition, the particles from micron-powder suspension in
Figure 5-2(a) are completely round, which indicates their full melting within the plasma
path. In contrast, the in-flight particles from nano-powder suspension, at the end of their
route in plasma, contain plenty of unmolten or partly molten and resolidified particles, as
shown in Figure 5-2(b). Since the suspensions in this case were sprayed under different
conditions, it was found that the resulting particle temperature and velocity for nano-
particles were (3140°C, 523 m/s), while those of micron-suspension were at (3050°C,
745 m/s). It was expected at this lower velocity (longer time) at higher temperature for
the nano-powders to yield a substantial degree of melting. However, it seems that the
lower density (high porosity) has resulted in escaping of many nano-powder aggregates
to the cold periphery of the plasma flame and prevented them from melting.
SR
U
SR
U
S
R
a b
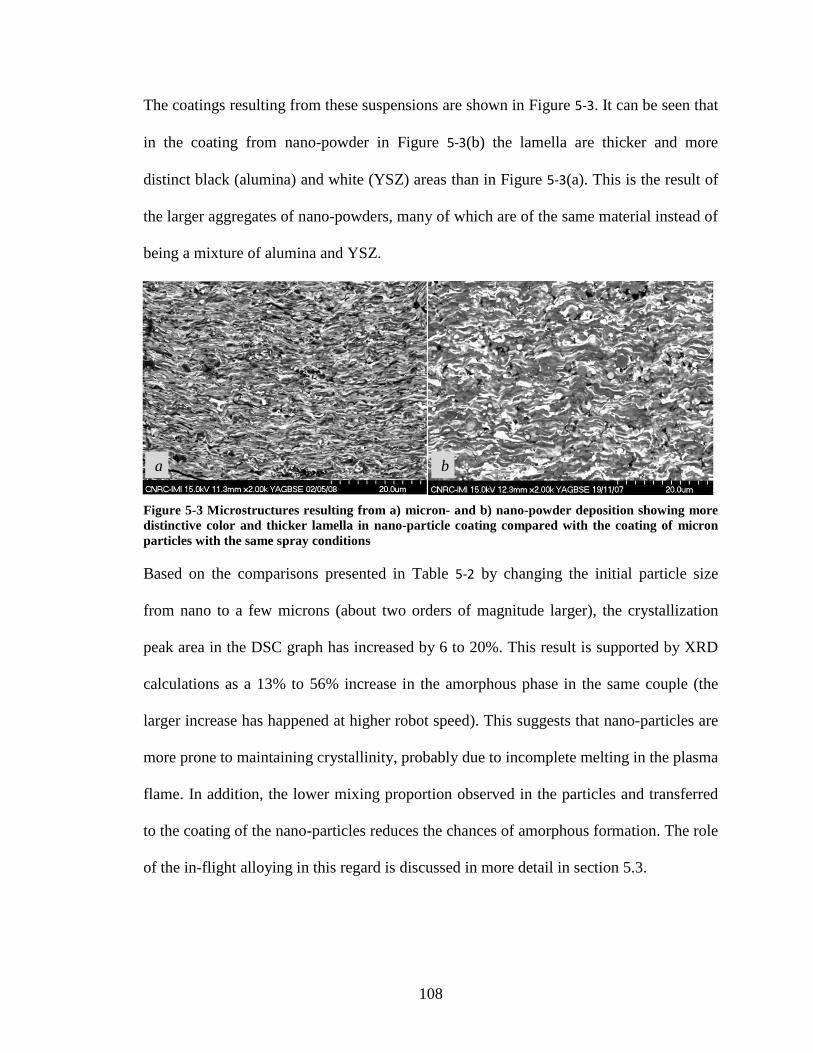
108
The coatings resulting from these suspensions are shown in Figure 5-3. It can be seen that
in the coating from nano-powder in Figure 5-3(b) the lamella are thicker and more
distinct black (alumina) and white (YSZ) areas than in Figure 5-3(a). This is the result of
the larger aggregates of nano-powders, many of which are of the same material instead of
being a mixture of alumina and YSZ.
Figure 5-3 Microstructures resulting from a) micron- and b) nano-powder deposition showing more
distinctive color and thicker lamella in nano-particle coating compared with the coating of micron
particles with the same spray conditions
Based on the comparisons presented in Table 5-2 by changing the initial particle size
from nano to a few microns (about two orders of magnitude larger), the crystallization
peak area in the DSC graph has increased by 6 to 20%. This result is supported by XRD
calculations as a 13% to 56% increase in the amorphous phase in the same couple (the
larger increase has happened at higher robot speed). This suggests that nano-particles are
more prone to maintaining crystallinity, probably due to incomplete melting in the plasma
flame. In addition, the lower mixing proportion observed in the particles and transferred
to the coating of the nano-particles reduces the chances of amorphous formation. The role
of the in-flight alloying in this regard is discussed in more detail in section 5.3.
a b
109
B. Robot Speed
While other parameters are constant and the resulting in-flight particle temperatures and
velocities are closely comparable, Table 5-2 shows that decreasing the robot speed from a
maximum of 2 m/s to 1 m/s results in some decrease in the amount of the amorphous
phase. The change ranges between an negligible amount of 2% in the case of coatings
using nano-powders to 15% for coatings from micron-powders, based on DSC analysis.
This comparison by XRD pattern calculations for nano-powder deposition shows no
change in amorphous content by robot speed, but 42% decrease in amorphous content at
lower robot speed for micron-powder coatings. Considering the close distance of the
torch to the substrate in SPS process compared with other common practices of plasma
spray, a severe heat flux is expected to be impressed by plasma jet to the coating [48].
Therefore, lower amorphous content at slower robot speed can be attributed to
crystallization of some of the solidified amorphous phase retained for a longer time under
the heat of the plasma flame. The inconsiderable role of robot speed in the case of nano-
particle coatings is somewhat unexpected and could not be explained in the course of this
work.
C. Particle Velocity
To provide different particle velocities, the spray conditions were changed and two
couples of samples – (2, 5) and (4, 6) – were produced using the micron-powder
suspensions with constant robot speed. It can be seen in Table 5-2 that increasing in-flight
particle velocities with similar or close particle temperatures reduces the amount of
amorphous phase in the resulting coating. By an increase of about 48 m/s in particle
velocity, from sample 2 to 5, the amorphous content is reduced by 5%, but at the higher
110
velocity change between sample 4 to sample 6 of about 78 m/s, the amorphous phase
drops by 20%. The XRD results also support this decreasing trend of amorphous phase
with increased in-flight particle velocity.
Higher in-flight particle velocity was found to increase the metastable phases such as γ-
alumina and cubic zirconia due to accelerated cooling rate [118]. In a similar manner, it
was expected also that the amorphous phase would increase at a higher particle velocity.
Thus, this decrease in the amorphous phase at higher particle velocities seems
unexpected. This is also contrary to the experiment with pure alumina showing the
amorphous phase formation concurrent with γ-alumina at the substrate interface and
extremely high cooling rates [104]. Nonetheless, in alumina-yttria eutectic system the
amorphous phase is reported to appear along with α-alumina [119]. This apparent conflict
will be cleared subsequently in this thesis after confirming this result with more
investigation.
D. Particle Temperature
Using three different spray conditions the in-flight particle temperatures were varied
while the particle velocities were still comparable and other parameters were constant.
The results in Table 5-2 show that at very high particle temperatures (more than 3000°C)
compared with melting point of the components coatings contain a lower amorphous
percentage. This decrease between the two samples 8 (Tp=3064°C) and 12 (Tp=3430°C)
has ended with a 27% decrease in the amount of the amorphous phase. The same
comparison between samples 12 (Tp=3430°C) and 10 (Tp=2830°C) yields about 33%
change.
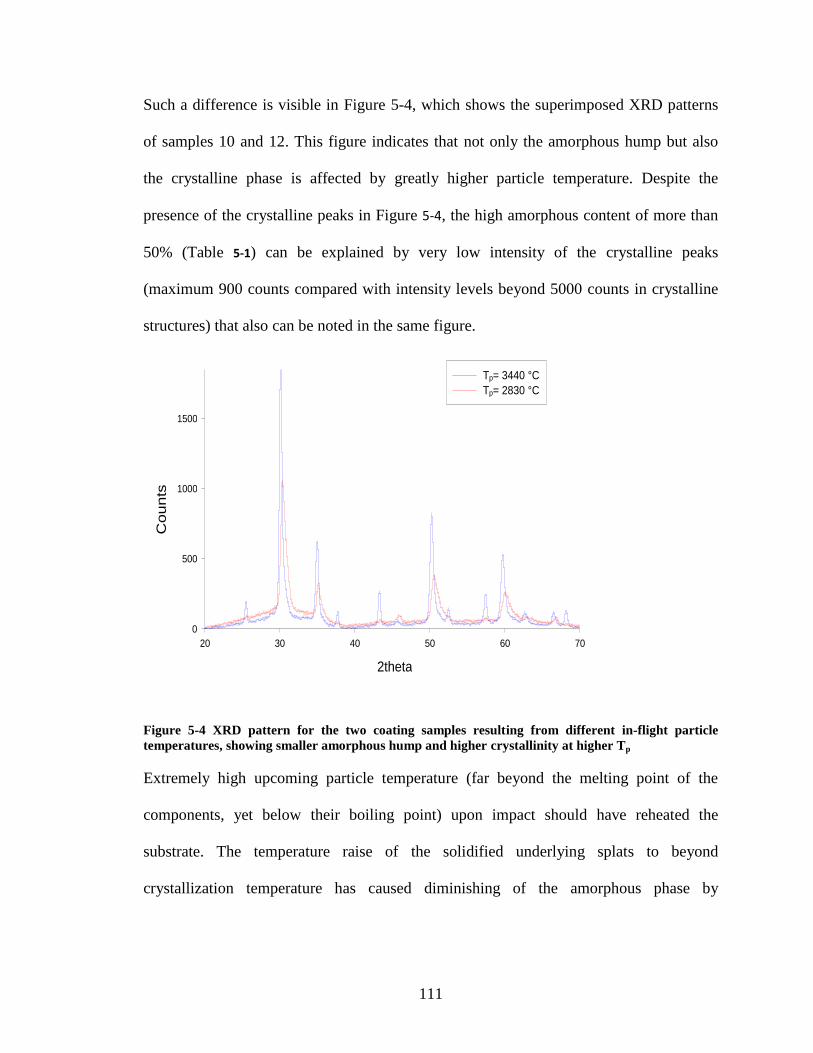
111
Such a difference is visible in Figure 5-4, which shows the superimposed XRD patterns
of samples 10 and 12. This figure indicates that not only the amorphous hump but also
the crystalline phase is affected by greatly higher particle temperature. Despite the
presence of the crystalline peaks in Figure 5-4, the high amorphous content of more than
50% (Table 5-1) can be explained by very low intensity of the crystalline peaks
(maximum 900 counts compared with intensity levels beyond 5000 counts in crystalline
structures) that also can be noted in the same figure.
2theta
20 30 40 50 60 70 0
500
1000
1500
Tp= 3440 °C Tp= 2830 °C
Co
un
ts
Figure 5-4 XRD pattern for the two coating samples resulting from different in-flight particle
temperatures, showing smaller amorphous hump and higher crystallinity at higher Tp
Extremely high upcoming particle temperature (far beyond the melting point of the
components, yet below their boiling point) upon impact should have reheated the
substrate. The temperature raise of the solidified underlying splats to beyond
crystallization temperature has caused diminishing of the amorphous phase by
112
crystallization process. In addition, the hot substrate promotes the formation of α-alumina
at lower cooling rates [75].
In reporting the in-flight particle temperatures in SPS process using Accuraspray, it is
noteworthy that the measurements may sometimes be interfered by the radiations from
the plasma flame. In such condition, the measured temperatures can be somewhat higher
than reality. However, since this is a systematic error the comparison is still possible.
E. Substrate Preheat
To study the role of preheating the substrate, comparison was first done between the
samples (7, 8) by both DSC and XRD. Table 5-2 presents a 28% increase in DSC
crystallization peak area for the coating on preheated substrate compared with the coating
on non-preheated substrate. This increasing trend, based on the same table, was
confirmed by the XRD results. Two additional couples were compared just by XRD
calculations in samples (9, 10) and (11, 12) and confirmed the above results (that means
higher amorphous content was found in the coating on heat-treated substrate). It was also
observed that preheating the substrate to 350°C, while providing coatings of higher
quality, with almost half the number of horizontal and vertical cracks, reduces the grain
size of all present phases (i.e., α- and γ-alumina, t/t’ zirconia). This comparison is
presented in Figure 5-5. Since in the preheated substrate there is normally a better
interface bonding between the coating and the substrate by improved splat spreading and
interface contact [30], lower contact resistance at the interface helps more rapid heat
extraction from the coating, which results in smaller grain size in all the phases formed.
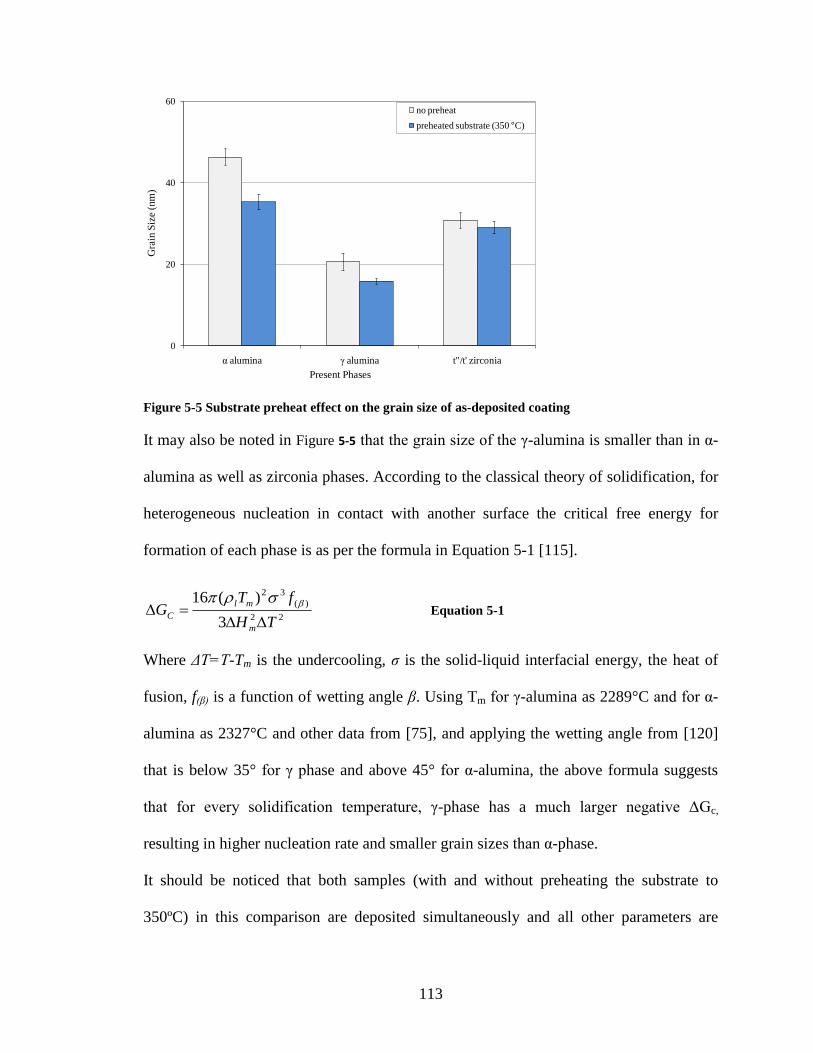
113
0
20
40
60
α alumina γ alumina t"/t' zirconia
Gra
in S
ize (
nm
)
Present Phases
no preheat
preheated substrate (350 °C)
Figure 5-5 Substrate preheat effect on the grain size of as-deposited coating
It may also be noted in Figure 5-5 that the grain size of the γ-alumina is smaller than in α-
alumina as well as zirconia phases. According to the classical theory of solidification, for
heterogeneous nucleation in contact with another surface the critical free energy for
formation of each phase is as per the formula in Equation 5-1 [115].
22
)(
32
3
)(16
TH
fTG
m
ml
C
Equation 5-1
Where ΔT=T-Tm is the undercooling, σ is the solid-liquid interfacial energy, the heat of
fusion, f(β) is a function of wetting angle β. Using Tm for γ-alumina as 2289°C and for α-
alumina as 2327°C and other data from [75], and applying the wetting angle from [120]
that is below 35° for γ phase and above 45° for α-alumina, the above formula suggests
that for every solidification temperature, γ-phase has a much larger negative ΔGc,
resulting in higher nucleation rate and smaller grain sizes than α-phase.
It should be noticed that both samples (with and without preheating the substrate to
350ºC) in this comparison are deposited simultaneously and all other parameters are
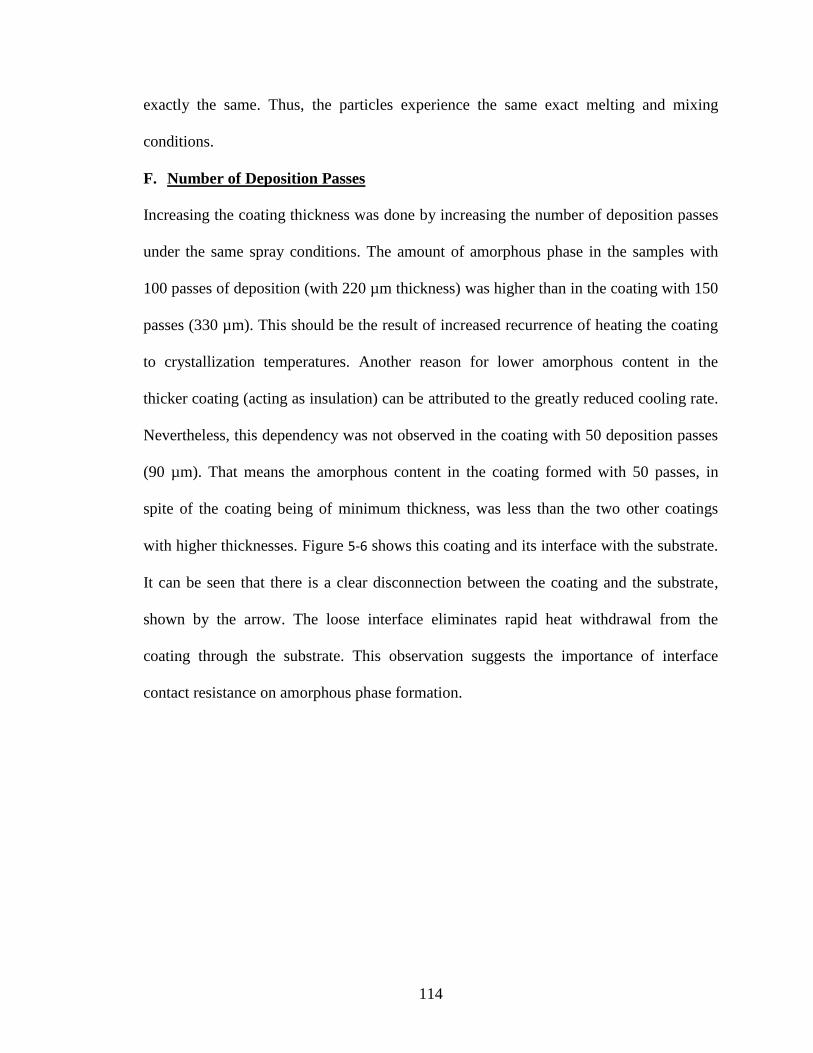
114
exactly the same. Thus, the particles experience the same exact melting and mixing
conditions.
F. Number of Deposition Passes
Increasing the coating thickness was done by increasing the number of deposition passes
under the same spray conditions. The amount of amorphous phase in the samples with
100 passes of deposition (with 220 µm thickness) was higher than in the coating with 150
passes (330 µm). This should be the result of increased recurrence of heating the coating
to crystallization temperatures. Another reason for lower amorphous content in the
thicker coating (acting as insulation) can be attributed to the greatly reduced cooling rate.
Nevertheless, this dependency was not observed in the coating with 50 deposition passes
(90 µm). That means the amorphous content in the coating formed with 50 passes, in
spite of the coating being of minimum thickness, was less than the two other coatings
with higher thicknesses. Figure 5-6 shows this coating and its interface with the substrate.
It can be seen that there is a clear disconnection between the coating and the substrate,
shown by the arrow. The loose interface eliminates rapid heat withdrawal from the
coating through the substrate. This observation suggests the importance of interface
contact resistance on amorphous phase formation.
115
Figure 5-6 Loose interface contact between the coating and substrate, causing lower cooling rate of
the upcoming splats
In addition, the discontinuous microstructure of this sample is due to the plasma arc
instability during deposition of this coating that prevents appropriate intersplat bonding
and heat transfer to the substrate. Therefore, the coating made with 50 passes is showing
an unexpectedly lower amorphous content, despite lower thickness and number of passes
than the two other coating samples.
G. Bond Coat
The coatings for studying the effect of the presence of bond coat were simultaneously
deposited on mild steel bare substrates and bond coated mild steel substrates using nano-
powder suspension. The XRD patterns of the bond coated and bare steel substrates were
almost similar (except a slightly higher intensity in crystalline peaks at lower angles in
the coatings on bare substrate), and the amorphous humps were overlapping in both types
of sample. The reason for this is that the metallic bond coat has a thermal diffusivity close
to that of the steel base material. The only difference might happen when the interface
with the steel substrate is poorer than that of the bond coated substrate. As long as the
substrate and coating contact qualities are the same, the role of the bond coat on cooling
116
rate, crystalline phases and even amorphous phase content has been found to be
negligible, as observed in this experiment.
5.2. Coatings Amorphous Contents and Crystallite
Sizes
The grain size of the solidifying crystal is directly dependent on the cooling rate, and the
smaller grain size under the same nucleation conditions can be translated to higher
cooling rates. Hence, to evaluate the importance of the cooling rate on the amorphous
phase formation, the grain sizes of a large group of samples have been measured,
regardless of the condition causing the change in the cooling rates.
The relation between the grain sizes measured for each crystalline phase and the
amorphous content in each coating is illustrated in Figure 5-7. In this figure, it can be
seen that the smaller grain size of different phases (as a sign of higher cooling rate) is not
concurrent with higher amorphous content. This suggests that the role of cooling rate
(within the range of plasma spray cooling rates) on the amorphous content is preceded by
some other parameters with stronger role. Figure 5-7 also confirms that γ-alumina has
usually the smallest grain size among the phases present, as explained above. In addition,
in this figure it can be seen that in the case of zirconia by increasing the amorphous phase
a slight increase in the grain size is observed.
As discussed in section 4.2, higher amorphous content is mostly coincident with
formation of α-alumina. Meanwhile, the decrease of amorphous phase at lower particle
velocities requires a more detailed investigation of the probable role of the in-flight
particle velocity on the amorphous phase formation.
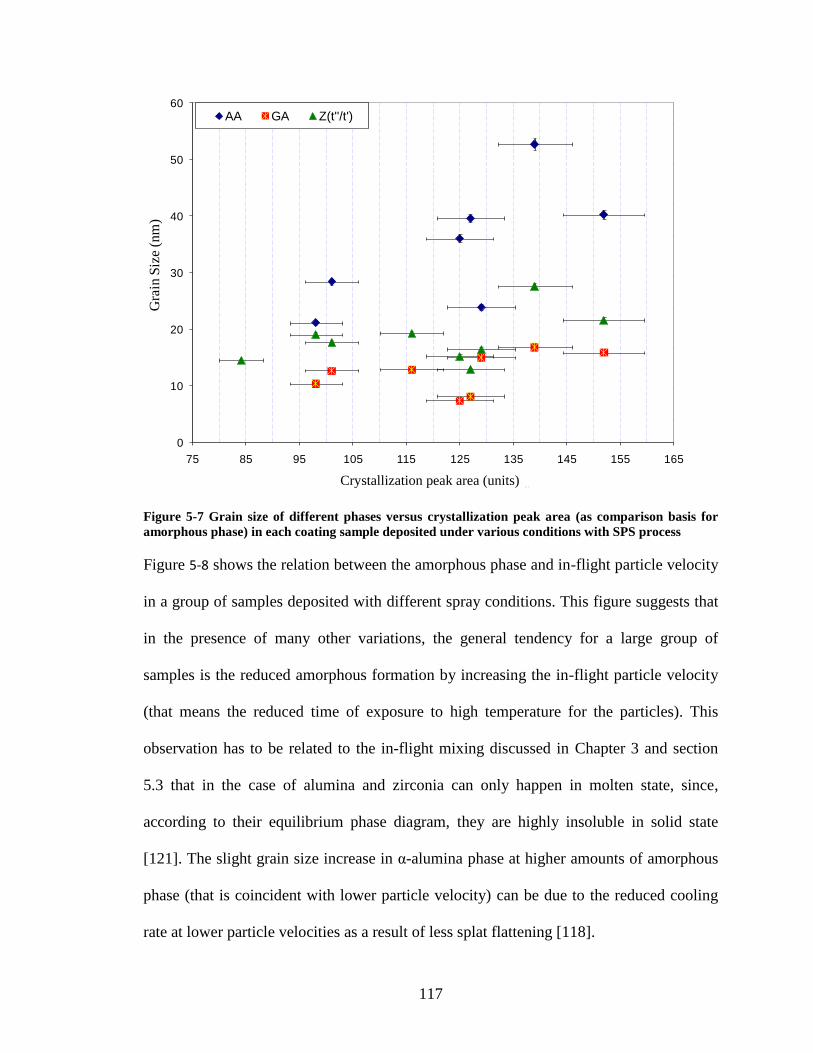
117
0
10
20
30
40
50
60
75 85 95 105 115 125 135 145 155 165
Gra
in S
ize (
nm
)
Crystallization enthalpy (µv.s/mg)
AA GA Z(t''/t')
(Units)Crystallization peak area (units)
Figure 5-7 Grain size of different phases versus crystallization peak area (as comparison basis for
amorphous phase) in each coating sample deposited under various conditions with SPS process
Figure 5-8 shows the relation between the amorphous phase and in-flight particle velocity
in a group of samples deposited with different spray conditions. This figure suggests that
in the presence of many other variations, the general tendency for a large group of
samples is the reduced amorphous formation by increasing the in-flight particle velocity
(that means the reduced time of exposure to high temperature for the particles). This
observation has to be related to the in-flight mixing discussed in Chapter 3 and section
5.3 that in the case of alumina and zirconia can only happen in molten state, since,
according to their equilibrium phase diagram, they are highly insoluble in solid state
[121]. The slight grain size increase in α-alumina phase at higher amounts of amorphous
phase (that is coincident with lower particle velocity) can be due to the reduced cooling
rate at lower particle velocities as a result of less splat flattening [118].
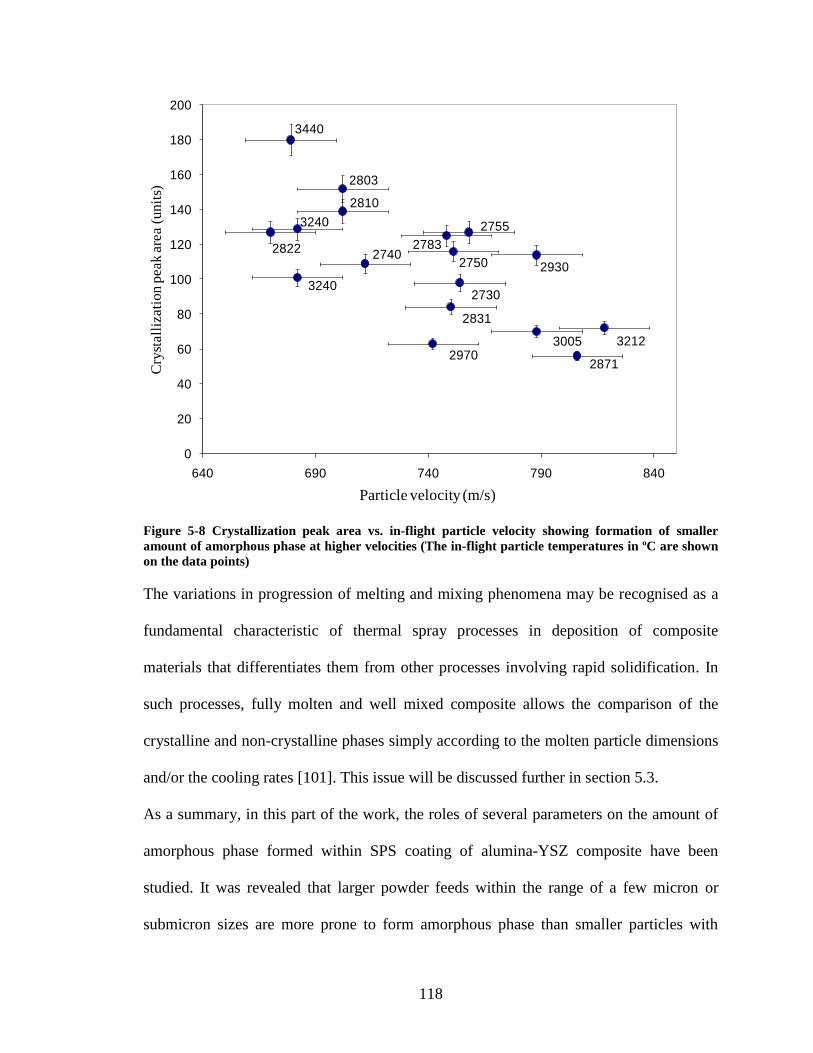
118
28712970
3005 3212
2831
27303240
274029302750
2783
2755
2822
3240
2810
2803
3440
0
20
40
60
80
100
120
140
160
180
200
640 690 740 790 840
Cry
stall
izati
on p
eak a
rea (
unit
s)
Paricle velocity (m/s)Particle velocity (m/s)
Figure 5-8 Crystallization peak area vs. in-flight particle velocity showing formation of smaller
amount of amorphous phase at higher velocities (The in-flight particle temperatures in ºC are shown
on the data points)
The variations in progression of melting and mixing phenomena may be recognised as a
fundamental characteristic of thermal spray processes in deposition of composite
materials that differentiates them from other processes involving rapid solidification. In
such processes, fully molten and well mixed composite allows the comparison of the
crystalline and non-crystalline phases simply according to the molten particle dimensions
and/or the cooling rates [101]. This issue will be discussed further in section 5.3.
As a summary, in this part of the work, the roles of several parameters on the amount of
amorphous phase formed within SPS coating of alumina-YSZ composite have been
studied. It was revealed that larger powder feeds within the range of a few micron or
submicron sizes are more prone to form amorphous phase than smaller particles with
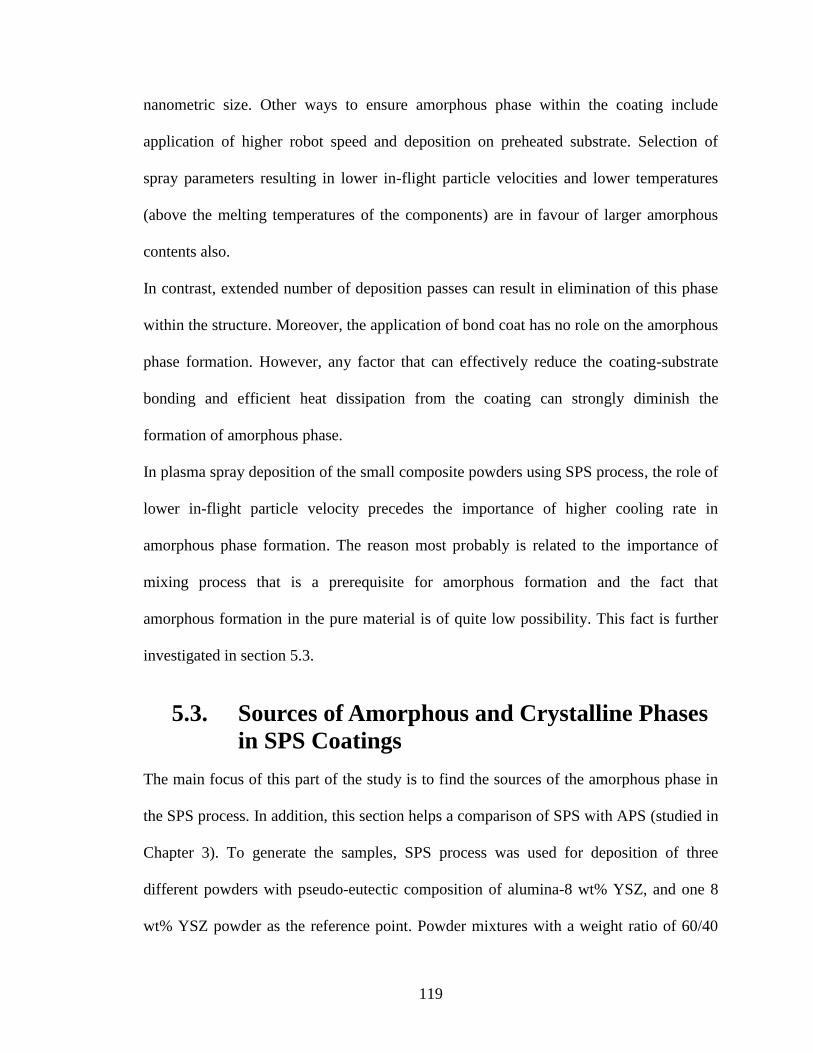
119
nanometric size. Other ways to ensure amorphous phase within the coating include
application of higher robot speed and deposition on preheated substrate. Selection of
spray parameters resulting in lower in-flight particle velocities and lower temperatures
(above the melting temperatures of the components) are in favour of larger amorphous
contents also.
In contrast, extended number of deposition passes can result in elimination of this phase
within the structure. Moreover, the application of bond coat has no role on the amorphous
phase formation. However, any factor that can effectively reduce the coating-substrate
bonding and efficient heat dissipation from the coating can strongly diminish the
formation of amorphous phase.
In plasma spray deposition of the small composite powders using SPS process, the role of
lower in-flight particle velocity precedes the importance of higher cooling rate in
amorphous phase formation. The reason most probably is related to the importance of
mixing process that is a prerequisite for amorphous formation and the fact that
amorphous formation in the pure material is of quite low possibility. This fact is further
investigated in section 5.3.
5.3. Sources of Amorphous and Crystalline Phases
in SPS Coatings
The main focus of this part of the study is to find the sources of the amorphous phase in
the SPS process. In addition, this section helps a comparison of SPS with APS (studied in
Chapter 3). To generate the samples, SPS process was used for deposition of three
different powders with pseudo-eutectic composition of alumina-8 wt% YSZ, and one 8
wt% YSZ powder as the reference point. Powder mixtures with a weight ratio of 60/40
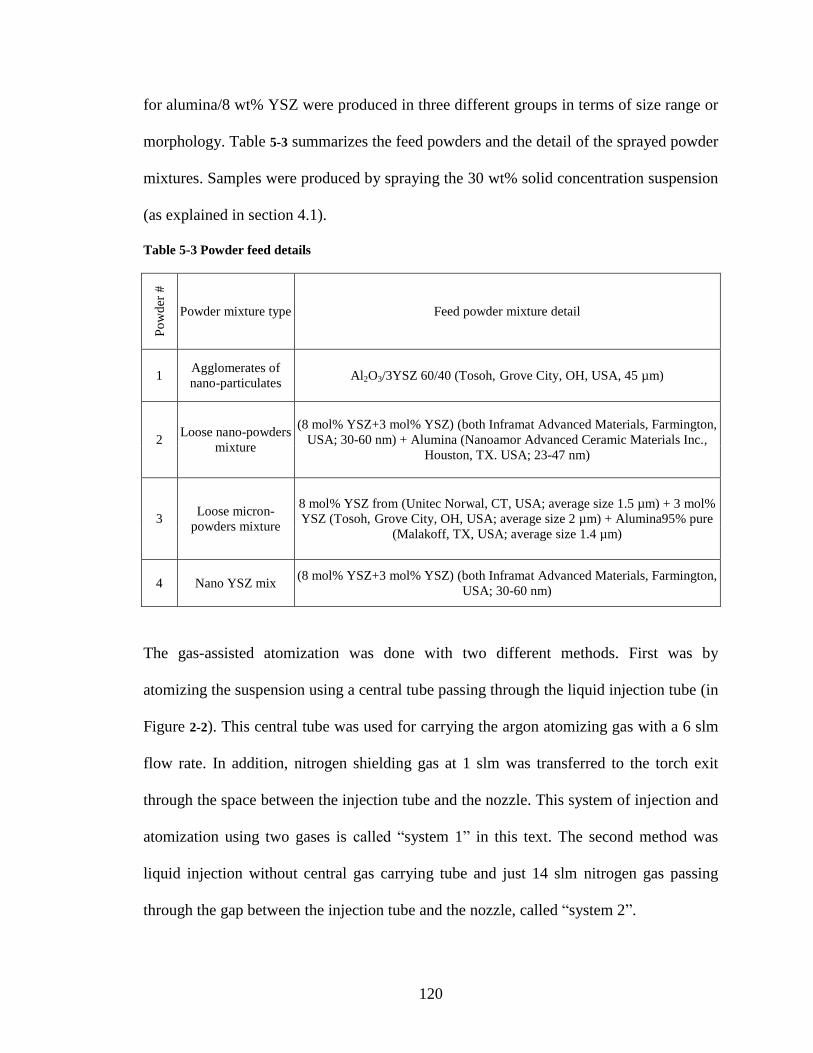
120
for alumina/8 wt% YSZ were produced in three different groups in terms of size range or
morphology. Table 5-3 summarizes the feed powders and the detail of the sprayed powder
mixtures. Samples were produced by spraying the 30 wt% solid concentration suspension
(as explained in section 4.1).
Table 5-3 Powder feed details
Po
wd
er #
Powder mixture type Feed powder mixture detail
1 Agglomerates of
nano-particulates Al2O3/3YSZ 60/40 (Tosoh, Grove City, OH, USA, 45 µm)
2 Loose nano-powders
mixture
(8 mol% YSZ+3 mol% YSZ) (both Inframat Advanced Materials, Farmington,
USA; 30-60 nm) + Alumina (Nanoamor Advanced Ceramic Materials Inc.,
Houston, TX. USA; 23-47 nm)
3 Loose micron-
powders mixture
8 mol% YSZ from (Unitec Norwal, CT, USA; average size 1.5 µm) + 3 mol%
YSZ (Tosoh, Grove City, OH, USA; average size 2 µm) + Alumina95% pure
(Malakoff, TX, USA; average size 1.4 µm)
4 Nano YSZ mix (8 mol% YSZ+3 mol% YSZ) (both Inframat Advanced Materials, Farmington,
USA; 30-60 nm)
The gas-assisted atomization was done with two different methods. First was by
atomizing the suspension using a central tube passing through the liquid injection tube (in
Figure 2-2). This central tube was used for carrying the argon atomizing gas with a 6 slm
flow rate. In addition, nitrogen shielding gas at 1 slm was transferred to the torch exit
through the space between the injection tube and the nozzle. This system of injection and
atomization using two gases is called “system 1” in this text. The second method was
liquid injection without central gas carrying tube and just 14 slm nitrogen gas passing
through the gap between the injection tube and the nozzle, called “system 2”.
121
System 1 was supposed to improve the deposition condition by reducing the clogging at
the tip of the torch as well to enhance melting by atomizing the droplets into smaller
fragments. In practice, even though the jet stability looked better and the clogging was
largely reduced, the particle fragmentation and melting and the coating qualities
(integrity) were clearly better when system 2 was used. Details of the coating qualities
and particle melting in both cases will follow.
The spray condition and injection system for each mixture, as well as the resulting
particle velocity and temperature (as Vp and Tp) are indicated in Table 5-4. In addition, the
amorphous phase contents and the crystallization peak area in the collected particles and
the coatings are listed in the last two columns of Table 5-4. The amorphous contents
reported for the coatings are based on the XRD calculations (details as in section 2.5.2),
and the results for the collected particles are either DSC or are converted from XRD
measurements to DSC results (using the slope of the line in section 2.5.2.3 which related
the XRD results to the DSC crystallization peak sizes) to enable the comparisons.
5.3.1. In-Flight Collected Powders
The measured crystallization peak area in Table 5-4, when system 1 was used for
spraying, was minimum for powder#2 (loose nano-particles), i.e., 10 units. This peak in
the case of powder#1 (agglomerated nano-particulates) was slightly higher, equal to 12
units. The largest amount of amorphous phase was formed after spraying powder#3
(micron-size particles), with crystallization peak area as large as 28 units.
However, using system 2 resulted in larger crystallization peak areas in both powders. So
that for sprayed powder#2 the peak area increased to 20 units and that of powder#3 was
as large as 42 units. To investigate the reason for these differences, the micrographs of
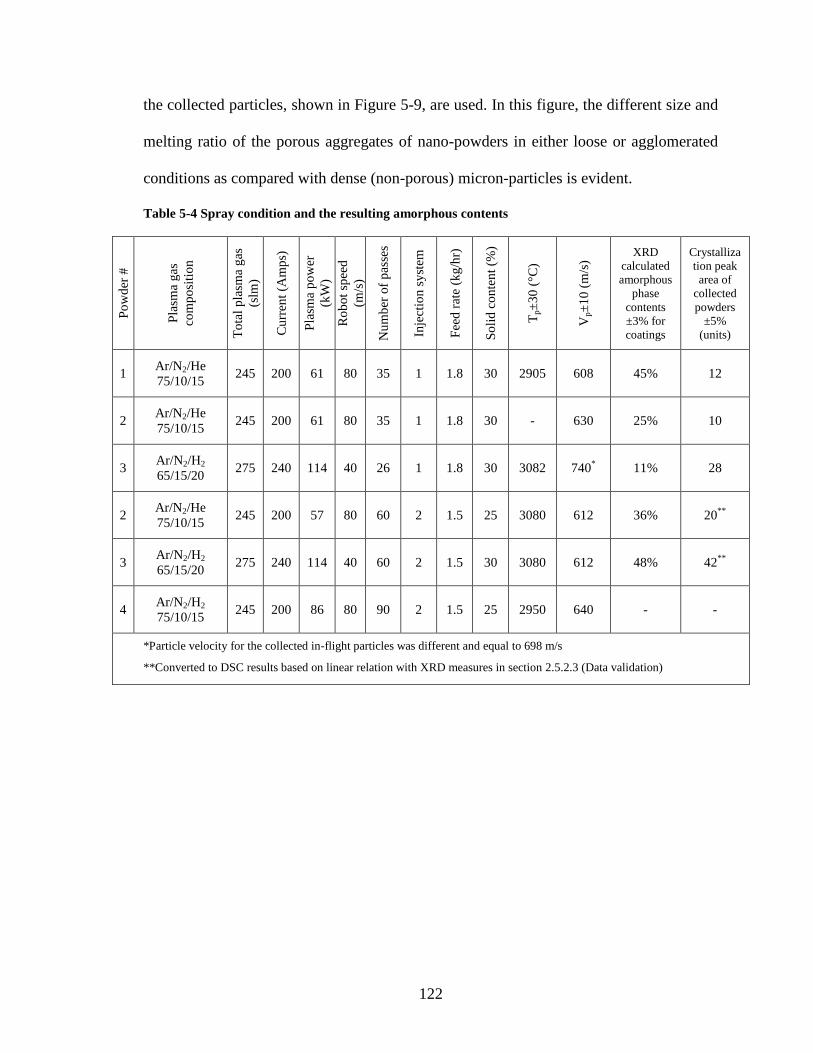
122
the collected particles, shown in Figure 5-9, are used. In this figure, the different size and
melting ratio of the porous aggregates of nano-powders in either loose or agglomerated
conditions as compared with dense (non-porous) micron-particles is evident.
Table 5-4 Spray condition and the resulting amorphous contents
Po
wd
er #
Pla
sma
gas
com
po
siti
on
To
tal
pla
sma
gas
(slm
)
Cu
rren
t (A
mp
s)
Pla
sma
po
wer
(kW
)
Ro
bo
t sp
eed
(m/s
)
Nu
mb
er o
f p
asse
s
Inje
ctio
n s
yst
em
Fee
d r
ate
(kg
/hr)
So
lid
co
nte
nt
(%)
Tp±
30
(°C
)
Vp±
10
(m
/s)
XRD
calculated
amorphous
phase
contents
±3% for
coatings
Crystalliza
tion peak
area of
collected
powders
±5%
(units)
1 Ar/N2/He
75/10/15 245 200 61 80 35 1 1.8 30 2905 608 45% 12
2 Ar/N2/He
75/10/15 245 200 61 80 35 1 1.8 30 - 630 25% 10
3 Ar/N2/H2
65/15/20 275 240 114 40 26 1 1.8 30 3082 740
* 11% 28
2 Ar/N2/He
75/10/15 245 200 57 80 60 2 1.5 25 3080 612 36% 20
**
3 Ar/N2/H2
65/15/20 275 240 114 40 60 2 1.5 30 3080 612 48% 42
**
4 Ar/N2/H2
75/10/15 245 200 86 80 90 2 1.5 25 2950 640 - -
*Particle velocity for the collected in-flight particles was different and equal to 698 m/s
**Converted to DSC results based on linear relation with XRD measures in section 2.5.2.3 (Data validation)
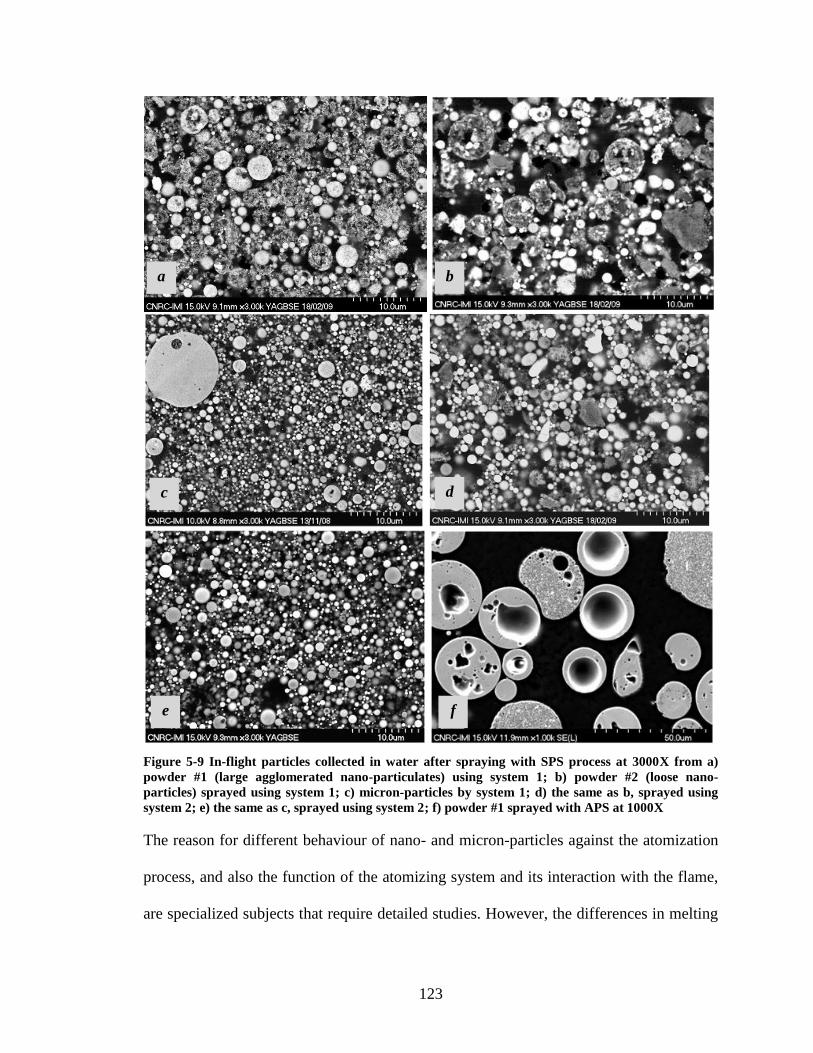
123
Figure 5-9 In-flight particles collected in water after spraying with SPS process at 3000X from a)
powder #1 (large agglomerated nano-particulates) using system 1; b) powder #2 (loose nano-
particles) sprayed using system 1; c) micron-particles by system 1; d) the same as b, sprayed using
system 2; e) the same as c, sprayed using system 2; f) powder #1 sprayed with APS at 1000X
The reason for different behaviour of nano- and micron-particles against the atomization
process, and also the function of the atomizing system and its interaction with the flame,
are specialized subjects that require detailed studies. However, the differences in melting
a
c d
b
e f
124
and mixing behaviour in this investigation helped to find out the significance of these
processes. The role of these phenomena on amorphous formation could explain why the
particle velocity played such a considerable role, a role that could exceed the importance
of the cooling rate.
On the other hand, collected particles of powder#3 (micron-powders) after spraying with
systems 1 and 2, shown in Figure 5-9(c) and (e) respectively, are clearly smaller than
those of nano-powders. This suggests their better treatment (in terms of heating, melting
and shear forces on the molten droplet) by plasma flame resulting in extensive
fragmentation. In addition, the totally round shape of almost all of these particles
(micron-size) indicates their advanced melting. Better heat treatment and melting in the
plasma flame has resulted in larger amorphous phase in this powder type, which initially
consisted of comparatively large and dense particles. The effect of applying system 2 for
powder#2, also, can be observed by comparing Figure 5-9(b) and (d) in which better
fragmentation and more melted round particles can be distinguished when system 2 is
used.
Figure 5-10 demonstrates two different steps of melting in typical particles of powder#2.
Figure 5-10(a) is a particle in the initial stage of melting, with a large proportion of initial
particles with distinct color of each component (white zirconia and black alumina). It is
expected that such partly melted particles will preferably solidify in crystalline structure,
because of the presence of unmolten crystalline solids that play the role of nucleation
sites of crystalline structure. During heating and melting in the flame, the mixed region is
readily extended and appears as the developed grey color in the particle observed in
Figure 5-10(b). The main difference between using systems 1 and 2 in the particles
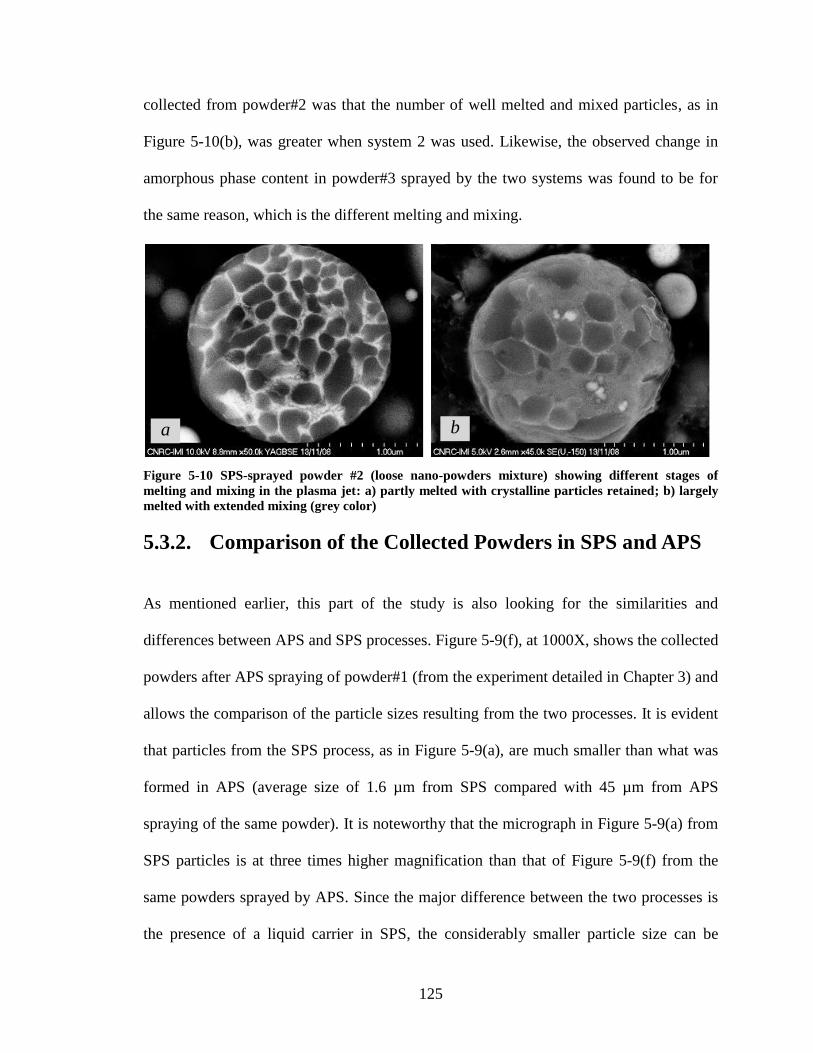
125
collected from powder#2 was that the number of well melted and mixed particles, as in
Figure 5-10(b), was greater when system 2 was used. Likewise, the observed change in
amorphous phase content in powder#3 sprayed by the two systems was found to be for
the same reason, which is the different melting and mixing.
Figure 5-10 SPS-sprayed powder #2 (loose nano-powders mixture) showing different stages of
melting and mixing in the plasma jet: a) partly melted with crystalline particles retained; b) largely
melted with extended mixing (grey color)
5.3.2. Comparison of the Collected Powders in SPS and APS
As mentioned earlier, this part of the study is also looking for the similarities and
differences between APS and SPS processes. Figure 5-9(f), at 1000X, shows the collected
powders after APS spraying of powder#1 (from the experiment detailed in Chapter 3) and
allows the comparison of the particle sizes resulting from the two processes. It is evident
that particles from the SPS process, as in Figure 5-9(a), are much smaller than what was
formed in APS (average size of 1.6 µm from SPS compared with 45 µm from APS
spraying of the same powder). It is noteworthy that the micrograph in Figure 5-9(a) from
SPS particles is at three times higher magnification than that of Figure 5-9(f) from the
same powders sprayed by APS. Since the major difference between the two processes is
the presence of a liquid carrier in SPS, the considerably smaller particle size can be
b
a
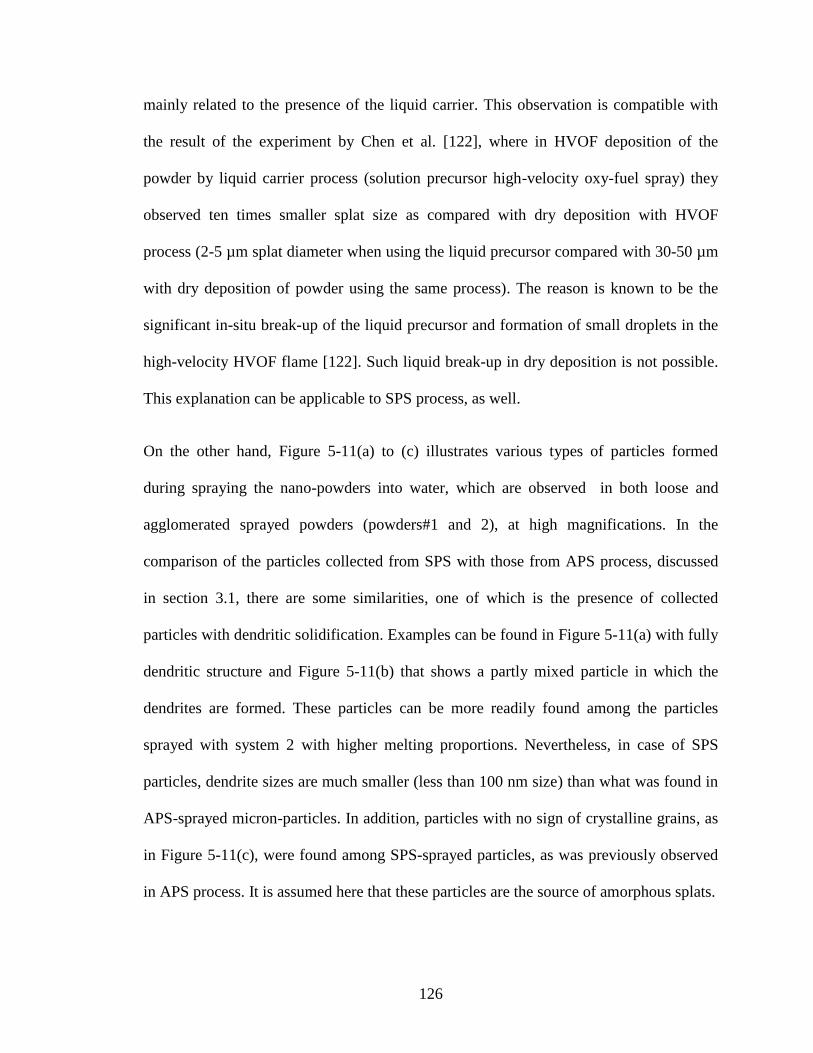
126
mainly related to the presence of the liquid carrier. This observation is compatible with
the result of the experiment by Chen et al. [122], where in HVOF deposition of the
powder by liquid carrier process (solution precursor high-velocity oxy-fuel spray) they
observed ten times smaller splat size as compared with dry deposition with HVOF
process (2-5 µm splat diameter when using the liquid precursor compared with 30-50 µm
with dry deposition of powder using the same process). The reason is known to be the
significant in-situ break-up of the liquid precursor and formation of small droplets in the
high-velocity HVOF flame [122]. Such liquid break-up in dry deposition is not possible.
This explanation can be applicable to SPS process, as well.
On the other hand, Figure 5-11(a) to (c) illustrates various types of particles formed
during spraying the nano-powders into water, which are observed in both loose and
agglomerated sprayed powders (powders#1 and 2), at high magnifications. In the
comparison of the particles collected from SPS with those from APS process, discussed
in section 3.1, there are some similarities, one of which is the presence of collected
particles with dendritic solidification. Examples can be found in Figure 5-11(a) with fully
dendritic structure and Figure 5-11(b) that shows a partly mixed particle in which the
dendrites are formed. These particles can be more readily found among the particles
sprayed with system 2 with higher melting proportions. Nevertheless, in case of SPS
particles, dendrite sizes are much smaller (less than 100 nm size) than what was found in
APS-sprayed micron-particles. In addition, particles with no sign of crystalline grains, as
in Figure 5-11(c), were found among SPS-sprayed particles, as was previously observed
in APS process. It is assumed here that these particles are the source of amorphous splats.
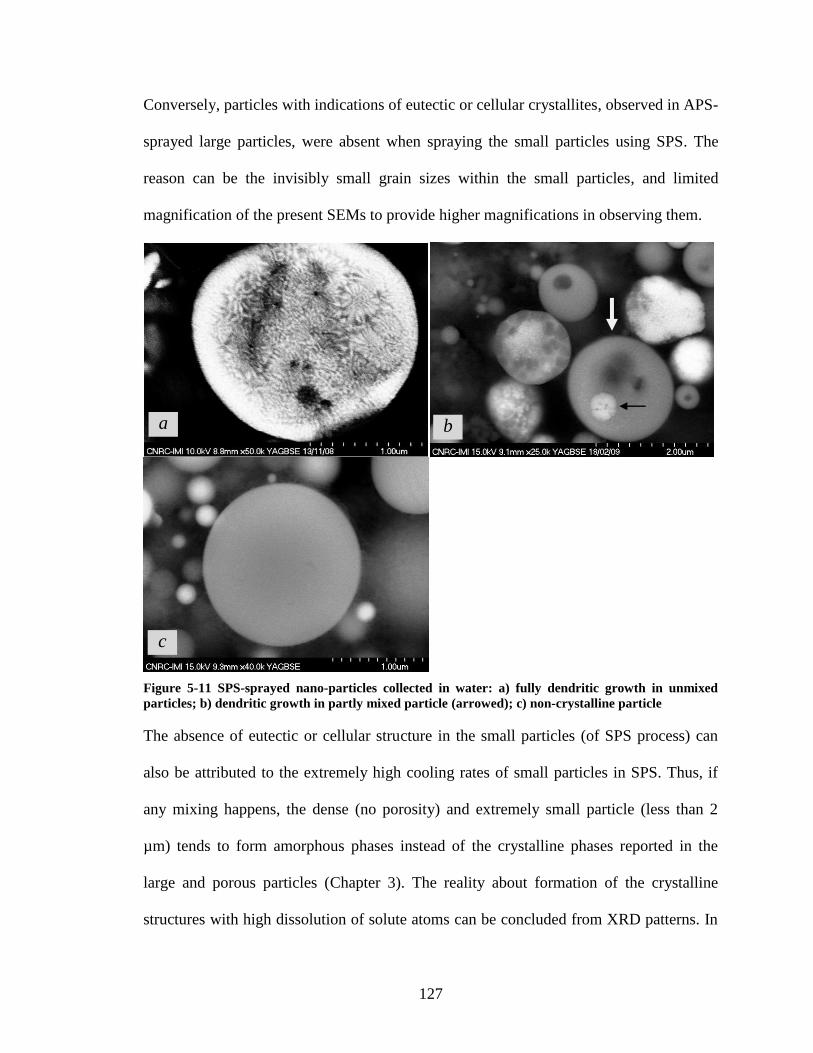
127
Conversely, particles with indications of eutectic or cellular crystallites, observed in APS-
sprayed large particles, were absent when spraying the small particles using SPS. The
reason can be the invisibly small grain sizes within the small particles, and limited
magnification of the present SEMs to provide higher magnifications in observing them.
Figure 5-11 SPS-sprayed nano-particles collected in water: a) fully dendritic growth in unmixed
particles; b) dendritic growth in partly mixed particle (arrowed); c) non-crystalline particle
The absence of eutectic or cellular structure in the small particles (of SPS process) can
also be attributed to the extremely high cooling rates of small particles in SPS. Thus, if
any mixing happens, the dense (no porosity) and extremely small particle (less than 2
µm) tends to form amorphous phases instead of the crystalline phases reported in the
large and porous particles ( Chapter 3). The reality about formation of the crystalline
structures with high dissolution of solute atoms can be concluded from XRD patterns. In
b
c
a
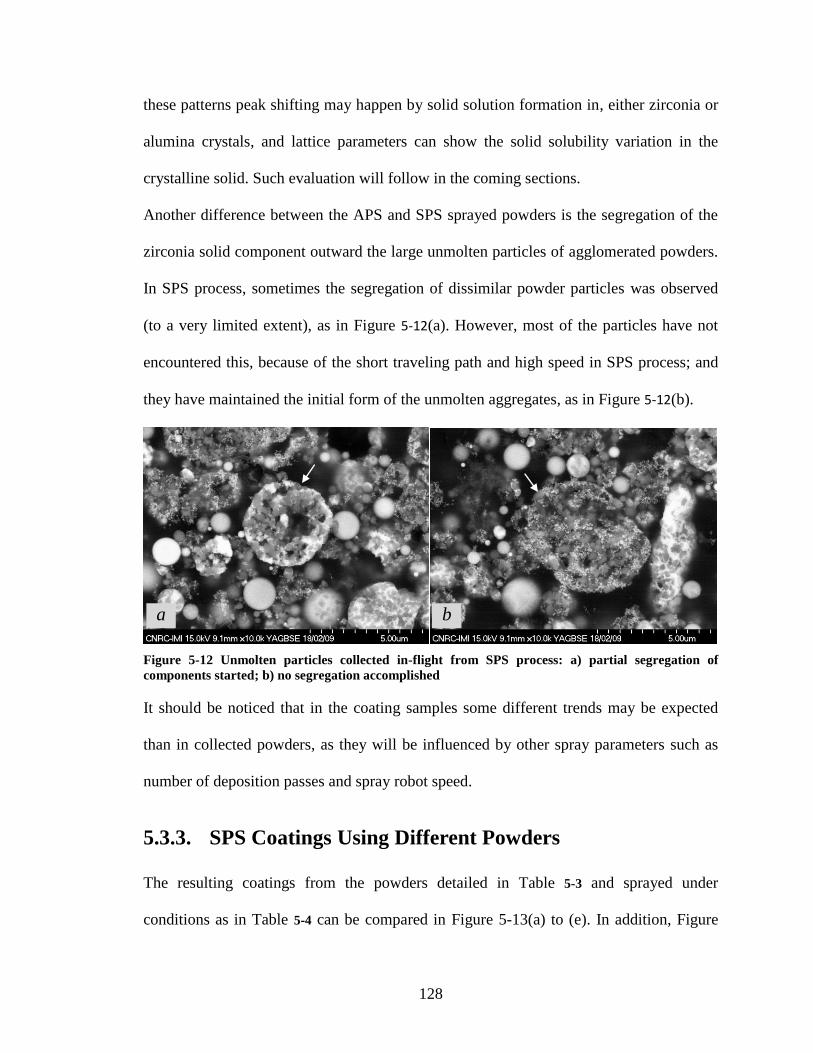
128
these patterns peak shifting may happen by solid solution formation in, either zirconia or
alumina crystals, and lattice parameters can show the solid solubility variation in the
crystalline solid. Such evaluation will follow in the coming sections.
Another difference between the APS and SPS sprayed powders is the segregation of the
zirconia solid component outward the large unmolten particles of agglomerated powders.
In SPS process, sometimes the segregation of dissimilar powder particles was observed
(to a very limited extent), as in Figure 5-12(a). However, most of the particles have not
encountered this, because of the short traveling path and high speed in SPS process; and
they have maintained the initial form of the unmolten aggregates, as in Figure 5-12(b).
Figure 5-12 Unmolten particles collected in-flight from SPS process: a) partial segregation of
components started; b) no segregation accomplished
It should be noticed that in the coating samples some different trends may be expected
than in collected powders, as they will be influenced by other spray parameters such as
number of deposition passes and spray robot speed.
5.3.3. SPS Coatings Using Different Powders
The resulting coatings from the powders detailed in Table 5-3 and sprayed under
conditions as in Table 5-4 can be compared in Figure 5-13(a) to (e). In addition, Figure
a
b
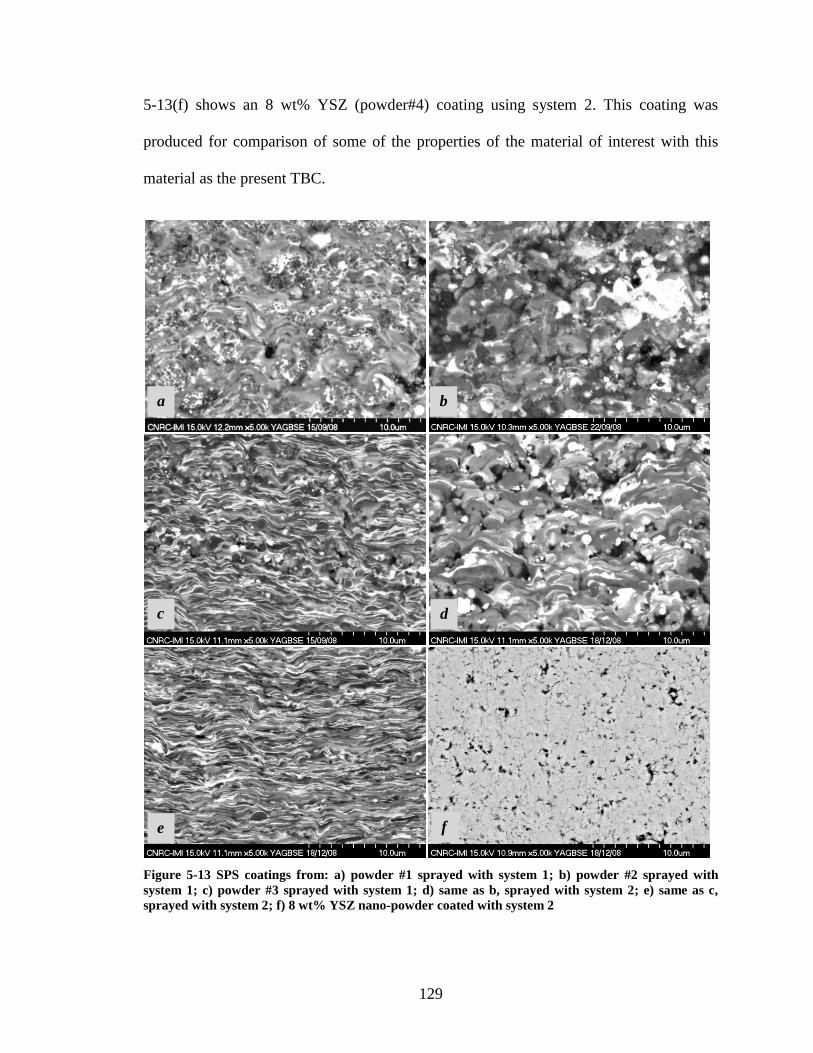
129
5-13(f) shows an 8 wt% YSZ (powder#4) coating using system 2. This coating was
produced for comparison of some of the properties of the material of interest with this
material as the present TBC.
Figure 5-13 SPS coatings from: a) powder #1 sprayed with system 1; b) powder #2 sprayed with
system 1; c) powder #3 sprayed with system 1; d) same as b, sprayed with system 2; e) same as c,
sprayed with system 2; f) 8 wt% YSZ nano-powder coated with system 2
b
e
d c
a
f
130
Figure 5-13(a) from powder#1 (agglomerated nano-particulates) deposited using system 1
presents a low melting fraction. In this figure the unmolten or partly molten particles are
cemented in the fully molten splats forming a bi-modal structure (consisting of
aggregates of unmolten nano-particles embedded in the molten and solidified structure),
as found by Lima et al. in APS coating of 7 wt% YSZ [123]. This coating consists of
uniformly distributed phases and integrated microstructure. The molten part has formed a
homogeneous structure, as observed in the non-crystalline particles of the collected
powders. However, this bi-modal structure consists of much smaller entities in terms of
both splat size and unmolten particles than when APS is used [123].
Coatings from the powder#2 (loose nano-powders) injected using system 1 are shown in
Figure 5-13(b). In spite of continuity, these coatings possess very loose intersplat
connections of dissimilar splats with irregular boundaries and low mixing ratios. The
coating in Figure 5-13(d), using the same powder applied with system 2, in spite of the
better melting conditions still lacks well-bonded splats. This is mainly because of the
large fraction of partly molten particles observed in the corresponding collected particles
in Figure 5-10(a). The coatings from micron-powders in Figure 5-13(c) and (e) propose
the improved melting and flattening when system 2 is used.
The calculated amorphous contents for the coatings as summarized in Table 5-4, show
that as a result of improved melting in powder#2 with system 2, this quantity has
increased from 25% to 36%; and in the coatings of powder#3 a jump from 11% to 48%
has occurred. It can, therefore, be expected that particles with full melting and mixing,
and negligible or no retained unmolten solid, can show the best potential for amorphous
formation within the coatings.
131
The monotonic structure of the 8 wt% YSZ deposited by SPS (Figure 5-13(f)) presents
porosity sizes from nano to a few microns. In addition, in this figure, no clear intersplat
boundary can be found. This is in contrast with alumina-YSZ coatings in Figure 5-13(a)
to (e) with a large number of intersplat boundaries between the alumina and zirconia
splats. This microstructural difference (apart from material dissimilarity) can result in
differences in the properties especially at high temperature, as will be discussed in section
6.5.
5.3.4. Sources of Crystalline Phases and the Nature of
Amorphous Phase
The XRD patterns of the resulting coatings, in Figure 5-14, propose similar crystalline
structures for the four above coatings that consist of a combination of mainly cubic
zirconia and (α + γ) alumina as shown in Figure 5-14(a). The exception is the coating
shown in Figure 5-14(b) that is powder#3 (micron-powders) produced with system 2.
This coating with the highest amorphous content (48% based on Table 5-4) presents only
γ-alumina phase. This suggests the extensive melting and disappearance of the initial
crystalline structure of the powder (α-alumina), and solidification at high cooling rates.
The structure of the nano-powder of 8 wt% YSZ (without alumina) deposited with SPS
process in Figure 5-14(c) illustrates mainly cubic as well as some monoclinic zirconia in
spite the comparatively high content of yttria stabilizing agent. This structure is different
from that found in Chapter 3, where deposition of the same material using APS process
results in mainly tetragonal structure. This difference can be explained with the high heat
input from the torch to the substrate due to the short distance and much higher particle
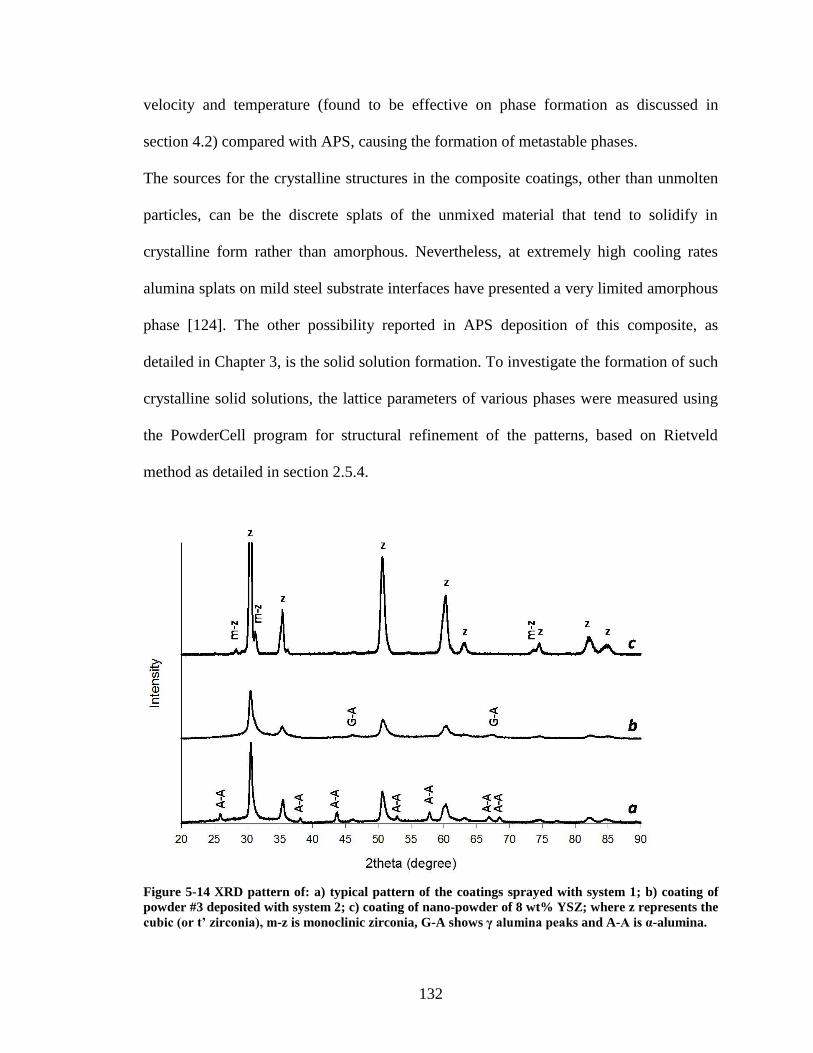
132
velocity and temperature (found to be effective on phase formation as discussed in
section 4.2) compared with APS, causing the formation of metastable phases.
The sources for the crystalline structures in the composite coatings, other than unmolten
particles, can be the discrete splats of the unmixed material that tend to solidify in
crystalline form rather than amorphous. Nevertheless, at extremely high cooling rates
alumina splats on mild steel substrate interfaces have presented a very limited amorphous
phase [124]. The other possibility reported in APS deposition of this composite, as
detailed in Chapter 3, is the solid solution formation. To investigate the formation of such
crystalline solid solutions, the lattice parameters of various phases were measured using
the PowderCell program for structural refinement of the patterns, based on Rietveld
method as detailed in section 2.5.4.
Figure 5-14 XRD pattern of: a) typical pattern of the coatings sprayed with system 1; b) coating of
powder #3 deposited with system 2; c) coating of nano-powder of 8 wt% YSZ; where z represents the
cubic(ort’zirconia),m-z is monoclinic zirconia, G-A shows γaluminapeaks and A-Aisα-alumina.
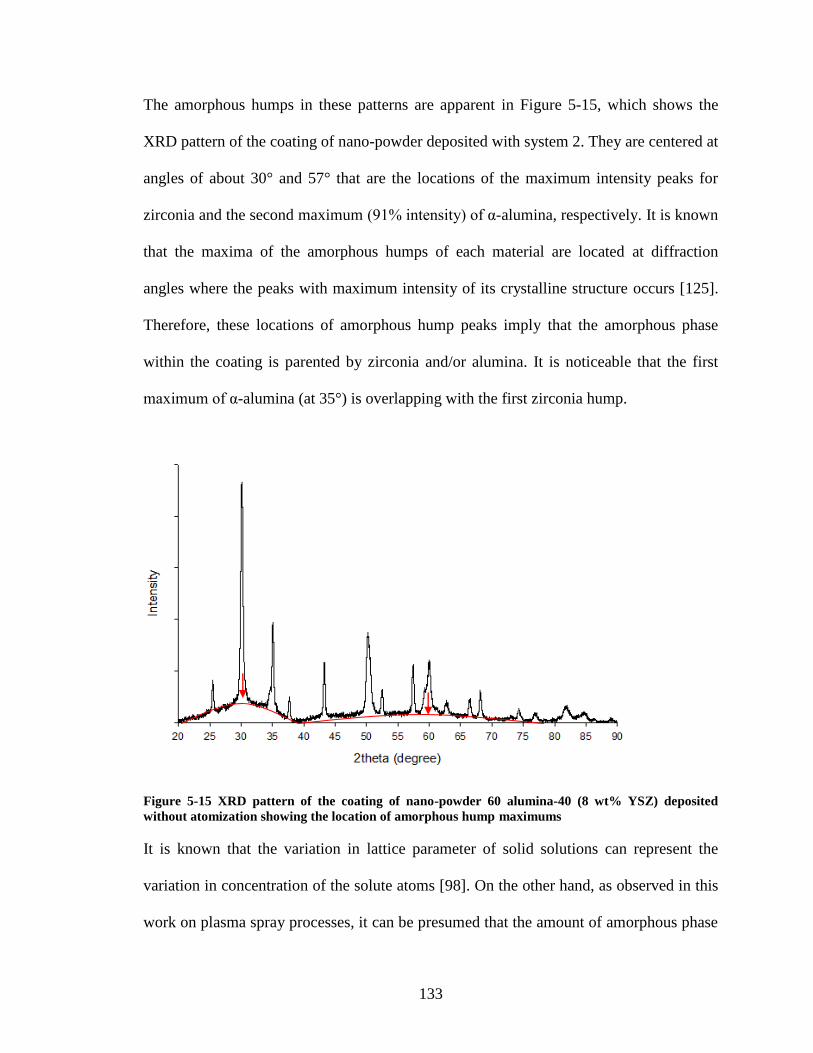
133
The amorphous humps in these patterns are apparent in Figure 5-15, which shows the
XRD pattern of the coating of nano-powder deposited with system 2. They are centered at
angles of about 30° and 57° that are the locations of the maximum intensity peaks for
zirconia and the second maximum (91% intensity) of α-alumina, respectively. It is known
that the maxima of the amorphous humps of each material are located at diffraction
angles where the peaks with maximum intensity of its crystalline structure occurs [125].
Therefore, these locations of amorphous hump peaks imply that the amorphous phase
within the coating is parented by zirconia and/or alumina. It is noticeable that the first
maximum of α-alumina (at 35°) is overlapping with the first zirconia hump.
Figure 5-15 XRD pattern of the coating of nano-powder 60 alumina-40 (8 wt% YSZ) deposited
without atomization showing the location of amorphous hump maximums
It is known that the variation in lattice parameter of solid solutions can represent the
variation in concentration of the solute atoms [98]. On the other hand, as observed in this
work on plasma spray processes, it can be presumed that the amount of amorphous phase
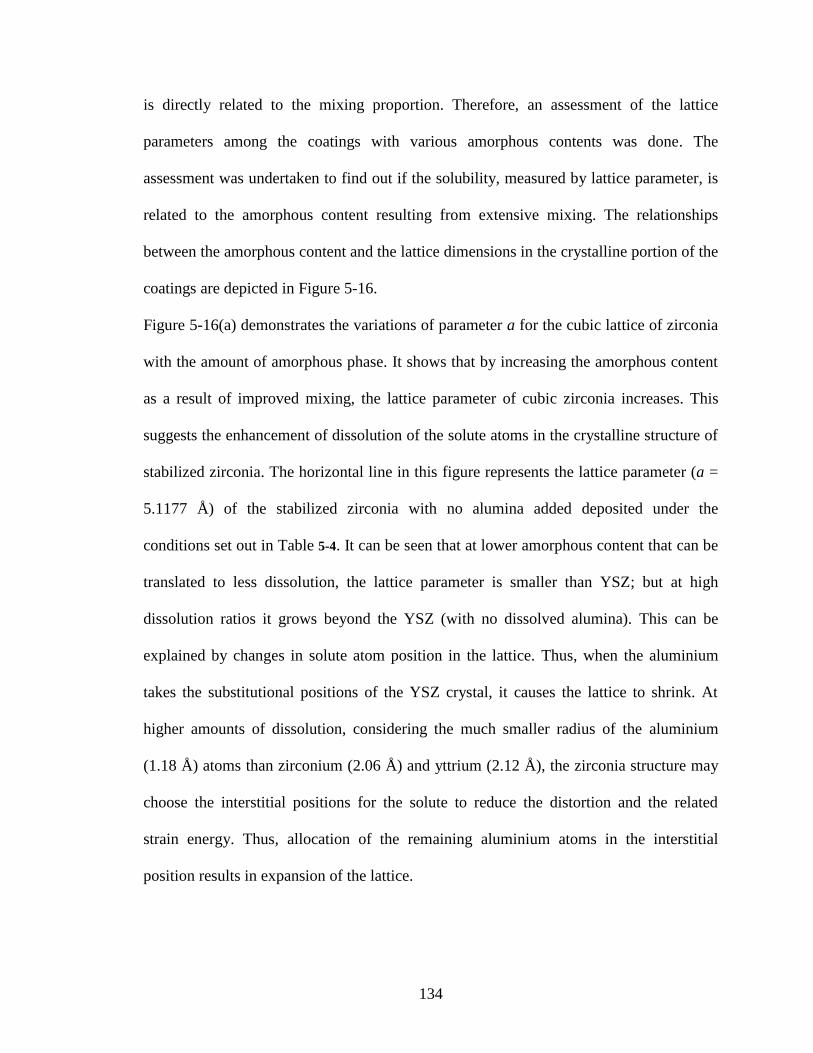
134
is directly related to the mixing proportion. Therefore, an assessment of the lattice
parameters among the coatings with various amorphous contents was done. The
assessment was undertaken to find out if the solubility, measured by lattice parameter, is
related to the amorphous content resulting from extensive mixing. The relationships
between the amorphous content and the lattice dimensions in the crystalline portion of the
coatings are depicted in Figure 5-16.
Figure 5-16(a) demonstrates the variations of parameter a for the cubic lattice of zirconia
with the amount of amorphous phase. It shows that by increasing the amorphous content
as a result of improved mixing, the lattice parameter of cubic zirconia increases. This
suggests the enhancement of dissolution of the solute atoms in the crystalline structure of
stabilized zirconia. The horizontal line in this figure represents the lattice parameter (a =
5.1177 Å) of the stabilized zirconia with no alumina added deposited under the
conditions set out in Table 5-4. It can be seen that at lower amorphous content that can be
translated to less dissolution, the lattice parameter is smaller than YSZ; but at high
dissolution ratios it grows beyond the YSZ (with no dissolved alumina). This can be
explained by changes in solute atom position in the lattice. Thus, when the aluminium
takes the substitutional positions of the YSZ crystal, it causes the lattice to shrink. At
higher amounts of dissolution, considering the much smaller radius of the aluminium
(1.18 Å) atoms than zirconium (2.06 Å) and yttrium (2.12 Å), the zirconia structure may
choose the interstitial positions for the solute to reduce the distortion and the related
strain energy. Thus, allocation of the remaining aluminium atoms in the interstitial
position results in expansion of the lattice.
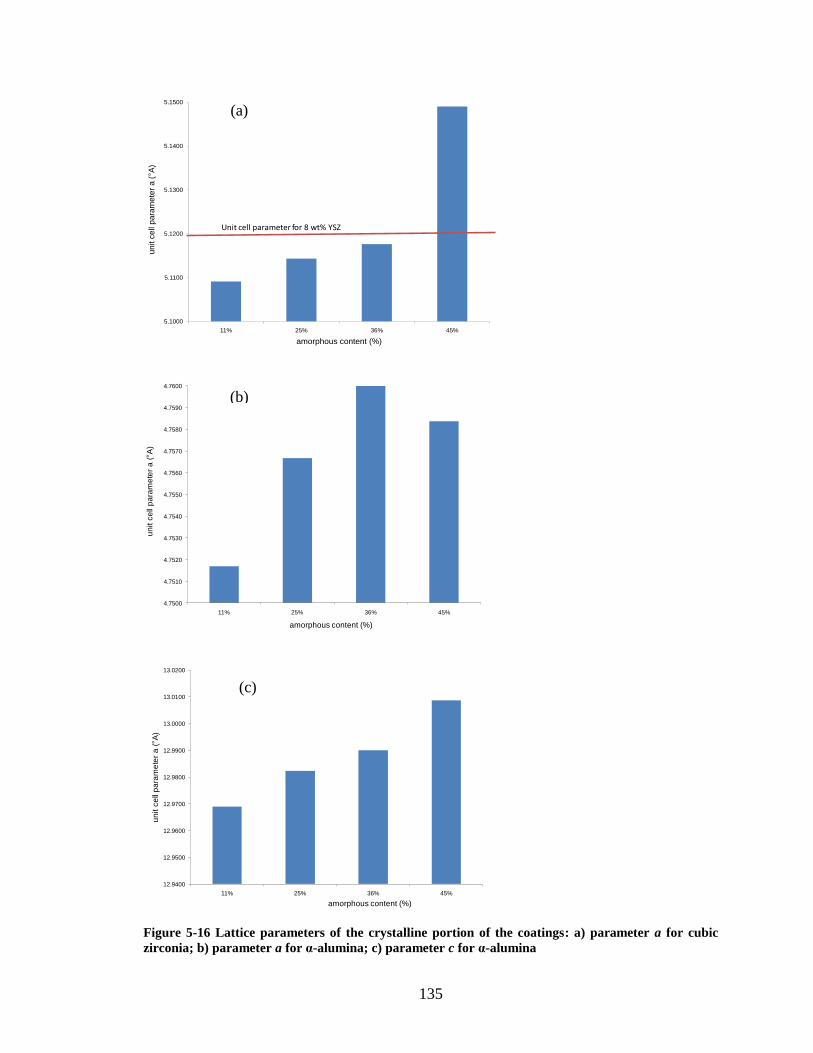
135
5.1000
5.1100
5.1200
5.1300
5.1400
5.1500
11% 25% 36% 45%
unit c
ell
para
mete
r a ( A
)
amorphous content (%)
Unit cell parameter for 8 wt% YSZ
4.7500
4.7510
4.7520
4.7530
4.7540
4.7550
4.7560
4.7570
4.7580
4.7590
4.7600
11% 25% 36% 45%
un
it c
ell
pa
ram
ete
r a
( A
)
amorphous content (%)
12.9400
12.9500
12.9600
12.9700
12.9800
12.9900
13.0000
13.0100
13.0200
11% 25% 36% 45%
un
it c
ell
pa
ram
ete
r a
( A
)
amorphous content (%)
Figure 5-16 Lattice parameters of the crystalline portion of the coatings: a) parameter a for cubic
zirconia; b) parameter a for α-alumina; c) parameter c for α-alumina
(a)
(b)
(c)
136
Assessment of the α-alumina structure with the two parameters a and c reveals that the
same approximate increasing trend is followed, as is apparent in Figure 5-16(b) and (c).
This means increased amorphous percentage is concurrent with the larger lattice
parameter as a result of extended solubility. Zirconium atoms with a much larger atomic
radius than aluminium cause the expansion of the alumina lattices by forming
substitutional solid solution. This solubility sometimes is as high as supersaturation, as
found in Chapter 3. Thus, the disappearance of the alumina component when sprayed
with zirconia can be not only the result of amorphous phase formation; the extended solid
solubility into zirconia during plasma spray deposition also plays a major role.
However, the large atomic number difference between aluminium and zirconium that can
shadow the detection of small amounts of free crystalline alumina should not be ignored
[98]. This happens when in a system of elements A and B, in two-phase region (e.g., α+β,
where α and β are solid solutions of A with solute atom B and B with solute atom A,
respectively) the atomic number of one type of atoms (e.g., A) is too small compared
with the other element (e.g., B), the intensity of A remains undetected (a difference of
more than 70 in atomic number can prevent detection of up to 50 wt% of α-phase) [98].
Accordingly, the oxides of these elements can show the same behaviour. This means that
small amounts of crystalline alumina in the system may exist, but due to low intensity of
the scattered beams of aluminium compared with heavy (large atomic number) zirconium
and yttrium atoms, are not detected.
A summary of the results in this section includes the following. The in-flight collected
particle studies suggest that there are major similarities between APS and SPS processes
in terms of melting, mixing and phase formation as well as the effective parameters on
137
these phenomena. However, the fragmentation of the particles in APS is not considerable
as compared with SPS. As a result, while this work has focused on the parameters in SPS,
both methods can be used in production of high amorphous coatings using similar roles
for the corresponding parameters. In this section it was revealed that in-flight melting
followed by mixing are crucial processes in amorphous formation. The observed role of
the lower particle velocity that results in higher amorphous content, in spite of the lower
cooling rates, was justified. This means that the significance of the in-flight particle
velocity is due to its effect on longer melting and mixing times.
The amorphous phase in the coating seems to be composed of two compositional ranges.
One is with high alumina and the other with high zirconia. This was concluded from the
amorphous humps maxima which matched the locations of the crystalline peaks with
maximum intensity of alumina and zirconia. On the other hand, the crystalline structures
present an exceptionally extended solubility of both the components, especially alumina
into the zirconia lattice. The lattice parameter studies suggest that the aluminium atoms
possibly take the substitutional sites at low ratios and interstitial sites when higher
amounts of alumina are being dissolved in zirconia. In contrast, large zirconium atoms
have no choice but substitutional positions during dissolution in alumina structure,
resulting in ever increasing the lattice parameters of alumina by dissolution ratio. The
components in the composite materials sprayed by plasma processes may form crystalline
structure of alumina or YSZ with no additional solute atoms than what they already had,
dissolve the solute atoms of the second or more components and form crystalline solid
solutions (even to exceptionally high levels of solubility), and/or form amorphous phase.
138
5.4. Summary
It was observed in the SPS process that, for the development of the amorphous phase in
the coatings, extremely small nano-particle feed is not necessary. Conversely, it is a
powder size of a few microns that provides larger amounts of the amorphous phase. Other
spray parameters that can enhance this phase are higher robot speed, fewer deposition
passes and preheating the substrate. Particle velocity also plays an important role in the
amorphous content of the coating, such that a lower velocity caused higher amorphous
content. In contrast, particle temperature plays a negligible role in the amorphous phase
formation (as long as it is above the melting point of the components). However, when
the particle temperature is too high, it can reduce the amount of the amorphous phase.
The key to amorphous formation in plasma spray of multi-component systems such as
alumina-YSZ composite, consisting of insoluble components in solid state, is their
mixing in molten state. The amorphous phase can be parented by either alumina or
zirconia, depending on the mixing ratios within the splat. When the well-mixed melt does
not solidify in the amorphous phase, it can form crystalline solid solution within the
saturation limit or in supersaturated condition.
139
Chapter 6 Thermal Evolution and High-
Temperature Performance of the Mixed
Amorphous/Crystalline Structure
This chapter involves evaluation of the thermal and mechanical behaviour of the
composite coating of interest (pseudo-eutectic alumina- 8 wt% YSZ) in the presence of
amorphous phase. It investigates the roles of the amorphous phase in as-deposited
coating, as well as the properties of the coating after heat treatment.
6.1. Crystallization and Phase Transformation
Temperatures versus Amorphous Content
One question that this research was to address is the role of the amorphous phase content
on the crystallization and consequent transformation temperatures in the composite
coating. Figure 6-1 represents the two main transformation temperatures versus
crystallization peak area (representing amorphous content) extracted from DSC curves.
The crystallization temperature in this diagram varies in the range of 951-956°C while
the crystallization peak area ranges from 2 to 152 units. As can be seen, the variation of
crystallization temperature is not affected by the amorphous phase content. This
observation contradicts the proposition by Kim et al. [24] about the probable importance
of the amorphous content on crystallization temperature in this composite, causing
discrepancy in different reports. In these reports, the composites were produced with
different processes and impurity contents. Therefore, the sources for the differences in the
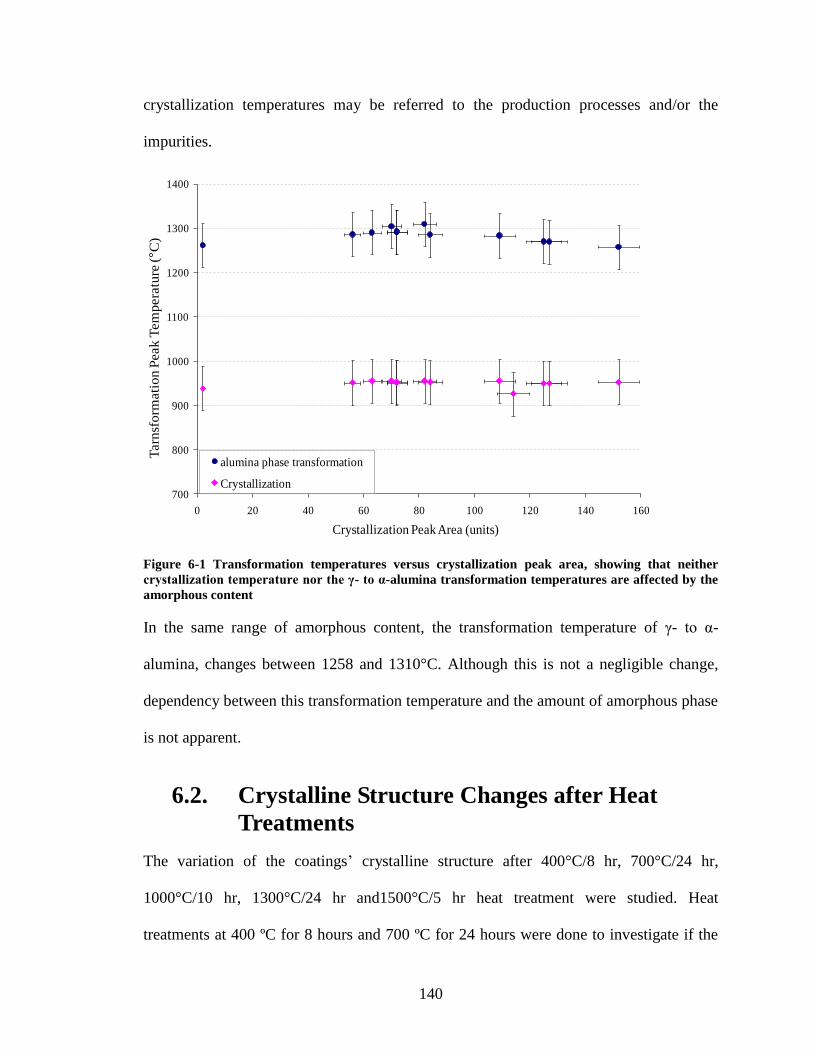
140
crystallization temperatures may be referred to the production processes and/or the
impurities.
700
800
900
1000
1100
1200
1300
1400
0 20 40 60 80 100 120 140 160
Tarn
sfo
rmati
on
Peak
Tem
pera
ture
(°C
)
Crystallization Enthalpy (µv.s/mgr)
alumina phase transformation
Crystallization
Crystallization Peak Area (units)
Figure 6-1 Transformation temperatures versus crystallization peak area, showing that neither
crystallizationtemperaturenortheγ- toα-alumina transformation temperatures are affected by the
amorphous content
In the same range of amorphous content, the transformation temperature of γ- to α-
alumina, changes between 1258 and 1310°C. Although this is not a negligible change,
dependency between this transformation temperature and the amount of amorphous phase
is not apparent.
6.2. Crystalline Structure Changes after Heat
Treatments
The variation of the coatings’ crystalline structure after 400°C/8 hr, 700°C/24 hr,
1000°C/10 hr, 1300°C/24 hr and1500°C/5 hr heat treatment were studied. Heat
treatments at 400 ºC for 8 hours and 700 ºC for 24 hours were done to investigate if the
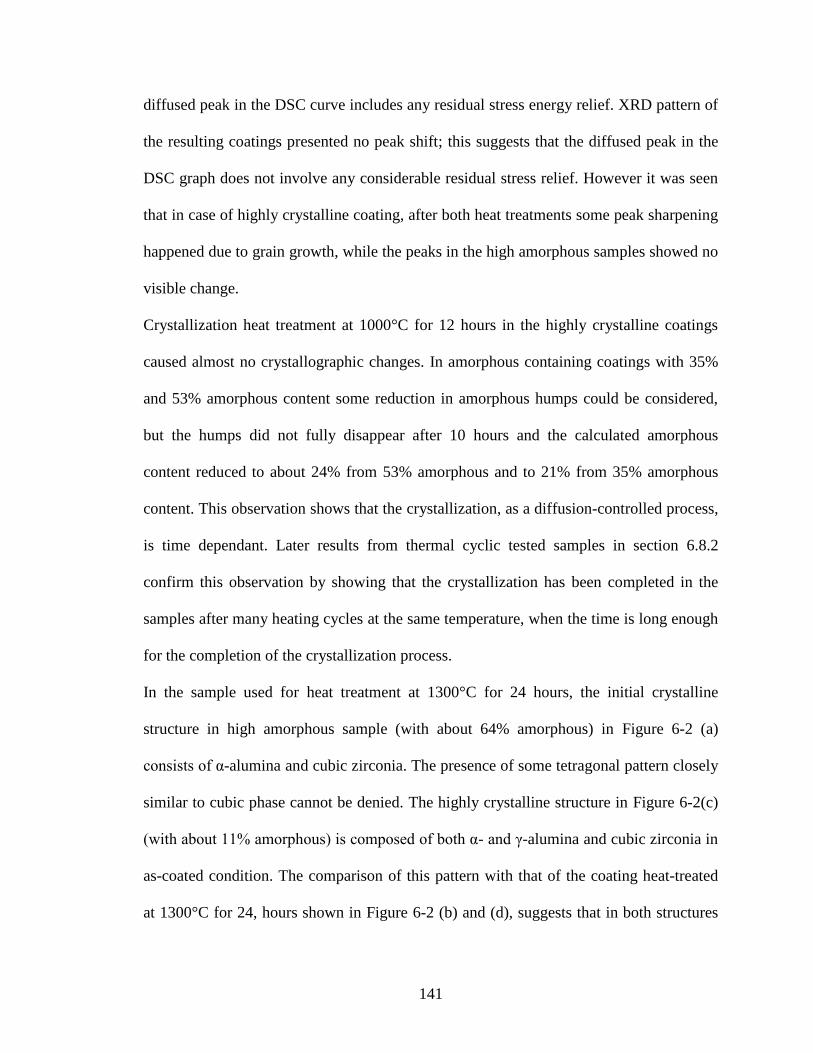
141
diffused peak in the DSC curve includes any residual stress energy relief. XRD pattern of
the resulting coatings presented no peak shift; this suggests that the diffused peak in the
DSC graph does not involve any considerable residual stress relief. However it was seen
that in case of highly crystalline coating, after both heat treatments some peak sharpening
happened due to grain growth, while the peaks in the high amorphous samples showed no
visible change.
Crystallization heat treatment at 1000°C for 12 hours in the highly crystalline coatings
caused almost no crystallographic changes. In amorphous containing coatings with 35%
and 53% amorphous content some reduction in amorphous humps could be considered,
but the humps did not fully disappear after 10 hours and the calculated amorphous
content reduced to about 24% from 53% amorphous and to 21% from 35% amorphous
content. This observation shows that the crystallization, as a diffusion-controlled process,
is time dependant. Later results from thermal cyclic tested samples in section 6.8.2
confirm this observation by showing that the crystallization has been completed in the
samples after many heating cycles at the same temperature, when the time is long enough
for the completion of the crystallization process.
In the sample used for heat treatment at 1300°C for 24 hours, the initial crystalline
structure in high amorphous sample (with about 64% amorphous) in Figure 6-2 (a)
consists of α-alumina and cubic zirconia. The presence of some tetragonal pattern closely
similar to cubic phase cannot be denied. The highly crystalline structure in Figure 6-2(c)
(with about 11% amorphous) is composed of both α- and γ-alumina and cubic zirconia in
as-coated condition. The comparison of this pattern with that of the coating heat-treated
at 1300°C for 24, hours shown in Figure 6-2 (b) and (d), suggests that in both structures
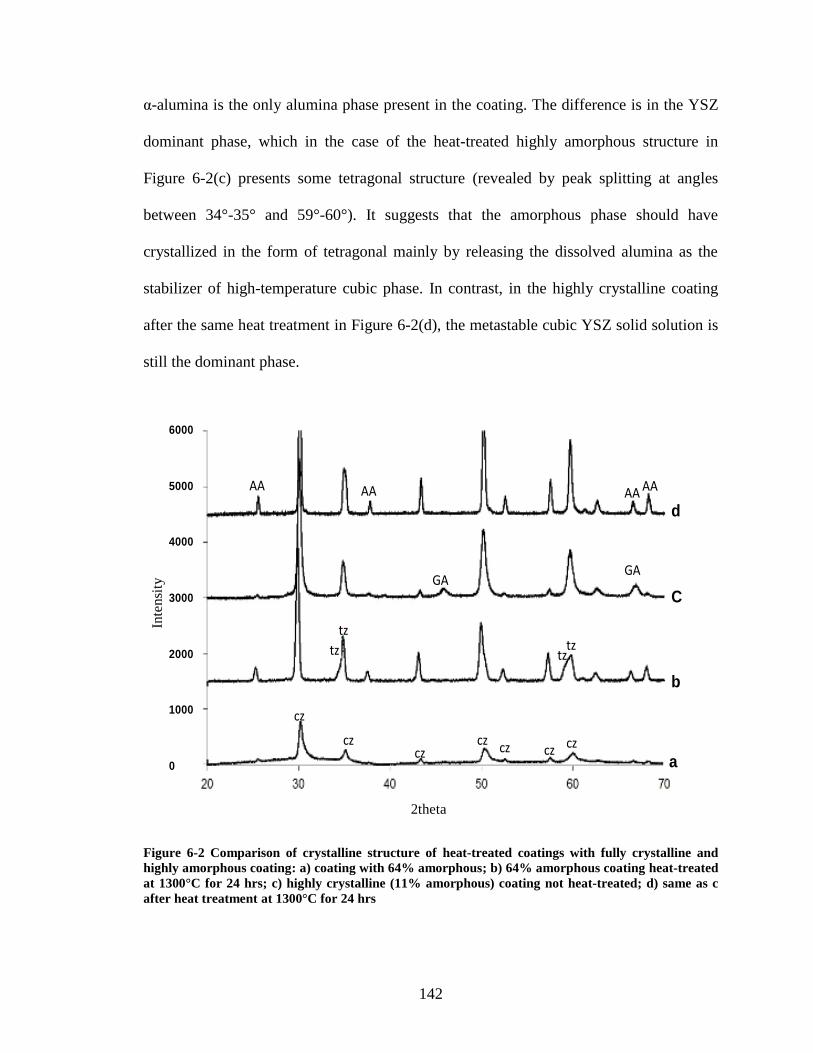
142
α-alumina is the only alumina phase present in the coating. The difference is in the YSZ
dominant phase, which in the case of the heat-treated highly amorphous structure in
Figure 6-2(c) presents some tetragonal structure (revealed by peak splitting at angles
between 34°-35° and 59°-60°). It suggests that the amorphous phase should have
crystallized in the form of tetragonal mainly by releasing the dissolved alumina as the
stabilizer of high-temperature cubic phase. In contrast, in the highly crystalline coating
after the same heat treatment in Figure 6-2(d), the metastable cubic YSZ solid solution is
still the dominant phase.
cz
czcz
cz czczcz
tztz
tztz
AA AA AA
GAGA
AA
d
C
b
a
6000
5000
4000
3000
2000
1000
0
Inte
nsi
ty
2theta
Figure 6-2 Comparison of crystalline structure of heat-treated coatings with fully crystalline and
highly amorphous coating: a) coating with 64% amorphous; b) 64% amorphous coating heat-treated
at 1300°C for 24 hrs; c) highly crystalline (11% amorphous) coating not heat-treated; d) same as c
after heat treatment at 1300°C for 24 hrs
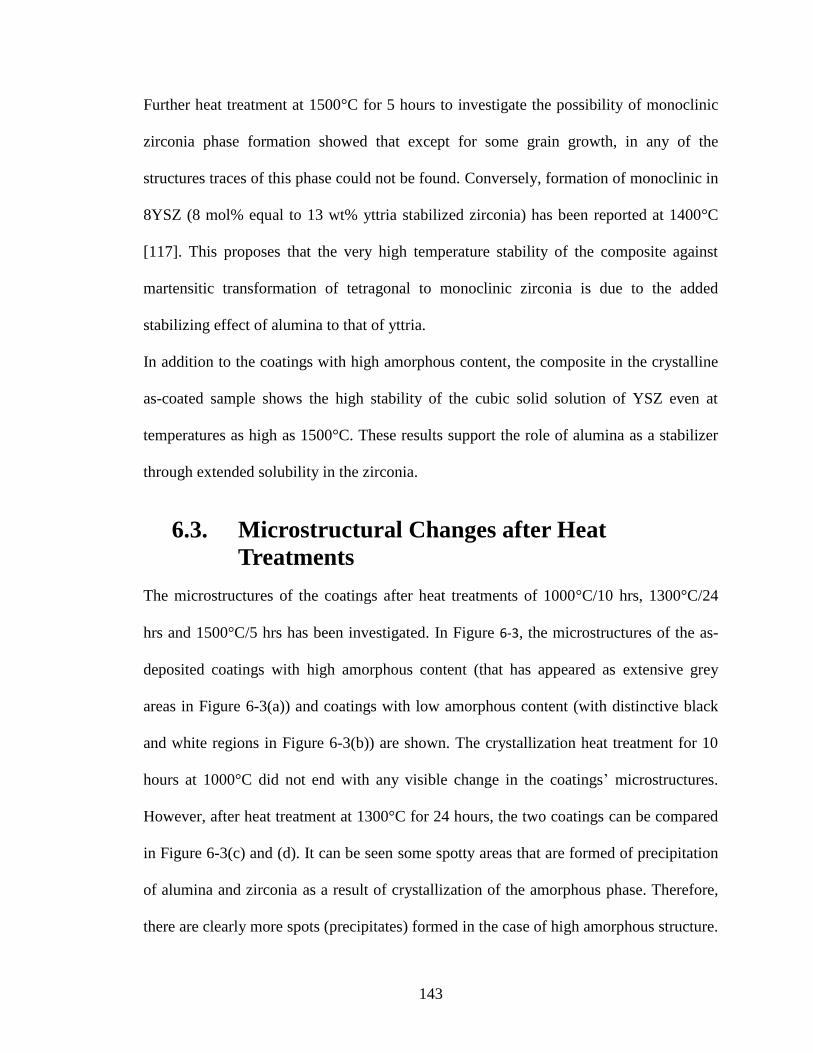
143
Further heat treatment at 1500°C for 5 hours to investigate the possibility of monoclinic
zirconia phase formation showed that except for some grain growth, in any of the
structures traces of this phase could not be found. Conversely, formation of monoclinic in
8YSZ (8 mol% equal to 13 wt% yttria stabilized zirconia) has been reported at 1400°C
[117]. This proposes that the very high temperature stability of the composite against
martensitic transformation of tetragonal to monoclinic zirconia is due to the added
stabilizing effect of alumina to that of yttria.
In addition to the coatings with high amorphous content, the composite in the crystalline
as-coated sample shows the high stability of the cubic solid solution of YSZ even at
temperatures as high as 1500°C. These results support the role of alumina as a stabilizer
through extended solubility in the zirconia.
6.3. Microstructural Changes after Heat
Treatments
The microstructures of the coatings after heat treatments of 1000°C/10 hrs, 1300°C/24
hrs and 1500°C/5 hrs has been investigated. In Figure 6-3, the microstructures of the as-
deposited coatings with high amorphous content (that has appeared as extensive grey
areas in Figure 6-3(a)) and coatings with low amorphous content (with distinctive black
and white regions in Figure 6-3(b)) are shown. The crystallization heat treatment for 10
hours at 1000°C did not end with any visible change in the coatings’ microstructures.
However, after heat treatment at 1300°C for 24 hours, the two coatings can be compared
in Figure 6-3(c) and (d). It can be seen some spotty areas that are formed of precipitation
of alumina and zirconia as a result of crystallization of the amorphous phase. Therefore,
there are clearly more spots (precipitates) formed in the case of high amorphous structure.
144
These precipitates are typically of minimum 50 nm size. Heat treatment at higher
temperatures of 1500°C for 5 hours, as visible in Figure 6-3(e) and (f), shows the growth
of precipitates as well as commencement of some spheroidization of the splats in the
form of round corners and thickened splats.
Figure 6-3 Microstructure of: a) as-deposited high amorphous coating; b) as-deposited low
amorphous coating; c) high amorphous coating heat-treated at 1300°C/24 hrs; d) low amorphous
coating heat-treated at 1300°C/24 hrs; e) high amorphous coating after 1500°C/5 hrs; f) low
amorphous coating after 1500°C/5 hrs
b a
c d
e f
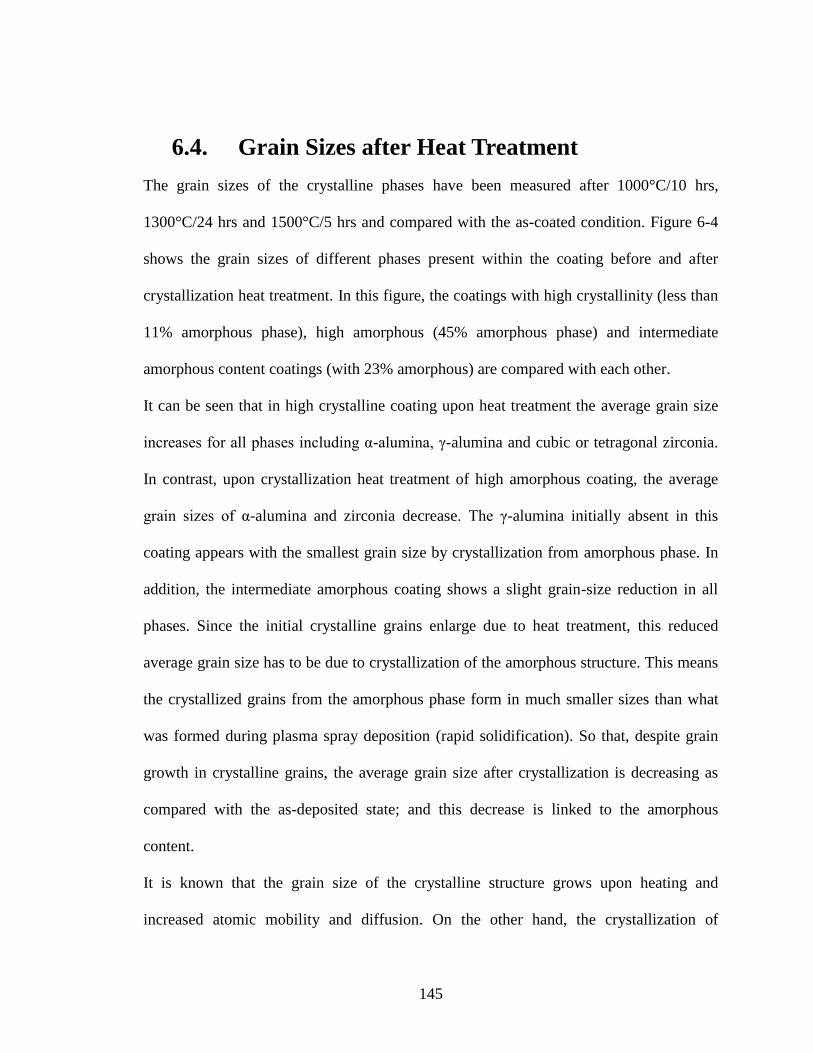
145
6.4. Grain Sizes after Heat Treatment
The grain sizes of the crystalline phases have been measured after 1000°C/10 hrs,
1300°C/24 hrs and 1500°C/5 hrs and compared with the as-coated condition. Figure 6-4
shows the grain sizes of different phases present within the coating before and after
crystallization heat treatment. In this figure, the coatings with high crystallinity (less than
11% amorphous phase), high amorphous (45% amorphous phase) and intermediate
amorphous content coatings (with 23% amorphous) are compared with each other.
It can be seen that in high crystalline coating upon heat treatment the average grain size
increases for all phases including α-alumina, γ-alumina and cubic or tetragonal zirconia.
In contrast, upon crystallization heat treatment of high amorphous coating, the average
grain sizes of α-alumina and zirconia decrease. The γ-alumina initially absent in this
coating appears with the smallest grain size by crystallization from amorphous phase. In
addition, the intermediate amorphous coating shows a slight grain-size reduction in all
phases. Since the initial crystalline grains enlarge due to heat treatment, this reduced
average grain size has to be due to crystallization of the amorphous structure. This means
the crystallized grains from the amorphous phase form in much smaller sizes than what
was formed during plasma spray deposition (rapid solidification). So that, despite grain
growth in crystalline grains, the average grain size after crystallization is decreasing as
compared with the as-deposited state; and this decrease is linked to the amorphous
content.
It is known that the grain size of the crystalline structure grows upon heating and
increased atomic mobility and diffusion. On the other hand, the crystallization of
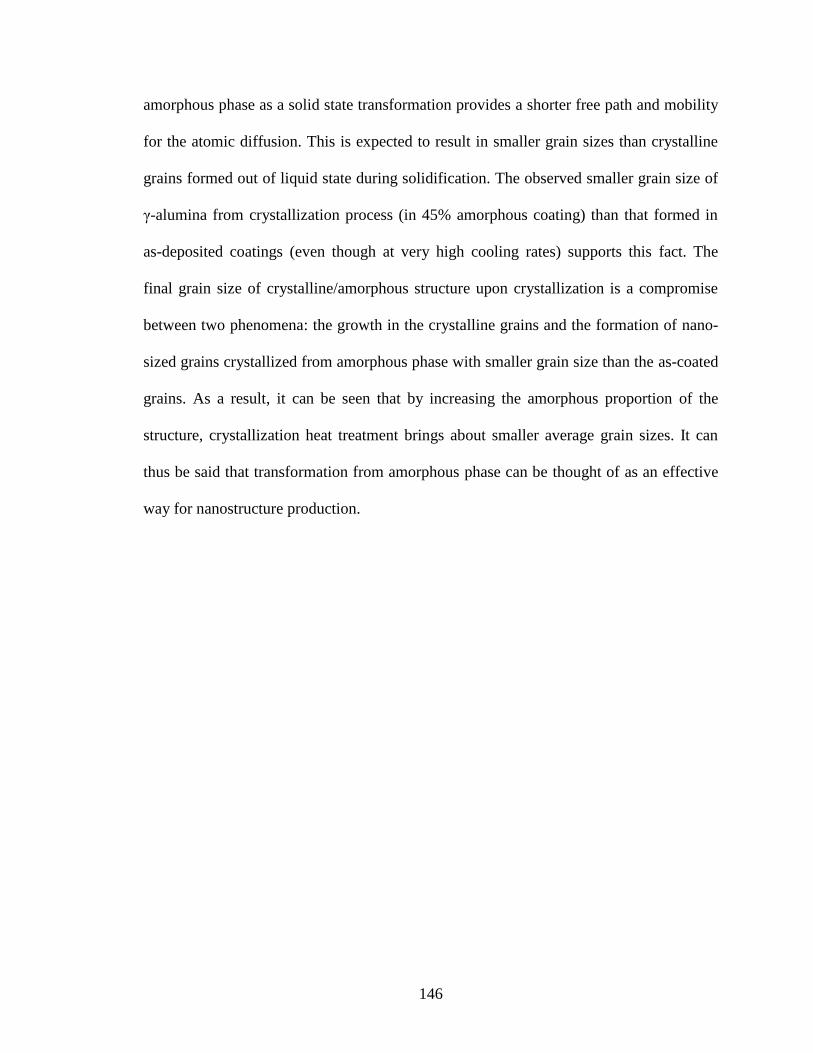
146
amorphous phase as a solid state transformation provides a shorter free path and mobility
for the atomic diffusion. This is expected to result in smaller grain sizes than crystalline
grains formed out of liquid state during solidification. The observed smaller grain size of
γ-alumina from crystallization process (in 45% amorphous coating) than that formed in
as-deposited coatings (even though at very high cooling rates) supports this fact. The
final grain size of crystalline/amorphous structure upon crystallization is a compromise
between two phenomena: the growth in the crystalline grains and the formation of nano-
sized grains crystallized from amorphous phase with smaller grain size than the as-coated
grains. As a result, it can be seen that by increasing the amorphous proportion of the
structure, crystallization heat treatment brings about smaller average grain sizes. It can
thus be said that transformation from amorphous phase can be thought of as an effective
way for nanostructure production.
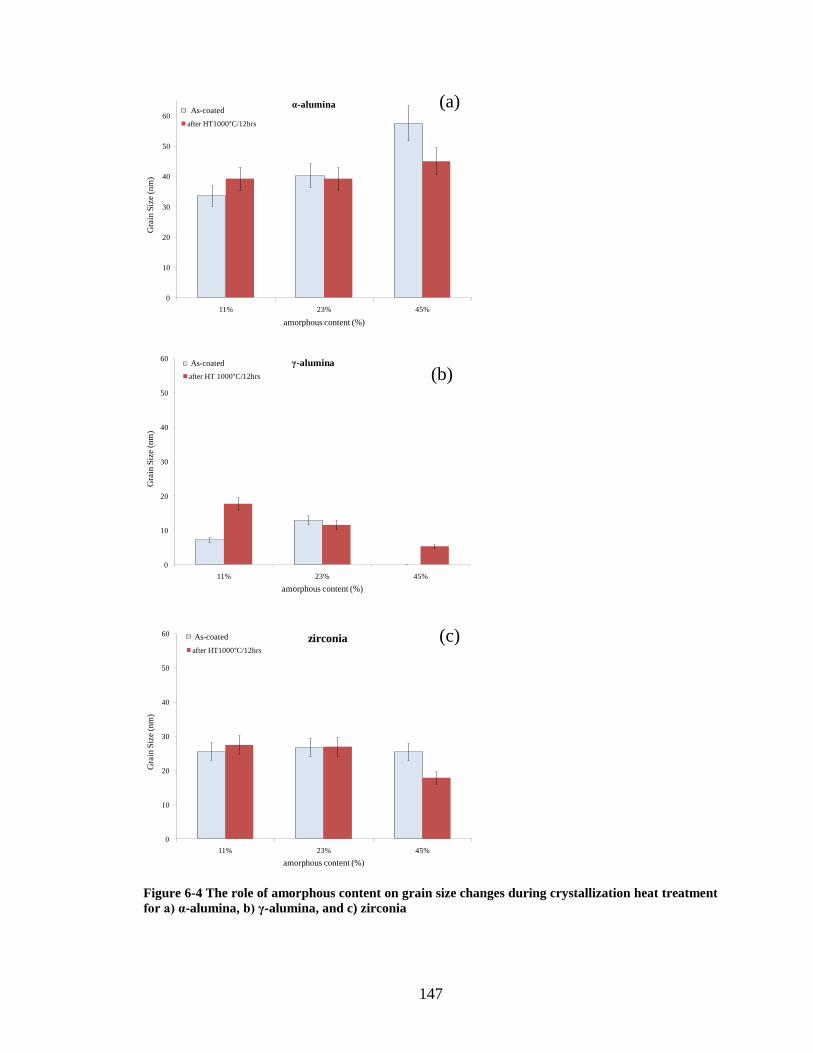
147
0
10
20
30
40
50
60
11% 23% 45%
Gra
in S
ize (
nm
)
amorphous content (%)
before HT
after HT1000°C/12hrs
α-aluminaAs-coated
0
10
20
30
40
50
60
11% 23% 45%
Gra
in S
ize (
nm
)
amorphous content (%)
Before HT
after HT 1000°C/12hrs
γ-aluminaAs-coated
0
10
20
30
40
50
60
11% 23% 45%
Gra
in S
ize (
nm
)
amorphous content (%)
before HT
after HT1000°C/12hrs
zirconiaAs-coated
Figure 6-4 The role of amorphous content on grain size changes during crystallization heat treatment
fora)α-alumina, b)γ-alumina, and c) zirconia
(a)
(b)
(c)
148
Further heat treatment at 1300 ºC for 24 hours resulted in grain growth of both crystalline
and high amorphous coatings with a considerably higher rate in crystalline coating. The
grain size of the as-coated and the heat-treated samples are summarized in Table 6-1. It
shows that in high crystalline coating the grain sizes of zirconia and α-alumina starting at
23 nm and 34 nm, respectively, grow to the extent that the XRD evaluation method
(using the equations 2-4 and 2-5 in section 2.5.3) with limited accuracy to the maximum
grain sizes of about 100 nm [98] cannot yield the grain size (results in square root of
negative number, because of the peak width b being smaller than machine broadening β).
These cases are marked as “> 100nm” in Table 6-1. In addition γ-alumina, initially
smaller than the two other phases, has entirely transformed into α-alumina. On the other
hand, the grain growth in high amorphous structure is clearly less than high crystalline
coating. As Table 6-1 presents, zirconia grew from 19 nm to 40 nm and γ-alumina
transformed to α-alumina (initially absent in the coatings) that appears with 53 nm grain
size.
Table 6-1 Role of amorphous content on grain growth during heat treatment
Amorphous
content (%)
As-deposited coating After heat treatment at 1300°C/24 hrs
Zirconia
(nm)
γ-alumina
(nm)
α- alumina
(nm)
Zirconia
(nm)
γ-alumina
(nm)
α- alumina
(nm)
11% 23 13 34 > 100nm non > 100nm
45% 19 9 non 40 non 53
After heat treatment at 1500 ºC for 5 hours, the method cannot determine the grain sizes
of the present crystalline phases (i.e., zirconia and α- alumina) due to excessive
enlargement that causes the width of the peak to be less than the machine broadening.
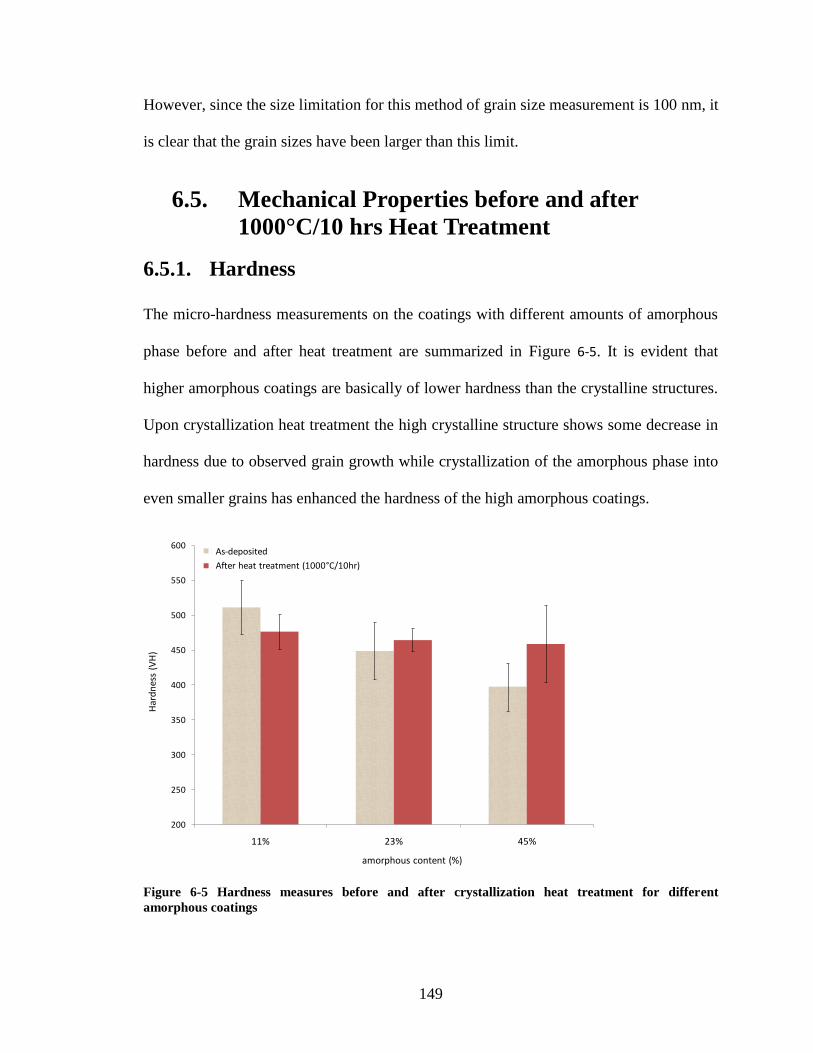
149
However, since the size limitation for this method of grain size measurement is 100 nm, it
is clear that the grain sizes have been larger than this limit.
6.5. Mechanical Properties before and after
1000°C/10 hrs Heat Treatment
6.5.1. Hardness
The micro-hardness measurements on the coatings with different amounts of amorphous
phase before and after heat treatment are summarized in Figure 6-5. It is evident that
higher amorphous coatings are basically of lower hardness than the crystalline structures.
Upon crystallization heat treatment the high crystalline structure shows some decrease in
hardness due to observed grain growth while crystallization of the amorphous phase into
even smaller grains has enhanced the hardness of the high amorphous coatings.
200
250
300
350
400
450
500
550
600
11% 23% 45%
Har
dn
ess
(VH
)
amorphous content (%)
before heat treatment
after heat treatment (1000C/10hrs)
As-deposited
After heat treatment (1000°C/10hr)
Figure 6-5 Hardness measures before and after crystallization heat treatment for different
amorphous coatings
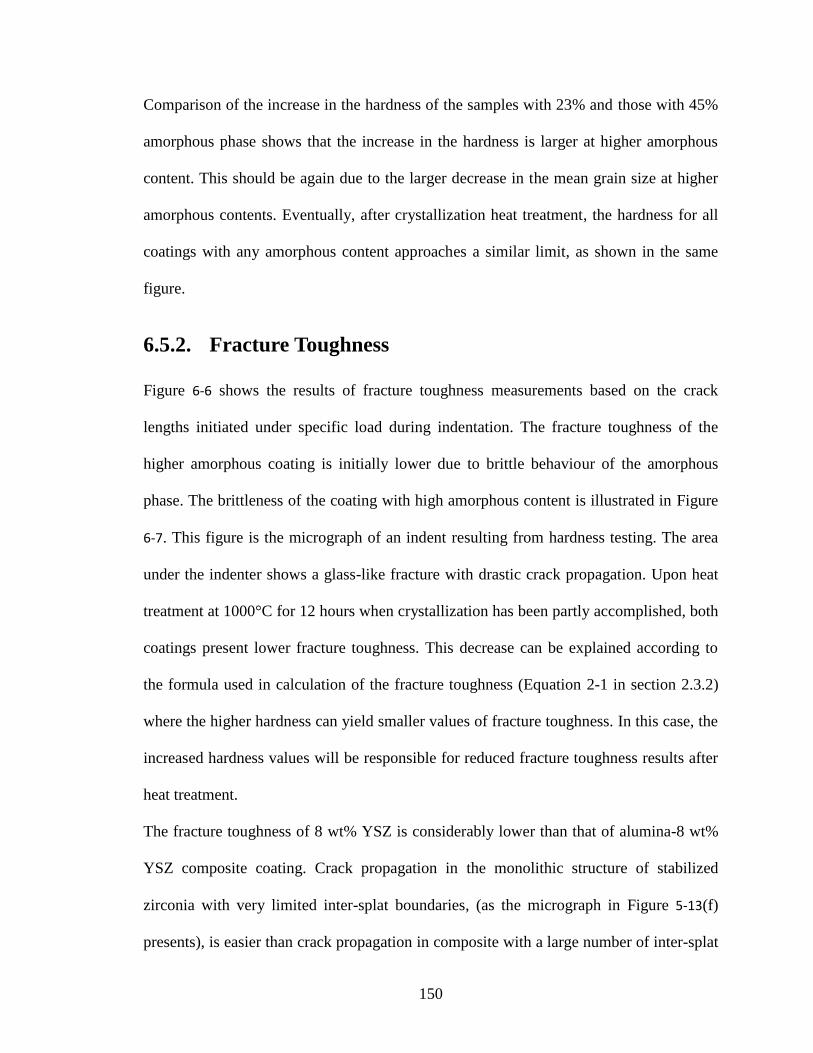
150
Comparison of the increase in the hardness of the samples with 23% and those with 45%
amorphous phase shows that the increase in the hardness is larger at higher amorphous
content. This should be again due to the larger decrease in the mean grain size at higher
amorphous contents. Eventually, after crystallization heat treatment, the hardness for all
coatings with any amorphous content approaches a similar limit, as shown in the same
figure.
6.5.2. Fracture Toughness
Figure 6-6 shows the results of fracture toughness measurements based on the crack
lengths initiated under specific load during indentation. The fracture toughness of the
higher amorphous coating is initially lower due to brittle behaviour of the amorphous
phase. The brittleness of the coating with high amorphous content is illustrated in Figure
6-7. This figure is the micrograph of an indent resulting from hardness testing. The area
under the indenter shows a glass-like fracture with drastic crack propagation. Upon heat
treatment at 1000°C for 12 hours when crystallization has been partly accomplished, both
coatings present lower fracture toughness. This decrease can be explained according to
the formula used in calculation of the fracture toughness (Equation 2-1 in section 2.3.2)
where the higher hardness can yield smaller values of fracture toughness. In this case, the
increased hardness values will be responsible for reduced fracture toughness results after
heat treatment.
The fracture toughness of 8 wt% YSZ is considerably lower than that of alumina-8 wt%
YSZ composite coating. Crack propagation in the monolithic structure of stabilized
zirconia with very limited inter-splat boundaries, (as the micrograph in Figure 5-13(f)
presents), is easier than crack propagation in composite with a large number of inter-splat
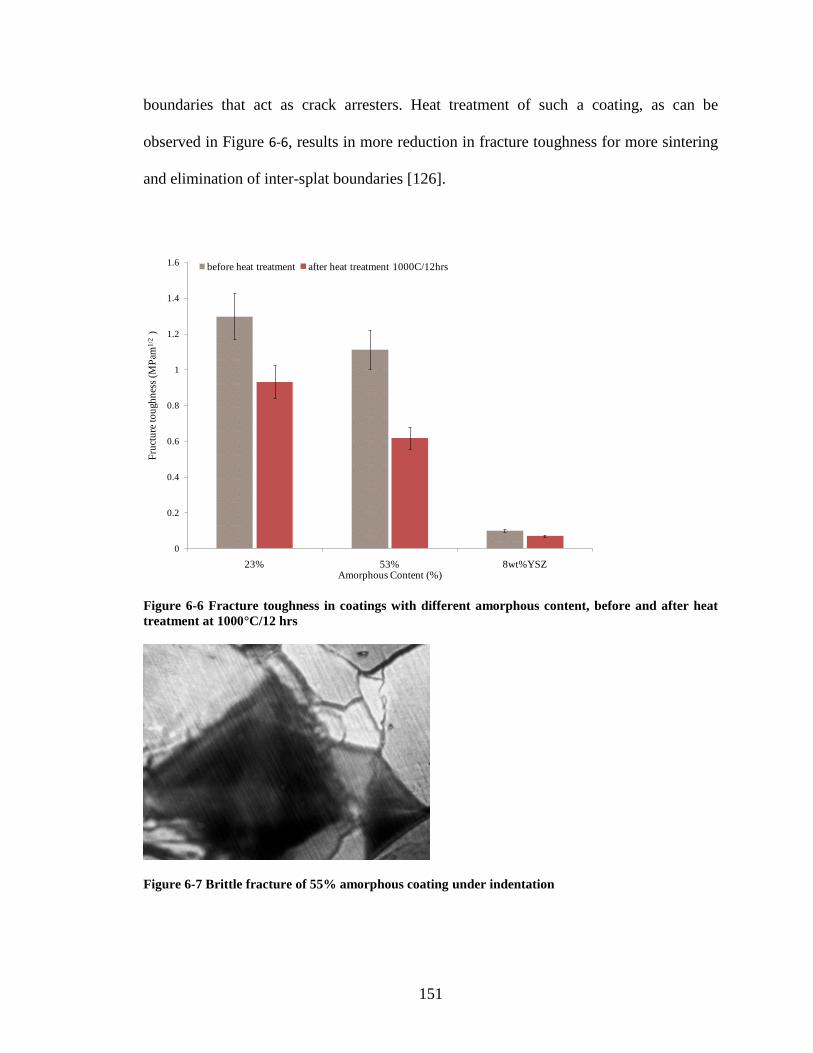
151
boundaries that act as crack arresters. Heat treatment of such a coating, as can be
observed in Figure 6-6, results in more reduction in fracture toughness for more sintering
and elimination of inter-splat boundaries [126].
0
0.2
0.4
0.6
0.8
1
1.2
1.4
1.6
23% 53% 8wt%YSZ
Fru
ctu
re t
ou
gh
nes
s (M
Pam
1/2
)
Amorphous Content (%)
before heat treatment after heat treatment 1000C/12hrs
Figure 6-6 Fracture toughness in coatings with different amorphous content, before and after heat
treatment at 1000°C/12 hrs
Figure 6-7 Brittle fracture of 55% amorphous coating under indentation
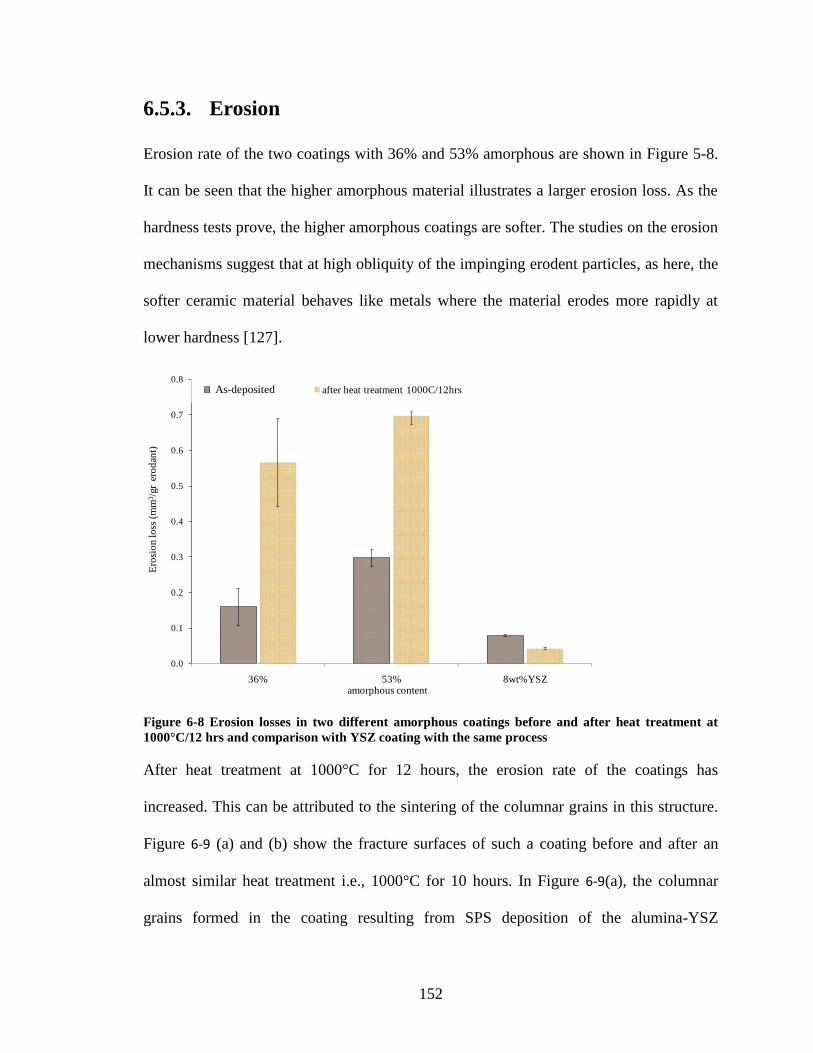
152
6.5.3. Erosion
Erosion rate of the two coatings with 36% and 53% amorphous are shown in Figure 5-8.
It can be seen that the higher amorphous material illustrates a larger erosion loss. As the
hardness tests prove, the higher amorphous coatings are softer. The studies on the erosion
mechanisms suggest that at high obliquity of the impinging erodent particles, as here, the
softer ceramic material behaves like metals where the material erodes more rapidly at
lower hardness [127].
0.0
0.1
0.2
0.3
0.4
0.5
0.6
0.7
0.8
36% 53% 8wt%YSZ
Ero
sio
n lo
ss (
mm
3/g
r er
od
ant)
amorphous content
before heat treatment after heat treatment 1000C/12hrsAs-deposited
Figure 6-8 Erosion losses in two different amorphous coatings before and after heat treatment at
1000°C/12 hrs and comparison with YSZ coating with the same process
After heat treatment at 1000°C for 12 hours, the erosion rate of the coatings has
increased. This can be attributed to the sintering of the columnar grains in this structure.
Figure 6-9 (a) and (b) show the fracture surfaces of such a coating before and after an
almost similar heat treatment i.e., 1000°C for 10 hours. In Figure 6-9(a), the columnar
grains formed in the coating resulting from SPS deposition of the alumina-YSZ
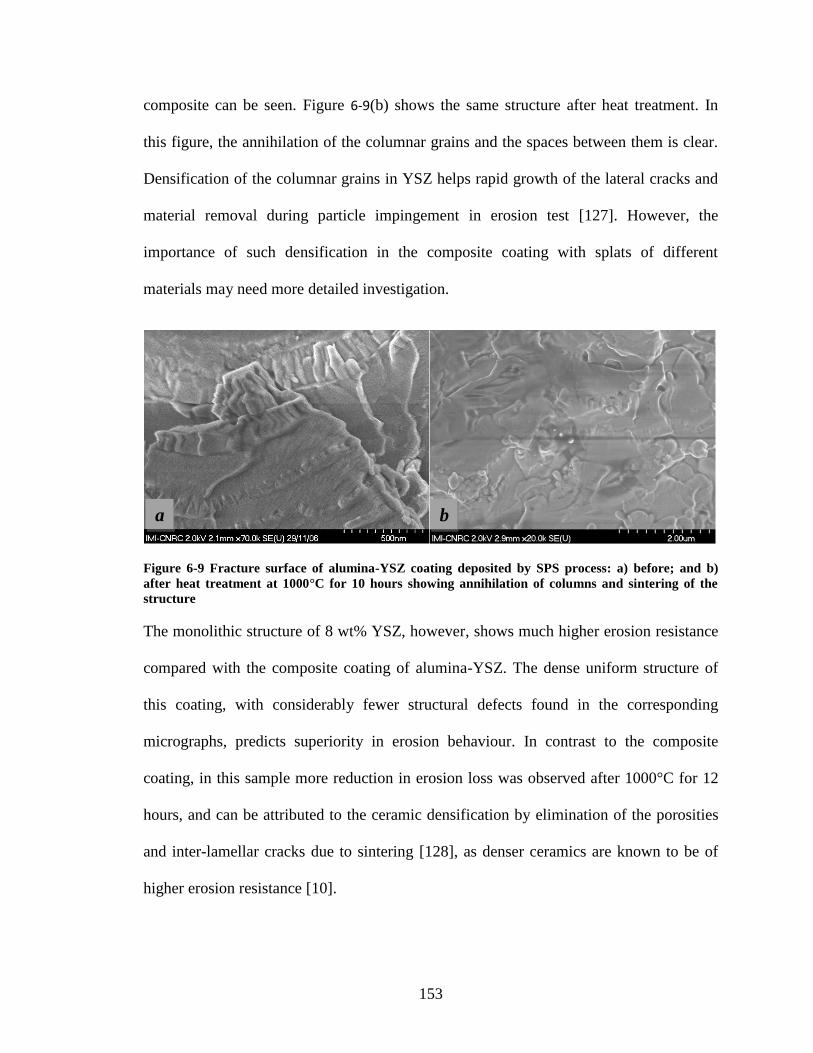
153
composite can be seen. Figure 6-9(b) shows the same structure after heat treatment. In
this figure, the annihilation of the columnar grains and the spaces between them is clear.
Densification of the columnar grains in YSZ helps rapid growth of the lateral cracks and
material removal during particle impingement in erosion test [127]. However, the
importance of such densification in the composite coating with splats of different
materials may need more detailed investigation.
Figure 6-9 Fracture surface of alumina-YSZ coating deposited by SPS process: a) before; and b)
after heat treatment at 1000°C for 10 hours showing annihilation of columns and sintering of the
structure
The monolithic structure of 8 wt% YSZ, however, shows much higher erosion resistance
compared with the composite coating of alumina-YSZ. The dense uniform structure of
this coating, with considerably fewer structural defects found in the corresponding
micrographs, predicts superiority in erosion behaviour. In contrast to the composite
coating, in this sample more reduction in erosion loss was observed after 1000°C for 12
hours, and can be attributed to the ceramic densification by elimination of the porosities
and inter-lamellar cracks due to sintering [128], as denser ceramics are known to be of
higher erosion resistance [10].
a
b
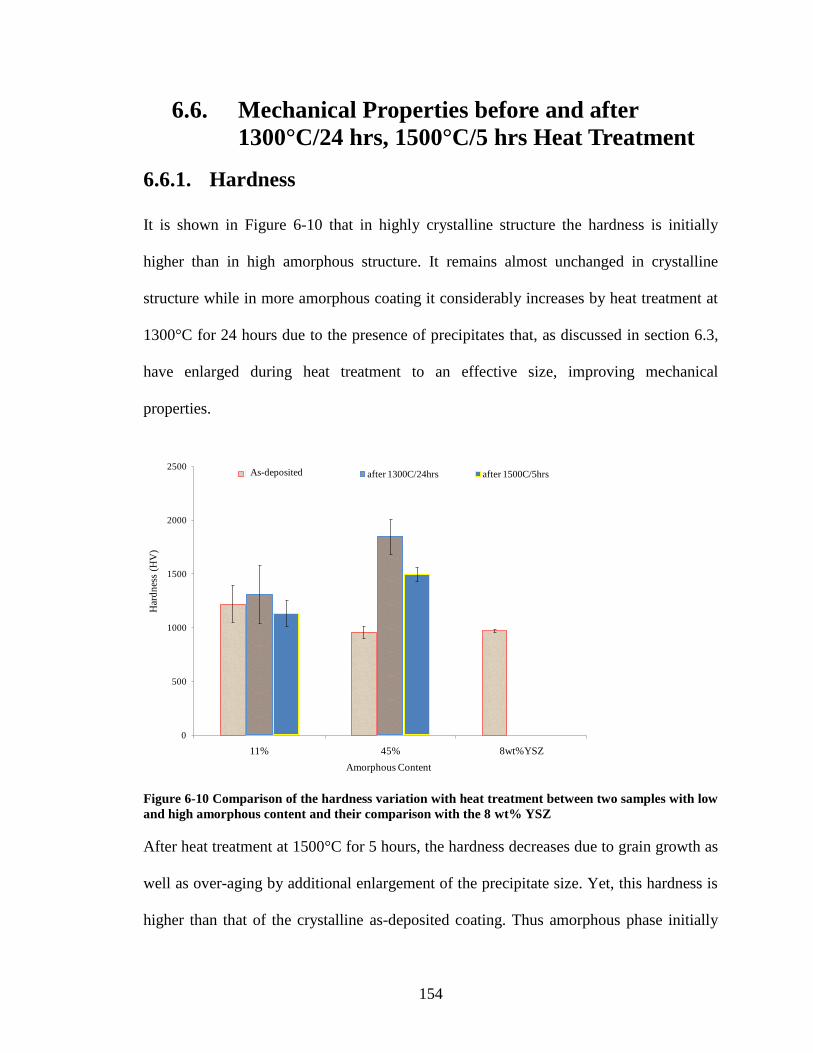
154
6.6. Mechanical Properties before and after
1300°C/24 hrs, 1500°C/5 hrs Heat Treatment
6.6.1. Hardness
It is shown in Figure 6-10 that in highly crystalline structure the hardness is initially
higher than in high amorphous structure. It remains almost unchanged in crystalline
structure while in more amorphous coating it considerably increases by heat treatment at
1300°C for 24 hours due to the presence of precipitates that, as discussed in section 6.3,
have enlarged during heat treatment to an effective size, improving mechanical
properties.
0
500
1000
1500
2000
2500
11% 45% 8wt%YSZ
Har
dn
ess
(HV
)
Amorphous Content
before heat treamnet after 1300C/24hrs after 1500C/5hrsAs-deposited
Figure 6-10 Comparison of the hardness variation with heat treatment between two samples with low
and high amorphous content and their comparison with the 8 wt% YSZ
After heat treatment at 1500°C for 5 hours, the hardness decreases due to grain growth as
well as over-aging by additional enlargement of the precipitate size. Yet, this hardness is
higher than that of the crystalline as-deposited coating. Thus amorphous phase initially
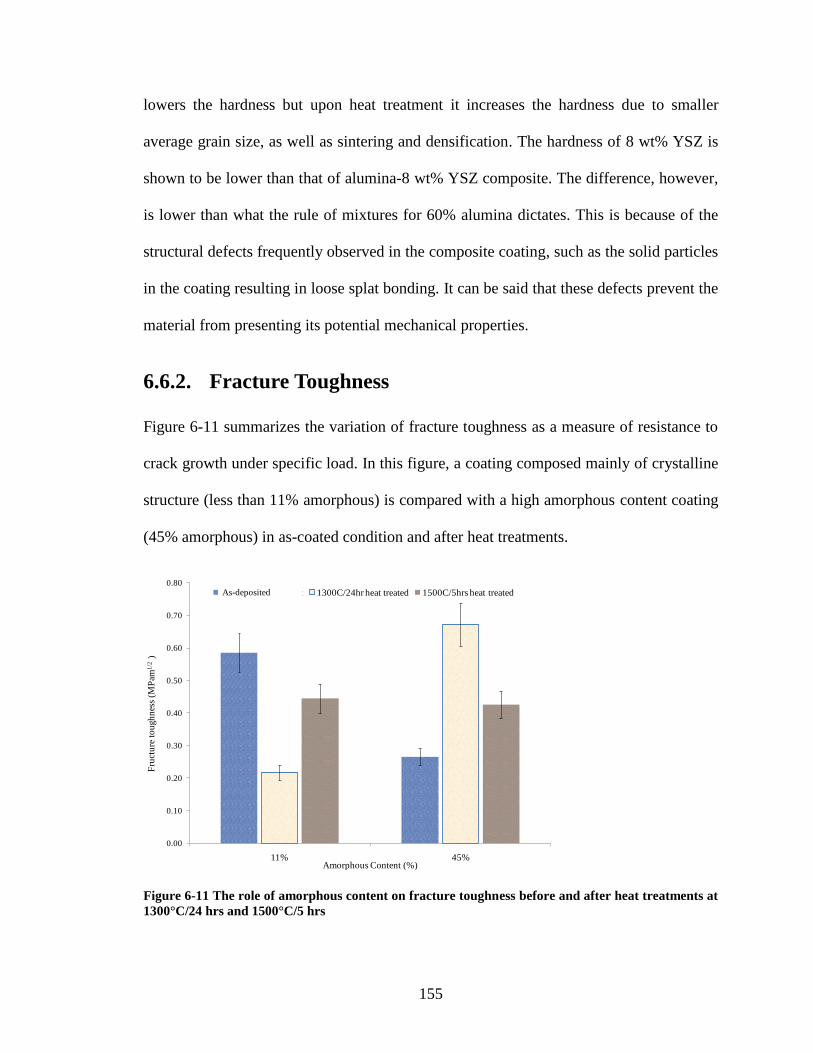
155
lowers the hardness but upon heat treatment it increases the hardness due to smaller
average grain size, as well as sintering and densification. The hardness of 8 wt% YSZ is
shown to be lower than that of alumina-8 wt% YSZ composite. The difference, however,
is lower than what the rule of mixtures for 60% alumina dictates. This is because of the
structural defects frequently observed in the composite coating, such as the solid particles
in the coating resulting in loose splat bonding. It can be said that these defects prevent the
material from presenting its potential mechanical properties.
6.6.2. Fracture Toughness
Figure 6-11 summarizes the variation of fracture toughness as a measure of resistance to
crack growth under specific load. In this figure, a coating composed mainly of crystalline
structure (less than 11% amorphous) is compared with a high amorphous content coating
(45% amorphous) in as-coated condition and after heat treatments.
0.00
0.10
0.20
0.30
0.40
0.50
0.60
0.70
0.80
11% 45%
Fru
ctu
re t
ou
gh
nes
s (M
Pam
1/2
)
Amorphous Content (%)
before Heat treatment 1300C/24hr heat treated 1500C/5hrs heat treatedAs-deposited
Figure 6-11 The role of amorphous content on fracture toughness before and after heat treatments at
1300°C/24 hrs and 1500°C/5 hrs
156
The high amorphous coating is initially of lower fracture toughness than the crystalline
coating. Upon heat treatment at 1300°C for 24 hours, the crystalline coating experiences
a considerable decrease in fracture toughness, while under the same conditions in the
high amorphous coating fracture toughness drastically increases. The reason for this can
be found in the observed microstructures in section 6.3, where the heat treatment at
1300°C for high amorphous coating results in a large amount of uniformly distributed
precipitates. By contrast, according to section 6.4, the crystalline structure faces
noticeable grain growth.
Finally, after heat treatment at 1500°C for 5 hours both structures behave similarly. This
heat treatment, as discussed in section 6.3, leads to similar microstructures for both
samples. In addition, over-aging the precipitates impairs the fracture toughness property
[129]. It should be noticed, however, that the fracture toughness is calculated based on
the E and H that are in turn functions of porosity [11], intersplat bond [90,130] and phase
analysis. Hence, the fracture toughness will be a compromise of these variables.
6.7. Thermal Conductivity Changes before and
after Heat Treatment
Figure 6-12 represents the relation between thermal conductivity of the coatings before
and after heat treatment, and the amount of amorphous phases. It is seen that before heat
treatment thermal conductivity decreases when the amount of amorphous phase increases.
According to the literature [131], there are two methods of thermal conduction. One is the
electron transfer related to metals, and the other is the phonon transfer in non-metallic
crystalline solids like ceramics. This means that in the absence of readily moving
electrons to transfer the thermal energy, this energy is transferred by crystallite vibration.
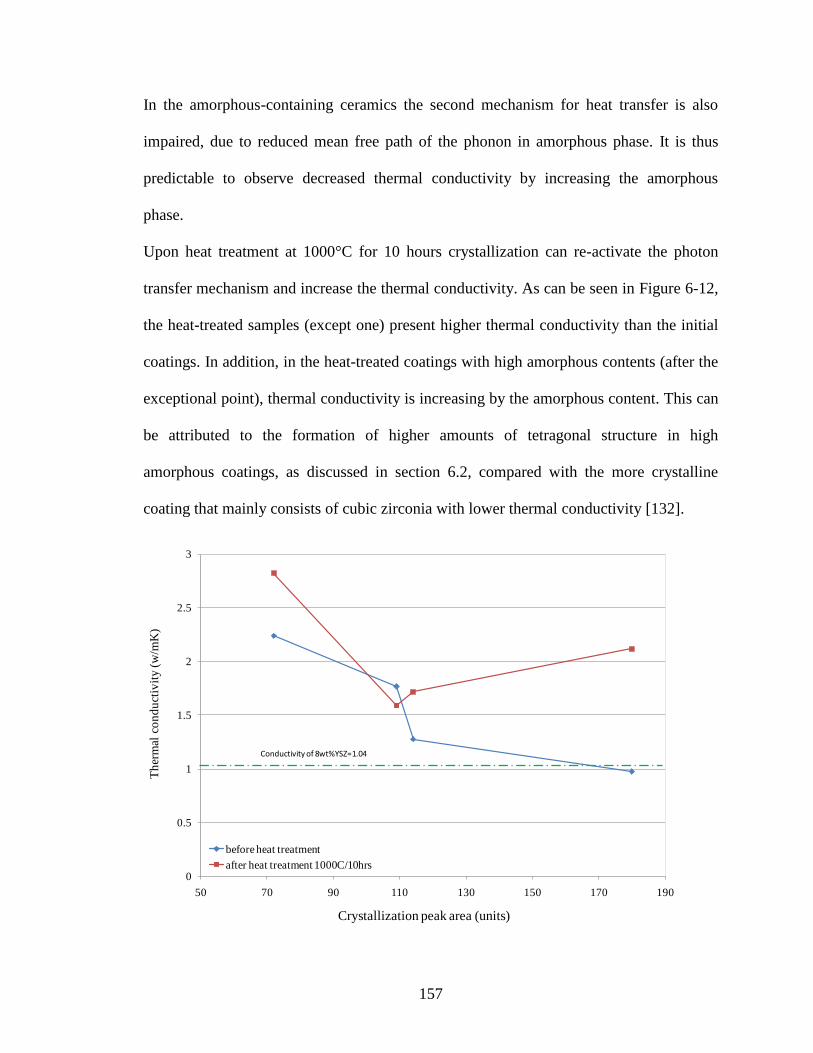
157
In the amorphous-containing ceramics the second mechanism for heat transfer is also
impaired, due to reduced mean free path of the phonon in amorphous phase. It is thus
predictable to observe decreased thermal conductivity by increasing the amorphous
phase.
Upon heat treatment at 1000°C for 10 hours crystallization can re-activate the photon
transfer mechanism and increase the thermal conductivity. As can be seen in Figure 6-12,
the heat-treated samples (except one) present higher thermal conductivity than the initial
coatings. In addition, in the heat-treated coatings with high amorphous contents (after the
exceptional point), thermal conductivity is increasing by the amorphous content. This can
be attributed to the formation of higher amounts of tetragonal structure in high
amorphous coatings, as discussed in section 6.2, compared with the more crystalline
coating that mainly consists of cubic zirconia with lower thermal conductivity [132].
0
0.5
1
1.5
2
2.5
3
50 70 90 110 130 150 170 190
Th
erm
al c
on
du
ctiv
ity
(w
/mK
)
crystallization Enthalpy µv.sec/mg)
before heat treatment
after heat treatment 1000C/10hrs
Conductivity of 8wt%YSZ=1.04
Crystallization peak area (units)
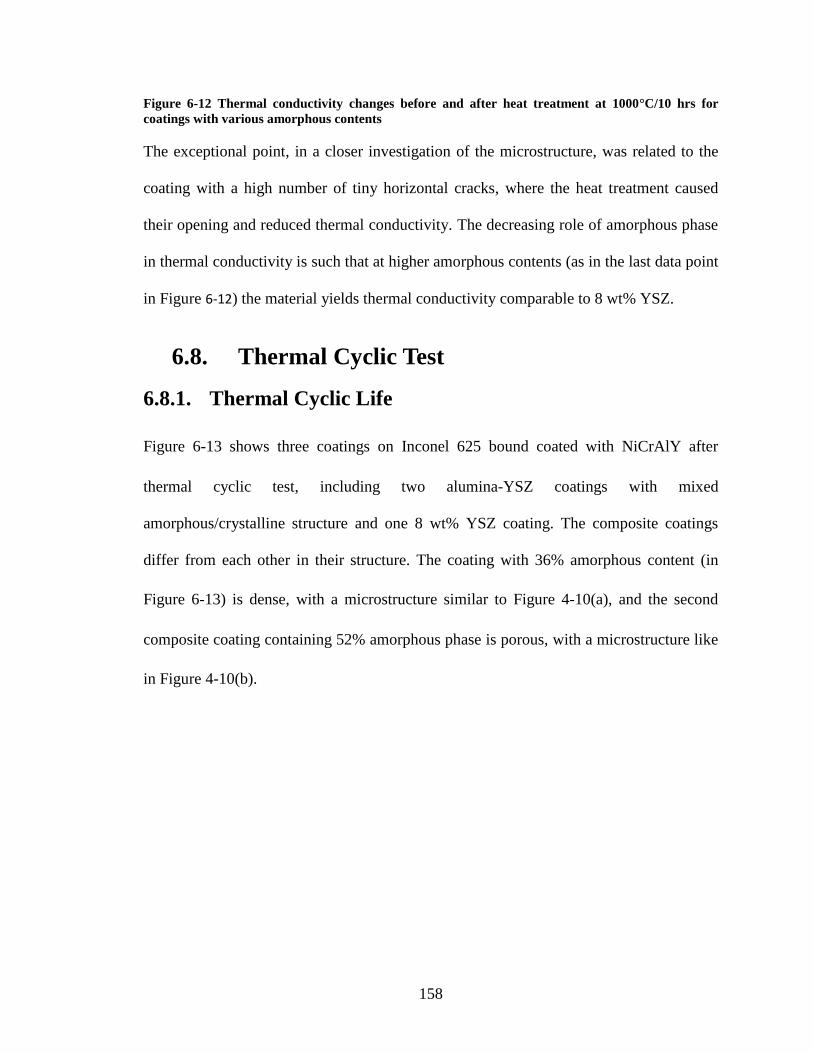
158
Figure 6-12 Thermal conductivity changes before and after heat treatment at 1000°C/10 hrs for
coatings with various amorphous contents
The exceptional point, in a closer investigation of the microstructure, was related to the
coating with a high number of tiny horizontal cracks, where the heat treatment caused
their opening and reduced thermal conductivity. The decreasing role of amorphous phase
in thermal conductivity is such that at higher amorphous contents (as in the last data point
in Figure 6-12) the material yields thermal conductivity comparable to 8 wt% YSZ.
6.8. Thermal Cyclic Test
6.8.1. Thermal Cyclic Life
Figure 6-13 shows three coatings on Inconel 625 bound coated with NiCrAlY after
thermal cyclic test, including two alumina-YSZ coatings with mixed
amorphous/crystalline structure and one 8 wt% YSZ coating. The composite coatings
differ from each other in their structure. The coating with 36% amorphous content (in
Figure 6-13) is dense, with a microstructure similar to Figure 4-10(a), and the second
composite coating containing 52% amorphous phase is porous, with a microstructure like
in Figure 4-10(b).
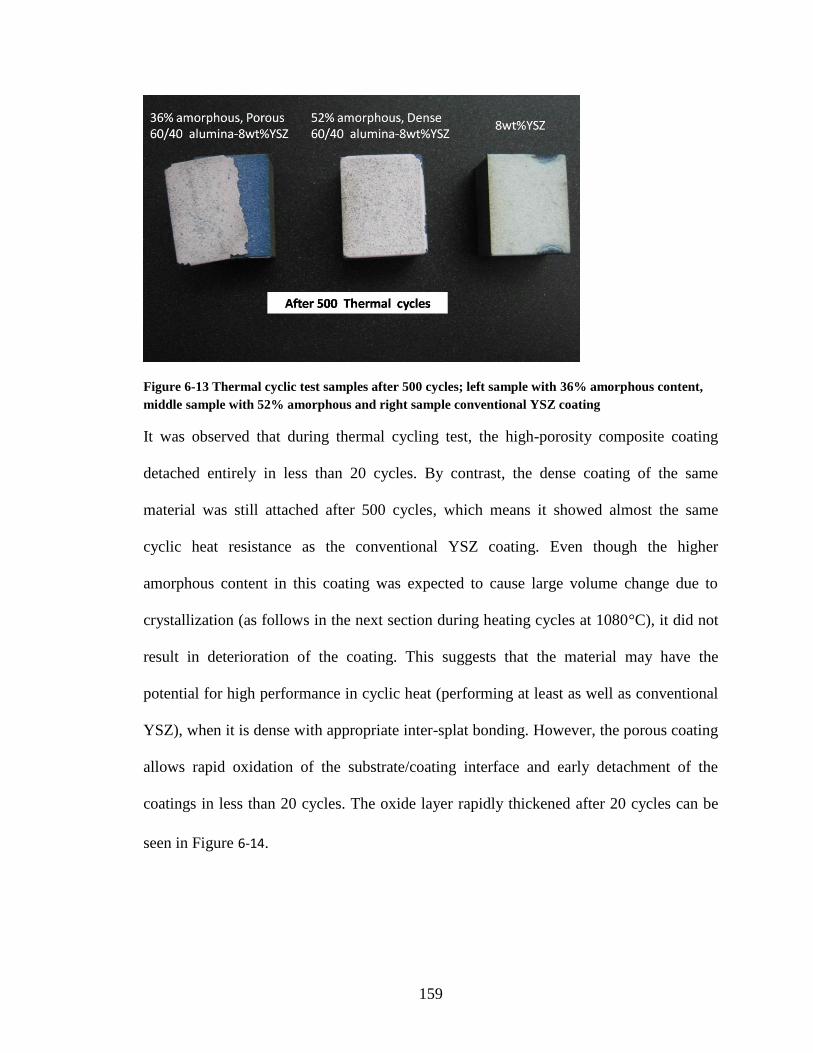
159
Figure 6-13 Thermal cyclic test samples after 500 cycles; left sample with 36% amorphous content,
middle sample with 52% amorphous and right sample conventional YSZ coating
It was observed that during thermal cycling test, the high-porosity composite coating
detached entirely in less than 20 cycles. By contrast, the dense coating of the same
material was still attached after 500 cycles, which means it showed almost the same
cyclic heat resistance as the conventional YSZ coating. Even though the higher
amorphous content in this coating was expected to cause large volume change due to
crystallization (as follows in the next section during heating cycles at 1080°C), it did not
result in deterioration of the coating. This suggests that the material may have the
potential for high performance in cyclic heat (performing at least as well as conventional
YSZ), when it is dense with appropriate inter-splat bonding. However, the porous coating
allows rapid oxidation of the substrate/coating interface and early detachment of the
coatings in less than 20 cycles. The oxide layer rapidly thickened after 20 cycles can be
seen in Figure 6-14.
160
Figure 6-14 Sectioned view of the oxide layer in top/bond coat interface of a) the porous composite
coating after 20 cycles
6.8.2. Structural Changes
Figure 6-15 illustrates the structural changes after 500 cycles of heating and cooling.
Figure 6-15(a) shows the XRD pattern of the high amorphous coating in the as-deposited
condition. It consists of amorphous humps and the crystalline structure of cubic zirconia
and γ-alumina. Long cumulative exposure time at cyclic heat has resulted in the
crystalline pattern shown in Figure 6-15(b). In this coating, the γ-alumina and the
amorphous humps have disappeared and (α + δ)-alumina and (cubic + tetragonal) YSZ
are the phases present in the coating after thermal cycling. This is somewhat different
from the phases formed during heat treatment of the coatings at about the same
temperatures in section 6.2. This shows that the phase transformations can be different in
heat treatment than thermal cycling at the same approximate temperatures.
Composite top coat
TGO
Substrate
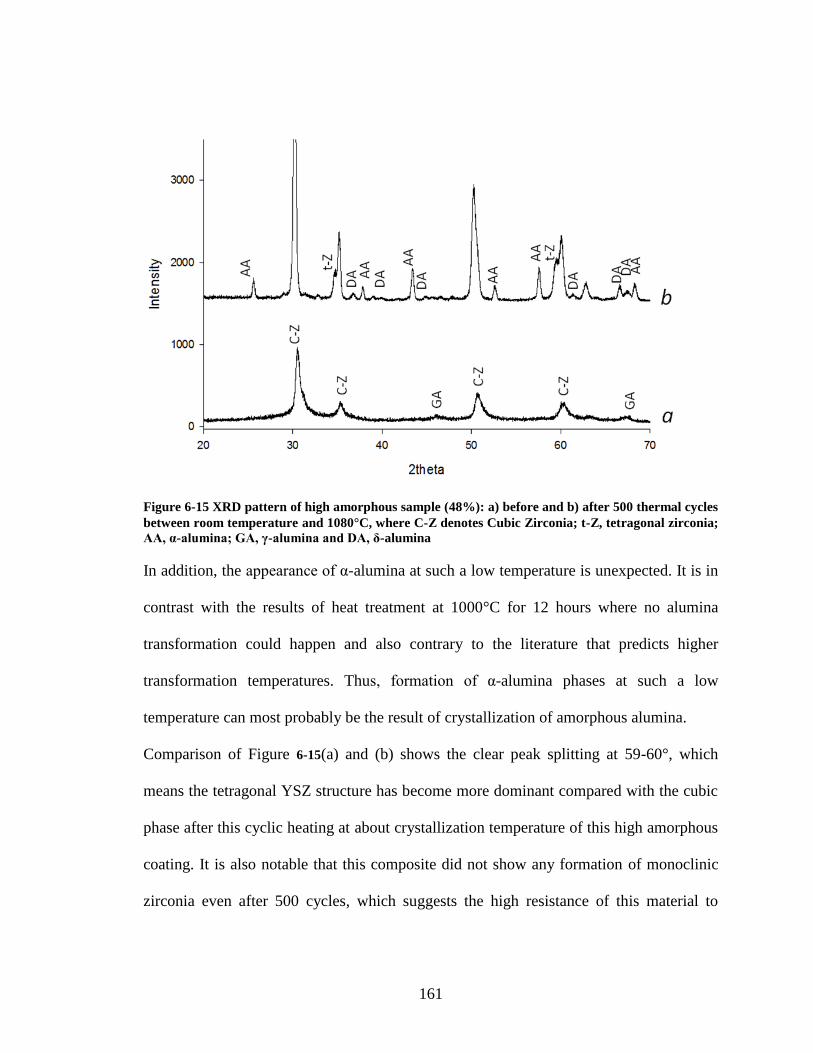
161
Figure 6-15 XRD pattern of high amorphous sample (48%): a) before and b) after 500 thermal cycles
between room temperature and 1080°C, where C-Z denotes Cubic Zirconia; t-Z, tetragonal zirconia;
AA,α-alumina;GA,γ-aluminaandDA,δ-alumina
In addition, the appearance of α-alumina at such a low temperature is unexpected. It is in
contrast with the results of heat treatment at 1000°C for 12 hours where no alumina
transformation could happen and also contrary to the literature that predicts higher
transformation temperatures. Thus, formation of α-alumina phases at such a low
temperature can most probably be the result of crystallization of amorphous alumina.
Comparison of Figure 6-15(a) and (b) shows the clear peak splitting at 59-60°, which
means the tetragonal YSZ structure has become more dominant compared with the cubic
phase after this cyclic heating at about crystallization temperature of this high amorphous
coating. It is also notable that this composite did not show any formation of monoclinic
zirconia even after 500 cycles, which suggests the high resistance of this material to
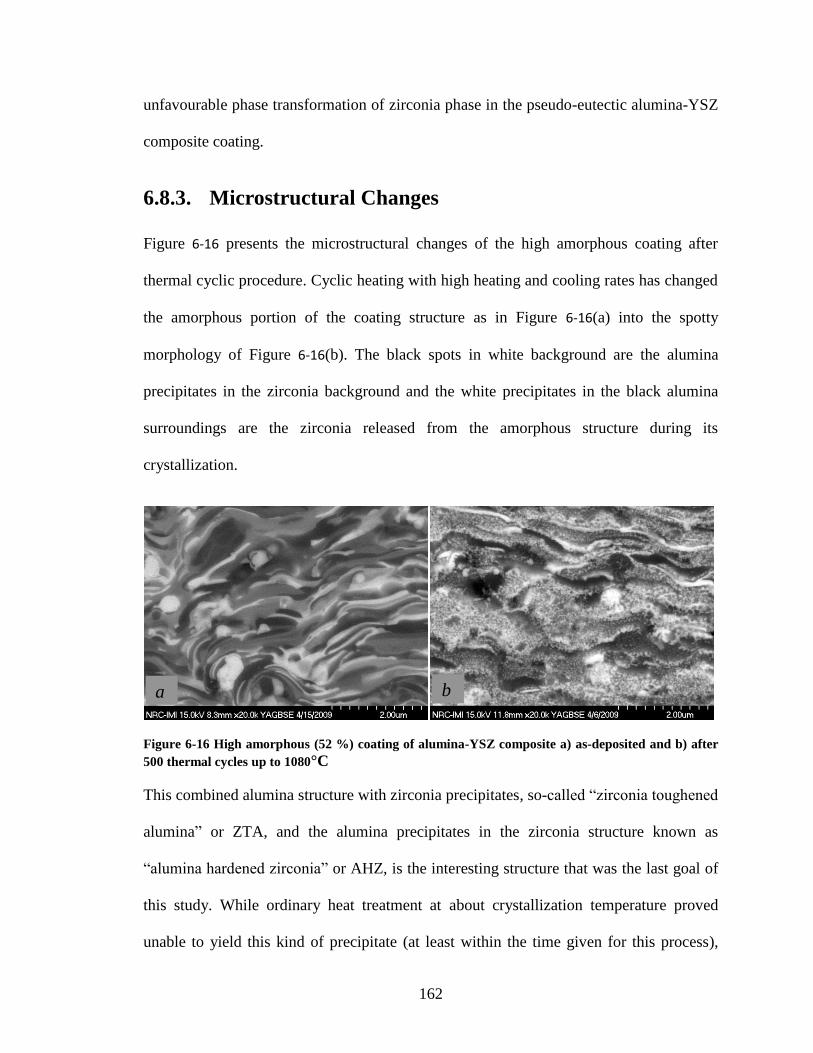
162
unfavourable phase transformation of zirconia phase in the pseudo-eutectic alumina-YSZ
composite coating.
6.8.3. Microstructural Changes
Figure 6-16 presents the microstructural changes of the high amorphous coating after
thermal cyclic procedure. Cyclic heating with high heating and cooling rates has changed
the amorphous portion of the coating structure as in Figure 6-16(a) into the spotty
morphology of Figure 6-16(b). The black spots in white background are the alumina
precipitates in the zirconia background and the white precipitates in the black alumina
surroundings are the zirconia released from the amorphous structure during its
crystallization.
Figure 6-16 High amorphous (52 %) coating of alumina-YSZ composite a) as-deposited and b) after
500 thermal cycles up to 1080°C
This combined alumina structure with zirconia precipitates, so-called “zirconia toughened
alumina” or ZTA, and the alumina precipitates in the zirconia structure known as
“alumina hardened zirconia” or AHZ, is the interesting structure that was the last goal of
this study. While ordinary heat treatment at about crystallization temperature proved
unable to yield this kind of precipitate (at least within the time given for this process),
a b
163
cyclic heat treatment could provide the goal of “multi-constituent” structure that may
benefit both properties.
6.9. Summary
In this part of the study about the significance of amorphous phase, important findings
were as follows.
The amount of amorphous phase did not show any effect on crystallization temperature
and did not present any meaningful relation with the γ- to α-alumina transformation
temperature.
Solid solution of cubic YSZ with alumina presents high temperature stability even at
elevated temperatures as high as 1500°C.
Amorphous phase is an effective source of nano-crystalline structure with smaller and
more stable grain sizes than what plasma spray can produce.
In terms of mechanical properties the pseudo-eutectic alumina-YSZ composite shows
basically superior hardness and fracture toughness compared with the presently used 8
wt% YSZ TBC deposited with the same process. The material is, however, inferior in
erosion resistance compared with 8 wt% YSZ.
In terms of the roles of amorphous phase on mechanical properties, it was found that:
a) Hardness of the amorphous-containing coatings is initially lower than that of
crystalline coating. Crystallization results in similar hardness in both coatings.
However, precipitation of zirconia in alumina matrix at 1300°C ends with an
increase in hardness of the high amorphous coating, higher than in crystalline
coating. However, after heat treatment at higher temperature (1500°C) the two
materials show similar hardness.
164
b) Fracture toughness of the amorphous-containing coatings is initially lower than
crystalline structure. Heat treatment at about crystallization temperature (1000 ºC)
makes the situation worse for both crystalline and amorphous coatings. Fracture
toughness in amorphous phase again experiences a great increase as a result of
precipitation hardening after 1300°C heat treatment. Eventually both types of
coating, after 1500°C, present similar behaviour.
c) Erosion loss in high amorphous coating is higher than in high crystalline coating.
Higher amorphous content reduces the thermal conductivity, and crystallization increases
it. In addition, the coatings with larger amounts of amorphous phase upon crystallization
heat treatment experience a greater increase in thermal conductivity due to crystallization
of amorphous phase into tetragonal zirconia rather than cubic.
The composite coating under investigation shows a potential of thermal cyclic resistance
at least equal to 8 wt% YSZ when the microstructure is integrated and with low number
of defects. This composite also presents high thermal stability against formation of
monoclinic zirconia.
The multi-constituent combination of ZTA with AHZ, as one goal of the project, was best
achieved by cyclic heating at temperatures as low as 1080°C, where smaller grains can
form. In addition, the phases formed during cyclic heating of the coatings may be
different from what forms during heat treatments at constant temperatures at almost
similar temperature.
165
Chapter 7 Conclusion, Main Contributions and
Future Works
The major findings in this research are in three different areas: a) amorphous phase
formation and its roles in the composite behaviour and properties; b) the SPS process and
its comparison with APS; and c) the characteristics of the alumina-YSZ composite
coatings as a TBC choice. Findings and contributions are summarized as follows.
7.1. Conclusions
It was found that the amount of the amorphous phase does not change the
crystallization temperature as according to literature it was suspected to. It does
not affect the subsequent transformation temperatures (i.e., alumina phase
transformation), either. However, the amorphous phase can decrease the thermal
conductivity of the composite. In terms of mechanical properties, it reduces the
hardness, fracture toughness and wear resistance in as-deposited coating.
Nevertheless, upon heat treatment, the amorphous phase causes improved
mechanical properties compared with crystalline coating.
Two methods for amorphous formation were introduced. They include, first, the
in-flight melting followed by mixing. This method is of major importance and
involves the entire bulk of the molten particles. The second method which is of
less significance happens upon impact of the molten particle. This method
consists of remelting of the solidified splat of the low melting component
166
(alumina) by the upcoming molten splat of the high melting component (zirconia)
followed by mixing the two melts.
An important finding in this work is that within the ranges of cooling rates in
plasma spray process, the importance of the melting and mixing time (particle
velocity for fixed spray distance) is more important than the variation in the splat
cooling rate (splat flattening and/or thickness).
For producing coatings with the more amorphous phase, using the two feed size
ranges – several tens of micrometer size and nano-particulates (agglomerated in
larger particles) – sprayed by APS process, the nano-size powder is more
successful. However, between the nano-size powders and a few micron-size feeds,
deposited by SPS process, the powder of a few micron size produces larger
amounts of the amorphous phase. In addition, high spray robot speed is a
significant parameter in maintaining the produced amorphous phase at high
values.
It was shown that, in plasma spray coatings, the supersaturated solid solution of
zirconia with aluminium solute atoms (and/or alumina with zirconium atoms) is
possible. This kind of solid solution is a new source of crystalline structure, not
addressed before in the literature. Furthermore, dissolution of alumina in this
crystalline phase is another reason for the absence of alumina in XRD patterns, in
addition to mixing in the amorphous phase.
In the SPS process formation of a variety of microstructures is possible. Different
splat morphologies with large or small intersplat interfaces and from nearly zero
167
to more than 8% porosity are producible. These coatings can present various
mechanical or thermal properties.
It was revealed that, in the SPS process, the particle velocity is a major parameter
controlling the microstructure, crystalline structure and amorphous phase
formation of the coatings. Therefore, the as-sprayed structure of SPS coatings can
be controlled using the process parameters that control the particle velocity. In
addition, it was found that in the combined crystalline/amorphous coatings, during
heating, the phases crystallize into structures dictated by the as-sprayed structure.
Therefore, the particle velocity may indirectly affect the coating structure even
after crystallization heat treatment.
During dry deposition of the feed powder in APS, almost no fragmentation
happens and the sizes of the initial and collected powders after spraying are
similar. In contrast, in the SPS process, as a wet deposition method using the
same powder feed, extensive liquid atomization and fragmentation result in much
smaller in-flight particles and splats than with APS. The average size of the
collected particles from SPS was found to be more than one order of magnitude
smaller than that of APS, using the same powder feed.
The material of interest (pseudo-eutectic alumina-YSZ) presents thermal cyclic
resistance and thermal conductivity similar to 8 wt% YSZ. It also presents higher
hardness and fracture toughness, but lower erosion resistance than 8 wt% YSZ.
As a general outcome of the studies on different phases within the coating, several
scenarios can be suggested for the as-coated solid that can be traced within the composite
structures. The splats may be solidified from the melt in either unmixed crystalline solid
168
(here alumina or zirconia) or solid solution (parented by either alumina or zirconia). This
solid solution can form within the solubility limit or supersaturated, depending on the
solidification condition. The as-deposited splat may also be in an amorphous (non-
crystalline) state. In addition, the as-sprayed coating can contain unmolten crystalline
solid, which may be heat-treated during flight in a plasma flame. The unmolten solid
might have been initially pure or as-solid solution (from powder production processes).
On the other hand, the partly molten particles could have re-solidified on the unmolten
crystalline seeds and reproduced the crystalline structure of the feed.
7.2. Major Contributions
An effective method for production of nano-crystalline structure in ceramic
composite coatings has been introduced. The method is based on the amorphous
phase and its crystallization in solid state, which results in smaller nano-crystalline
grains than what is formed by rapid solidification during SPS coating. This nano-
structure also shows more stability at high temperatures. Production of nano-
structured coating using this method does not require nano-sized feed, because in the
SPS process the amorphous phase forms more extensively when using powders of a
few microns in size. Thus the method circumvents the difficulties in application of
smaller feed sizes in production of nano-structured coating.
A new multi-constituent structure was fabricated, composed of alumina hardened
zirconia (AHZ) and zirconia toughened alumina (ZTA). This coating may benefit the
characteristics of both structures (either AHZ or ZTH). This structure is produced by
cyclic heating of the largely amorphous coatings. Heating cycles were in a range
169
between room temperature and 1000 ºC, which is slightly above crystallization
temperature.
This study made it possible to predict the microstructure and approximate crystalline
structure of the suspension plasma spray coatings through parametric studies.
Cyclic heat study was performed on the SPS coating for the first time in this work.
7.3. Recommendations for Future Works
The findings in this research provide the background for further studies on the SPS
production method and resulting structures of the material under study, as well as
investigations on new material for TBC application as follows.
Microstructural Repeatability in SPS Coatings
In spite of the systematic effort taken in this work for control of the SPS coating
microstructure (which resulted in production of many high-quality coatings), there is still
a way to go for the best repeatability in this innovative process. When repeatability is
obtained, different types of microstructure as found in this work can be reproduced,
including porous or dense, with high or low vertical crack density, and also, smoothly
flattened or corrugated splats. The resulting coatings may be considered for various
applications, such as TBCs which require porous coatings, or solid oxide fuel cell
electrolytes that need highly dense structure.
Further Investigation on AHZ-ZTA
The newly produced multi-constituent structure of alumina hardened zirconia-zirconia
toughened alumina (AHZ-ZTA) is expected to show interesting capabilities not only as a
TBC but also in other industrial applications. Investigation of the properties and
170
surveillance of the applications of the special structure formed in this composite merit
further work.
Further Investigation on Solid Solutions
The properties and possible applications for the newly found supersaturated solid
solutions of alumina and zirconia with high thermal stability are other considerable areas
for further investigation. Knowledge of the properties and the ways of manipulating the
amount of this phase, as was done here for the amorphous phase, may open the way to the
improvement of the properties of the present composite or other composite coatings
containing such a phase.
Other Compositions of Alumina-YSZ Composite
The pseudo-eutectic alumina-zirconia coating showed poor erosion resistance as well as
brittleness that seem to be mainly due to high alumina content. Hence, an initial survey
was taken on an off-eutectic composition with a lower amount of alumina, as explained in
Appendix Ι. According to this investigation using the SPS process, even the off-eutectic
composition can yield as high an amorphous content as in the case of the eutectic
composition using appropriate spray conditions. Therefore, to produce larger amounts of
amorphous phase within the coating and to benefit from the advantages of this phase as
reported in this thesis, lower amounts of alumina are applicable.
171
References
1. J.R. Davis & Associates, "Handbook of Thermal Spray Technology,” Materials Park,
OH, ASM International (2004).
2. U. Schulz, C. Leyens, K. Fritscher, M. Peters, B. Saruhan-Brings, O. Lavigne, J.
Dorvaux, Some Recent Trends in Research and Technology of Advanced Thermal
Barrier Coatings, Aerospace Science and Technology (2003/1) 7, 1, pp73-80.
3. Kurt H. Stern, "Metallurgical and Ceramic Protective Coatings,” London, UK,
Chapman & Hall (1996).
4. D. C. Amory and R. A. Hovan, Improving Gas Turbine Operating Efficiency using
Optical Pyrometry,
www.landinst.com/combustion/downloads/pdf/Article_Optical_Pyrometry.pdf , as on
June 2006
5. R.C. Garvie and M.V. Swain, Thermodynamics of the Tetragonal to Monoclinic Phase
Transformation in Constrained Zirconia Microcrystals. Part 1. in the Absence of an
Applied Stress Field. Journal of Materials Science (1985) 20, 4, pp193-200.
6. R.C. Garvie, Thermodynamic Analysis of the Tetragonal to Monoclinic
Transformation in a Constrained Zirconia Microcrystal. Part 2. in the Presence of an
Applied Stress. Journal of Materials Science (1985) 20, 10, pp3479-86.
172
7. M. Yashima, T. Nagatome, T. Noma, N. Ishizawa, Y. Suzuki and M. Yoshimura,
Effect of Dopant Species on Tetragonal (t')-to-Monoclinic Phase Transformation of Arc-
Melted ZrO2-RO1.5 (R = Sm, Y, Er, and Sc) in Water at 200° C and 100 MPa Pressure.
Journal of the American Ceramic Society (1995) 78, 8, pp2229-2232.
8. J.F. Bisson, C. Moreau, M. Dorfman, C. Dambra and J. Mallon, Behavior and
Characterization of Two 7-8 Wt% Yttria-Stabilized Zirconia Powders and Coatings
Produced using Plasma Spray Deposition, Thermal Spray 2003: Advancing the Science
and Applying the Technology, Proceedings of the International Thermal Spray
Conference, May 5-8, 2003, Orlando, FL, United States, pp1583-1589.
9. F.Tarasi, M. Medraj, A. Dolatabadi, J. Oberste-Berghaus, C. Moreau, Effective
Parameters in Axial Injection Suspension Plasma Spray Process of Alumina-Zirconia
Ceramics, Journal of Thermal Spray Technology (December, 2008) 17, 5-6, pp685-691.
10. J.G. Murphy, H.W. King and P. Mayer, Erosion -Corrosion Resistant Coatings for
Coal-Fired Boiler Tubes. II: Performance Tests of Thermal Expansion Matched Coatings,
Canadian Ceramics Quarterly (1987) 56, 4, pp21-25.
11. W. Pabst, G. Ticha, E. Gregrova, E. Tynova, Effective Elastic Properties of Alumina-
Zirconia Composite Ceramics part5. Tensile Modulus of Alumina-Zirconia Composite
Ceramics, Ceramics-Silikaty (2005) 49, 2, pp77-85.
12. U. Brossmann, G. Knoener, H.-. Schaefer and R. Wuerschum, Oxygen Diffusion in
Nanocrystalline ZrO2., Reviews on Advanced Materials Science (2004) 6, 1, pp7-11.
173
13. W.J. Quadakkers, V. Shemet, D. Sebold, R. Anton, E. Wessel and L. Singheiser,
Oxidation Characteristics of a Platinized MCrAlY Bond Coat for TBC Systems during
Cyclic Oxidation at 1000°C, Surface and Coatings Technology (2005) 199, 1, pp77-82.
14. W.R. Chen, X. Wu, D. Dudzinski and P.C. Patnaik, Modification of Oxide Layer in
Plasma-Sprayed Thermal Barrier Coatings, Surface and Coatings Technology (2006)
200, 20-21, pp5863-5868.
15. K.S. Ravichandran, K. An, R. Taylor, Assessment of Thermal Barrier Coatings by
Plasma Deposition, Thermal Spray: A United Forum for Scientific and Technological
Advances, pp291-298.
16. W.Y. Lee, D.P. Stinton, C.C. Berndt, F. Erdogan, Y. Lee and Z. Mutasim, Concept of
Functionally Graded Materials for Advanced Thermal Barrier Coating Applications,
Journal of the American Ceramic Society (1996) 79, 12, pp3003-3012.
17. C.G. Levi, Emerging Materials and Processes for Thermal Barrier Systems, Current
Opinion in Solid State and Materials Science (2004) 8, 1, pp77-91.
18. B. Leclercq, R. Mevrel, V. Liedtke and W. Hohenauer, Thermal Conductivity of
Zirconia-Based Ceramics for Thermal Barrier Coating, Materialwissenschaft Und
Werkstofftechnik (2003) 34, 4, pp406-409.
19. M.A. Golozar, J. Mostaghimi, T.W. Coyle and R. Soltani, Wear Behavior of
Nanostructured and Conventional Y-PSZ Coatings. Materials Degradation: Innovation,
Inspection, Control and Rehabilitation, Proceedings of the International Symposium on
174
Materials Degradation: Innovation, Inspection, Control and Rehabilitation, Aug. 21-24,
2005, Calgary, AB, Canada, pp273-285.
20. H. Chen, X. Zhou, C. Ding, Investigation of the Thermomechanical Properties of a
Plasma-Sprayed Nanostructured Zirconia Coating, Journal of the European Ceramic
Society (August 2003) 23, 9, pp1449-1455.
21. M. Suzuki, S. Sodeoka and T. Inoue, Alumina-Based Nanocomposite Coating
Prepared by Plasma Spray, Transactions of the Materials Research Society of Japan
(2004) 29, 2, pp405-408.
22. M. Suzuki, T. Inoue and S. Sodeoka, Fabrication of Plasma Sprayed Al2O3/YAG
Composite Coating and its Structure, 10th International Ceramics Congress, 2002, Part
C, (Faenza, Italy), pp381-388.
23. H.J. Kim, K.M. Lim, B.G. Seong and C.G. Park, Amorphous Phase Formation of Zr-
Based Alloy Coating by HVOF Spraying Process. Journal of Materials Science (2001)
36, 1, pp49-54.
24. H.-J. Kim and Y. J. Kim, Amorphous Phase Formation of the Pseudo-Binary Al2O3-
ZrO2 Alloy during Plasma Spray Processing. Journal of Materials Science (1999) 34, 1,
pp29-33.
25. G. Montavon, Recent Developments in Thermal Spraying for Improved Coating
Characteristics and New applications/process Controls and Spray Processes, High
Temperature Material Processes (2004) 8, 1, pp45-93.
175
26. M. Gell, L. Xie, X. Ma, E.H. Jordan, N. P. Padture, Highly Durable Thermal Barrier
Coatings made by the Solution Precursor Plasma Spray Process, Surface and Coatings
Technology (2004) 177-178, pp97-102.
27. A.G. Evans, D.R. Mumm, J.W. Hutchinson, G.H. Meier and F.S. Pettit, Mechanisma
Controlling the Durability of Thermal Barrier Coatings, Progress in Materials Science
(2001) 46, pp505-553.
28. S. Deshpande, A. Kulkarni, S. Sampath and H. Herman, Application of Image
Analysis for Characterization of Porosity in Thermal Spray Coatings and Correlation with
Small Angle Neutron Scattering, Surface and Coatings Technology (2004) 187, 1, pp6-
16.
29. H. Xu, H. Guo, F. Liu and S. Gong, Development of Gradient Thermal Barrier
Coatings and their Hot-Fatigue Behavior, Surface and Coatings Technology (2000) 130,
1, pp133-139.
30. J. Fazilleau, C. Delbos, M. Violier, J-F. Coudert, P. Fauchais, L. Bianchi,
K.Wittmann-Teneze, Influence of Substrate Temperature on Formation of Micrometric
Splats obtained by Plasma Spraying Liquid Suspension. Thermal Spray 2003-Advancing
the Science & Applying the Technology, C. Moreau and B. Marple, pp889-893.
31. B. Liang, H. Liao, C. Ding and C. Coddet, Nanostructured Zirconia–30 Vol.%
Alumina Composite Coatings Deposited by Atmospheric Plasma Spraying, Thin Solid
Films (2005) 484, 1-2, pp225-231.
176
32. Y. Zeng, C. Ding and S. Lee, Plasma Sprayed Coatings using Different Nanosize
Alumina Powders. Thermal Spray 2003: Advancing the Science and Applying the
Technology, Proceedings of the International Thermal Spray Conference, May 2003,
Orlando, FL, United States, pp671-674.
33. S. Sodeoka, M. Suzuki and T. Inoue, Thermal Stability and Mechanical Properties of
Plasma Sprayed Al2O3/ZrO2 Nano-Composite Coating, Key Engineering Materials
(2006) 317-318, pp513-516.
34. A. J. Skoog, J. A. Murphy, and T. John, Method for Applying a Plasma Sprayed
Coating using Liquid Injection. Patent# 20060222777
35. C. Monterrubio-Badillo, H. Ageorges, T. hartier, J.F. Codert and P. Fauchais, Plasma
Spraying of a Perovskite Suspension for SOFC Cathodes, Thermal Spray 2003:
Advancing the Science & Applying the Technology, pp687-692.
36. N.P. Padture, K.W. Schlichting, T. Bhatia, A. Ozturk, B. Cetegen, E.H. Jordan, M.
Gell, Towards Durable Thermal Barrier Coatings with Novel Microstructures Deposited
by Solution-Precursor Plasma Spray, Acta Materialia (2001) 49, 12, pp2251-2257.
37. L. Xie, X. Ma, E.H. Jordan, N.P. Padture, D.T. Xiao and M. Gell, Deposition of
Thermal Barrier Coatings using the Solution Precursor Plasma Spray Process, Journal of
Materials Science (2004) 39, pp1639-1646.
38. L. Xie, X. Ma, E.H. Jordan, N.P. Padture, D.T. Xiao and M. Gell, Identification of
Coating Deposition Mechanisms in the Solution-Precursor Plasma-Spray Process using
177
Model Spray Experiments, Materials Science and Engineering A (2003) 362, 1-2, pp204-
212.
39. X. Ma, F. Wu, J. Roth, M. Gell and E.H. Jordan, Low Thermal Conductivity Thermal
Barrier Coating Deposited by the Solution Plasma Spray Process, Surface and Coatings
Technology (2006) 201, 7, pp4447-4452.
40. C. Delbos, J. Fazilleau, V. Rat, J.F. Coudert, P. Fauchais and B. Pateyron,
Phenomena Involved in Suspension Plasma Spraying Part 2: Zirconia Particle Treatment
and Coating Formation. Plasma Chemistry and Plasma Processing, pp393-414.
41. R. Siegert, J. Doering, J. Marques, R. Vassen, D. Sebold and D. Stoever, Denser
Ceramic Coatings obtained by the Optimization of the Suspension Plasma Spraying
Technique. Thermal Spray 2004: Advances in Technology and Application, Proceedings
of the International Thermal Spray Conference, May 10-12, 2004, Osaka, Japan, pp568-
573.
42. C. Delbos, J. Fazilleau, J.F. Coudert, P. Fauchais, L. Bianchi and K. Wittmann-
Teneze, Plasma Spray Elaboration of Finely Structured YSZ Thin Coating by Liquid
Suspension Injection., Advancing the Science and Applying the Technology, Proceedings
of the International Thermal Spray Conference, May 2003, Orlando, FL, United States,
pp661-669.
43. P. Fauchais, G. Montavon, M. Vardelle and J. Cedelle, Developments in Direct
Current Plasma Spraying, Surface and Coatings Technology (2006) 201, 5, pp1908-1921.
178
44. R.J. Damani and P. Makroczy, Heat Treatment Induced Phase and Microstructural
Development in Bulk Plasma Sprayed Alumina, Journal of the European Ceramic
Society (2000) 20, 7, pp867-888.
45. P. Fauchais, Understanding Plasma Spraying, Journal of Physics D: Applied Physics
(2004) 37, ppR86-R108.
46. E.H. Jordan, L. Xie, M. Gell, N. P. Padture, B. Cetegen, A. Uzturk, Superior Thermal
Barrier Coatings using Suspension Plasma Spraying, Journal of Thermal Spray
Technology (2004) 13, pp57-65.
47. K. Wittmann, F. Blein, J.F. Coudert, P. Fauchais, Control of the Injection of an
Alumina Suspension Containing Nano-Grains in DC Plasma, New Surfaces for a New
Millennium, K. A. K. C.C. Berndt E. F. Lugscheider, pp375-382.
48. P. Fauchais, V. Rat, C. Delbos, J.F. Coudert, T. Chartier and L. Bianchi,
Understanding of Suspension DC Plasma Spraying of Finely Structured Coatings for
SOFC, IEEE Transactions on Plasma Science (2005) 33, 2, Part 3, pp920-930.
49. C. Delbos, C. Rat, C. Bonhomme, J. Fazilleau, J.F. Coudert and P. Fauchais,
Influence of Powder Size Distributions on Microstructural Features of Finely Structured
Plasma Sprayed Coatings, High Temperature Material Processes (2004) 8, pp397-406.
50. H. Zhang, H.B. Xiong, A. Vaydia, L. Li, Partially Melted Particle and its Splat
Morphology, Thermal Spray 2003: Advancing the Science and Applying the Technology,
179
Proceedings of the International Thermal Spray Conference, 5-8 May, Orlando, FL,
United States, pp905-911.
51. J.F. Bisson, B. Gauthier, C. Moreau, Effect of Direct-Current plasma Fluctuations on
in-Flight Particle Parameters, Journal of Thermal Spray Technology, (2003) 12, 2,
pp258-264.
52. E. Bouyer, F. Gitzhofer, M.I. Boulos, Powder Processing by Suspension Plasma
Spraying, Thermal Spray- United Forum for Scientific and Technological Advances,
1997, C. C. Berndt, Materials Park, Ohio, USA, pp353-359.
53. M. J. Stiger, N.M.Yanar, R. W. Jackson, C.G. Levi, Development of Intermixed
Zones of Alumina/Zirconia in Thermal Barrier Coating Systems, Metallurgical and
Materials Transactions A (2007) 38A, pp848-857.
54. T. Strangman, E.Raybould, Durable Thermal Barrier Coatings, Patent
#.20060115660.
55. D.J. Green, R.H.J. Hannin, and M.V. Swain, Transformation Toughening of
Ceramics, Boca Raton, Florida, USA,:CRC Press Inc. (1989).
56. E. Djurado, P. Bouvier and G. Lucazeau, Crystallite Size Effect on the Tetragonal-
Monoclinic Transition of Undoped Nanocrystalline Zirconia Studied by XRD and Raman
Spectrometry, Journal of Solid State Chemistry (2000) 149, 2, pp399-407.
180
57. M. Andritschky, I. Cunha and P. Alpuim, Thermal Stability of Zirconia/Alumina Thin
Coatings Produced by Magnetron Sputtering, Surface and Coatings Technology (1997)
94-95, 1-3, pp144-148.
58. M. Yashima, M. Kakihana and M. Yoshimura, Metastable-Stable Phase Diagrams in
the Zirconia-Containing Systems Utilized in Solid-Oxide Fuel Cell Application. Solid
State Ionics (1996) pp1131-1149.
59. M. Yashima, S. Sasaki, M. Kakihana, Y. Yamaguchi, H. Arashi, M. Yoshimura,
Oxygen-Induced Structural Change of the Tetragonal Phase Around the Tetragonal-Cubic
Phase Boundary in ZrO2-YO1.5 Solid Solutions, Acta Crystallographica Section B (1994)
50, Part 6, pp663-672.
60. C.R. Aita, M.D. Wiggins, R. Whig, C.M. Scanlan and M. Gajdardziska-Josifovska,
Thermodynamics of Tetragonal Zirconia Formation in a Nanolaminate Film, Journal of
Applied Physics (1996) 79, pp1176.
61. A. Portinha, V. Teixeira, A. Monteiro, M.F. Costa, N. Lima, J. Martins and D.
Martinez, Surface Analysis of Nanocomposite Ceramic Coatings, Surface and Interface
Analysis (2003) 35, 9, pp723-728.
62. K.W. Schlichting, N.P. Padture, E.H. Jordan and M. Gell, Failure Modes in Plasma-
Sprayed Thermal Barrier Coatings, Materials Science and Engineering A (2003) 342, 1-
2, pp120-130.
181
63. R. Darolia and B. A. Nagaraj, Forming of Thermal-Barrier Coating Resistant to
Deposits in Gas-Turbine Service., Patent #.EP 1 335 040 A2.
64. C. Mercer, S. Faulhaber, A.G. Evans and R. Darolia, A Delamination Mechanism for
Thermal Barrier Coatings Subject to Calcium–Magnesium–Alumino-Silicate (CMAS)
Infiltration, Acta Materialia (2005) 53, 4, pp1029-1039.
65. L. Xie, D. Chen, E.H. Jordan, A. Ozturk, F. Wu, X. Ma, B.M. Cetegen, Formation of
Vertical Cracks in Solution-Precursor Plasma-Sprayed Thermal Barrier Coatings, Surface
and Coatings Technology (2006) 201, 3-4, pp1058-1064.
66. X. Bi, H. Xu, S. Gong, Investigation of the Failure Mechanism of Thermal Barrier
Coatings Prepared by Electron Beam Physical Vapor Deposition, Surface and Coatings
Technology (2000) 130, pp122-127.
67. P. Ramaswamy, S. Seetharamu, K.B.R. Varma and K.J. Rao, Al2O3-ZrO2 Composite
Coatings for Thermal-Barrier Applications, Composites Science and Technology (1997)
57, 1, pp81-89.
68. K.S. Ravichandran, K. An, R.E. Dutton and S.L. Semiatin, Thermal Conductivity of
Plasma-Sprayed Monolithic and Multilayer Coatings of Alumina and Yttria-Stabilized
Zirconia, American Ceramic Society (1999) 82, 3, pp673-682.
69. S. Widjaja, A.M. Limarga and T.H. Yip, Modeling of Residual Stresses in a Plasma-
Sprayed zirconia/alumina Functionally Graded-Thermal Barrier Coating, Thin Solid
Films (2003) 434, 1-2, pp216-227.
182
70. A.M. Limarga, S. Widjaja and T.H. Yip, Mechanical Properties and Oxidation
Resistance of Plasma-Sprayed Multilayered Al2O3/ZrO2 Thermal Barrier Coatings,
Surface and Coatings Technology (2005) 197, 1, pp93-102.
71. A. Portinha, V. Teixeira, J. Carneiro, S.N. Dub and R. Shmegera, Mechanical
Properties of ZrO2-Al2O3 Nanostructured PVD Coatings Evaluated by Nanoindentation.,
Reviews on Advanced Materials Science (2003) 5, 4, pp311-318.
72. A.L. Vasiliev and N.P. Padture, Coatings of Metastable Ceramics Deposited by
Solution-Precursor Plasma Spray: II. Ternary ZrO2–Y2O3–Al2O3 System, Acta Materialia
(2006) 54, 18, pp4921-4928.
73. A.L. Vasiliev, N.P. Padture and X. Ma, Coatings of Metastable Ceramics Deposited
by Solution-Precursor Plasma Spray: I. Binary ZrO2–Al2O3 System, Acta Materialia
(2006) 54, 18, pp4913-4920.
74. M. Kurumada, C. Koike, C. Kaito, Laboratory Production of δ and θ alumina Grains
and their Characteristic Infrared Spectra, Monthly Notices of the Royal Astronomical
Society (2005) 359, 2, pp643-648.
75. A. Vardelle, C. Robert, G.X. Wang, S. Sampath, Analysis of Nucleation, Phase
Selection and Rapid Solidification of an Alumina Splat, Thermal Spray: A United Forum
for Science and Technological Advances, 1997, C.C. Berndt, pp635-643.
183
76. I. Levin, D. Brandon, Metastable Alumina Polymorphs: Crystal Structures and
Transition Sequences, Journal of the American Ceramic Society (1998) 81, 8, pp1995-
2012.
77. M.I.F. Macedo, C.A. Bertran, C.C. Osawa, Kitetics of the γ to α-Alumina Phase
Transformation by Quantitative X-Ray Diffraction, Journal of Materials Science (2007)
42, pp2830-2836.
78. Zun Chen, R.W. Trice, M. Besser, Xiaoyun Yang and D. Sordelet, Air-Plasma
Spraying Colloidal Solutions of Nano-Sized Ceramic Powders, Journal of Materials
Science (2004) 39, 1, pp4171-4178.
79. X. Zhao, Y. An, J. Chen, H. Zhou and B. Yin, Properties of Al2O3–40 Wt.% ZrO2
Composite Coatings from Ultra-Fine Feedstocks by Atmospheric Plasma Spraying, Wear
(2008) 265, 11-12, pp1642-1648.
80. S. Dosta, I.G. Cano, J.R. Miguel, and J.M. Guilemany, Production and
Characterization of Metastable ZrO2-Al2O3 Coatings obtained by APS+Quench, Journal
of Thermal Spray Technology (2008) 17, 3, pp360-364.
81. J. Obeste Berghaus, J.G. Legoux, C. Moreau, F. Tarasi and T. Chraska, Mechanical
and Thermal Transport Properties of Suspension Thermal Sprayed Alumina-Zirconia
Composite Coatings, Journal of Thermal Spray Technology (2008) 17, 1, pp91-104.
184
82. T. Chraska, K. Neufussa, J. Dubskya, P. Ctibora, P. Rohan, Fabrication of Bulk
Nanocrystalline Alumina-Zirconia Materials, Ceramics International (2008) 34, 5,
pp1229-1236.
83. P. Fauchais, M. Vardelle, A.Vardelle, L. Bianchi, A.C. Leger, Parameters Controlling
the Generation and Properties of Plasma Spray Zirconia Coatings, Plasma Chemistry and
Plasma Processing (1996) 16, 1, pp99S-125S.
84. L. Xie, E.H. Jordan, N.P. Padture and M. Gell, Phase and Microstructural Stability of
Solution Precursor Plasma Sprayed Thermal Barrier Coatings, Materials Science and
Engineering A (2004) 381, 1-2, pp189-195.
85. G. Shanmugavelayutham, S. Yano and A. Kobayashi, Microstructural
Characterization and Properties of ZrO2/Al2O3 Thermal Barrier Coatings by Gas Tunnel-
Type Plasma Spraying, Vacuum (2006/9/7) 80, 11-12, pp1336-1340.
86. A. Nazeri and S.B. Qadri, Alumina-Stabilized Zirconia Coatings for High-
Temperature Protection of Turbine Blades, Surface and Coatings Technology (1996) 1-3,
pp166-169.
87. B.L. Kirsch, A.E. Riley, A.F. Gross and S.H. Tolbert, Probing the Effects of
Interfacial Chemistry on the Kinetics of Phase Transitions in Amorphous and Tetragonal
Zirconia Nanocrystals, Langmuir (2004) 20, 25, pp11247-11254.
185
88. C. Moreau, J. F. Bisson, R. S. Lima, B. R. Marple, Diagnostics for Advanced
Materials Processing by Plasma Spraying, Pure and Applied Chemistry (2005) 77, 2,
pp443-462.
89. F.W. Gartner, Thermal Spray, Flame Spray, Metallization and Hard Facing, Product
and Services, QA/QC Accuraspray,
http://www.fwgts.com/fwgts_prodserv_qa_accura.htm as on May 2006.
90. J.M.S. F. Tang, Evolution of Young's Modulus of Air Plasma Sprayed Yttria-
Stabilized Zirconia in Thermally Cycled Thermal Barrier Coatings, Scripta Materialia
(2006) 54, pp1587-1592.
91. O.Kovarik, J. Nohava, P. Chraska, Young's Modulus and Fatigue Behavior of
Plasma-Sprayed Alumina Coatings, Journal of Thermal Spray Technology (2005) 14, 2,
pp31-238.
92. ASTM Designition: G76-83 (Reapproved on March 1989) “Standard Practice for
Conducting Erosion Tests by Solid Particle Impingement using Gas Jets.”
93. A.S. Houlbert, P. Cielo, C. Moreau and M. Lamontagne, Measurement of Thermal
Diffusivity and Anisotropy of Plasma-Sprayed Coatings. International Journal of
Thermophysics (1994) 15, 3, pp525-546.
94. A. Lopez-Rubio, B. M. Flangan, E. P. Gilbert, M. J. Gidley, A Novel Approach for
Calculating Starch Crystallinity and its Correlation with Double Helix Content: A
Combined XRD and NMR Study, Biopolymers (2008) 89 #9, 9, pp761-768.
186
95. Thermo-Scientific Co., Thermo-Galactic software package, GRAMS/AI Software;
(2002) Version 7.01.
96. P. Keblinski, S.R. Phillpot, D. Wolf and H. Gleiter, Relationship between
Nanocrystalline and Amorphous Microstructures by Molecular Dynamics Simulation,
Nanostructured Materials (1997) 9, 1-8, pp651-660.
97. A. Gombas, P. Szabo-Revesz, M.Kata, G. Regdon Jr., I. Eros, Quantitave
Determination of Crystallinity of α-Lactose Monohydrate, Journal of Thermal Analysis
and Calorimetry (2002) 68, pp503-510.
98. Cullity, B.D, Structure of Polycrystalline Aggregates. In Elements of X-Ray
Diffraction. USA, California:Addison-Wesley Publishing Company Inc. (1978).
99. G.N. Werner Kraus, Powdercell Software for Windows (2000) version 2.4.
100. P. Villars, L.D.C. Pearson’s Handbook of Crystallographic Data, Materials Park,
OH, ASM International (1991).
101. Y.S. T. Ando, Meta-Stable Alumina Structures in Melt-extractedAlumina-25wt%
Zirconia and Alumina-42wt% Zirconia Ceramics, Journal of the American Ceramic
Society (1991) 74, pp410-417.
102. M.Y. J.M. Calderon-Moreno, Stabilization of Zirconia Lamella in Rapidly Solidified
Alumina-Zirconia Eutectic Composites, Journal of the European Ceramic Society (2005)
25, pp1369-1372.
187
103. Charls E. Mortimer. Chemistry, Belmont, CA, USA: Wadsworth Pub Co (1986).
104. C. Bartuli, L.Bertamini, S. Matera, S. Sturlese, Investigation of the Formation of an
Amorphous Film at the ZrO2-Y2O3/NiCoCrAlY Interface of Thermal Barrier Coatings
Produecd by Plasma Spraying, Materials Science and Engineering A (1995) 199, pp229-
237.
105. K.A.H. Chraska T., Transmission Electron Microscopy Study of Rapid
Solidification of Plasma Sprayed Zirconia-Part II. Interfaces and Subsequent Splat
Solidification, Thin Solid Films (2001) 397, pp40-48.
106. O. Yamaguchi, M. Shirai, M. Yoshinaka, Formation and Transformation of Cubic
ZrO2 Solid Solution in the System ZrO2-Al2O3, Communications of the American
Ceramic Society (1988) 71, 12, ppC510-C512.
107. G. Box, W. Hunter and J. Hunter. Statistics for Experimenters an Introduction to
Design, Data Analysis, and Model Buildings. Canada: John Willey & Sons Inc. (1978).
108. C.-. Li and A. Ohmori, Relationship between the Microstructure and Properties of
Thermally Sprayed Deposits, Journal of Thermal Spray Technology (2002) 11, 3, pp365-
374.
109. F. Cernuschi, P. Bianchi, M. Leoni and P. Scardi, Reviewed Papers - Thermal
Diffusivity/Microstructure Relationship in Y-PSZ Thermal Barrier Coatings, Journal of
Thermal Spray Technology (1999) 8, 1, pp102-109.
188
110. R. Vassen, F. Traeger and D. Stover, Correlation between Spraying Conditions and
Microcrack Density and their Influence on Thermal Cycling Life of Thermal Barrier
Coatings, Jornal of Thermal Spray Technology (2004) 13, 3, pp396-404.
111. R. Soltani, T.W. Coyle, J. Mostaghimi, R.S. Lima and C. Moreau, Thermo-Physical
Properties of Plasma Sprayed Yttria Stabilized Zirconia Coatings, Surface and Coatings
Technology (2008) 202, 16, pp3954-3959.
112. H.Zhang, X.Y.Wang, L.L.Zheng, S.Sampath, Numerical Simulation of Nucleation,
Solidification, and Microstructure Formation in Thermal Spraying, International Journal
of Heat and Mass Transfer (2004) 47, pp2191-2203.
113. A. Haddadi, F. Nardou, P. Fauchais, A. Grinaud and A.C. Leger, Influence of
Substrate and Coating Temperature on Columnar Growth within Plasma Sprayed
Zirconia and Alumina Coatings, United Forum for Scientific and Technological
Advances, C. C. Berndt, pp671-680.
114. J. Oberste Berghaus, S. Bouaricha, J.-G. Legoux, C. Moreau, Injection Conditions
and in-Flight Particle States in Suspension Plasma Spraying of Alumina and Zirconia
Nano-Ceramics, Proceedings of the 2005 International Thermal Spray Conference,
Thermal Spray: Building on 100 Years of Success, May 2-5, 2005, Basel, Switzerland,
pp512-518.
115. J.W. Christian. The Theory of Transformations in Metals and Alloys. Oxford, UK:
Pergamon, Elsevier Science Ltd. (2002).
189
116. X.-L. Wu, Q. Ren, X.-M. He, Preparation of Nanoscale High-Purity α-Alumina
Powders, Key Engineering Materials (2007) 336-338, pp2051-2053.
117. J.K.s. J. Ilavsky, J. Wallace, Thermal Spray Yittria-Stabilized Zirconia Phase
Changes During Annealing, Journal of Thermal Spray Technology (2001) 10, 3, pp497-
501.
118. F. Tarasi, M. Medraj, A. Dolatabadi, J. Oberste-Berghaus, C. Moreau, Phase
Formation and Transformation 60/40 alumina/YSZ Nano Composite Coatings Deposited
by Suspension Plasma Spray, Journal of Materials Science A (2009 (in press)).
119. M. Suzuki, S. Sodeoka, T. Inoue, Study of Alumina-Based Nano Composite Coating
Prepared by Plasma Spray, Thermal Spray 2003: Advancing the Science and Applying the
Technology (2003), B. M. C. Moreau, pp701-705.
120. C. Robert, A. Denoirjean, A. Vardelle, G.-X. Wang, S. Sampath, Nucleation and
Phase Selection in Plasma Sprayed Alumina: Modeling and Experiment, 25-29 May,
Niece, France, pp407-412.
121. V. Jayarama, C.G. Levia, T. Whitneya, R. Mehrabiana, Characterization of Al2O3-
ZrO2 Powders Produced by Electrohydrodynamic Atomization, Materials Science and
Engineering: A (1990) 124, 1, pp65-81.
122. D. Chen, E. H. Jordan, M. Gella, Solution Precursor High-Velocity Oxy-Fuel Spray
Ceramic Coatings, Journal of the European Ceramic Society (2009) 29, 16, pp3349-
3353.
190
123. R. S. Lima, B. R. Marple, Toward Highly Sintering-Resistant Nanostructured ZrO2-
7wt.%Y2O3 Coatings for TBC Applications by Employing Differential Sintering, Journal
of Thermal Spray Technology (2008) 17, 5-6, pp846-852.
124. H.C. Chen, E. Pfender, B. Dzur, G. Nutsch, Microstructural Characterization of
Radio Frequency and Direct Current Plasma-Sprayed Al2O3 Coatings, Journal of Thermal
Spray Technology (June 2000) 9, 2, pp264-273.
125. A. Guinier. X-Ray Crystallographic Technology, London, Hilger & Watts LTD.
(1952).
126. R. Dutton, R. Wheeler, K. S. Ravichandran, K. An, Effect Of Heat Treatment on
Thermal Conductivity of Plasma-Sprayed Thermal Barrier Coatings, Journal of Thermal
Spray Technology (2000) 9, 2, pp204-209.
127. A.G. Evans, N.A. Fleck, S. Faulhaber, N. Vermaak, M. Maloney, R. Darolia,
Scaling Laws Governing the Erosion and Impact Resistance of Thermal Barrier Coatings,
Wear (2006) 260, pp886-894.
128. J. Ilavsky, G.G. Long, A.J. Allen, Evolution of the Plasma-Sprayed Deposits during
Heating, 15th
International Thermal Spray Conference, 25-29 May 1998, Nice, France,
pp1641-1644.
129. S. Rao-Bala, D. Tromans, Effect of Overaging on Mechanical Properties and Stress
Corrosion Cracking of HY-180M Steel, Metallurgical and Materials Transactions A
(1980) 11, 7, pp1187-1196.
191
130. C-J Li, W-Z Wang, Y. He, Dependency of Fracture Toughness of Plasma Sprayed
Al2O3 coatings on Lamellar Structure, Journal of Thermal Spray Technology (2004) 13,
3, pp425-431.
131. J.P. Holman. Thermal Conductivity, in Heat Transfer. Boston, USA: McGraw Hill
(2002).
132. R. K. Williams, J. B. Bates, R. S. Graves, D. L. McElroy, F. J. Weaver, Comparison
of Thermal Conductivity Data for Partially Stabilized Zirconia with Values Derived from
Thermal Diffusivity Results, International Journal of Therrnophysics (1988) 9, 4, pp588-
598.
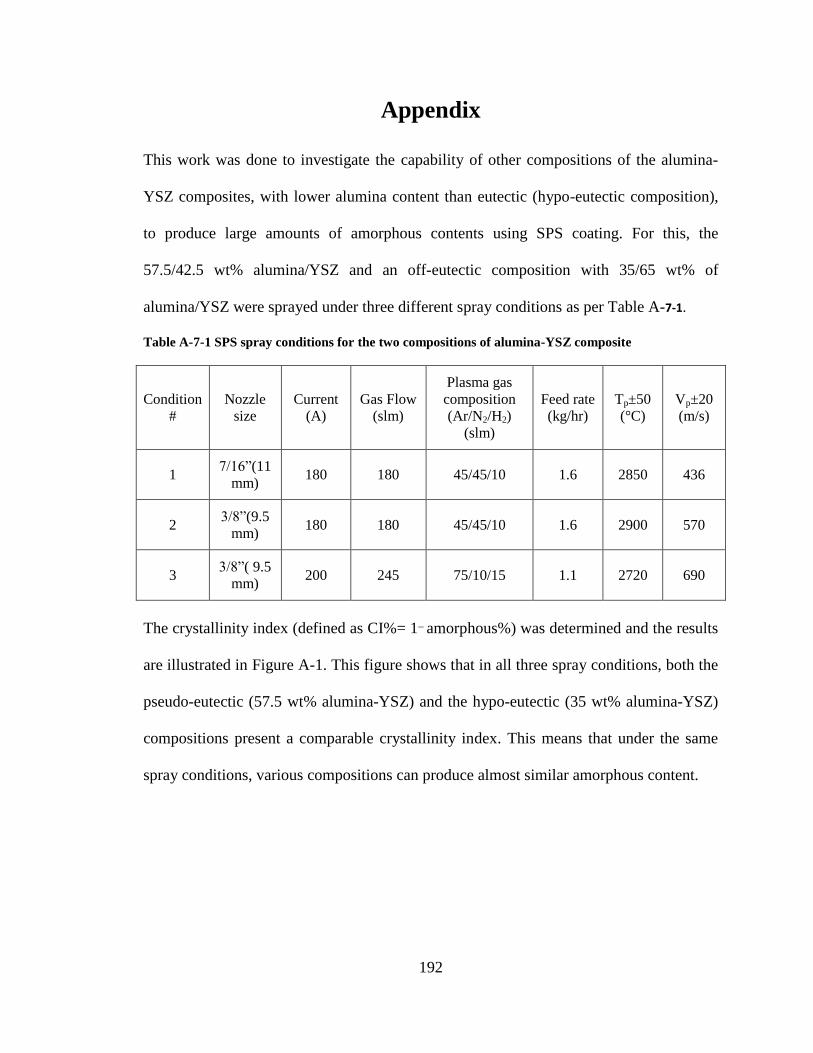
192
Appendix
This work was done to investigate the capability of other compositions of the alumina-
YSZ composites, with lower alumina content than eutectic (hypo-eutectic composition),
to produce large amounts of amorphous contents using SPS coating. For this, the
57.5/42.5 wt% alumina/YSZ and an off-eutectic composition with 35/65 wt% of
alumina/YSZ were sprayed under three different spray conditions as per Table A- 7-1.
Table A- 7-1 SPS spray conditions for the two compositions of alumina-YSZ composite
Condition
#
Nozzle
size
Current
(A)
Gas Flow
(slm)
Plasma gas
composition
(Ar/N2/H2)
(slm)
Feed rate
(kg/hr)
Tp±50
(°C)
Vp±20
(m/s)
1 7/16”(11
mm) 180 180 45/45/10 1.6 2850 436
2 3/8”(9.5
mm) 180 180 45/45/10 1.6 2900 570
3 3/8”( 9.5
mm) 200 245 75/10/15 1.1 2720 690
The crystallinity index (defined as CI%= 1_
amorphous%) was determined and the results
are illustrated in Figure A-1. This figure shows that in all three spray conditions, both the
pseudo-eutectic (57.5 wt% alumina-YSZ) and the hypo-eutectic (35 wt% alumina-YSZ)
compositions present a comparable crystallinity index. This means that under the same
spray conditions, various compositions can produce almost similar amorphous content.
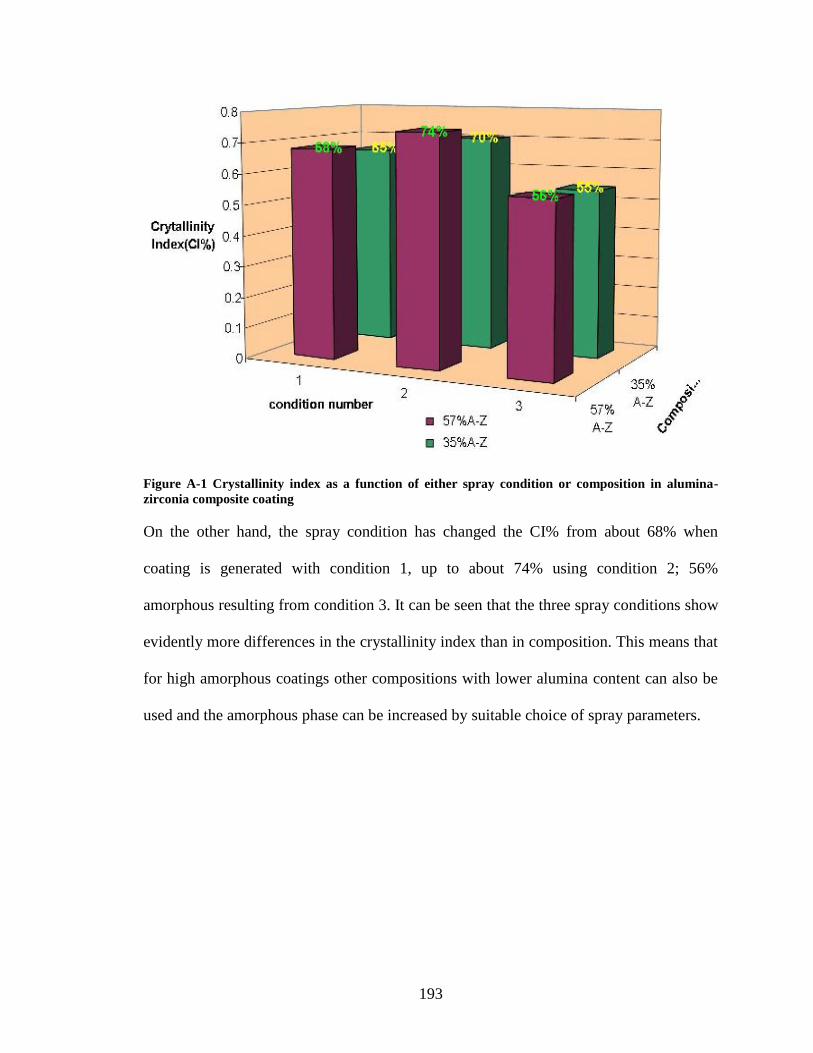
193
Figure A-1 Crystallinity index as a function of either spray condition or composition in alumina-
zirconia composite coating
On the other hand, the spray condition has changed the CI% from about 68% when
coating is generated with condition 1, up to about 74% using condition 2; 56%
amorphous resulting from condition 3. It can be seen that the three spray conditions show
evidently more differences in the crystallinity index than in composition. This means that
for high amorphous coatings other compositions with lower alumina content can also be
used and the amorphous phase can be increased by suitable choice of spray parameters.