survey of uk construction professional servicescic.org.uk/download.php?f=cicsurvey.pdf · survey of...
TRANSCRIPT

Survey ofUK Construction Professional Services
2005/06
This survey was led and project managed by:
Construction Industry Council (CIC), CIC is a partner in ConstructionSkills
And jointly undertaken by:
Davis Langdon Management Consulting and Experian BS
PROFESSIONAL SURVEY 23/11/07 16:21 Page 1

This research was funded by ConstructionSkills, the Sector Skills Council for Construction,
and carried out by the Construction Industry Council (CIC) as lead partner.

Survey of UK Construction Professionals 2005/06 - REPORT
Davis Langdon Management Consulting July 2007
Contents
1 Executive Summary .................................................................. i
1.1 Headline findings......................................................................... i
1.2 Structure and earnings (see Section 3, page 6)........................... i1.3 Key changes since 1995/96 (see Section 8, page 26) .................ii
1.4 Profile and type of work (see Sections 4 & 5, pages 12 and 17) ..ii
1.5 Regional and overseas profile (see Section 6, page 20)..............ii1.6 Employment (see Section 7, page 23).........................................ii
2 Introduction .............................................................................. 1
2.1 Survey aims and scope .............................................................. 1
2.2 Scope of the report..................................................................... 12.3 Summary of survey sample and response.................................. 2
2.4 Classification of Firms ................................................................ 3
2.5 Analysis of Responses ............................................................... 33 Structure of the CPS sector and fee income .......................... 5
3.1 Headline findings........................................................................ 5
3.2 Structure of the CPS sector........................................................ 53.3 Gross Fee income by type of business (2005/06)....................... 7
3.4 UK Fee income by size of business............................................ 8
3.5 Fee income by type of business ................................................. 9
4 Profile of work by sector and discipline ............................... 114.1 Headline findings...................................................................... 11
4.2 Main services provided by type of firm...................................... 11
4.3 Breakdown of services ............................................................. 125 Type of work ........................................................................... 16
5.1 Headline findings...................................................................... 16
5.2 Overall breakdown ................................................................... 165.3 Sector of work (DTI Classifications).......................................... 17
5.4 Type of project ......................................................................... 17
6 Regional and overseas profile of work ................................. 19
6.1 Headline findings...................................................................... 196.2 UK Regions .............................................................................. 19
6.3 Overseas Fee Income .............................................................. 20
7 Employment............................................................................ 227.1 Headline findings...................................................................... 22
7.2 Employment profile................................................................... 22
7.3 Breakdown by type and size of business.................................. 23
7.4 Per capita fee income............................................................... 248 Headline changes since 2002 ................................................ 25
8.1 Headline findings...................................................................... 25
8.2 Fee income .............................................................................. 258.3 Trends in construction and professional activity ....................... 26
8.4 Improvements in the performance and productivity of the CPS
sector ....................................................................................... 298.5 Services provided..................................................................... 30
8.6 Sector and type of work............................................................ 31
8.7 Region of work ......................................................................... 31
8.8 Employment ............................................................................. 32
Annex 1 ................................................................................... 33
Survey of UK Construction Professionals 2005/2006 - RePoRt
CIC-ConstructionSkills
19)22)

Survey of UK Construction Professionals 2005/06 - REPORT i
Davis Langdon Management Consulting July 2007
1 Executive Summary
1.1 Headline findings
This is the third comprehensive survey of the Construction Professional Services (CPS)
sector in the UK. Its aim has been to assess the size of the UK market for construction
professional services. The results have been based on detailed information of fee income and
the services provided by construction professional services firms in the financial year
2005/06. They represent the responses of a representative sample of over 800 construction
professional firms of all types and sizes.
Size of market 2005/06
UK professional services firms earned a total of £13.9 billion on projects in the UK
There were approximately 27,950 professional firms in the UK.
UK Market shares (% of UK fee income)
Engineering services accounted for 28% of all work, £3.9 billion
Architecture services accounted for 24% of all work, £3.3 billion
Surveying services accounted for 17% of all work, £2.3 billion
Management accounted for 12% of all work, £1.7 billion.
Income by type of firm
Per capita fee income for professionals increased steadily by size of firm and mean per
capita fee income for the smallest firms (<£200k fee income pa) is £65K per annum.
Income by size of firm
A small number of large firms (2%) generated almost 80% of UK fee income.
Regional and Overseas Markets
A third of UK fee income is earned on projects in the South East and Greater London
£2.5 billion of fee income is earned by UK firms on work overseas.
Employment
Approximately 270,000 people were employed by construction professional firms
77% of this total were male.
1.2 Structure and earnings
Approximately 27,950 professional services firms earn a total of £13.9 billion on UK
construction projects. The size of the overseas market for UK CPS firms is estimated to be
approximately £2.5 billion – 15% of total fee income.
79% of all CPS firms operate from a single office and 84% employ less than 10 people -
28% of all firms are single person practices. 2% of firms earn over £10 million per annum
and employ more than 50 people – yet this small group of firms are responsible for
generating 78% of all UK fee income.
CIC-ConstructionSkills
Survey of UK Construction Professionals 2005/2006 - RePoRt i
This is the third comprehensive survey of the Construction Professional Services (CPS) sector in the UK carried out by the Construction Industry Council (CIC). The project follows earlier surveys that were conducted in 1996 and 2002. Its aim has been to assess the size of the UK market for construction professional services. The results have been based on detailed information of fee income and the services provided by construction professional services firms in the financial year 2005/06. They represent the responses of a representative sample of over 800 construction professional firms of all types and sizes.

Survey of UK Construction Professionals 2005/06 - REPORT ii
Davis Langdon Management Consulting July 2007
Firms that describe themselves as being multidisciplinary earn almost 50% of all UK fee
income and 50% of all CPS output is generated in the provision of architecture and
engineering services.
1.3 Key changes since previous surveys
Output of CPS firms has risen by approximately 4% (in real terms) in the four years since the
last survey, which is slightly below contractors output for the same period.
There has been very little change in the proportion of core services that are provided by the
sector but there have been significant changes in the type and profile of firms that deliver
these services – with growth in the proportion of outputs from multidisciplinary firms.
Residential projects have experienced the largest rise as a proportion of all work since
2001/02, accounting for 42% of all fee income – an increase of 26% in the overall proportion
since the last survey.
Per capita fee income per professional has decreased since the time of the last survey, with a
fall of 13% in real terms. This is likely to be the result of increasing staff levels. The
proportion of male to female staff within each type of CPS firm has not improved
significantly, 77% of all employment in the sector is male.
1.4 Profile and type of work
Almost two-thirds of fee income is earned on new work (62%) with 32% being earned on
refurbishment projects and the balance – 6% being earned on repair and maintenance work.
Fees earned on building projects (in particular offices) account for the largest proportion
(43%) of fee income closely followed by fees earned on residential projects (42%). The
proportion of fees earned on infrastructure projects is considerably smaller (15%).
In terms of clients, 75% of fee income was generated from private sector clients (including
PFI/PPP projects) with the remaining 25% coming from public sector clients.
1.5 Regional and overseas profile
A third of all fee income was generated on projects in the South East of England and Greater
London. Other regions with relatively large CPS inputs are the South West and Scotland.
Approximately £2.5 billion of fee income was received by practices in the UK for
professional services provided on overseas projects.
1.6 Employment
The CPS sector employs approximately 270,000 permanent employees. On average, 77% of
all employment in the sector is male.
When fee income and employment are compared, engineering firms employ 17% of all staff
and are responsible for 15% of all income. Architects employ 14% of the total workforce and
generate 11% of fee income. Surveying practices employ 16% of staff and are responsible
for 15% of all fee income.
CIC-ConstructionSkills
ii Survey of UK Construction Professionals 2005/2006 - RePoRt
Survey of UK Construction Professionals 2005/06 - REPORT
Davis Langdon Management Consulting July 2007
1
2 Introduction
This report contains the findings of the first major survey of the UK Construction
Professional Services Sector to have taken place in the last four years. It is a survey of
professional services practices and firms, their outputs and activity, for the financial year
2005/06.
The organisations that responded to this survey form a broad and representative cross section
of the professional services sector. The results detail the findings from over 800 companies,
who between them employ over 45,000 full time members of staff and generate a fee income
of over £2.5 billion.
The results have been used in conjunction with available population data to provide
estimates on the size and output of construction professional services firms. This is a survey
of firms that are in private practice and does not therefore represent the totality of
professional services that contribute towards UK construction. Many construction
professionals work within large contracting or client organisations and this survey does not
include the inputs that such individuals contribute to UK construction activity.
This is a cross sectional, ‘snap shot’, study and therefore it has not been possible to provide a
longitudinal analysis of the intervening years between this and the previous survey.
However, a section of this report is devoted to highlighting the key differences between the
comparable results for the surveys of 1996, 2002 and those of 2006.
2.1 Survey aims and scope
This survey is a collaborative project involving the Construction Industry Council, their
principal professional members and ConstructionSkills. The principal investigators for the
research have been Davis Langdon Management Consulting (DLMC) and Experian, both
consultancy practices carried out the previous research.
The study’s key objectives have been to:
quantify the volume of outputs of the construction professional services sector in the UK
provide various breakdowns of professional services output, which include:
o the type of services traded by UK construction professional practices
o the type of service providers and suppliers
o the main elements of construction work for which professional services are traded
o regional variations in the survey results
identify the various service functions undertaken within each of the major professional
disciplines
provide data and information that is of interest to all of the major stakeholders in the
project, including the CIC, its member organisations, ConstructionSkills and professional
services firms themselves
maximise the response rate to the survey to provide the most statistically robust results
within a sampling frame of 12,924 firms.
2.2 Scope of the report
Part 1 (this report) provides the analysis of responses in the main survey and highlights the
main issues that arise from it. There is a summary of key findings at the start of each section
CIC-ConstructionSkills
Survey of UK Construction Professionals 2005/2006 - RePoRt 1
Survey of UK Construction Professionals 2005/06 - REPORT
Davis Langdon Management Consulting July 2007
2
of the report, which is followed by a more detailed commentary of survey responses. Part 2
of the report documents the methodology that has been adopted for the survey. Brief
explanations of the key issues that have affected the analysis have been included in this
document but please refer to Part 2 for a detailed explanation of the key issues that have
affected the overall analysis.
2.3 Summary of survey sample and response
The results that are presented in this report are based on 801 completed questionnaires, from
an original sample of 12,924 firms (a response rate of 6.2%). The research team originally
set a target of 1,000 responses in order to achieve an acceptable level of accuracy when
presenting the findings. While the response rate was not as high as had been sought at the
outset, it falls somewhere between the response rates obtained on previous surveys, as such
we believe the results as presented are statistically valid.
The 2002 survey achieved 927 valid responses, from an original sample of 10,000 firms (a
response rate of 9.3%). The 1996 survey achieved 824 valid responses from a sample of
15,000 firms (a response rate of 5.4%), both proved to be statistically robust for the headline
issues that were covered by those studies.
We believe that respondent fatigue may be a factor in the decline in response rate evident
between the second and third surveys. Since the last survey there has been increasing interest
in the CPS sector generally, and we are aware of a growing number of survey requests made
on Construction professional service firms.
Given the highly sensitive and complex levels of financial information that each respondent
has had to supply, the research team are extremely thankful to all those that took part and are
pleased with the overall response.
One sampling source has been used for the survey, which has been provided by Experian. In
carrying out initial research for the survey it was found that no comprehensive data is kept by
institutional or government sources that provides a sound basis for the sampling and grossing
of the CPS sector – a situation that is essentially unchanged since previous surveys. The need
to look outside institutional and government records therefore became an important element
of our work in developing the sampling frame.
In seeking a suitable source of data, the research team carried out a review of other sources.
In particular the Inter Departmental Business Register (IDBR), which was used in the 1996
survey.
Significant problems exist with the IDBR. These include:
the lack of any personal contacts to whom the questionnaire could have been sent,
risking an adverse affect on the overall response rate
a classification based on high level SIC (Standard industrial classification) codes, which
introduces a high risk of questionnaire redundancy because of the inability to identify
‘true’ construction organisations within the sample
restrictions on the data’s use, when used by third parties, which would have created
severe time constraints for the survey.
CIC-ConstructionSkills
2 Survey of UK Construction Professionals 2005/2006 - RePoRt
Survey of UK Construction Professionals 2005/06 - REPORT
Davis Langdon Management Consulting July 2007
3
Our research showed that Experian’s National Business Database provided the most useful,
practical and cost effective source of data in developing the sample framework, especially in
relation to smaller firms, for which there was extensive coverage.
The Experian National Business Database
The sampling source for the survey was Experian’s National Business Database, which is an
amalgam of the Thomson, Yellow Pages and Companies House data covering approximately
4.2 million businesses in the UK.
Our sample has been chosen from a population of approximately 28,000 organisations in 24
construction related categories in the Experian dataset. The majority of firms within the
sample have been drawn from the traditional disciplines of architecture, engineering and
surveying. A full breakdown of the sample structure can be found in Part 2 of this report.
Selection for the sampling frame by type of firm and region was in relation to the proportion
of firms in the global population, with the exception of Northern Ireland. For Northern
Ireland, the size of the survey sample was boosted to the total population of firms to ensure
that the minimum of 50 responses required to provide a robust analysis of the sector in
Northern Ireland was received. For size of firm, the sample was biased in the direction of
large firms to ensure the greatest coverage of the sector in terms of fee income and
employment.
2.4 Classification of Firms
The stratification of the survey sample has been based upon the type of firm, size of firm and
region. This has been based on classifications, which are loosely based on SIC Minor Codes
(Standard Industrial Classifications), which have been adapted, extended, or condensed to
suit the format of the sampling frame. The questionnaire used fewer categories than the 24
that were used to develop the sample. For the purposes of simplicity and interpretation, the
classifications have been recoded into:
Architects
Quantity surveyors
Surveyors (other)
Building services engineers
Civil and structural engineers
Planners (town planners)
Project managers
Multidisciplinary practices
2.5 Analysis of Responses
Response by type of firm
The survey was sent out at the beginning of November 2006, with responses requested by the
end of that month. Of the 891 questionnaires that were returned by responding companies,
801 contained sufficient data to be considered valid, representing an overall response rate of
6.2%. Over 90% of those that responded provided answers for their practice as a whole with
the remainder providing responses in terms of a local office. Responding firms employed
some 45,432 members of staff and generated over £2.56 billion of UK fee income.
CIC-ConstructionSkills
Survey of UK Construction Professionals 2005/2006 - RePoRt 3

Survey of UK Construction Professionals 2005/06 - REPORT
Davis Langdon Management Consulting July 2007
4
The response to the survey largely reflected the structure of the overall population by type of
firm, size band of firm and region. Figure 2.1 shows the distribution of respondents by size
of firm and Part 2 of this report provides a breakdown of responses, against the structure of
the original population.
Figure 2.1: Survey responses – distribution of respondents by size of firm (DTI
classifications)
Note: Size bands relate to those used in DTI’s Construction Statistics Annual, 2007
When viewed in terms of firm size, the sample displays typically, negatively skewed
characteristics. The shape and relative proportions of this distribution are very similar to that
for construction contracting organisations.
Companies that employ less than 4 employees within the sample represent approximately
45% of all firms by number. These companies employ 1.4% of all of the employees within
the sample and generate 1.2% of the fee income. While firms that employ over 300 members
of staff represent approximately 2% of all firms in the sample (by number), are responsible
for 75% of employment and 76% of total fee income within the sample.
The unadjusted fee income data is heavily skewed towards the largest firms, with 60% of the
fee income being generated by 1% of the firms. The sample has therefore been normalised
with respect to fee income, to ensure that the largest firms have not unduly influenced the
results. The overall fee income generated by the unadjusted sample is £2.6 billion. The
adjusted, normalised sample, which forms the basis of the various fee income estimates
presented in this report, accounts for some £1.5 billion of fee income.
To provide a robust estimate of the actual number of firms in the sector we have de-
duplicated all of the records in the original population dataset, both within and between the
various corporate classifications. Where the same companies have appeared in more than one
of the dataset classifications (for example, as both Acoustic Engineers and Building Services
Consultants) we have included them within the larger, core discipline.
0
5
10
15
20
25
30
35
40
45
50
1-3 4-7 8-13 14-24 25-34 35-59 60-79 80-114 115-299 300-599 300-1199 >1200
No. employees in UK
Pe
rce
nt
CIC-ConstructionSkills
4 Survey of UK Construction Professionals 2005/2006 - RePoRt

Survey of UK Construction Professionals 2005/06 - REPORT
Davis Langdon Management Consulting July 2007
5
3 Structure of the CPS sector and fee income
3.1 Headline findings
Firms
There are approximately 27,950 firms in the CPS sector
79% of CPS firms operate from a single office
28% of CPS firms are single person practices
84% of CPS firms employ less than 10 people
45% of CPS firms earn up to £200,000 per year
Only 2% of all firms earn more than £10 million per year
2% of CPS firms employ over 50 people
Fee income
The sector generated approximately £13.9 billion in fee income during 2005/06
Architecture and engineering services account for 52% of fee income
Nearly 50% of fee income is earned by multidisciplinary firms
3.2 Structure of the CPS sector
We estimate that there are now approximately 28,000 CPS firms in the UK, compared to our
estimates of 23,500 firms in 2002. Our commentary relating to this change can be found in
Section 8. Breakdowns of the sector by size of firm and turnover are presented in Tables 3.1
and 3.2.
Table 3.1: Estimated number of CPS firms by main type and number of employees (%
and no.)
No. of employees 1 2-5 6-10 11-50 >50 Total
Architects 4062 4857 1339 1071 126 11455
35 43 12 9 1 100
Civil & structural engineers 1189 2181 994 1423 321 6108
20 36 16 23 5 100
Building services engineers 780 1688 672 751 110 4001
19 42 17 19 3 100
Other surveyors 619 981 273 205 29 2107
29 47 13 10 1 100
Quantity surveyors 550 845 298 242 16 1951
28 44 15 12 1 100
Managers 255 545 197 147 34 1178
22 46 17 12 3 100
Others (including planners) 366 464 166 124 27 1147
32 40 15 11 2 100
Total 7821 11561 3939 3963 663 27947
Note: Figures in italics are proportions
CIC-ConstructionSkills
Survey of UK Construction Professionals 2005/2006 - RePoRt 5

Survey of UK Construction Professionals 2005/06 - REPORT
Davis Langdon Management Consulting July 2007
6
79% of the respondents within the survey operate from a single office. The proportion of
single office practices is highest amongst planners, at 95%, followed by architects at 90%,
which compares to 50% of multi-disciplinary firms, the group exhibiting the lowest
proportion of single office practices.
Of the 20% of CPS firms that operate from multiple offices, 78% of these operate from four
offices or less. Only 6% of these practices operate from 10 offices or more.
Table 3.2: Estimated number of CPS firms by main type and fee income (% and no.)
Fee incomeSmall
<£200k
Medium
£200k-£1m
Large
>£1m-£10m
Largest
>£10m Total
Architects 6071 3895 1375 114 11455
53 34 12 1 100
Civil & structural engineers 2321 2382 1222 183 6108
38 39 20 3 100
Building services engineers 1321 1520 1080 80 4001
33 38 27 2 100
Other surveyors 948 822 316 21 2107
45 39 15 1 100
Quantity surveyors 1034 663 234 20 1951
53 34 12 1 100
Managers 553 425 188 12 1178
47 36 16 1 100
Others (including planners) 390 471 275 11 1147
34 41 24 1 100
Total 12638 10178 4690 441 27947
Note: Figures in italics are proportions
Table 3.3 below highlights the operating structure and fee income of CPS firms. The
majority operate as private Limited companies, followed by sole practitioners. In terms of
fee income Limited companies both public and private account for the vast majority of fee
income. Indeed, while PLCs only account for 1% of firms they account for 42% of fee
income as would be expected given that these are the largest firms in the sector. Also of
interest is the number of sole practitioners providing construction professional services,
although the fee income they generate is relatively small.
Table 3.3: Operating structure of CPS firms (%)
No of firms % Fee income %
Partnership 14.2 5.3
LLP 4.7 10.5
Ltd Co 52.1 40.9
PLC 1.1 42.3
Sole practitioner 27.9 1
Total 100 100
CIC-ConstructionSkills
6 Survey of UK Construction Professionals 2005/2006 - RePoRt
Survey of UK Construction Professionals 2005/06 - REPORT
Davis Langdon Management Consulting July 2007
7
Table 3.4 below indicates that most CPS firms have a regional or local focus to the work
they undertake. 22% of CPS firms undertake work on a national basis however only a very
small proportion undertake work on an international basis. In terms of fee income, firms
which conduct the majority of their project work on a national basis account for almost three
quarters of UK fee income, again indicating the importance of the largest firms in terms of
fees earned.
Table 3.4: Geographic focus of CPS firms (%)
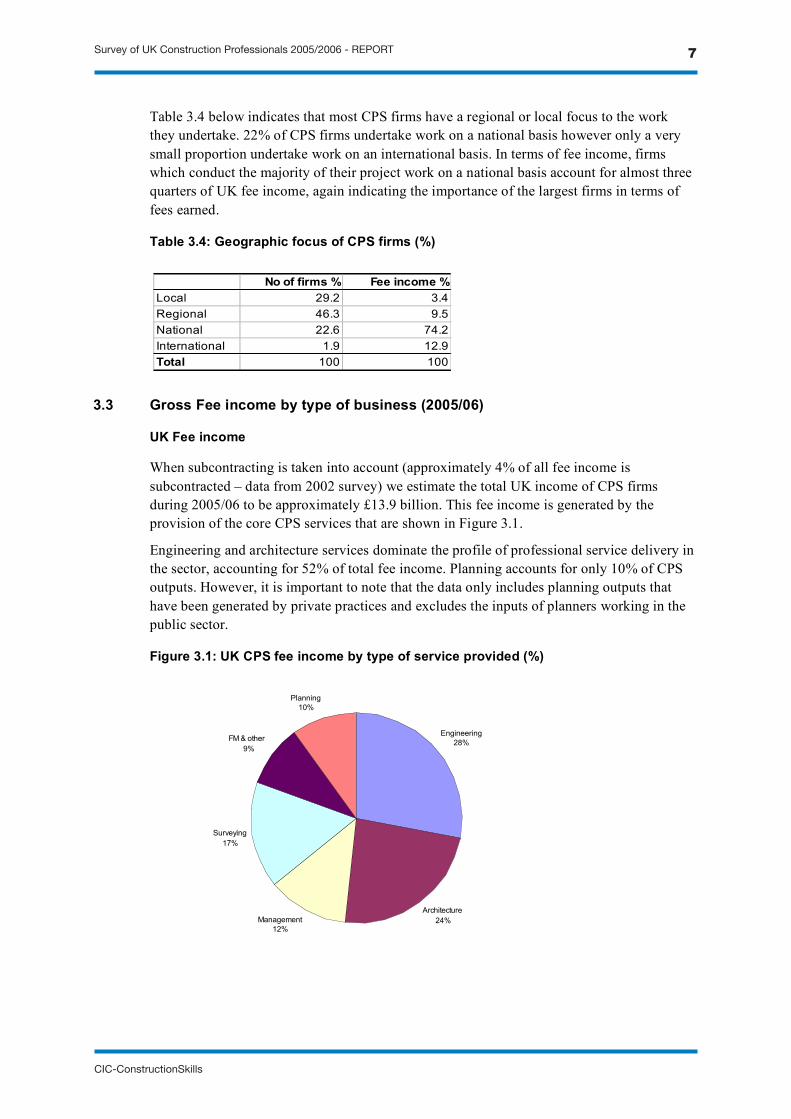
3.3 Gross Fee income by type of business (2005/06)
UK Fee income
When subcontracting is taken into account (approximately 4% of all fee income is
subcontracted – data from 2002 survey) we estimate the total UK income of CPS firms
during 2005/06 to be approximately £13.9 billion. This fee income is generated by the
provision of the core CPS services that are shown in Figure 3.1.
Engineering and architecture services dominate the profile of professional service delivery in
the sector, accounting for 52% of total fee income. Planning accounts for only 10% of CPS
outputs. However, it is important to note that the data only includes planning outputs that
have been generated by private practices and excludes the inputs of planners working in the
public sector.
Figure 3.1: UK CPS fee income by type of service provided (%)
Engineering
28%
Architecture
24%Management
12%
Surveying
17%
FM & other
9%
Planning
10%
No of firms % Fee income %
Local 29.2 3.4
Regional 46.3 9.5
National 22.6 74.2
International 1.9 12.9
Total 100 100
CIC-ConstructionSkills
Survey of UK Construction Professionals 2005/2006 - RePoRt 7

Survey of UK Construction Professionals 2005/06 - REPORT
Davis Langdon Management Consulting July 2007
8
The amount of fee income generated in the provision of each of these services is estimated to
be:
Engineering £3.9 billion
Architecture £3.3 billion
Management £1.7 billion
Surveying £2.3 billion
FM and other £1.3 billion
Planning £1.4 billion
Total £13.9 billion
A thorough breakdown of this fee income is included in the following sections.
3.4 UK Fee income by size of business
For reporting purposes we have classified firms as being ‘small’, ‘medium’, ‘large’ and
‘largest’, based upon four turnover bands. These bands are based on those that were used in
the previous survey and have been adjusted to allow for inflation of fee income since 2002.
The four size band groups are:
Small - earning less than £200k per year
Medium - earning between £200k and £1 million per year
Large - earning over £1 million but less than £10 million per year
Largest – earning equal to or more than £10 million per year
Figure 3.2 details CPS fee income by size of firm. Not surprisingly, the largest firms
generate the majority of all fee income.
CPS firms in this category generate approximately 78% of all fee income (£10.8 billion) and
yet they account for only 2% of all firms by number (approximately 550 organisations). As
the size of CPS firms increases, the geographical profile of their work widens. Firms earning
less than £1 million generate the majority of their fee income on local projects or regionally
(accounting for approximately 85% of all work). The data shows that the majority of the
largest firms tend to operate nationally, with over 82% of their work being generated on a
national portfolio of projects (refer to Section 6).
Figure 3.2: UK CPS Fee income by size of business (£ billion)
0 2 4 6 8 10 12
<£200k
£200k-£1m
>£1m-£10m
>£10m
Siz
e o
f fi
rm
UK fee income (£bn)
CIC-ConstructionSkills
8 Survey of UK Construction Professionals 2005/2006 - RePoRt

Survey of UK Construction Professionals 2005/06 - REPORT
Davis Langdon Management Consulting July 2007
9
3.5 Fee income by type of business
3.5.1 Estimates of fee income by type of firm
Our data suggest that over 48%, or £6.6 billion, of all fee income is earned by organisations
that describe themselves as being ‘Multidisciplinary’. These firms account for only 8% of all
CPS organisations (by number).
Other types of CPS firm account for the remaining 52% of fee income (£7.2 billion).
Engineering firms generate 15% of all fee income (£2.1 billion) and account for 21% of all
CPS organisations by number. Architectural practices account for 11% of total fee income
(£1.5 billion) whilst surveying firms account for 16% of overall output.
Multidisciplinary firms do provide a broad range of services. However, in many cases one
service tends to dominate the profile of firms who choose to describe themselves as
multidisciplinary. The provision of any one service by such firms often exceeds 50% of total
fee income but is rarely above 70%.
Figure 3.3: Proportion of UK CPS fee income earned by type of firm (%)
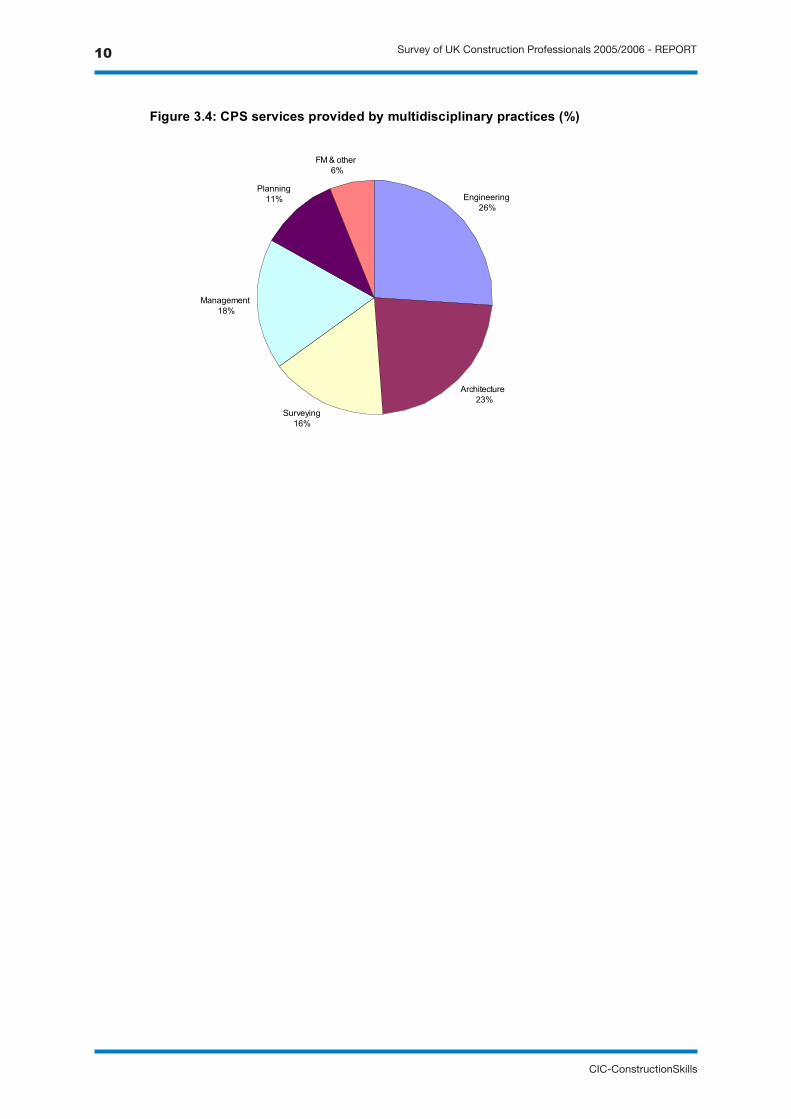
3.5.2 Multidisciplinary practices
The data support the fact that these firms do offer a wide range of services, from more than
one core discipline (Figure 3.4). The dominant service offered by such firms, in terms of fee
income, is engineering, which accounts for 26% of the outputs from multidisciplinary firms
(approximately £1.7 billion) followed by architecture services which account for 23%
(approximately £1.5 billion). The core disciplines of surveying and management generate
roughly equal proportions of outputs for multidisciplinary CPS firms (between 16% and 18%
each), whilst FM services and planning account for 17% of the total fee income from these
firms.
Architecture
11%
Building services
engineering
7%
Civil and structural
engineering
8%Management consultancy
0%
Multi-disciplinary
49%
Planning
1%
Project management
6%
Quantity surveying
14%
Surveying
1%
Other
3%
CIC-ConstructionSkills
Survey of UK Construction Professionals 2005/2006 - RePoRt 9
Survey of UK Construction Professionals 2005/06 - REPORT
Davis Langdon Management Consulting July 2007
10
Figure 3.4: CPS services provided by multidisciplinary practices (%)
Engineering
26%
Architecture
23%
Surveying
16%
Management
18%
Planning
11%
FM & other
6%
CIC-ConstructionSkills
10 Survey of UK Construction Professionals 2005/2006 - RePoRt
Survey of UK Construction Professionals 2005/06 - REPORT
Davis Langdon Management Consulting July 2007
11
4 Profile of work by sector and discipline
4.1 Headline findings
Core services
Engineering services generate £3.9 billion of fee income
Architectural services generate £3.3 billion of fee income
Surveying services generate £2.3 billion of fee income
Management services generate £1.7 billion of fee income
Planning services generate £1.4 billion of fee income
FM and other services generate £1.3 billion of fee income
Type of firm
Multi-disciplinary firms provide the majority of construction professional services in all
disciplines
Breakdown of services
70% of all architecture is generated on traditional design
Engineering services are dominated by structural, building services and civil engineering
Building surveying accounts for almost one half of all surveying outputs
Project management and contract administration dominate the profile of management
services
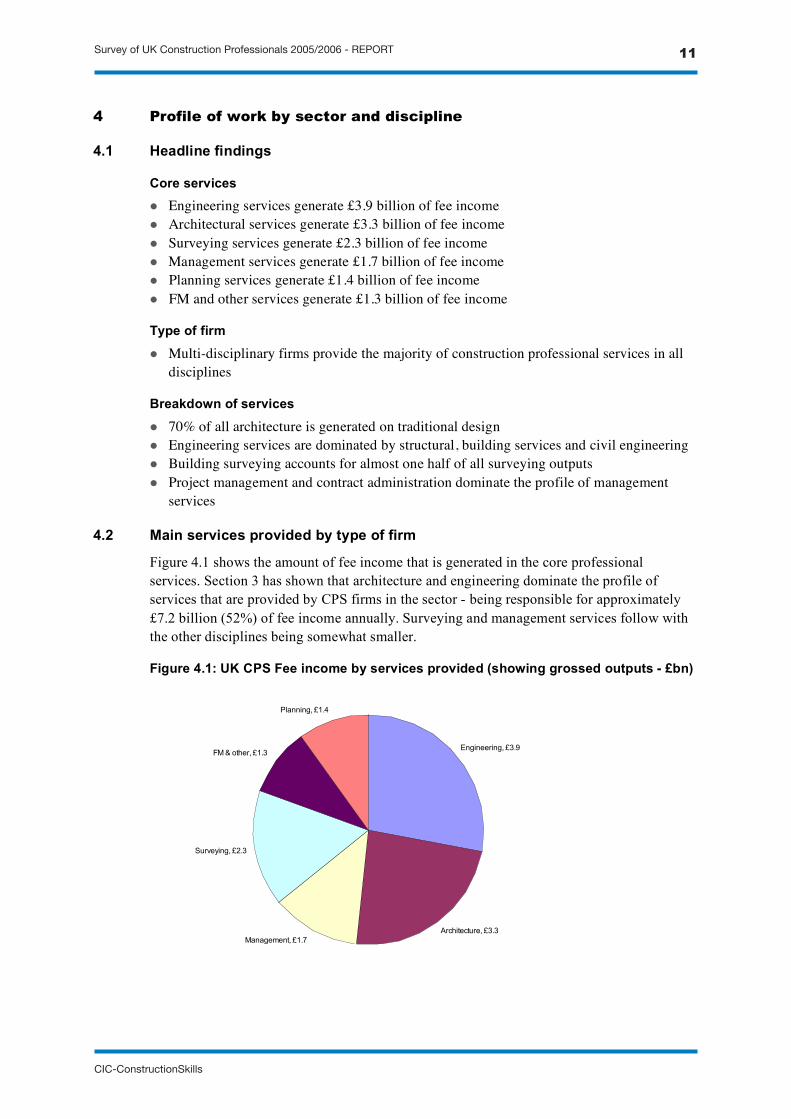
4.2 Main services provided by type of firm
Figure 4.1 shows the amount of fee income that is generated in the core professional
services. Section 3 has shown that architecture and engineering dominate the profile of
services that are provided by CPS firms in the sector - being responsible for approximately
£7.2 billion (52%) of fee income annually. Surveying and management services follow with
the other disciplines being somewhat smaller.
Figure 4.1: UK CPS Fee income by services provided (showing grossed outputs - £bn)
Engineering, £3.9
Architecture, £3.3
Management, £1.7
Surveying, £2.3
FM & other, £1.3
Planning, £1.4
CIC-ConstructionSkills
Survey of UK Construction Professionals 2005/2006 - RePoRt 11

Survey of UK Construction Professionals 2005/06 - REPORT
Davis Langdon Management Consulting July 2007
12
Table 4.1 below details UK fee income earned by type of CPS firm and the services that they
provide.
Table 4.1: Breakdown of core services provided by type of CPS business
Percent
Planningservices
Architectureservices
Engineeringservices
Surveyingservices
Managementservices
FM & otherservices
Architects 14.6 29.2 2.2 3.3 4.5 15.3
Building services engineers 3.8 3.8 18.8 1.3 6.5 5.9
Civil and structural engineers 5.4 3.2 22.1 2.3 6.9 6.2
Multi-disciplinary 48.3 52.3 50.5 41.3 40.9 54.3
Planning 21.0 3.4 0.0 1.4 1.9 1.8
Project management 2.0 2.9 0.5 3.9 22.2 3.5
Quantity surveyors 3.4 3.6 4.1 29.6 14.8 10.1
Surveyors 1.5 1.6 1.8 16.9 2.3 2.9
Total 100.0 100.0 100.0 100.0 100.0 100.0
4.2.1 Breakdown by type of firm
Table 4.1 shows that multi-disciplinary firms provide the majority of CPS services in all
disciplines. Indeed, multi-disciplinary firms provide over one half of the total of architecture,
engineering and FM services. This is not surprising, as the multi-disciplinary practices tend
to be the largest firms, who in turn generate the majority of fees in the CPS sector as a
whole.
4.3 Breakdown of services
Figure 4.2 shows the proportions of individual services that fall within the core service
headings, irrespective of the type of firm. These display the following main characteristics.
4.3.1 Architecture
The field of architecture is dominated by the architectural design of buildings. This may not
seem surprising and architecture shows the least amount of ‘spread’ between its various sub-
disciplines. Approximately 70% of all architecture outputs are in the architecture and design
category, accounting for approximately £2.31 billion of fee income annually. 11% of
architectural fee income is generated by the provision of architectural technology services
(approximately £360 million) with other services being somewhat smaller.
4.3.2 Engineering
Engineering displays a relatively even spread of outputs between the various sub-disciplines
that make up this service category. The three largest fee-earning categories are structural
engineering (34% / £1.33 billion), building services (26% / £1.01 billion) and civil
engineering (18% / £700 million). Fire engineering and waste management engineering are
responsible for the smallest proportions of engineering related income, at 1.2% and 1.6%
respectively. Dedicated environmental and sustainability projects account for approximately
6% of engineering fee income (£230 million).
CIC-ConstructionSkills
12 Survey of UK Construction Professionals 2005/2006 - RePoRt

Survey of UK Construction Professionals 2005/06 - REPORT
Davis Langdon Management Consulting July 2007
13
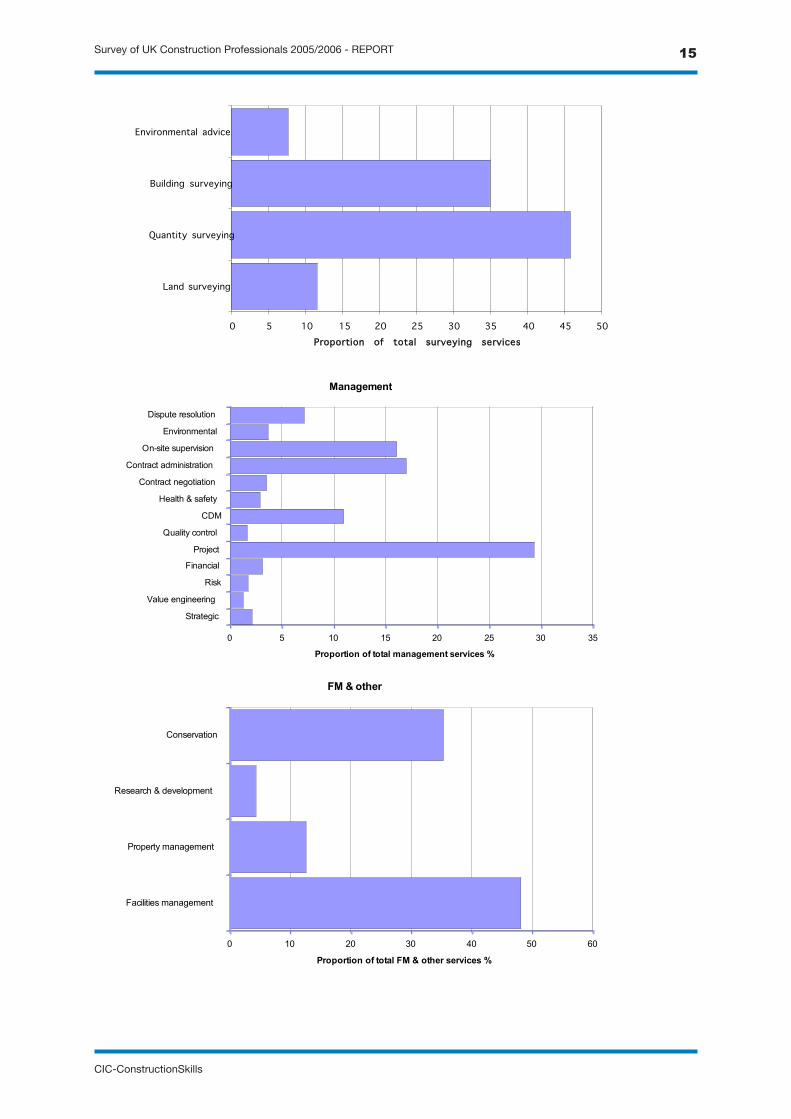
4.3.3 Surveying
Quantity surveying accounts for almost half (46%) of all surveying outputs (approximately
£1.06 billion), followed by building surveying which accounts for over a third of all
surveying outputs, equating to £805 million of fee income. Other surveying service are
considerably smaller although surveying outputs dedicated to environmental or sustainability
projects exhibit the highest proportion amongst all of the core service categories.
4.3.4 Management and legal services
This is the broadest category, containing 13 sub-categories of management service. Eight of
these sub categories (which include risk, financial, quality control and environmental
management) do not exceed 4% of total fee income generated within this core service.
Project management (29%), contract administration (17%) and on site supervision (16%)
dominate the profile – being responsible for 63% of all management outputs (£1.05 billion).
4.3.5 Planning services
Planning services are dominated by the provision of planning applications, appeals and
inquiries output. These services account for 62% of planning fee income (approximately
£868 million). In addition, a significant proportion of planning income (15% / £210 million)
is generated in project feasibility.
4.3.6 Facilities management and other services
Overall, facilities management and related services generate the lowest proportion of fee
income in the CPS sector, accounting for £1.3 billion. Within this classification facilities
management (48%) and conservation (35%) provide the largest share of output.
CIC-ConstructionSkills
Survey of UK Construction Professionals 2005/2006 - RePoRt 13

Survey of UK Construction Professionals 2005/06 - REPORT
Davis Langdon Management Consulting July 2007
14
Figure 4.2: Breakdown of professional services provided by sub-discipline (%)
Engineering
0 5 10 15 20 25 30 35 40
Geotechnical
Structural
Fire
Highways
Civi l
Building services
Water management
Environmental
Waste management
Proportion of total engineering services %
Architecture
0 10 20 30 40 50 60 70 80
Urban design
Landscape
Architectural design
Space planning
Interior design
Environmental
Technology
Proportion of total architecture services %
Planning
0 10 20 30 40 50 60 70
Environmental studies
Urban/regional studies
Planning applications
Transport planning
Site appraisal
Project feasibility
Proportion of total planning services %
CIC-ConstructionSkills
14 Survey of UK Construction Professionals 2005/2006 - RePoRt
Survey of UK Construction Professionals 2005/06 - REPORT
Davis Langdon Management Consulting July 2007
15
Management
0 5 10 15 20 25 30 35
Strategic
Value engineering
Risk
Financial
Project
Quality control
CDM
Health & safety
Contract negotiation
Contract administration
On-site supervision
Environmental
Dispute resolution
Proportion of total management services %
FM & other
0 10 20 30 40 50 60
Facilities management
Property management
Research & development
Conservation
Proportion of total FM & other services %
Surveying
0 5 10 15 20 25 30 35 40 45 50
Land surveying
Quantity surveying
Building surveying
Environmental advice
Proportion of total surveying services %
CIC-ConstructionSkills
Survey of UK Construction Professionals 2005/2006 - RePoRt 15

Survey of UK Construction Professionals 2005/06 - REPORT
Davis Langdon Management Consulting July 2007
16
5 Type of work
5.1 Headline findings
Type of work
New work accounts for 62% of fee income - £8.7 billion
Refurbishment accounts for 32% of fee income - £4.4 billion
Repair and Maintenance (RMI) accounts for 6% of fee income - £0.8 billion
Residential accounts for 42% of CPS fee income - £5.8 billion
Building accounts for 43% of CPS fee income - £6.0 billion
Infrastructure accounts for 15% of CPS fee income - £2.1 billion
Private work accounts for 75% of CPS fee income - £10.5 billion
Public work accounts for 25% of CPS fee income - £3.4 billion
5.2 Overall breakdown
There are various ways in which the actual types of project on which CPS firms become
engaged can be broken down.
Typically these include:
breakdowns by new work, repair and refurbishment
breakdowns by public or private modes of procurement
broad classifications of work (such as those used in the DTI Housing and Construction
Statistics)
breakdowns by type of project.
All four of these classification types have been addressed in this survey and are described in
this section.
5.2.1 New work, repair and refurbishment
Figure 5.1: UK CPS Fee income by type of work (%)
New construction
62%
Refurbishment
32%
Repair & maintenance
6%
CIC-ConstructionSkills
16 Survey of UK Construction Professionals 2005/2006 - RePoRt

Survey of UK Construction Professionals 2005/06 - REPORT
Davis Langdon Management Consulting July 2007
17
Figure 5.1 shows that the profile of CPS firms is dominated by their inputs to new
construction, with approximately £8.7 billion (approximately 62%) being devoted to this
category. Repair, maintenance and improvement (RMI) accounts for only 6% of CPS fee
income, whilst refurbishment projects account for the remainder (32%). Collectively these
two categories generate just over £5 billion of income for the sector.
5.3 Sector of work (DTI Classifications)
When broken down by broad categories of work, the majority of CPS fee income is
generated in the following proportions.
Residential – 42%, or £5.8 billion
Building – 43%, or £6.0 billion
Infrastructure – 15%, or £2.1 billion
The classifications of work by type can also be considered in terms of their broad
procurement category. The breakdown of CPS inputs to Private or Public projects is as
follows:
Private – 75%, or £10.5 billion
Public – 25%, or £3.4 billion
5.4 Type of project
Within each broad type of work there are specific building or project types on which
professional services are employed. In residential projects this includes conventional housing
units (terraced, semi-detached and detached), refurbishments and the construction of purpose
built apartment blocks. The 2006 CPS survey asked respondents to provide details on the
specific types of building to which they provide services. The numbers of respondents in
each element of the analysis are not as high as in other areas of the survey. The results are
therefore not as statistically robust as those that have been presented elsewhere in this report
but we include them here, as we believe that they provide a useful indication as to the inputs
that the CPS sector provides to specific types of work.
5.4.1 CPS inputs to building projects
The data suggests that CPS firms provide the following inputs to various types of building
projects (as a proportion of all building work):
Offices 24%, or £1.45 billion
Retail outlets 12%, or £0.75 billion
Leisure facilities 11%, or £0.64 billion
Educational buildings 16%, or £0.96 billion
Healthcare facilities 9%, or £0.53 billion
Factories and warehouses 14%, or £0.82 billion
Other buildings 14%, or £0.85 billion
The majority of CPS fee income earned on building projects comes from services provided
in office construction, followed closely by fees earned on educational buildings and factories
and warehouses. The proportion of fees earned on other building projects is somewhat
smaller.
CIC-ConstructionSkills
Survey of UK Construction Professionals 2005/2006 - RePoRt 17
Survey of UK Construction Professionals 2005/06 - REPORT
Davis Langdon Management Consulting July 2007
18
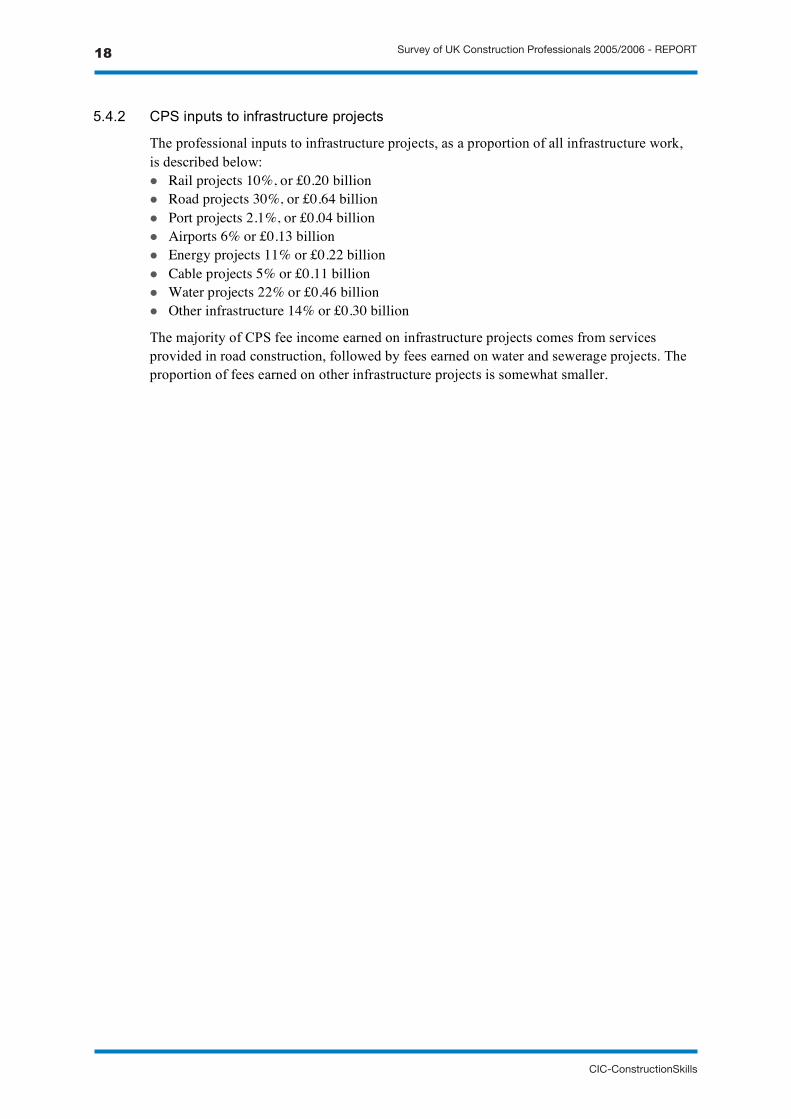
5.4.2 CPS inputs to infrastructure projects
The professional inputs to infrastructure projects, as a proportion of all infrastructure work,
is described below:
Rail projects 10%, or £0.20 billion
Road projects 30%, or £0.64 billion
Port projects 2.1%, or £0.04 billion
Airports 6% or £0.13 billion
Energy projects 11% or £0.22 billion
Cable projects 5% or £0.11 billion
Water projects 22% or £0.46 billion
Other infrastructure 14% or £0.30 billion
The majority of CPS fee income earned on infrastructure projects comes from services
provided in road construction, followed by fees earned on water and sewerage projects. The
proportion of fees earned on other infrastructure projects is somewhat smaller.
CIC-ConstructionSkills
18 Survey of UK Construction Professionals 2005/2006 - RePoRt

Survey of UK Construction Professionals 2005/06 - REPORT
Davis Langdon Management Consulting July 2007
19
6 Regional and overseas profile of work
6.1 Headline findings
Level of fee income
A third of all CPS fee income is generated on projects in the South East and
Greater London
Other regions of note are the South West and Scotland
A greater proportion of fee income is earned on new build projects in the South East
and Greater London than any other regions in the UK
Overseas fee income
Overseas fee income of UK CPS firms (remitted back to offices in the UK) is
approximately £2.5 billion
6.2 UK Regions
Figure 6.1: UK CPS fee income by Government Office Region (%)
Firms have been asked to allocate their fee income to the regions where their relevant
projects were located, as opposed to the location of their corporate offices. The distribution
of this fee income is shown in Figure 6.1.
The largest proportion of UK professional fee income is earned on projects in the South East
and Greater London. We estimate the gross levels of fee income generated in each region of
the UK to be:
North East – £0.36 billion
Yorkshire & Humber - £0.69 billion
East Midlands - £0.83 billion
East of England - £0.33 billion
South East - £2.61 billion
North East
3% Yorkshire & Humber
5%
East Midlands
6%
East of England
7%
South East
20%
Greater London
13%
South West
10%
West Midlands
7%
North West
8%
Wales
4%
Scotland
10%
Northern Ireland
7%
CIC-ConstructionSkills
Survey of UK Construction Professionals 2005/2006 - RePoRt 19

Survey of UK Construction Professionals 2005/06 - REPORT
Davis Langdon Management Consulting July 2007
20
Greater London - £1.82 billion
South West - £1.43 billion
West Midlands - £1.02 billion
North West - £1.18 billion
Wales - £0.61 billion
Scotland - £1.45 billion
Northern Ireland – £0.97 billion
6.2.1 Breakdowns by region
Projects in Greater London and the rest of the South East are responsible for 33% of CPS fee
income. This is no surprise given that these two regions account for the bulk of the UK’s
population and in turn construction spending.
The regional pattern of fee income is broadly in line with contractor’s output in the same
period, in that a large proportion of all income is generated in Greater London and the South
East. Indeed, contractors output in these regions accounted for 33% of all work in 2005.
Other regions of note, where CPS output exceeds £1 billion, are Scotland, the South West
and the North West of England.
6.3 Overseas Fee Income
6.3.1 Profile of overseas fee income
When the figures are grossed up, using a similar methodology to that used in the estimate of
UK fee income, overseas fee income is estimated to be approximately £2.5 billion. This
represents approximately 15% of total fee income of UK CPS firms, a similar proportion to
that reported in the 1995/96 survey but significantly higher than that reported in the 2001/02
survey.
However, the data presented above has to be interpreted carefully, as the survey returns only
reflect fee income that has been remitted back to offices in the UK. Furthermore, we believe
that:
information on overseas fee income could have been very difficult to obtain for many
respondents.
there are significant problems in finding a suitable coefficient for fee income inflation
when comparing 2005, 2002 and 1996 overseas fee income levels.
6.3.2 Profile of overseas fee income by type of firm and service
Table 6.1 below indicates that even the smallest CPS firms undertake some work overseas,
as would be expected there appears to be a very strong relationship between the size of firm
and the propensity to work overseas.
CIC-ConstructionSkills
20 Survey of UK Construction Professionals 2005/2006 - RePoRt
Survey of UK Construction Professionals 2005/06 - REPORT
Davis Langdon Management Consulting July 2007
21
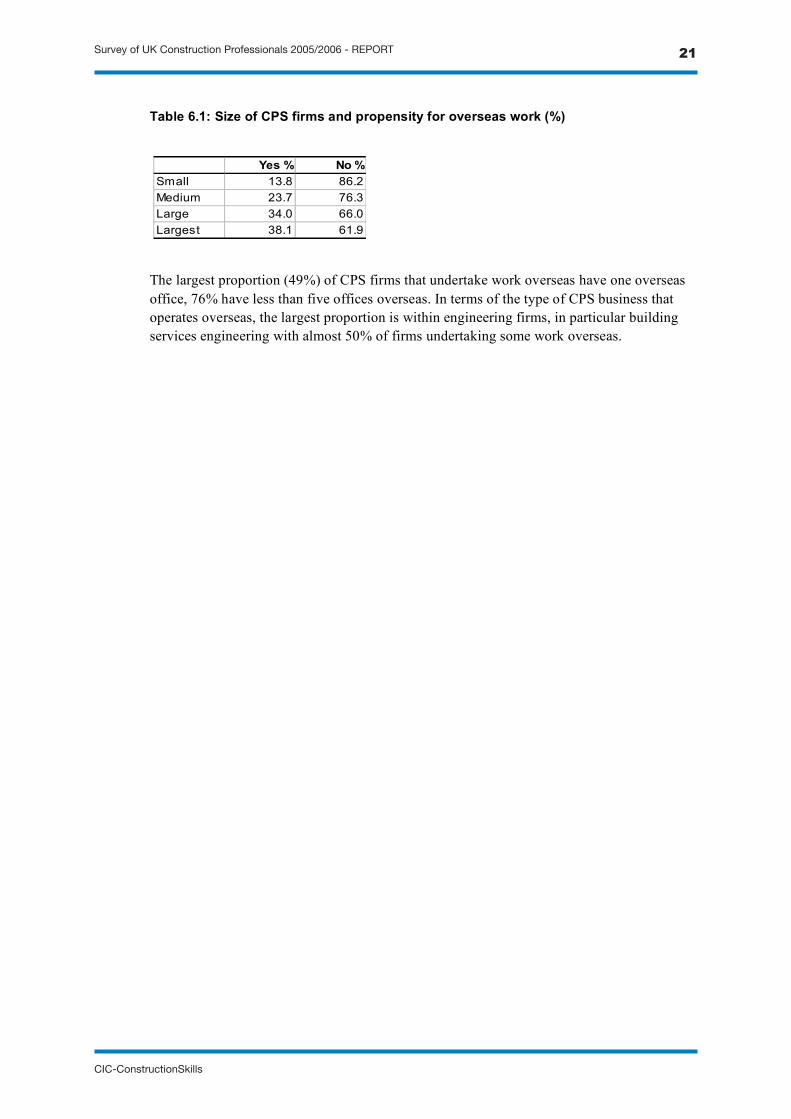
Table 6.1: Size of CPS firms and propensity for overseas work (%)
The largest proportion (49%) of CPS firms that undertake work overseas have one overseas
office, 76% have less than five offices overseas. In terms of the type of CPS business that
operates overseas, the largest proportion is within engineering firms, in particular building
services engineering with almost 50% of firms undertaking some work overseas.
Yes % No %
Small 13.8 86.2
Medium 23.7 76.3
Large 34.0 66.0
Largest 38.1 61.9
CIC-ConstructionSkills
Survey of UK Construction Professionals 2005/2006 - RePoRt 21

Survey of UK Construction Professionals 2005/06 - REPORT
Davis Langdon Management Consulting July 2007
22
7 Employment
7.1 Headline findings
Profile of employment
The CPS sector employs approximately 270,000 employees
77% of all employment in the sector is male
Engineering firms generate 15% of income and employ 17% of all staff
Architectural firms generate 11% of income and employ 14% of all staff
Surveying firms generate 15% of income and employ 16% of all staff
Multi-disciplinary firms generate 48% of income and employ 41 % of all staff
Professional per capita fee income rises steadily by size of firm
7.2 Employment profile
The total number of staff permanently employed by UK CPS firms in the UK, excluding sub-
contractors is estimated at approximately 270,000.
Figure 7.1: Profile of professional employment by CPS discipline (%)
Architects
7% Architectural technologists
4%
Building services engineers
9%
Civil engineers
17%
Other engineers
12%
Technicians
7%
Building surveyors
2%
Quantity surveyors
7%
Scientists
2%
Business managers
6%
Contract & project managers
6%
Administrators
12%
Legal/business professionals
1%
Other construction
professionals
6%
Tow n planning professionals
2%
CIC-ConstructionSkills
22 Survey of UK Construction Professionals 2005/2006 - RePoRt

Survey of UK Construction Professionals 2005/06 - REPORT
Davis Langdon Management Consulting July 2007
23
Figure 7.1 above indicates the professional staff profile of CPS firms in the UK. Engineering
staff dominate CPS employment in the UK and account for 38% of professional
employment. Civil engineers exhibit the largest proportion (17%) which represents
approximately 45,000 fully qualified professional members of staff. Other engineers (i.e.
structural) are the next largest category representing almost 30,000 members of staff.
7.3 Breakdown by type and size of business
7.3.1 Male and female employment
We estimate that of the total number of UK staff employed by CPS firms in the 2005/06
survey 77% are male. The dominance of males within each profession means that the
proportion of male/female employment is relatively constant within each of the professions.
The data show an exceptionally high proportion of male employment generally, which in
most types of firm and discipline is not dissimilar to the rest of the construction sector.
Employment in contracting is currently approximately 90% male (according to the most
recent Labour Force Survey estimates) and within the construction operative trades male
employment is currently above 95%.
7.3.2 Profile of employment by type and size of firm
The profile of total employment, by firm’s main activity, is estimated to be in the proportions
indicated in Figure 7.2.
Figure 7.2: Profile of employment by CPS firms main activity (%)
Architecture
14%
Engineering
17%
Surveying
16%
Multi-disciplinary
41%
Management
5%
Planning
3%
FM & other
4%
CIC-ConstructionSkills
Survey of UK Construction Professionals 2005/2006 - RePoRt 23

Survey of UK Construction Professionals 2005/06 - REPORT
Davis Langdon Management Consulting July 2007
24
Figure 7.2 indicates that multi-disciplinary firms employ the highest proportion of
professional staff as would be expected given their share of total output. 80% of all
professional employment is in the largest firms, which earn more than £10 million per
annum.
7.4 Per capita fee income
Overall, we estimate that the average per-capita fee income of the CPS industry in 2005/06 is
in the region of £51,500. However, as would be expected this measure varies with the size
and type of firm. Data in Figure 7.3 indicates that the mean per capita fee income in the
smallest firms (fee income less than £200,000 pa), is some £65,411. Generally fee income
per capita increases with the size of firm measured in terms of fee income.
The overall profile of per capita fee income per professional is at its highest in engineering
and multi-disciplinary practices. There is a level of consistency in the per capita fee income
profile of these main types of firm, with the exception of architects and surveying practices,
who appear to earn significantly less than the other disciplines, per member of staff, in the
larger firms and practices.
Figure 7.3: CPS Per-capita fee income by type and size of firm (£)
0
200000
400000
600000
800000
1000000
1200000
1400000
Small Medium Large Largest
Pe
rc
ap
ita
fee
inc
om
e-
pe
rma
ne
nt
sta
ff(£
)
Architecture
Engineering
Surveying
Multi-disciplinary
CIC-ConstructionSkills
24 Survey of UK Construction Professionals 2005/2006 - RePoRt
Survey of UK Construction Professionals 2005/06 - REPORT
Davis Langdon Management Consulting July 2007
25
8 Headline changes since 2002
8.1 Headline findings
Fee income, growth and performance
CPS fee income has risen by 4% in real terms since 2001/02
Rate of income growth is below that of contractors output for the same period
Growth in the professional services has been consistent since 2002
Services provided
There has been very little change in the overall proportion of services provided by the
CPS sector
The proportion of work undertaken by multi-disciplinary firms has increased and now
accounts for almost one half of total CPS output
The overall profile of output by broad size of firm has changed little but there has been a
substantial rise in the amount of output generated by the largest firms
Type of work
Fee income on new work has increased by 3%, whilst fee income earned on RMI work
has decreased by the same amount as a proportion of all work
Residential projects have seen the largest rise and now account for 42% of all fee income
Offices have seen substantial growth in non-residential building projects
Roads have seen substantial growth in infrastructure projects
Employment
Per capita fee income has decreased by approximately 13% in real terms since the last
survey
The proportion of male to female staff has not improved significantly since the
2001/02 survey, although the results indicate a consistent increase in the numbers of
female staff in the CPS sector
8.2 Fee income
8.2.1 Headline changes
We estimate that output of the construction professional sector has risen by approximately
4% in real terms since 2001/02, from £13.4 billion to £13.9 billion.
Our estimates of fee income are based on a total population of 27,950 CPS firms, compared
to our estimate of approximately 23,500 firms in the 2001/02 survey (refer to notes on
population size below). At the time of the last survey we estimated CPS output to be 18% of
UK contractors output. This proportion has remained constant at 18% in 2005/06. The level
of growth in fee income (+4%) is below growth in contractors output, as reported in the
DTI’s Construction Statistics Annual (2007). This has increased by approximately 13% in
the same period.
However, it is consistent with the overall growth in output from firms that are in the same
peer group and whose output is measured by the ONS (Office of National Statistics) as part
CIC-ConstructionSkills
Survey of UK Construction Professionals 2005/2006 - RePoRt 25

Survey of UK Construction Professionals 2005/06 - REPORT
Davis Langdon Management Consulting July 2007
26
of the Real Estate and Associated Business Services sector - Section K of the Annual
Business Inquiry (ABI).
8.2.2 Key factors in the interpretation of results
Estimates of the change in absolute levels of fee income in the CPS sector are inherently
difficult to make and caution should be taken when interpreting the results. For example,
such estimates are not as reliable as measuring the relative changes between specific
variables in the surveys, such as breakdowns of service provision or employment.
However, we are confident that the overall magnitude of the increase is correct and that it
represents some improvement in the growth of fee income since the time of the last survey.
Difficulties in making such comparisons arise because of:
the lack of reliable and longitudinal data on the performance of the CPS sector in the
intervening period
the different populations that have been used as a basis for the surveys
difficulties in finding and applying an appropriate measure of fee income inflation.
In addressing these three fundamental issues we have firstly used the ‘All industries implied
deflator for Gross Domestic Product’ at market prices to inflate the estimates of UK fee
income of CPS firms from the 1995/96 and 2001/02 surveys to 2005 prices. There are no
definitive statistics for the actual inflation of professional fees during this period, but we
believe that the all industries implied deflator is the most reliable when compared to other
available measures such as the Tender Price Index which is not wholly relevant to
professional services.
Secondly, we estimate that at least 10% of the firms who have been surveyed in 2006 would
not have been included in the 1995/96 population or sample because of the wider and more
selective sampling processes that have been employed since that survey. An adjustment has
therefore been made to further inflate the 1995/96 estimates to account for the output of
firms that would not have been included in that survey.
Finally, we have referenced data supplied by the ONS on the output and employment of
firms within Section K of the ABI to ensure that our methodology does not produce results
that could not possibly be supported in robust observations of the wider economy.
8.3 Trends in construction and professional activity
There is no specific data on the output of the CPS sector since the time of the last survey.
However, it is useful to review the trend in outputs and employment for the wider
construction sector, as it may be assumed that trends in the development of the CPS sector
will have shared much in common with the wider construction economy.
Construction output has grown by 11% in real terms between 2001 and 2005, and by 43% in
current prices. After the recession of the early 1990s, when construction output reached it
lowest point in 1993, it rose in 1994, but fell back slightly in 1995. Thus the 1995/96 survey
took place at a point that is now considered to be the start of the last growth cycle in
construction which peaked in 2004. Indeed, 2005 saw the first decline in construction output
for a decade. Thus the 2001/02 survey took place during a period of sustained growth, while
the most recent survey has been undertaken during a period of a decline in construction
output. This trend can be seen in Figure 8.1 below.
CIC-ConstructionSkills
26 Survey of UK Construction Professionals 2005/2006 - RePoRt

Survey of UK Construction Professionals 2005/06 - REPORT
Davis Langdon Management Consulting July 2007
27
Whilst we have no data on the specific outputs of the CPS sector since the last survey it
would appear that these changes in the profile of construction output are reflected in the
results that have been presented earlier in Section 6 (and later in this section).
Figure 8.1: Construction output trends between the surveys (DTI, 2007)
Not surprisingly, the growth in construction output has led to increasing employment in the
industry, which has risen from 1.38 million in October 1996, to 1.63 million in July 2002
(+18%), to 1.81 million in December 2005, an increase of 11% between 2001 and 2005 (DTI
manpower series). Similar employment increases are evident in the CPS industry, from
approximately 180,000 in 1996 to an estimated 225,000 in 2002 (+25%) to 270,000 in 2005
(+20%).
Whilst it has not been possible to obtain specific data on the CPS sector in the intervening
year’s, data does exist on the trends associated with the wider sector of economic activity in
which CPS output is generally measured. Again this data can be found in Section K of the
ABI.
Growth in this sector of the UK economy has been consistently strong since the time of the
last survey and net output is estimated to have grown by approximately 31% (in current
prices) during the period. However, this figure is considerable lower than that recorded
between the 1996 and 2001 surveys where growth of 74% was evident. ‘Architecture,
engineering and associated technical consultancy’ (a sub set of Section K - SIC 74.2) has
seen similar growth (+30%) during the intervening years. It is assumed that the trends shown
in Figures 8.2 and 8.3 below are largely representative of those that will have taken place in
the CPS sector during the period between the three surveys.
20000
30000
40000
50000
60000
70000
80000
90000
1995 1996 1997 1998 1999 2000 2001 2002 2003 2004 2005
£m
illi
on
(co
ns
tan
t2
00
0p
ric
es
)
New orders
New work
Total output
CIC-ConstructionSkills
Survey of UK Construction Professionals 2005/2006 - RePoRt 27

Survey of UK Construction Professionals 2005/06 - REPORT
Davis Langdon Management Consulting July 2007
28
Figure 8.2 and Figure 8.3: SIC 74.2 - Trends in the value-added and no. of firms
between the surveys (ONS, 2007)
Approximate gross value added for this sector of the economy dipped in 2001, at a similar
time that construction orders for new buildings went into temporary decline. CPS firms’
income is likely to track orders (particularly for new build and major refurbishment) more
closely than construction output as this is the point in the cycle at which their inputs are
likely to be more intense. Interestingly, this was preceded by a decrease in the number of
firms within the sector in 2000.
However, it is impossible to determine how much of this growth was attributable to CPS
specific firms. Whilst the available ONS data ends at the end of 2005 we believe that the
6000
8000
10000
12000
14000
16000
18000
20000
1995 1996 1997 1998 1999 2000 2001 2002 2003 2004 2005
Gro
ss
va
lue
-ad
de
d(£
mil
lio
n)
46000
48000
50000
52000
54000
56000
58000
60000
1995 1996 1997 1998 1999 2000 2001 2002 2003 2004 2005
No
.o
ffi
rms
CIC-ConstructionSkills
28 Survey of UK Construction Professionals 2005/2006 - RePoRt

Survey of UK Construction Professionals 2005/06 - REPORT
Davis Langdon Management Consulting July 2007
29
trend in output growth and number of firms has continued to exhibit modest growth up to the
end of the current survey. We also believe that the trends shown in Figures 8.1 (particularly
for new orders), 8.2 and 8.3 have been partially mirrored in the CPS sector itself.
Looking to the future, growth in construction output during 2006 is expected to have
increased slightly over 2005, but we expect 2007 to be slightly more upbeat as some of the
work on major projects in the pipeline, such as the Olympics, begins to come on stream.
Infrastructure output fell steeply for the third year running in 2006 and the sector has shrunk
by nearly 30% since 2002 largely as a result of investment in other sectors, mainly health
and education construction. All the indications are, however, that the sector is likely to turn
around over the next few years, with growth across the sub-sectors expected. Indeed work
directly related to the Olympics is already beginning to build up.
In terms of public construction, there is evidence that public spending is being reigned in,
particularly in the health sector where significant overspend at a number of Health Trusts
may mean that capital expenditure on health facilities could be particularly vulnerable.
The residential sector continues to perform reasonably well and until supply matches demand
the sector is expected to continue growing at a healthy rate. Activity is likely to be driven by
the provision of more affordable and key worker housing. Industrial construction continues
to perform surprisingly well considering the relative weakness of the manufacturing sector.
The primary growth in recent years has been in the provision of distribution warehouses
rather than factories.
8.4 Improvements in the performance and productivity of the CPS sector
Measuring the productivity improvement of an industrial sector, or making comparison with
similar sectors in other countries is a complex issue and this survey is limited in what can be
said directly in relation to the overall productivity of the sector. The only measures that have
been collected within the survey are fee income and employment data (which have been
presented earlier in Section 7). Productivity can only be sensibly considered when quality of
outcomes, utilisation of time and other factors are also taken into account.
Whilst this survey is not therefore a suitable vehicle for making accurate statements about
productivity in the CPS sector, there are some limited indications that the sector has
witnessed some decline and change since the last survey. Some of these are contained in
Section 8.2 above, with limited growth being seen in the overall construction economy and
the professional services sector more generally. The data also suggests that there has been a
significant decline in per capita fee income between the three surveys (approximately 13% in
real terms between the 2005 and 2002 surveys and 16% in the ten years since the original
survey in 1996).
There are obviously problems of interpretation when data is only considered at three
particular points in time, as the points at which measurements are taken within the
construction cycle, or the general economic cycle, is an important consideration. This is
particularly important in construction, where the domestic market in the UK can vary
considerably from times of high demand to times when the market suffers from a widespread
lack of work.
CIC-ConstructionSkills
Survey of UK Construction Professionals 2005/2006 - RePoRt 29
Survey of UK Construction Professionals 2005/06 - REPORT
Davis Langdon Management Consulting July 2007
30
However, the data suggests that average per capita fee income in the CPS sector stood at
£51,500 in 2005/06. This compares favourably with the productivity measures available in
the ABI, where output per employee (i.e Gross value-added per person employed) in SIC
74.2 was some £50,600 in 2005.
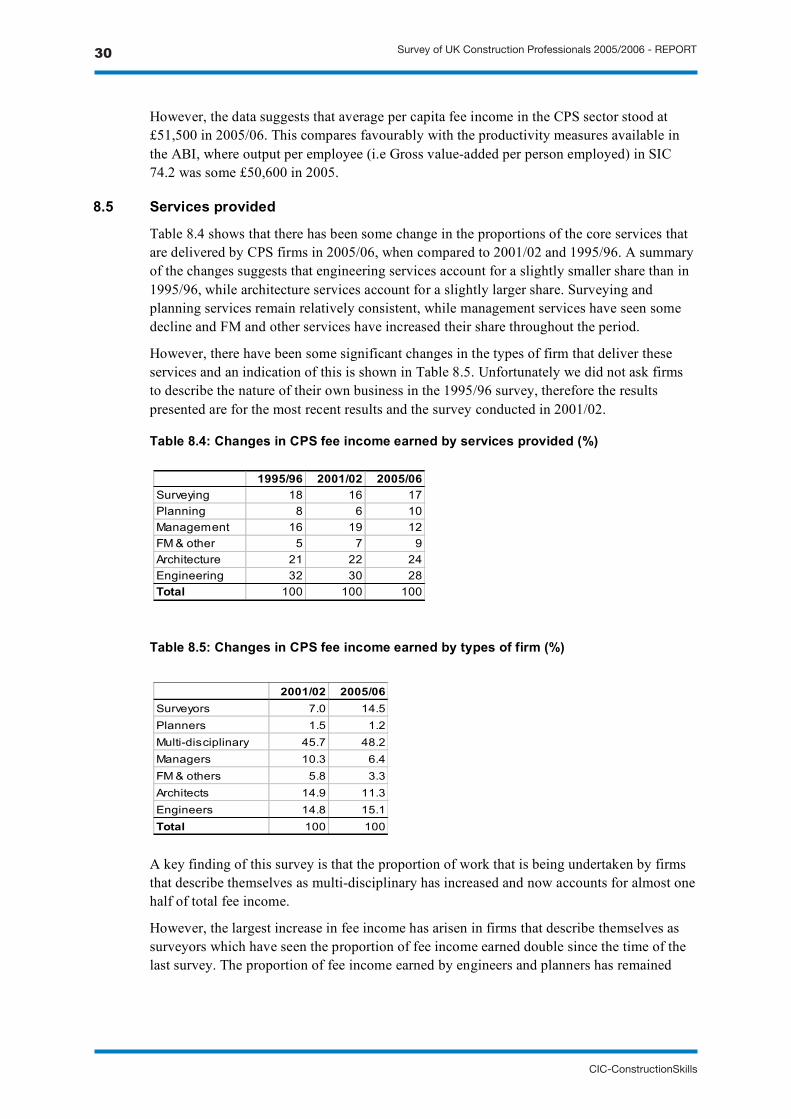
8.5 Services provided
Table 8.4 shows that there has been some change in the proportions of the core services that
are delivered by CPS firms in 2005/06, when compared to 2001/02 and 1995/96. A summary
of the changes suggests that engineering services account for a slightly smaller share than in
1995/96, while architecture services account for a slightly larger share. Surveying and
planning services remain relatively consistent, while management services have seen some
decline and FM and other services have increased their share throughout the period.
However, there have been some significant changes in the types of firm that deliver these
services and an indication of this is shown in Table 8.5. Unfortunately we did not ask firms
to describe the nature of their own business in the 1995/96 survey, therefore the results
presented are for the most recent results and the survey conducted in 2001/02.
Table 8.4: Changes in CPS fee income earned by services provided (%)
Table 8.5: Changes in CPS fee income earned by types of firm (%)
A key finding of this survey is that the proportion of work that is being undertaken by firms
that describe themselves as multi-disciplinary has increased and now accounts for almost one
half of total fee income.
However, the largest increase in fee income has arisen in firms that describe themselves as
surveyors which have seen the proportion of fee income earned double since the time of the
last survey. The proportion of fee income earned by engineers and planners has remained
1995/96 2001/02 2005/06
Surveying 18 16 17
Planning 8 6 10
Management 16 19 12
FM & other 5 7 9
Architecture 21 22 24
Engineering 32 30 28
Total 100 100 100
2001/02 2005/06
Surveyors 7.0 14.5
Planners 1.5 1.2
Multi-disciplinary 45.7 48.2
Managers 10.3 6.4
FM & others 5.8 3.3
Architects 14.9 11.3
Engineers 14.8 15.1
Total 100 100
CIC-ConstructionSkills
30 Survey of UK Construction Professionals 2005/2006 - RePoRt
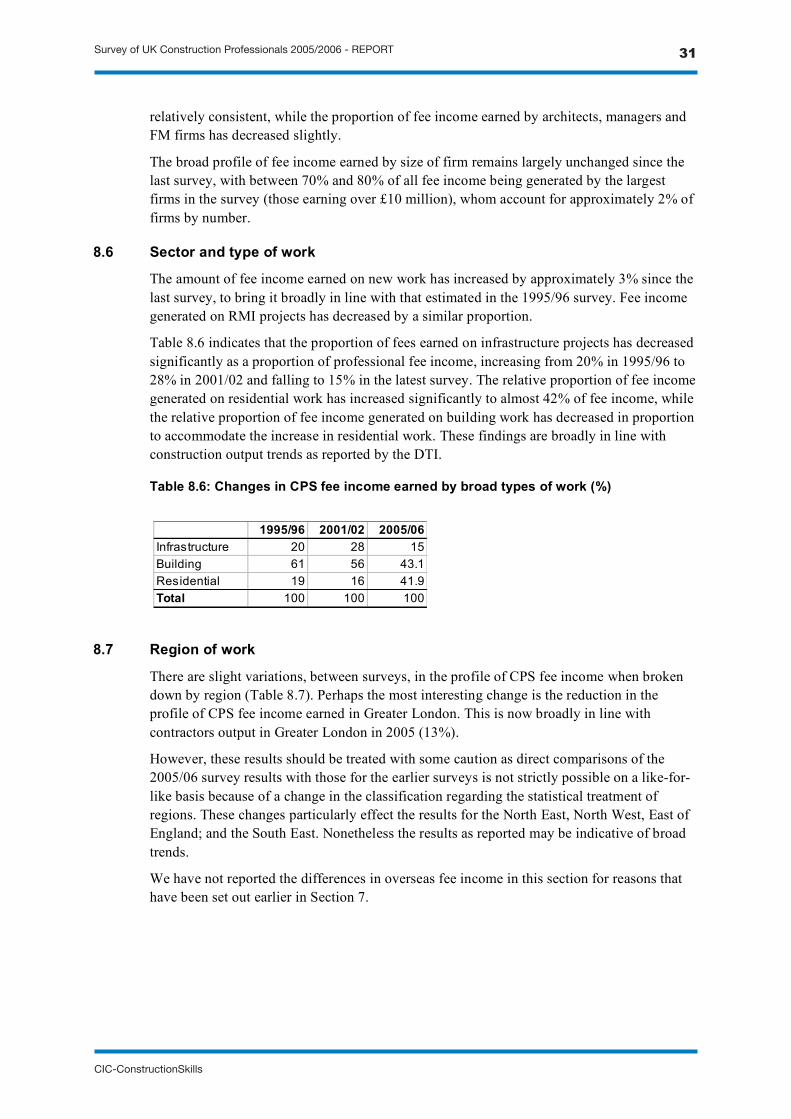
Survey of UK Construction Professionals 2005/06 - REPORT
Davis Langdon Management Consulting July 2007
31
relatively consistent, while the proportion of fee income earned by architects, managers and
FM firms has decreased slightly.
The broad profile of fee income earned by size of firm remains largely unchanged since the
last survey, with between 70% and 80% of all fee income being generated by the largest
firms in the survey (those earning over £10 million), whom account for approximately 2% of
firms by number.
8.6 Sector and type of work
The amount of fee income earned on new work has increased by approximately 3% since the
last survey, to bring it broadly in line with that estimated in the 1995/96 survey. Fee income
generated on RMI projects has decreased by a similar proportion.
Table 8.6 indicates that the proportion of fees earned on infrastructure projects has decreased
significantly as a proportion of professional fee income, increasing from 20% in 1995/96 to
28% in 2001/02 and falling to 15% in the latest survey. The relative proportion of fee income
generated on residential work has increased significantly to almost 42% of fee income, while
the relative proportion of fee income generated on building work has decreased in proportion
to accommodate the increase in residential work. These findings are broadly in line with
construction output trends as reported by the DTI.
Table 8.6: Changes in CPS fee income earned by broad types of work (%)
8.7 Region of work
There are slight variations, between surveys, in the profile of CPS fee income when broken
down by region (Table 8.7). Perhaps the most interesting change is the reduction in the
profile of CPS fee income earned in Greater London. This is now broadly in line with
contractors output in Greater London in 2005 (13%).
However, these results should be treated with some caution as direct comparisons of the
2005/06 survey results with those for the earlier surveys is not strictly possible on a like-for-
like basis because of a change in the classification regarding the statistical treatment of
regions. These changes particularly effect the results for the North East, North West, East of
England; and the South East. Nonetheless the results as reported may be indicative of broad
trends.
We have not reported the differences in overseas fee income in this section for reasons that
have been set out earlier in Section 7.
1995/96 2001/02 2005/06
Infrastructure 20 28 15
Building 61 56 43.1
Residential 19 16 41.9
Total 100 100 100
CIC-ConstructionSkills
Survey of UK Construction Professionals 2005/2006 - RePoRt 31
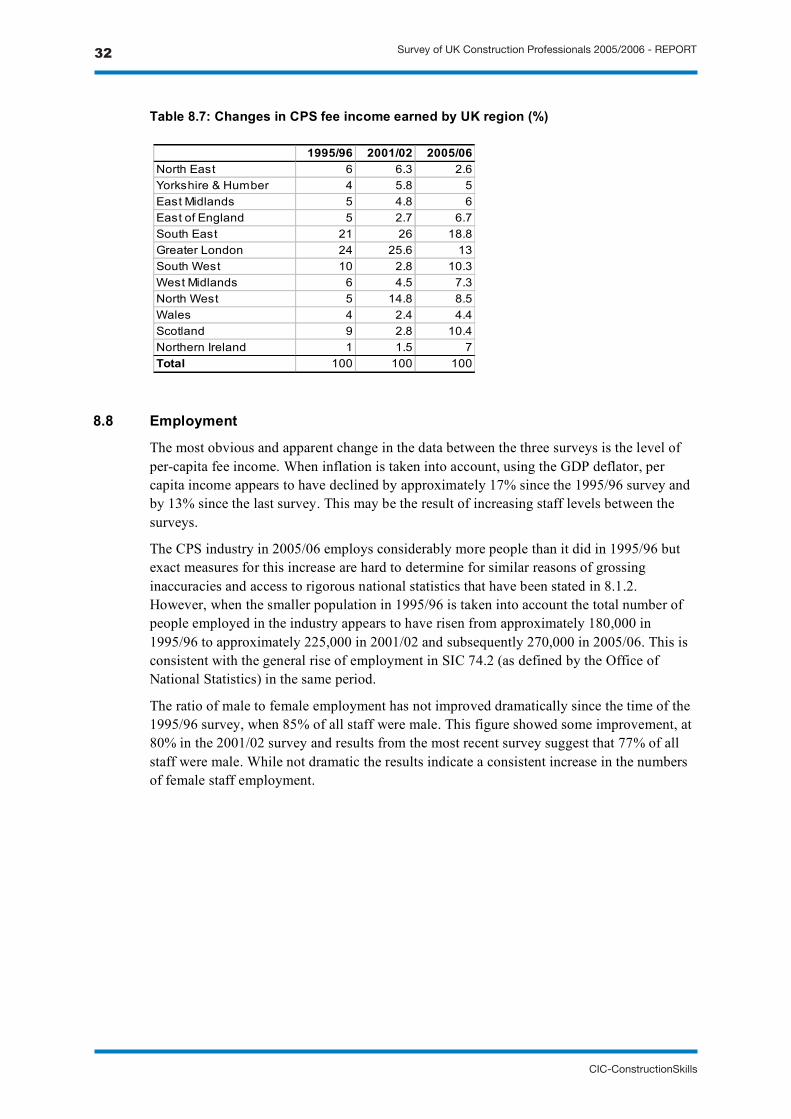
Survey of UK Construction Professionals 2005/06 - REPORT
Davis Langdon Management Consulting July 2007
32
Table 8.7: Changes in CPS fee income earned by UK region (%)
8.8 Employment
The most obvious and apparent change in the data between the three surveys is the level of
per-capita fee income. When inflation is taken into account, using the GDP deflator, per
capita income appears to have declined by approximately 17% since the 1995/96 survey and
by 13% since the last survey. This may be the result of increasing staff levels between the
surveys.
The CPS industry in 2005/06 employs considerably more people than it did in 1995/96 but
exact measures for this increase are hard to determine for similar reasons of grossing
inaccuracies and access to rigorous national statistics that have been stated in 8.1.2.
However, when the smaller population in 1995/96 is taken into account the total number of
people employed in the industry appears to have risen from approximately 180,000 in
1995/96 to approximately 225,000 in 2001/02 and subsequently 270,000 in 2005/06. This is
consistent with the general rise of employment in SIC 74.2 (as defined by the Office of
National Statistics) in the same period.
The ratio of male to female employment has not improved dramatically since the time of the
1995/96 survey, when 85% of all staff were male. This figure showed some improvement, at
80% in the 2001/02 survey and results from the most recent survey suggest that 77% of all
staff were male. While not dramatic the results indicate a consistent increase in the numbers
of female staff employment.
1995/96 2001/02 2005/06
North East 6 6.3 2.6
Yorkshire & Humber 4 5.8 5
East Midlands 5 4.8 6
East of England 5 2.7 6.7
South East 21 26 18.8
Greater London 24 25.6 13
South West 10 2.8 10.3
West Midlands 6 4.5 7.3
North West 5 14.8 8.5
Wales 4 2.4 4.4
Scotland 9 2.8 10.4
Northern Ireland 1 1.5 7
Total 100 100 100
CIC-ConstructionSkills
32 Survey of UK Construction Professionals 2005/2006 - RePoRt


For more information contact:
Mark Way,Director of Skills,
CIC,26 Store Street,
LondonWC1E 7BT
e: [email protected]: 020 7399 7400
PROFESSIONAL SURVEY 23/11/07 16:21 Page 2