surfing alone? the internet and social capital: …ftp.iza.org/dp5747.pdf · the internet and...
TRANSCRIPT
DI
SC
US
SI
ON
P
AP
ER
S
ER
IE
S
Forschungsinstitut zur Zukunft der ArbeitInstitute for the Study of Labor
Surfi ng Alone? The Internet and Social Capital:Evidence from an Unforeseeable Technological Mistake
IZA DP No. 5747
May 2011
Stefan BauernschusterOliver FalckLudger Woessmann

Surfing Alone? The Internet and Social Capital: Evidence from an
Unforeseeable Technological Mistake
Stefan Bauernschuster Ifo Institute, University of Munich and CESifo
Oliver Falck
Ifo Institute, University of Munich and CESifo
Ludger Woessmann University of Munich, Ifo Institute, CESifo and IZA
Discussion Paper No. 5747 May 2011
IZA
P.O. Box 7240 53072 Bonn
Germany
Phone: +49-228-3894-0 Fax: +49-228-3894-180
E-mail: [email protected]
Any opinions expressed here are those of the author(s) and not those of IZA. Research published in this series may include views on policy, but the institute itself takes no institutional policy positions. The Institute for the Study of Labor (IZA) in Bonn is a local and virtual international research center and a place of communication between science, politics and business. IZA is an independent nonprofit organization supported by Deutsche Post Foundation. The center is associated with the University of Bonn and offers a stimulating research environment through its international network, workshops and conferences, data service, project support, research visits and doctoral program. IZA engages in (i) original and internationally competitive research in all fields of labor economics, (ii) development of policy concepts, and (iii) dissemination of research results and concepts to the interested public. IZA Discussion Papers often represent preliminary work and are circulated to encourage discussion. Citation of such a paper should account for its provisional character. A revised version may be available directly from the author.

IZA Discussion Paper No. 5747 May 2011
ABSTRACT
Surfing Alone? The Internet and Social Capital: Evidence from an Unforeseeable Technological Mistake*
Does the Internet undermine social capital or facilitate inter-personal and civic engagement in the real world? Merging unique telecommunication data with geo-coded German individual-level data, we investigate how broadband Internet affects several dimensions of social capital. One identification strategy uses panel information to estimate value-added models. A second exploits a quasi-experiment in East Germany created by a mistaken technology choice of the state-owned telecommunication provider in the 1990s that still hinders broadband Internet access for many households. We find no evidence that the Internet reduces social capital. For some measures including children’s social activities, we even find significant positive effects. JEL Classification: Z13, J24 Keywords: Internet, social capital Corresponding author: Ludger Woessmann ifo Institute for Economic Research at the University of Munich Poschingerstr. 5 81679 Munich Germany E-mail: [email protected]
* Comments by Sascha Becker, Rob Fairlie, Bob Hart, Ofer Malamud, Jonathan Robinson, Jens Suedekum, and seminar participants at UC Santa Cruz, U Stirling, DIW Berlin, U Munich, U Duisburg-Essen, and U Passau are gratefully acknowledged. Falck is indebted to the Economics Department, UC Santa Cruz, and in particular to Rob Fairlie, for their hospitality during the research visit that allowed work on this research. We would also like to thank the DIW for the GSOEP data access and in particular Jan Goebel for his permanent support. The research underlying this paper has been partially supported by Deutsche Telekom AG. The views expressed are those of the authors and do not necessarily reflect the views of Deutsche Telekom AG.

1
1. Introduction
In his seminal book, “Bowling Alone,” Robert Putnam (2000) laments the decline of
social capital in modern times that threatens to undermine our societies. Part of the blame for
this has been placed on the advent of new technologies for information, communication, and
entertainment that keep people from civic engagement and from connecting to their
communities. The prime example is the television; Olken (2009) confirms empirically that
TV consumption crowds out social participation in the context of a developing country. Less
obvious is the effect of Internet access on social capital. On the one hand, the Internet
obviously absorbs a lot of people’s time, which may come at the detriment of social
engagement and substitute real-world interaction with solitary entertainment in the virtual
world. On the other hand, the Internet may help people to connect in the virtual world. It may
in fact also facilitate social interaction in the real world by providing easy access to relevant
information and reducing transaction costs to meet other people in such places as theaters,
concerts, and bars. As Putnam (2000) put it, “The Internet may be part of the solution to our
civic problem, or it may exacerbate it” (p. 170). There is anecdotal evidence that both aspects
are at play – nerds disconnecting from their community by spending their life with online
games, but also websites to inform oneself about what is going on in town, to learn about
possibilities for volunteer engagement, and eventually for dating. However, little is known
about which is the dominating force, a question crucial for assessing the societal
repercussions of the mass medium of the twenty-first century.
This paper estimates the effect of broadband Internet access on social capital. The rich
individual-level data of the German Socio-Economic Panel (GSOEP) provides information on
a battery of proxies for several dimensions of social capital in real-world situations that
measure social participation by a wide range of activities. The indicators cover the frequency
of going to theaters, exhibitions, concerts, restaurants, and bars; the frequency of visiting
friends and the number of friends; and the prevalence of volunteer work in associations and
social services and of political engagement and interest. The GSOEP also provides
information on broadband Internet access in the household. However, empirical identification
is plagued by the obvious possibility that having high-speed Internet access at home may be
endogenous to a person’s social capital. Outgoing people may be more likely to make use of
the information opportunities provided by the Internet, giving rise to a positive bias in
standard estimates of the effect of the Internet on social capital. But the Internet may also
2
attract intrinsically seclusive people and social nerds, giving rise to a negative bias. The
direction of the possible endogeneity bias is thus not clear a priori.
We propose two identification strategies to address such endogeneity concerns. The first
identification strategy exploits the panel structure of our database. In value-added models, we
control for individuals’ values of social capital before the emergence of broadband Internet (in
2001) when estimating the effect of high-speed Internet access in the household (in 2008) on
social capital.
The second identification strategy exploits a quasi-experimental setting in East Germany
where an unforeseeable technological mistake in the 1990s cut many people off from
broadband Internet access for years. After reunification, telephone access lines, in particular
of acceptable quality, were missing in many East German regions. Deutsche Bundespost – the
former state-owned monopoly provider of postal and voice-telephony services in Germany –
decided to provide telephony services by rolling out the so-called OPAL (optical access line)
technology in 213 telephone access areas serving 11 percent of East German households. In
the 1990s, OPAL was the leading high-end technology for voice-telephony and low-speed
digital services. However, when the Internet became a mass phenomenon in the early 2000s,
DSL (digital subscriber line) became the leading standard for high-speed broadband access.
This turned OPAL into an outdated technology, because – in contrast to classical copper wires
– OPAL is not compatible with the DSL standard. Huge investments are necessary to provide
high-speed Internet in OPAL areas, which has not occurred in many of the areas until today.
The fact that choosing the OPAL technology for the telecommunication network turned out to
be a severe mistake was unforeseeable at the time of decision, because broadband Internet did
not yet exist at the time. Thus, what turns out to be a mistaken technology choice gives rise to
variation in access to broadband Internet in East Germany that is exogenous to people’s social
capital and not driven by their affinity to connect to the Internet.
In order to exploit this variation, we combine the new GSOEP feature of providing exact
geographic coordinates of the surveyed households (in an on-site procedure that ensures
confidentiality)1 with unique confidential data on the historical roll-out of the OPAL
telecommunication technology, kindly provided to us by Deutsche Telekom, the successor for
telephony services of Deutsche Bundespost after its privatization in 1995. In our micro-
geographic data, East German households are assigned to over 1,000 small-scale telephone
access areas. This allows us to use the information whether a household is located in a
1 In fact, ours is one of the first academic research projects to make use of the new on-site facility to access
information on geo-coordinates of GSOEP households and connect them with external geographic information.

3
historical OPAL area as an instrument for broadband Internet access at home in 2008, which
in fact proves to be a strong instrument.
Our results suggest that the Internet did not undermine social capital. In virtually all
specifications and for virtually all social capital indicators, both the value-added models and
the instrumental-variable (IV) models yield positive point estimates on having broadband
Internet access at home. The precisely estimated value-added models allow rejecting
substantial negative Internet effects for all social capital indicators, whereas sizable standard
errors preclude such rejections in the IV models. Still, the IV results indicate significant
positive effects of broadband Internet access on the frequency of visiting theaters, the opera,
and exhibitions and, in the most extensive specification that includes county fixed effects, on
the frequency of visiting friends.
Exploring a relatively small sample of children aged 7 to 16 living in the sampled
households, we further find evidence that having a broadband Internet subscription at home
increases the number of children’s out-of-school social activities, such as doing sports or
ballet, taking music or painting lessons, or joining a youth club. Broadband Internet access
also does not crowd out children’s extra-curricular school activities, which include such areas
as sports, music, arts, and drama. This finding complements the empirical literature on effects
of computers and the Internet on children’s cognitive and non-cognitive skills (see Malamud
and Pop-Eleches (2011) for an overview).
Several tests of validity and robustness support a causal interpretation of our results. A
placebo test corroborates the validity of our instrument: If living in an OPAL area is a source
of exogenous variation in broadband Internet access because OPAL is incompatible with the
DSL broadband technology, it should predict households’ high-speed Internet access after the
emergence of the DSL broadband technology, but not (low-speed) Internet access before the
emergence of broadband Internet. The panel structure of our dataset allows us to confirm that
our instrument, which measures the technological situation in 1998, is indeed not associated
with low-speed Internet access in 2000, but does predict broadband Internet access in 2008.
Our results are also robust to controlling for pre-broadband-Internet economic development,
for several indicators of centrality and access to other infrastructure, and even for county fixed
effects. The identified variation in Internet access is thus unlikely to capture other features
that might distinguish OPAL areas from non-OPAL areas. Given our detailed micro-
geographic data, we can also show that results are robust to restricting the control group of
households living in non-OPAL areas to those living close enough (3.5 km) to a main
distribution frame to be sure that high-speed Internet access is in fact technologically viable.

4
The remainder of the paper is organized as follows. Section 2 places our study in the
broader literatures on Internet and social capital and provides some conceptual background on
how the Internet may affect social capital. Section 3 introduces our data on social capital and
Internet access and provides descriptive evidence on the characteristics of broadband Internet
users. Section 4 reports the association between home broadband Internet access and social
capital. Section 5 exploits the panel structure of the data to estimate value-added models.
Section 6 develops our quasi-experimental identification strategy, presents the IV results, and
discusses instrument validity and robustness. Section 7 analyzes the effect of home broadband
Internet access on social and extra-curricular activities of children. Section 8 concludes.
2. The Internet and Social Capital: Some Theory and Related Literature
An emerging literature studies the economic effects of the rise of the Internet (see, e.g.,
Varian (2010)). Aggregate cross-country evidence suggests that broadband infrastructure has
an important impact on economic growth (Czernich, Falck, Kretschmer, and Woessmann
(2011)). At a general level, the question arises how a general purpose technology like the
Internet affects people’s daily lives and decisions (see Helpman (1998)). Residential
broadband infrastructure may facilitate the emergence of new work practices (Autor (2001)),
home-based entrepreneurship (Fairlie (2006)), and job search (Krueger (2000); Autor (2001);
Stevenson (2009)). Our analysis complements these studies by investigating the effects of the
Internet on yet another economically relevant outcome, namely social capital.
A large literature addresses the economic consequences of social capital (see Sobel
(2002) and Durlauf and Fafchamps (2005) for surveys). Measures of social capital are related
to economic performance across countries (see, e.g., Temple and Johnson (1998) and the
references therein). Social capital matters for a variety of economic outcomes, in particular in
the presence of asymmetric information and incomplete contracts. To name but a few
examples that relate directly to individual networks, social capital is found to matter for job
search (Mouw (2003); Bayer, Ross, and Topa (2008)), financial development (Guiso,
Sapienza, and Zingales (2004)), entrepreneurial finance (Sanders and Nee (1996); McMillan
and Woodruff (1999)), and firm location (Michelacci and Silva (2007)). Given the
complexities of identification, work on the determinants of social capital is only starting to
emerge (see Glaeser, Laibson, and Sacerdote (2002); Durlauf and Fafchamps (2005)).
From a conceptual point of view, social capital may be both negatively and positively
affected by the Internet (for general discussions, see Putnam (2000), Chapter 9; Huysman and

5
Wulf (2004)). On the one hand, if the Internet is mostly used for passive entertainment, then –
similar to the television – it may crowd out social participation.2 Performing transactions like
shopping and banking on the Internet may deprive people from face-to-face interactions
(Franzen (2003)). The Internet may also increase the separation of communication into
separate groups with specific interests (sometimes referred to as “cyber-balkanization”, see
Van Alstyne and Brynjolfsson (1996)), so that even if it lowers individual separation, it can at
the same time increase group separation and community fragmentation (Rosenblat and
Mobius (2004)). Furthermore, communication through the Internet may miss a lot of the non-
verbal information transmitted in face-to-face communication.
On the other hand, there are also possible positive effects of the Internet on social capital.
The information function of the Internet means that it facilitates the acquisition of information
about places and times of social events, reduces transaction costs of reserving places or
buying tickets for certain events, provides information on politics and civic initiatives, and
even helps to find out about opportunities for volunteer engagement and proper matches to
individuals’ preferred social engagements. For example, many websites in Germany serve to
connect people in the local region and enable political blogging. Furthermore, the
communication function of the Internet means that it may make social interaction more
convenient and efficient (e.g., Pénard and Poussing (2010)) and help interpersonal exchange
by desynchronizing communication in time and space. This feature of interactivity
distinguishes the Internet from the television.
The empirical knowledge about how the Internet affects social capital is limited so far
(see Pénard and Poussing (2010) for a recent review of descriptive studies on the subject).
Moreover, the evidence, while informative, is inconclusive (see, e.g., Franzen (2003)) and
usually fails to identify correlation from causation (see below).
3. Individual-Level Data on the Internet and Social Capital
The German Socio-Economic Panel (GSOEP) is a representative annual household
survey covering a wide range of topics pivotal for social science. In 2008, roughly 20,000
adult individuals living in more than 11,000 households participated in the interviews. The
GSOEP wave 2008 provides information on whether Internet access is available at all in a
household and, for the first time, whether this Internet access is based on a high-speed
2 This effect may be of particular interest among adolescents, not least because of the mixed evidence on
effects of the use of computers and the Internet on academic achievement (see Malamud and Pop-Eleches (2011) and the literature overview therein).

6
connection realized via DSL, the standard broadband technology in Germany. Additionally,
extensive information is available on individuals’ background characteristics such as gender,
age, marital status, number of children in the household, secondary and university education,
occupational status, migration background, ownership of a house or flat, and net household
income. Table 1 presents descriptive statistics on these variables.
In measuring social capital, we aim to capture aspects of social capital in the “real”
world. It is obvious that Internet users may have more “virtual” contacts, but our interest is in
the effect of Internet access on real-world social engagement. Since social capital is a rather
broad concept in the economic literature, we explicitly aim to take account of a wide range of
proxies that capture different dimensions of social capital in our analysis. Here, again, the
GSOEP provides extensive and valuable information. Putnam (2000) distinguishes two
general forms of real-world social engagement: People who spontaneously invest time in
informal conversation by such activities as frequenting bars and meeting friends, and people
who invest time in formal organizations by such activities as volunteer work and political
engagement (which he refers to as “schmoozers” and “machers,” pp. 93-95). Both dimensions
of social connectedness are important, and we aim to capture both of them with our set of
social capital indicators.
Thus, our first set of social capital measures captures informal dimensions of getting
connected in the real world: the frequency of “attending events like opera, classic concerts,
theater, exhibitions,” of “attending cinema, pop or jazz concerts, dance events/disco,” and of
“going out for food or a drink (café, bar, restaurant).” All three measures for social
participation draw on categorical information on how individuals spend their leisure time,
with five answer options ranging from “never,” “less than once a month,” “at least once a
month,” and “at least once a week” to “every day.” Our second set of social capital measures
captures interaction with friends, which may be viewed as combining informal and formal
elements of social connectedness: one indicator, measured in the same categorical way,
measures the frequency of “mutual visits of neighbors, friends, and acquaintances,” and
another indicator is the answer to the simple question about the number of close friends.
Finally, our third set of social capital measures captures more formal dimensions of social
engagement: two categorical variables measuring the frequency of “volunteer activity in
clubs, associations, and community services” and of “participation in political parties, in local
politics, and civic initiatives,” and a third categorical variable referring to how strongly the
person reports to be interested in politics (answer options ranging from “not interested at all,”
7
“not strongly,” and “strongly” to “very strongly”).3 Table 2 reports descriptive statistics on
the full battery of measures of social capital, where all measures are coded so that higher
values reflect higher levels of social and political engagement.
In 2008, 56 percent of all individuals in the GSOEP had broadband Internet access via
DSL at home. This number is significantly higher in West Germany (60 percent) than in East
Germany (41 percent).4 This lower broadband penetration of East Germany is partly due to
the DSL incompatibility of the OPAL technology used in some East German areas which we
exploit in our quasi-experimental evidence below.
To get a first impression of the characteristics of the group of broadband Internet users,
Table 3 presents linear probability models that regress a dichotomous variable indicating
broadband Internet access at home on the set of background characteristics.5 The descriptive
pattern reveals that women are somewhat less likely to have access to broadband Internet at
home than men. The relationship between age and home broadband Internet access has an
inverted U-shape. The probability of having broadband Internet access at home is higher for
married individuals and increases with the number of children living in the household, the
level of secondary schooling, and with university education. Unemployed, retired, and other
non-working persons, as well as blue-collar workers, are less likely to have broadband
Internet access than apprentices, white-collar workers, and entrepreneurs. Furthermore, the
likelihood of having broadband Internet access is higher for natives and for owners of a house
or flat and increases with household income.
4. The Association between the Internet and Social Capital
We start our empirical investigation whether individuals with broadband Internet access
at home participate more or less often in social activities than individuals without home
broadband Internet access with a look at the simple cross-sectional association. We regress
each of the social capital variables Si on a dummy for home broadband Internet access Ii and a
vector of covariates Xi:
iiii XIS 200820082008 (1)
3 Additional possible proxies for social capital with which we have experimented include the frequency of
meeting relatives, contacting friends and relatives abroad, active sports exercise, and attending sports events. Results (available from the authors on request) are similar to the patterns reported here.
4 Similarly, if we substitute the federal state dummies in the multivariate regression of Table 3 by an indicator for East Germany, the coefficient on the East Germany dummy is -0.148 (p-value 0.000).
5 Probit models yield very similar results.

8
Apart from the 22 individual-level covariates presented in Table 3, the control vector Xi
includes fixed effects for the 16 German federal states. As broadband Internet access is
captured at the household level, the standard errors εi are clustered at the household level
(Moulton (1986)). For comparability, we standardize all social capital measures to a mean of
zero and a standard deviation of one throughout.
Table 4 presents the results of linear regressions for each measure of social capital in the
sample of roughly 18,000 individuals. Conditional on the covariates, there is a positive
association between having broadband Internet access at home and all our social capital
measures, statistically significant for six of the eight measures. All three indicators in the first
set of social capital measures on informal connections – attending theaters, operas, and
exhibitions; cinema and concerts; and restaurants and bars – are significantly positively
associated with Internet access. In the second set of friendship-related measures, just the
number of close friends captures statistical significance in the OLS model.6 In the third set of
measures of formal social engagement, the coefficient on broadband Internet access captures
significance for volunteer work and for general interest in politics. In terms of magnitude, for
example, having broadband Internet access at home is related to a 10.1 percent of a standard
deviation higher frequency of attending theater plays, operas, and exhibitions.
Given the categorical nature of the original data of the dependent variables, rather than z-
standardizing and estimating by linear models, we can also estimate ordered logit models of
the original categorical variables. Results, reported in Table A1 in the appendix, are
qualitatively the same, with the sole exception that the positive average association of
broadband Internet access with volunteer work becomes statistically insignificant. The
marginal effects, which depict the effect magnitude category by category, suggest that
broadband Internet access reduces the probability of never going to the theater, opera, and
exhibitions, for example, by 5.4 percentage points and increases the probabilities of going less
than once a month by 3.4 percentage points and of going at least once a month by 1.9
percentage points. By contrast, the highest positive marginal effects are in the “at least once a
month” category for cinema and concerts and in the “at least once a week” category for
restaurants and bars, where the highest negative marginal effects are in the “never” and “less
than once a month” categories, respectively. In terms of interest in politics, the “not at all”
and “not strong” categories both lose in favor of the “strong” category. The fact that, across
the dependent variables, the marginal effects of Internet access tend to be strongest in the
6 The result on the continuous variable of number of friends is robust to dropping the few outliers with very
high values (see Table 2).
9
lowest two categories without comparably strong effects in the highest category suggests that
the Internet is not related to a polarization of social capital measures.
As roughly a quarter of individuals with a personal computer at home do not have
broadband Internet access, there is, in general, enough variation to test whether the overall
picture is also confirmed when additionally controlling for a personal computer at home. We
find that the associations with Internet access are in fact robust in such specifications.7
However, conditioning on having a personal computer at home may rule out indirect channels
of broadband Internet access on social capital, for example if some individuals refrain from
purchasing a personal computer because the value of its use is strongly reduced for them due
to a lack of broadband Internet access.
5. Value-Added Models with Lagged Dependent Variables
Causal interpretation of the associations reported so far, albeit conditioning on a large set
of socio-economic covariates, is obviously hindered by a range of endogeneity concerns. For
example, reverse causality might arise if politically interested individuals are more likely to
buy broadband Internet access exactly because they are politically interested and would like to
use the Internet to get better information on politics. Omitted variables are another source of
endogeneity concerns, for example when outgoing and open-minded individuals socialize
more and at the same time are more susceptive to new technological developments like
broadband Internet. Both types of selection would bias OLS estimates upwards. On the other
hand, selection may also take the form that shy, lonely, and solitary individuals subscribe to
broadband Internet access because they have less social contacts in the real world and look for
compensation in the virtual world. Such selection would bias OLS estimates downwards.
Thus, the degree and direction of bias in the reported associations is not clear a priori.
A first way to address the selection concerns is to exploit the panel structure of the
GSOEP database to control for pre-existing levels of social capital. Estimates of such value-
added models are not affected by time-invariant unobserved individual traits that relate both
to having broadband Internet access at home and to the social capital measures. The year 2001
provides a convenient date to measure the lagged dependent variable, as most of our social
capital measures (which are not surveyed every year) were surveyed in 2001 and as
7 Detailed results are available from the authors on request.

10
broadband Internet was hardly existent in 2001.8 Constructing a sample of individuals who
responded both in 2001 and in 2008 leads to a sample reduction by about 31 percent of the
original sample (see Tables 1 and 2 for descriptive statistics of the reduced sample).
The value-added model expresses current social capital (Si2008) as a function of having
broadband Internet access in 2008 (Ii2008), the vector of controls in 2008 (Xi2008), and the
lagged social capital variable in 2001 (Si2001):9
iiiii SXIS 2001200820082008 (2)
The identifying assumption of this specification is that there are no unobserved confounding
factors that varied between 2001 and 2008 in a way that is correlated with broadband Internet
access. Under this assumption, the coefficient on the broadband Internet indicator reflects the
effect of gaining broadband Internet access on social capital. Time-invariant omitted
individual traits that affect the level of social capital in both years are accounted for in the
value-added specification. The 2001 value of social capital cannot be affected by broadband
Internet as it was hardly available then.
Table 5 shows the results of the value-added models.10 Also after conditioning on the
corresponding lagged social capital variable measured in 2001, broadband Internet access in
2008 is positively associated with all social capital variables in 2008. That is, even controlling
for time-invariant heterogeneity, there is not a single negative point estimate on broadband
Internet access. Nearly all point estimates are reduced in size, however, and they capture
statistical significance only in the three value-added models of our first set of mostly informal
social capital measures – attending theater, opera, and exhibitions; cinema and concert; and
8 The number of friends was not asked in the 2001 wave of the GSOEP but only in 2003 when broadband
Internet was already available in Germany. Estimating a value-added model with the 2003 data yields a positive yet insignificant effect of broadband Internet on the number of friends. Most of the other social capital variables were asked in 2001 in the same way as in 2008. Slight exceptions are that the question on “attending events like opera, classic concerts, theater, exhibitions” was phrased “attending cultural events, e.g., concerts, theater, lectures” in 2001 and that the question on “attending cinema, pop or jazz concerts, dance events/disco” was phrased “attending cinema, pop concerts, dance events, discos, sports events” in 2001. As the lagged social capital control for the 2008 categories of “going out for food or a drink (café, bar, restaurant)” and “mutual visits of neighbors, friends, and acquaintances,” we use the 2001 category of “sociability with friends, relatives, or neighbors.”
9 Note that in a value-added model with current and past controls where the impact of past controls is modeled to diminish with increasing time lags according to a geometric series (βλlag, where 0<λ<1), all past controls drop out and are implicitly captured by the lagged social capital variable when taking first differences (the social capital equation in 2008 minus λ times the social capital equation in 2001).
10 Results for all control variables in these and the subsequent specifications are available from the authors upon request.
11
restaurant and bar. Thus, the significant effects all relate to social events where the Internet, in
addition to its information function, might facilitate reserving and purchasing tickets.
The coefficients on the lagged social capital variables are statistically highly significant
in all models and contribute to their explanatory power. The size of the coefficients suggests
that persistence over time is particularly strong in the third set of measures of more formal
civic engagement – volunteer work, political engagement, and interest in politics. By contrast,
the predictive power of going to restaurants and bars in the past for today’s socializing in
restaurants and bars is less strong. Also in the areas of going to the cinema and concerts and
of visiting friends, individual activity seems to have changed more over time.
The value-added models address endogeneity problems arising from unobserved time-
invariant individual traits that are related both to the social capital variables and to having
broadband Internet access. However, the value-added estimates would still be biased if there
were unobserved individual traits that changed between 2001 and 2008 in a way related to
both social capital and the probability of subscribing to broadband Internet at the same time.
Therefore, in the next section, we explicitly model a source of exogenous variation in
broadband Internet access.
6. Quasi-Experimental Evidence: An Unforeseeable Technological Mistake
6.1 The OPAL Technology in East Germany
After German reunification in 1990, there was a huge lack of telephone access lines in
many parts of East Germany. Indeed, the German Democratic Republic (GDR) was often
labeled a developing country in terms of telephone infrastructure. To overcome the legacy of
the communist regime, Deutsche Bundespost (DBP)11 decided to roll out telephony
infrastructure built on the basis of a special type of fiber wires, the so-called OPAL
technology, instead of the traditionally used copper wires. In the early 1990s, this technology
was regarded the state-of-the-art technology that would dominate the ICT future. It is suited
for voice-telephony services, ISDN (integrated services digital network) services, and for a
limited amount of data transmission (Ranft (1997)). Relying on this progressive technology,
DBP expected to be prepared for the demand of the next decades. OPAL technology was
eventually rolled out in 213 East German areas covering about 11 percent of East German
households. Even the press was enthusiastic about DBP’s high-tech project and nominated
11 In the early 1990s, voice telephone services were solely provided by the state-monopolist Deutsche
Bundespost, the integrated carrier for postal and telephony services.
12
DBP’s Chief Technology Officer as the “Fiber Man of the Year.” As an example from the
German press, VDI Nachrichten wrote (6 December 1991, own translation): “Former GDR
becomes model country of fiber technology. In the former developing country of
telecommunication, DBP Telekom wants to build the most modern fiber network worldwide
and carry it all the way to the customer. […] Thereby, the new federal states will receive the
most modern telecommunication network in the world.”
But subsequently, things changed dramatically: The telecommunication markets were
liberalized across Europe; DBP was split into two privately operated firms, Deutsche Post for
postal services and Deutsche Telekom for telephone services. Most importantly, the world saw
the Internet revolution taking over. The Internet became a mass phenomenon and services on
the Internet demanded higher and higher bandwidth. Finally, to meet this demand, DSL
technologies became the leading standard of access technologies for broadband Internet. DSL
technologies are highly attractive because they rely on the copper wires of the pre-existent
voice-telephony network, which makes the supply of broadband Internet via DSL relatively
cheap.
This development was beneficial for most parts of Germany. However, it was a
misfortune for the thought-to-be-high-tech OPAL areas. Nobody could have guessed that the
appraised OPAL technology would, only a few years later, turn out to be a major
disadvantage for regional development. The reason for this is that OPAL technology is simply
not compatible with DSL technologies. Thus, by this unforeseeable technological accident,
OPAL areas were cut off from high-speed Internet. In order to still provide broadband
Internet to OPAL areas, Deutsche Telekom was confronted with two very costly alternatives:
They could either replace the OPAL wires of the access network by copper wires, which
requires expensive excavation works, or – even more expensively – install new hardware and
software at the network’s nodes. Thus, by the early 2000s, the sentiment in the German press
had changed all over, castigating DBP’s decision to roll out OPAL technology in East
Germany as a money pit; for example, the leading business weekly Wirtschaftswoche titled
(13 September 2001, own translation), “Deutsche Telekom: Burial of billions.”
This unforeseeable technological mistake provides us with exogenous variation in the
access to broadband Internet across households. We view this technologically determined
variation as randomly allocated (we come back to testing this below) and exploit it as a quasi-
experiment in an instrumental-variable (IV) approach. A nice description of why this
mistaken technological decision could happen is provided by online magazine Telepolis (12
February 2001, own translation): “Why did no one, in the conceptual design of OPAL, think

13
of the potential problems with DSL? Because the Telekom […] had anticipated in 1990 the
Internet Revolution as little as Honecker [the long-term leader of the GDR] in 1985 the fall of
the wall.” In fact, given that OPAL was the most modern technology at the time, if anything
its roll-out might have been related to favorable rather than dismal conditions; the fact that it
later turned out to be a hindrance for broadband Internet access might thus work against
finding positive effects of the Internet. However, our robustness analyses below support the
interpretation that the OPAL roll-out was statistically exogenous to the variables of interest in
our model.
Since 2003, Deutsche Telekom has invested millions of Euros to replace OPAL
technology in about half of the original OPAL areas. Nevertheless, as of August 2009, OPAL
technology was still in use in 103 areas. Because decisions to subsequently replace OPAL are
likely endogenous to the variables of interest in our model, we use the initial roll-out of
OPAL as of 1998 (by which time OPAL roll-out had been completed), rather than actual
OPAL incidence in 2008, as our instrument for access to broadband Internet at home.
In the remaining OPAL areas, East German households still have limited access to
broadband Internet because, in contrast to the United States, the availability of other access
technologies is restricted in Germany, and often more expensive than broadband Internet
access via DSL. In 2009, Germany had 25.0 million broadband subscribers. Of these, 22.4
million subscriptions were realized via DSL and only 2.6 million via other access
technologies (such as TV cable, power line, or satellite; see Bundesnetzagentur (2010)). As an
average of the East German counties in 2005, only 6.9 percent of the population could
theoretically access broadband Internet via TV cable (own calculations based on the data
underlying the Broadband Atlas (Bundesministerium für Wirtschaft und Technologie (2011)).
Moreover, in county-level regressions, we confirm that the availability of broadband Internet
via cable TV is not correlated with the number of OPAL areas in a county (whereas, in line
with the basic idea of our identification, the availability of broadband Internet via DSL is
negatively associated with the number of OPAL areas in the same county-level regressions).12
Thus, individuals in the remaining OPAL areas who want to access the Internet are only
left with the choice of dial-up type technologies such as modems and ISDN, which provide
access at very low speed only. Even in the best case of high-end ISDN access, the maximum
12 Detailed results are available from the authors on request. Broadband access through power line or
satellite has so far been virtually non-existent in Germany, and third-generation mobile technology – whose speed is still far below standard broadband access and whose private use has been barred by expensive prices over most of our observation period – was not yet available in the majority of East German communities in 2008 (Bundesministerium für Wirtschaft und Technologie (2011)).
14
available speed is 128 kbit/s, compared to a broadband DSL standard of 6 Mbit/s. That is, a
standard website of 1 MB (which is less than the entry site of standard German newspapers or
of Ticketmaster), for example, which takes 1.3 seconds to download with standard DSL,
would take more than a minute at the very least to download with the low-speed alternatives
(an underestimate of the real problem in times when most websites require computer
responses). This makes effective use of most Internet facilities today impossible.
6.2 Instrumental-Variable Model and Results
Our IV approach uses information whether a household is located in a telephone access
area a that (as of 1998) used the OPAL technology (OPALa) as an instrument for whether an
individual i (living in telephone access area a in county c) has home broadband Internet
access via DSL (Iiac) in 2008. Thus, our two-stage model can be described by the following
two equations:
iaciacciaciaciac SCXIS 20011995200820082008 (3)
iaciacciacaiac SCXOPALI 20011995200819982008 (4)
As the OPAL technology was rolled out at a large scale only in East Germany, we restrict our
sample in the IV models to East German households (without Berlin), which reduces the
sample size by more than three quarters to about 2,800 individuals.13 As our instrument
provides variation at the level of telephone access areas, standard errors in the IV models are
clustered at this level.
The identifying assumption of the IV model is that a household’s location in a telephone
access area originally covered by the OPAL technology is unrelated to social capital except
for the possible indirect effect through broadband Internet access. Possible threats to this
identification would arise if, for example, OPAL technology had been primarily used in
agglomerated, economically prosperous regions. Therefore, in addition to the vector of
individual-level covariates Xiac2008 and the lagged social capital variable Siac2001,14 in the IV
models we include two county-level controls Cc – GDP per capita and population density
(provided by the Statistical Offices of the German Federal States) – measured in 1995, at the
13 As is evident from Table A2 in the appendix, the pattern of results of the basic added-value models on
the East German sample is quite similar to the full-sample results of Table 5, albeit at lower levels of statistical precision due to the substantially smaller sample size.
14 We directly combine the IV identification with the value-added specification, as IV specifications that do not control for lagged values of the dependent variable (available on request) yield very similar results.

15
time OPAL was rolled out. Further tests of the validity of the identifying assumption are
provided below.
To implement our IV approach, we draw on two unique data features. Within a telephone
access area, all households are connected to the higher level of the telecommunication
network (the “backbone”) via the same main distribution frame (MDF) (see Figure A2 in the
appendix for a stylized picture of the structure of a broadband network). Thus, first, Deutsche
Telekom kindly provided us with their confidential data on the exact geographic extensions of
the area-code areas as well as on which MDFs had at some time used the OPAL technology,
which we geo-coded for use in our analysis. Second, we merge these data with the GSOEP
individual-level data by using exact geo-coordinates of the GSOEP households, a newly
established feature of the GSOEP (only available for in situ work). This allows us to generate
micro-regional information at the household level on whether the household is connected to
an MDF that (historically) uses the OPAL technology or not.
Figure 1 provides an impression of the small-scale geographic structure of our data. It
shows the distribution of the distance of individuals to the MDF to which their household is
connected.15 The average distance of a household to its MDF is less than 2 kilometers (1.2
miles); the median distance is as low as 1,379 meters. When splitting up the sample into
individuals living in OPAL areas and living in non-OPAL areas, the picture is very similar for
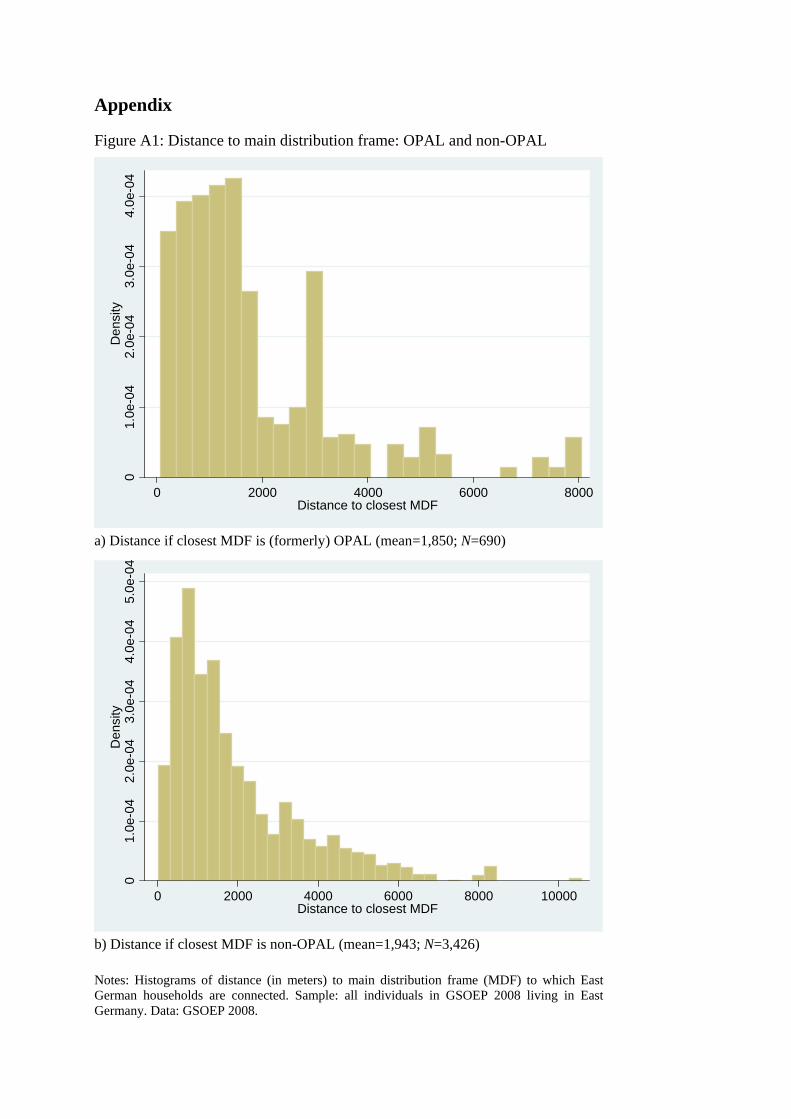
both groups (see Figure A1 in the appendix). The distance to the MDF in non-OPAL areas is
not significantly different from the respective distance in OPAL areas. In non-OPAL areas,
households located not too far from the MDF can access high-speed internet.16 By contrast, in
OPAL areas the OPAL technology hinders the supply of Internet at high-speed bandwidth as
long as the fiber wires of the access network are not replaced by copper wires.
Table 6 shows the results of our IV models for the different social capital variables. The
first stage indicates that the instrument is indeed a relevant predictor of broadband Internet
access at home.17 In OPAL areas, the likelihood of having home broadband Internet access is
15 Most area-code areas, for which we have the exact geographic extensions, have only one MDF, so that
we can exactly determine the MDF to which a GSOEP household is connected. For the limited number of larger cities that have more than one MDF within one area-code area, we match each GSOEP household to that MDF that is closest to the household within the area-code area.
16 In non-OPAL areas, the bandwidth that a household can subscribe to is a function of its distance to the MDF. A distance of less than 2 km on average suggests that households in these areas can at least subscribe to DSL at a bandwidth of 6 Mbit/s; see below for additional analysis.
17 The shown first stage relates to the model with “Theater, opera, and exhibitions” as the dependent variable. Due to slight variations in the number of missing values and to the different lagged outcome variable that is included in the models, the first-stage models differ slightly for the other outcome variables, but only in the third digit (between 0.110 and 0.115; detailed results available on request). Respective F-statistics of the instrument in the first stage of all models are reported at the bottom of Table 6.
16
11 percentage points lower than in non-OPAL areas. The F-statistic of the excluded
instrument, ranging from 16.5 to 18.1 for the different outcome variables, suggests that living
in a (historical) OPAL area is a relevant instrument for individual home broadband Internet
access in 2008. Neither GDP per capita nor population density, measured at the county level
in 1995, enter the first-stage model significantly, reducing concerns that features of the initial
OPAL roll-out interfere with our identification.
The second-stage results of the IV models are in line with the value-added models: There
is not a single negative coefficient of home broadband Internet access on the different social
capital measures. At the same time, however, the effect of home broadband Internet access is
significantly different from zero only for attending theater, opera, and exhibitions. The lack of
significance for the remaining outcome variables is due to the relatively large standard errors
of the estimated coefficients. Tests for exogeneity, based on robust regressions, provide no
sign of endogeneity for all insignificant IV coefficients of home broadband Internet access
relative to the coefficients estimated in the standard value-added models for the East German
subsample (see Table A2 in the appendix), suggesting that we might trust the more efficient
value-added models. We do not find systematic heterogeneity in the second-stage coefficients
of home broadband Internet access across different subgroups of individuals (not shown).
The significant estimate for theater, opera, and exhibitions, as well as several of the
insignificant point estimates, are substantially larger than in the OLS and value-added models.
We see three possible explanations that may all contribute to this pattern. First, among the
possible biases in the OLS estimates discussed above, the downward biases may dominate the
upward biases: People who tend to scare away from real-world social contact
disproportionately select into having broadband Internet access, presumably because it offers
them a good opportunity to avoid real-world social interactions. If choosing to subscribe to
broadband Internet reflects an increasing trend in the tendency to be intrinsically disconnected
from the community, such bias may also affect the value-added estimates reported in the
previous section. Second, the non-IV estimates may suffer from attenuation bias due to
measurement error. Apart from standard response errors, respondents may not be fully aware
of the broadband status of their Internet connection. Instrumenting by an independent source
of information about the availability of broadband access, namely the OPAL technology of
the telecommunication network, solves this attenuation bias.
Third, the causal effect of broadband Internet access on social capital may possibly differ
between the total population and the subgroup of those who change their broadband access
status because of its unavailability due to the OPAL technology. In a local average treatment

17
effect (LATE) interpretation, treatment effects may not be homogenous in the population. The
IV approach identifies the treatment effect for the subpopulation of compliers who change
their treatment status due to the variation induced by the instrument. In our case, the complier
subpopulation comprises those individuals who do not have access to broadband Internet at
home for the exogenous reason of living in a (historical) OPAL area, but would otherwise
have subscribed to broadband Internet.
The relative importance of these three explanations is hard to pin down, but it is possible
to characterize the subpopulation of compliers (see Angrist and Pischke (2009)). An analysis
of the first-stage coefficients by subpopulations suggests a relatively homogenous
characterization of compliers relative to the total population in terms of observables, with the
exceptions that persons older than 50 years and persons with the lowest educational levels are
less likely to comply with the “OPAL treatment.” In addition, there is a stronger effect of
OPAL for households with children, a fact that we will address in more detail below. From
the first stage, one can also compute the size of the complier subpopulation. The proportion of
the treated who are compliers is given by the first-stage coefficient of our instrument, times
the proportion of individuals living in OPAL areas, divided by the proportion of individuals
who do not have home broadband Internet access:
0
1,0,1001
iac
aciacaciaciacaciac
iaciaciac IP
OPALPXOPALIEXOPALIEIIIP (5)
Our first-stage result suggests that 3.0 percent of those individuals without access to
broadband Internet at home do not have broadband Internet access due to the fact that they
live in a (former) OPAL area. This suggests that there is scope for the complier subpopulation
identified by our strategy to be relatively special.
6.3 Instrument Validity and Robustness Tests
To test the validity of our instrument and the identifying assumption underlying our IV
model, we perform a number of specification tests. First, living in an OPAL access area is a
valid instrument for home broadband Internet access only if OPAL roll-out does not correlate
with pre-existing dispositions in favor of Internet access. It is possible to test this in a placebo
test: If the negative first-stage correlation of the OPAL area dummy with high-speed Internet
access is indeed due to the technological shortcomings of the OPAL technology, we should
find no effect of our instrument on Internet access in years where broadband Internet via DSL

18
was not available. In order to test this presumption, we use data on Internet access in a
household from the year 2000 wave of the GSOEP. OPAL roll-out had been terminated by
2000. At the same time, 2000 was the very first year in which broadband Internet connections
were realized in Germany, and most GSOEP interviews take place in spring. The total number
of (the then expensive) broadband subscriptions in 2000 was a mere 0.16 million (Dialog
Consult/VATM (2007)), compared to 25 million in 2009. Thus, in 2000 individuals with
home Internet access almost exclusively relied on modem or ISDN, that is, low-speed Internet
technologies. Consequently, running our first-stage regression on the 2000 data can be
interpreted as a placebo treatment test.
As is evident in Table 7, the results of the placebo first-stage regression indeed confirm
the interpretation of our instrument: The OPAL area dummy – measured in 1998 – is close to
zero, even with a positive point estimate, and far from any conventional significance levels
(p-value 0.462) in predicting Internet access in 2000. By contrast, as the second column
shows, the OPAL area dummy proves a strong negative predictor for broadband Internet
access in 2008 in the same sample18 of individuals who were surveyed in both 2000 and 2008
and who did not move from one telephone access area to another in-between, with an estimate
comparable to the estimate obtained in the full sample in Table 6.
This finding is encouraging also from another perspective. In 2000, low-speed Internet
access at home was still a high-end technological attainment. Note that one source of
endogeneity concern was that outgoing and open-minded individuals socialize more and at the
same time could be more susceptive to new technological developments and thus be early
adopters of a new technology. However, our placebo first-stage result suggests that being an
early adopter is not systematically correlated with living in an OPAL area.
A second test of identifying assumptions underlying our IV model addresses its basic
exclusion restriction. The IV approach assumes that OPAL area location is not associated
with individuals’ social capital in any other way than through the indirect channel of
broadband Internet access. This exclusion restriction would fail if OPAL areas are different
from other telephone access areas in terms of unobserved characteristics that are correlated
with social capital. Several potential threats to identification are already excluded by
controlling for GDP per capita and population density in 1995. The fact that households in
OPAL and non-OPAL areas do not differ in their average distance to the closest MDF (see
Figure A1 in the appendix) also excludes fundamental differences in geographical
18 The slight difference in the number of observations between the two columns is due to differences in
missing values in the control variables in the two years.
19
remoteness. Yet, being an OPAL area might still proxy for other infrastructure variables. For
example, some areas in East Germany that experienced particular political support after
German reunification might have received the latest telecommunication technology and,
simultaneously, benefited from other infrastructure programs. We test whether OPAL areas
benefited from other infrastructure programs using county-level infrastructure data from the
Federal Office for Building and Regional Planning (Maretzke (2005)). These measures
capture, in terms of travel time, how easily the three nearest agglomerations can be accessed
by car or train, how easily European metropolises can be accessed by car and airplane, and
how easily the county can be reached with modern transportation systems. The results in
Table 8 show that including these county-level infrastructure indicators in our IV models does
not change the basic results.
Third, in order to restrict the analysis to only small-scale geographic variation, the
specifications in Table 9 include a full set of county fixed effects. In total, the East German
sample covers 1,036 telephone access areas located in 111 counties. Here, identification
comes from within-county variation, comparing individuals living in different telephone
access areas within the same county. These areas of course differ in terms of telephone
infrastructure (OPAL vs. non-OPAL) but, due to their geographic proximity, are plausibly
similar to each other in terms of other factors such as traffic infrastructure, amenities, and the
local labor market. Again, our pattern of results is robust in this specification: There are no
significant negative effects of broadband Internet access on the social capital measures. While
there are negative point estimates for some of the social capital measures, they are all very
small and close to zero. By contrast, in addition to the significant positive effect on attending
theater, opera, and exhibitions, the positive coefficient on visiting friends also becomes
statistically significant in the demanding specification with county fixed effects.
Fourth, some households in the control group located in non-OPAL areas may in fact not
have effective access to broadband-speed Internet because with the DSL technology, the
possible bandwidth of Internet access is a declining function of the distance between the
household and its MDF. Thus, to restrict the control group of households located in non-
OPAL areas to those who technically have access to broadband Internet, in another robustness
specification we drop those individuals in the non-OPAL part of the sample who live in
households located more than 3.5 km away from the closest MDF. For these individuals, DSL
is typically only available at a bandwidth of about 1 Mbit/s. Thus, similarly to individuals
living in OPAL areas, these individuals are cut off from high-speed Internet access. Again,

20
the results in this subsample do not differ systematically from the results for the full sample
(see Table A3 in the appendix).19
Finally, the fact that at least for attending cultural events, and possibly for visiting
friends, our results indicate significant positive effects of broadband Internet suggests that the
information and communication functions of the Internet tend to dominate its entertainment
function on average. Suggestive evidence that the Internet is indeed predominantly used for
informative and communicative activities comes from a media analysis survey conducted by
Arbeitsgemeinschaft Media-Analyse in 2007. The questionnaire surveyed a number of non-
exclusive Internet usages among a sample of 18,954 Internet users in Germany. The highest
two categories, reported by 94.6 percent and 89.4 percent of respondents, respectively, were
use of the Internet for “information search” and for “e-mail.” Categories like “news,”
“services,” and “ordering of products” follow at 71.7, 54.9, and 55.3 percent, respectively. By
contrast, only 48.8 percent of respondents report to use the Internet for “entertainment
choices.” This is suggestive evidence that the information channel may indeed be a
dominating mechanism of the Internet’s impact on social capital.
7. The Internet and Social Activities of Children
A question of particular interest is how the Internet affects the social engagement of
children rather than adults. A growing literature analyzes the effects of computers and the
Internet on children’s educational achievement, usually with mixed results at best (e.g.,
Malamud and Pop-Eleches (2011); Vigdor and Ladd (2010)). In terms of effects on social
capital, the same negative entertainment function and positive information and
communication functions of the Internet hypothesized for adults above may also apply to
children and adolescents. However, many observers emphasize possible negative effects of
the Internet on the development of non-cognitive social skills among children.
The GSOEP provides information on out-of-school social activities and on extra-
curricular school activities of children living in the surveyed households. The questionnaire
on children’s activities is answered by one parent. In 2008, our geo-coded GSOEP data
include information on 338 East German children between the age of 7 and 16 (who also have
the relevant data on control variables). The mean age is 11.3 in the sample.
19 In another robustness check, we restricted the analysis to a subsample of individuals living in counties
that have at least one (former) OPAL area; qualitative results (available on request) do not change.

21
Among the six possible answer categories of social activities outside school and among
the five possible extra-curricular activities in school, parents can tick as many as applicable.
The out-of-school activities are “sports, dancing, gymnastics, ballet;” “music or singing
lessons;” “art/painting;” “youth fire department, Red Cross, or similar aid organizations;”
“youth groups, e.g. scouts/falcons;” and “regular visit of youth centers/houses.” The extra-
curricular activities are “sports,” “music,” “arts,” “theater,” and “other” group activities in
school. From the responses, we calculate simple count measures of the number of out-of-
school social activities and of the number of extra-curricular school activities. With few
exceptions, children attend a maximum of two activities each outside and inside school, with
on average 0.76 (std. dev. 0.69) and 0.74 (std. dev. 0.83) activities, respectively. Only
15 percent of children are reported to have no out-of school or extra-curricular activity at all.
We use our IV specification to estimate the effect of broadband Internet access at home
on the number of social activities of the children. Given the age of the children, we cannot
estimate a value-added model with lagged activities before the introduction of broadband
Internet as control variable. However, in addition to a child’s gender and age, the models
control for a large set of family background variables including mother’s marital status,
schooling and university education, occupational status, and migration background, as well as
the number of children living in the household, net household income, and whether the house
or flat is rented or owned. At the regional level, the models control for federal state fixed
effects as well as county-level GDP per capita and population density in 1995.
Table 10 presents the OLS and IV results for the effect of home broadband Internet
access on children. Conditional on the child, mother, and county covariates, OLS regressions
show a significant positive association of broadband Internet access at home with the number
of children’s social activities outside school and an insignificant positive association with the
number of children’s extra-curricular activities at school.
The first stage of the IV models reveals that for the households with children aged 7 to
16, the OPAL coefficient is larger than for the sample of all East German households. This
might indicate that children push parents to subscribe to broadband Internet – an argument put
forward by Fairlie (2006) – and that a broadband Internet access at home is not realized only
if it is technically not available, as is the case in OPAL areas.
The second-stage IV results show that children and teenagers in households with
broadband Internet access on average pursue one out-of-school social activity and 0.5 extra-
curricular school activities more than children in households without access to broadband
Internet, with only the former effect capturing statistical significance. The test for exogeneity

22
suggests that the positive association between broadband Internet access and out-of-school
social activities in the OLS model is even downward biased relative to the true causal effect.
Again, there is no indication of a negative effect on average of the Internet preventing
children from participating in real-world group activities. The information and
communication functions of the Internet seem to dominate the passive entertainment function:
Parents may use the Internet to gather information on clubs, sports, and youth groups suitable
for their children, and children may get better connected to their friends via Internet services
such as Facebook. In both cases, the Internet furthers children’s social real-world activities.
8. Conclusions
How does society change through the introduction of the new technologies for
information, communication, and entertainment that arrived over the past decade? Does the
advent of modern Internet media overthrow the fundamentals of society? Does a withdrawal
into a virtual world alienate humans from one another? This paper examines the effect of
broadband Internet access at home on social capital. Based on German individual-level data,
we measure social capital in terms of a wide range of measures of social participation in the
real world which cover both informal and formal dimensions of social engagement. The
measures include such informal interactions as going to theaters and operas, cinema and
concerts, bars and restaurants, direct measures of interactions with friends, and more formal
civic engagement in volunteer and political work.
We devise two identification strategies designed to address concerns of endogeneity bias
in OLS estimates. First, we make use of the panel structure of our data to control for
individual levels of social capital that existed before the emergence of broadband Internet.
Second, we merge the individual data with unique historical telecommunication data and
exact geo-coding of households and telecommunication distribution frames to exploit a quasi-
experimental setting that provides us with exogenous variation in broadband Internet
availability in East Germany: In the aftermath of reunification, the telecommunication
infrastructure in some East German areas was modernized with the OPAL fiber technology,
the most up-to-date technology at the time, which later turned out to be incompatible with the
DSL standard required for high-speed Internet access when the latter emerged.
Our pattern of results across the two identification strategies provides no indication that
the Internet has a significant negative impact on average on any of our social capital
measures. Rather, virtually all estimates in both models and for all social capital measures
23
point in the positive direction. Further, the value-added models indicate significant positive
effects on three measures of informal social interaction – visiting such places as theaters,
concerts, and bars – and the more demanding IV models with county fixed effects suggest
significant positive effects on attending theater, opera, and exhibitions as well as on visiting
friends. Also for children and adolescents, we find no evidence that broadband Internet access
crowds out social activities in or out of school, but rather indications that it may support the
creation and attendance of social group activities outside school.
Our findings are in clear contrast to the significant negative impact of TV consumption
on social capital shown by Olken (2009). It seems that on average, because of the
distinguishing feature of interactivity, the Internet is qualitatively different from the television
in that its main function is not so much one of passive entertainment. At least in some areas of
social engagement, the main function of the Internet seems rather one of active information
and communication – which the Internet provides in an individualized form at any time – that
is conducive to social interaction. Such an interpretation is in line with the fact that the
significant positive effects are found in particular for activities where reserving and
purchasing tickets might be easier via the Internet, as well as with suggestive evidence that
most people use the Internet for information search and communication, whereas much fewer
people use it for mere entertainment purposes.
Of course, our analysis does not capture all relevant aspects of social capital, and our
measures of social capital are only indirect. We observe activities where real interactions
between individuals can possibly take place, and, eventually, trust between individuals can
emerge. This caveat is shared with a vast literature on social capital. But our study does show
that broadband Internet does not necessarily crowd out other real-world activities of adults
and of children.
24
References
Anell, Patrick, Stephan Jay, and Thomas Plueckebaum. 2007. "Nachfrage nach Internetdiensten: Dienstearten, Verkehrseigenschaften und Quality of Service." wik Diskussionsbeitrag 302. Bad Honnef: wik Wissenschaftliches Institut für Infrastruktur und Kommunikationsdienste.
Angrist, Joshua D., and Jörn-Steffen Pischke. 2009. Mostly harmless econometrics: An empiricist's companion. Princeton, NJ: Princeton University Press.
Autor, David H. 2001. "Wiring the labor market." Journal of Economic Perspectives 15, no. 1: 25-40.
Bayer, Patrick, Stephen Ross, and Giorgio Topa. 2008. "Place of work and place of residence: Informal hiring networks and labor market outcomes." Journal of Political Economy 116, no. 6: 1150-1196.
Bundesministerium für Wirtschaft und Technologie. 2011. Breitbandatlas. Berlin: BMWi, www.zukunft-breitband.de.
Bundesnetzagentur. 2010. Jahresbericht 2009. Bonn: Bundesnetzagentur für Elektrizität, Gas, Telekommunikation, Post und Eisenbahn.
Czernich, Nina, Oliver Falck, Tobias Kretschmer, and Ludger Woessmann. 2011. "Broadband infrastructure and economic growth." Economic Journal 121, no. 552: 505-532.
Dialog Consult/VATM. 2007. Der deutsche Telekommunikationsmarkt: Zehn Jahre Liberalisierung im Festnetzmarkt. Köln: Verband der Anbieter von Telekommunikations- und Mehrwertdiensten (VATM).
Durlauf, Steven N., and Marcel Fafchamps. 2005. "Social capital." In Handbook of economic growth, edited by Philippe Aghion and Steven N. Durlauf. Amsterdam: North Holland: 1639-1699.
Fairlie, Robert W. 2006. "The personal computer and entrepreneurship." Management Science 52, no. 2: 187-203.
Franzen, Axel. 2003. "Social capital and the Internet: Evidence from Swiss panel data." Kyklos 56, no. 3: 341-360.
Glaeser, Edward L., David Laibson, and Bruce Sacerdote. 2002. "An economic approach to social capital." Economic Journal 112, no. 483: F437-F458.
Guiso, Luigi, Paola Sapienza, and Luigi Zingales. 2004. "The role of social capital in financial development." American Economic Review 94, no. 3: 526-556.
Helpman, Elhanan, ed. 1998. General purpose technologies and economic growth. Cambridge, MA: MIT Press.
Huysman, Marleen, and Volker Wulf, eds. 2004. Social capital and information technology. Cambridge, MA: MIT Press.
Krueger, Alan B. 2000. The Internet is lowering the cost of advertising and searching for jobs. New York Times, July 20, C2.
25
Malamud, Ofer, and Cristian Pop-Eleches. 2011. "Home computer use and the development of human capital." Quarterly Journal of Economics 126, no. 2: in press.
Maretzke, Steffen. 2005. "Aktualisierung des Infrastrukturindikators für die Neuabgrenzung der Fördergebiete der Gemeinschaftsaufgabe 'Verbesserung der regionalen Wirtschaftsstruktur'." Bonn: Bundesamt für Bauwesen und Raumordnung.
McMillan, John, and Christopher Woodruff. 1999. "Interfirm relationships and informal credit in Vietnam." Quarterly Journal of Economics 114, no. 4: 1285-1320.
Michelacci, Claudio, and Olmo Silva. 2007. "Why so many local entrepreneurs?" Review of Economics and Statistics 89, no. 4: 615-633.
Moulton, Brent R. 1986. "Random group effects and the precision of regression estimates." Journal of Econometrics 32, no. 3: 385-397.
Mouw, Ted. 2003. "Social capital and finding a job: Do contacts matter?" American Sociological Review 68, no. 6: 868-898.
Olken, Benjamin A. 2009. "Do TV and radio destroy social capital? Evidence from Indonesian villages." American Economic Journal: Applied Economics 1, no. 4: 1-33.
Pénard, Thierry, and Nicolas Poussing. 2010. "Internet use and social capital: The strength of virtual ties." Journal of Economic Issues 44, no. 3: 569-595.
Putnam, Robert. 2000. Bowling alone: The collapse and revival of American community. New York, NY: Simon and Schuster.
Ranft, Reinhard. 1997. "Optische Zugangsnetze der Deutschen Telekom." Deutsche Telekom Unterrichtsblätter 50, no. 4: 212-223.
Rosenblat, Tanya S., and Markus M. Mobius. 2004. "Getting closer or drifting apart?" Quarterly Journal of Economics 119, no. 3: 971-1009.
Sanders, Jimy M., and Victor Nee. 1996. "Immigrant self-employment: The family as social capital and the value of human capital." American Sociological Review 61, no. 2: 231-249.
Sobel, Joel. 2002. "Can we trust social capital?" Journal of Economic Literature 40, no. 1: 139-154.
Stevenson, Betsey. 2009. "The Internet and job search." In Labor market intermediation, edited by David H. Autor. Chicago, IL: University of Chicago Press.
Temple, Jonathan, and Paul A. Johnson. 1998. "Social capability and economic growth." Quarterly Journal of Economics 113, no. 3: 965-990.
Van Alstyne, Marshall, and Erik Brynjolfsson. 1996. "Could the Internet balkanize science?" Science 274, no. 5292: 1479-1480.
Varian, Hal R. 2010. "Computer mediated transactions." American Economic Review 100, no. 2: 1-10.
Vigdor, Jacob L., and Helen F. Ladd. 2010. "Scaling the digital divide: Home computer technology and student achievement." NBER Working Paper 16078. Cambridge, MA: National Bureau of Economic Research.
Appendix
Figure A1: Distance to main distribution frame: OPAL and non-OPAL 0
1.0e
-04
2.0e
-04
3.0e
-04
4.0e
-04
Den
sity
0 2000 4000 6000 8000Distance to closest MDF
a) Distance if closest MDF is (formerly) OPAL (mean=1,850; N=690)
01.
0e-0
42.
0e-0
43.
0e-0
44.
0e-0
45.
0e-0
4D
ensi
ty
0 2000 4000 6000 8000 10000Distance to closest MDF
b) Distance if closest MDF is non-OPAL (mean=1,943; N=3,426)
Notes: Histograms of distance (in meters) to main distribution frame (MDF) to which East German households are connected. Sample: all individuals in GSOEP 2008 living in East Germany. Data: GSOEP 2008.
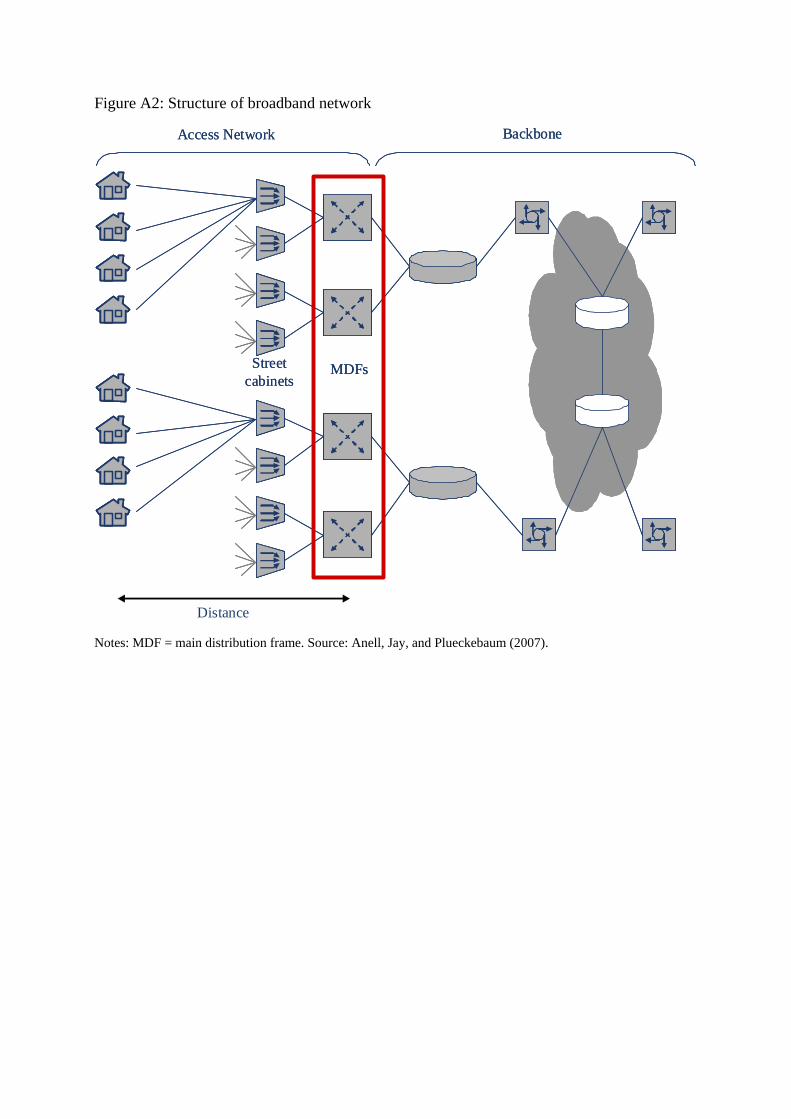
Figure A2: Structure of broadband network
Streetcabinets
MDFs
BackboneAccess Network
Streetcabinets
MDFs
BackboneAccess Network
Distance
Notes: MDF = main distribution frame. Source: Anell, Jay, and Plueckebaum (2007).

Table A1: The association between broadband Internet access and social capital: Marginal effects from ordered logit models
Theater, opera, and exhibitions
Cinema and concert
Restaurant and bar
Visit friends
Volunteer work
Political engagement
Interest in
politics
Never -0.054*** -0.050*** -0.004*** -0.001 -0.008 -0.003 Not at all -0.014*** (0.010) (0.008) (0.001) (0.001) (0.007) (0.004) (0.004) Less often than once a month 0.034*** 0.007 -0.028*** -0.007 0.003 0.002 Not strong -0.021*** (0.008) (0.008) (0.007) (0.005) (0.003) (0.003) (0.006) At least once a month 0.019*** 0.038*** -0.005 -0.006 0.002 0.001 Strong 0.027*** (0.004) (0.006) (0.004) (0.004) (0.002) (0.001) (0.007) At least once a week 0.001*** 0.006*** 0.033*** 0.012 0.003 0.000 Very strong 0.008*** (0.000) (0.001) (0.008) (0.008) (0.002) (0.000) (0.002) Every day 0.000 0.000*** 0.003*** 0.002 0.000 0.000 (0.000) (0.000) (0.001) (0.002) (0.000) (0.000) N 17,965 17,944 17,961 17,925 17,935 17,909 17,952 Wald χ² 2,849 5,052 3,077 1,554 1,040 621 4,014 Prob> χ² 0.000 0.000 0.000 0.000 0.000 0.000 0.000
Marginal effects of broadband Internet access (DSL) at home from ordered logit regressions, holding other variables constant at their mean. Dependent variable reported on top of each column. Sample: all individuals in GSOEP 2008. Additional controls included in each model: the individual’s gender, age (and its square), marital status, number of children living in the household, secondary and university education, occupational status, migration background, a dummy indicating house/flat ownership, log net household income, and sixteen federal state dummies. Robust standard errors clustered at the household level in parentheses. *** 1%, ** 5%, and * 10% level of significance. Data source: GSOEP 2008.

Table A2: Broadband Internet access and social capital: Value-added models for East German sample
Theater, opera, and exhibitions
Cinema and concert
Restaurant and bar
Visit friends
Volunteer work
Political engagement
Interest in politics
Broadband Internet access (DSL) at home 0.049 0.083** -0.018 -0.003 -0.023 0.048 0.061* (0.043) (0.041) (0.046) (0.046) (0.042) (0.043) (0.036) Social capital variable 2001 0.313*** 0.276*** 0.141*** 0.282*** 0.500*** 0.421*** 0.542*** (0.022) (0.024) (0.021) (0.021) (0.025) (0.046) (0.018) Individual-level controls Yes Yes Yes Yes Yes Yes Yes N 2,816 2,813 2,818 2,811 2,796 2,787 2,818 R² 0.262 0.385 0.174 0.156 0.290 0.212 0.428
OLS regressions. Dependent variable (z-standardized) reported on top of each column. Variables refer to 2008 unless noted otherwise. Sample: all individuals in GSOEP 2008 living in East Germany with available information on the respective social capital variable also in GSOEP 2001. Additional controls included in each model: the individual’s gender, age (and its square), marital status, number of children living in the household, secondary and university education, occupational status, migration background, a dummy indicating house/flat ownership, log net household income, and five federal state dummies. Robust standard errors clustered at the household level in parentheses. *** 1%, ** 5%, and * 10% level of significance. Data source: GSOEP 2001 and 2008.

Table A3: Broadband Internet access and social capital: IV results for subsample dropping non-OPAL households far from MDF
1st stage 2nd stage
Broadband
Internet access Theater, opera, and exhibitions
Cinema and concert
Restaurant and bar
Visit friends
Volunteer work
Political engagement
Interest in politics
OPAL access area in 1998 -0.121*** (0.028) Broadband Internet access (DSL) at home 0.746** 0.088 0.136 0.496 0.214 0.317 0.199 (0.380) (0.412) (0.455) (0.461) (0.406) (0.401) (0.339) County-level controls Yes Yes Yes Yes Yes Yes Yes Yes Individual-level controls Yes Yes Yes Yes Yes Yes Yes Yes 1st-stage F-statistic of excluded instrument 19.36 18.23 18.49 18.40 18.40 19.80 18.84 Robust exogeneity test: F-statistic 3.457 0.001 0.163 1.120 0.407 0.469 0.167
p-value 0.064 0.975 0.687 0.291 0.524 0.494 0.683 N 2,409 2,409 2,406 2,411 2,404 2,391 2,385 2,413 R² 0.243 0.180 0.396 0.175 0.117 0.287 0.190 0.436
Subsample of individuals who live in households in (former) OPAL areas or in households in non-OPAL areas whose distance to the closest main distribution frame (MDF) is not more than 3.5 kilometers. 2SLS regressions. Dependent variable reported on top of each column. The first column reports first-stage results; the other columns report second-stage results of separate 2SLS regressions. Variables refer to 2008 unless noted otherwise. Base sample: all individuals in GSOEP 2008 living in East Germany with available information on the respective social capital variable also in GSOEP 2001. Additional controls included in each model: z-standardized lagged outcome variable measured in 2001, the individual’s gender, age (and its square), marital status, number of children living in the household, secondary and university education, occupational status, migration background, a dummy indicating house/flat ownership, log net household income, population density of county in 1995, GDP per capita of county in 1995, and five federal state dummies. Robust standard errors clustered at the level of the telephone access area in parentheses. *** 1%, ** 5%, and * 10% level of significance. Data source: GSOEP 2001 and 2008.
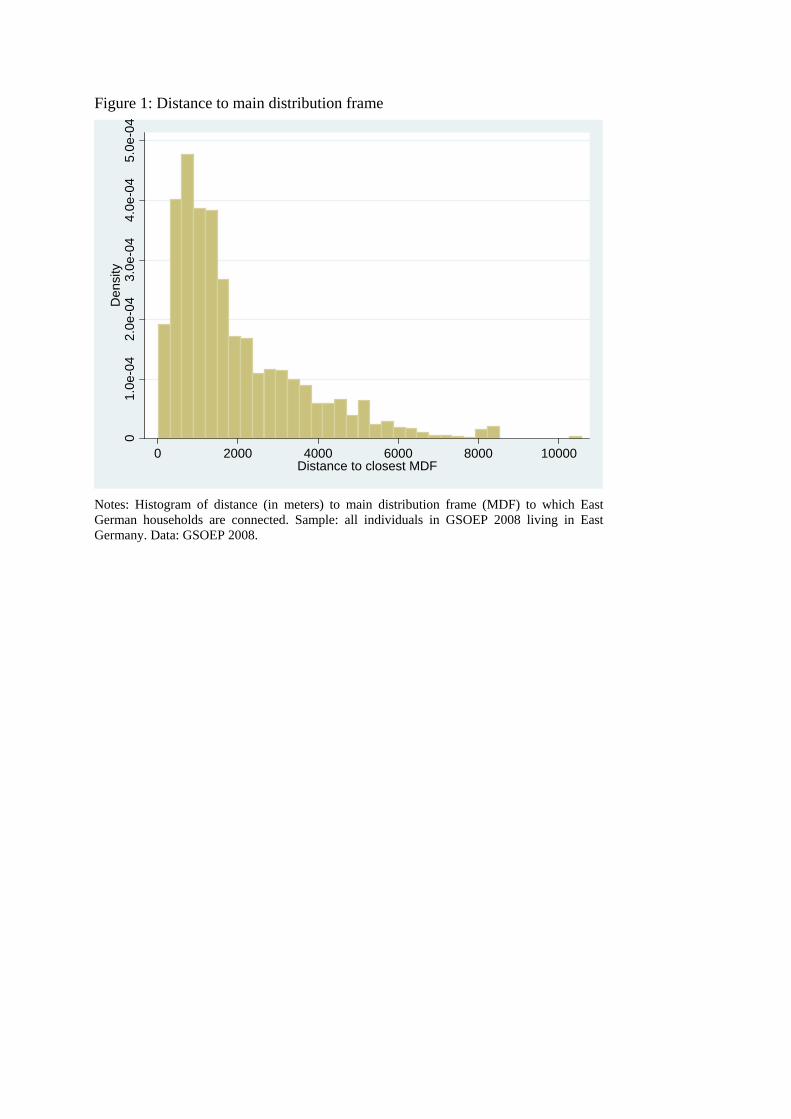
Figure 1: Distance to main distribution frame
01.
0e-0
42.
0e-0
43.
0e-0
44.
0e-0
45.
0e-0
4D
ensi
ty
0 2000 4000 6000 8000 10000Distance to closest MDF
Notes: Histogram of distance (in meters) to main distribution frame (MDF) to which East German households are connected. Sample: all individuals in GSOEP 2008 living in East Germany. Data: GSOEP 2008.
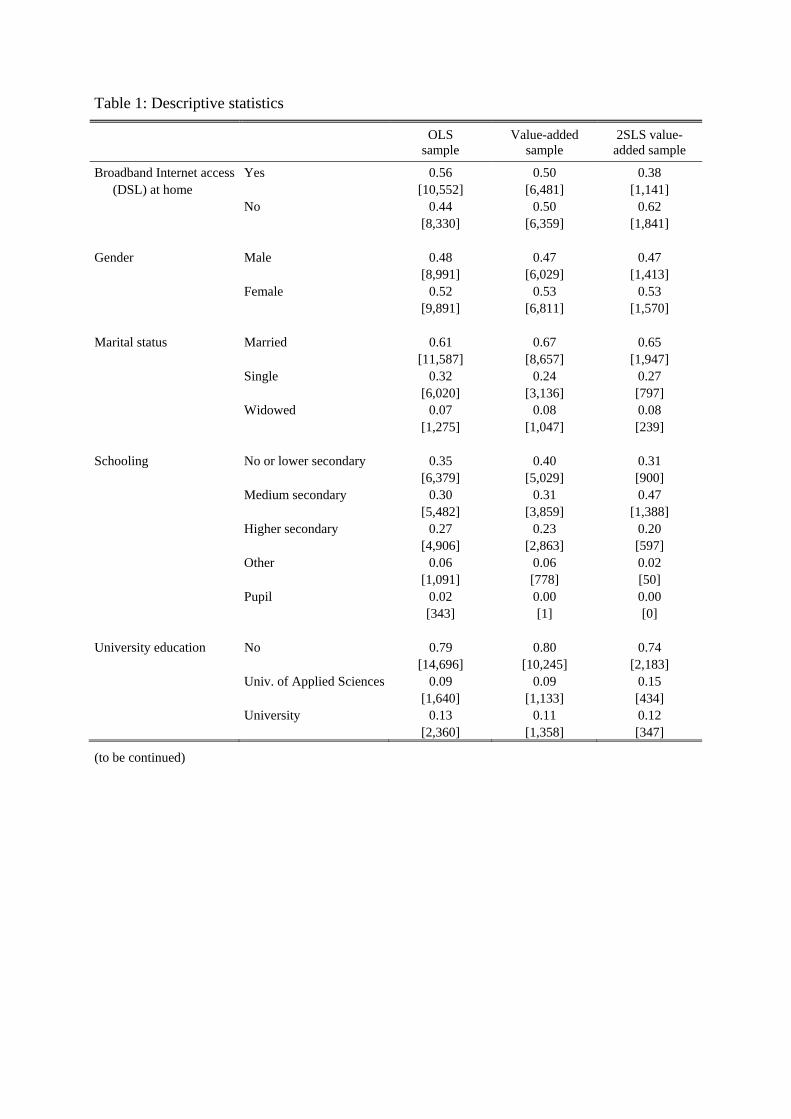
Table 1: Descriptive statistics
OLS
sample Value-added
sample 2SLS value-
added sample
Broadband Internet access Yes 0.56 0.50 0.38 (DSL) at home [10,552] [6,481] [1,141] No 0.44 0.50 0.62 [8,330] [6,359] [1,841] Gender Male 0.48 0.47 0.47 [8,991] [6,029] [1,413] Female 0.52 0.53 0.53 [9,891] [6,811] [1,570] Marital status Married 0.61 0.67 0.65 [11,587] [8,657] [1,947] Single 0.32 0.24 0.27 [6,020] [3,136] [797] Widowed 0.07 0.08 0.08 [1,275] [1,047] [239] Schooling No or lower secondary 0.35 0.40 0.31 [6,379] [5,029] [900] Medium secondary 0.30 0.31 0.47 [5,482] [3,859] [1,388] Higher secondary 0.27 0.23 0.20 [4,906] [2,863] [597] Other 0.06 0.06 0.02 [1,091] [778] [50] Pupil 0.02 0.00 0.00 [343] [1] [0] University education No 0.79 0.80 0.74 [14,696] [10,245] [2,183] Univ. of Applied Sciences 0.09 0.09 0.15 [1,640] [1,133] [434] University 0.13 0.11 0.12 [2,360] [1,358] [347]
(to be continued)

Table 1 (continued)
OLS
sample Value-added
sample 2SLS value- added sample
Occupational status Non-working 0.06 0.06 0.02 [1,187] [820] [73] Apprentice 0.07 0.02 0.02 [1,370] [206] [45] Unemployed 0.05 0.05 0.09 [951] [655] [259] Retired 0.27 0.31 0.35 [4,973] [3,956] [1,026] Blue collar worker 0.16 0.18 0.18 [2,975] [2,233] [540] White collar worker 0.33 0.33 0.28 [6,164] [4,161] [841] Entrepreneur 0.06 0.06 0.06 [1,117] [724] [177] Migration background None 0.85 0.84 0.98 [16,043] [10,843] [2,912] Direct 0.10 0.12 0.01 [1,980] [1,477] [32] Indirect 0.05 0.04 0.01 [859] [520] [39] Owner of a house/flat Yes 0.55 0.54 0.48 [10,293] [6,928] [1,443] No 0.45 0.46 0.52 [8,589] [5,912] [1,539] Age Mean 49.41 53.08 53.65 Std. dev. 17.65 15.89 15.78 N [18,882] [12,840] [2,983] Children in household Mean 0.44 0.43 0.30 Std. dev. 0.83 0.83 0.69 N [18,882] [12,840] [2,983] Net household income Mean 3,062 2,746 2,367 per month (in €) Std. dev. 2,237 1,577 1,264 N [18,882] [12,840] [2,983]
Percentage shares unless otherwise noted. Number of observations in square brackets. Samples: OLS: all individuals in GSOEP 2008; value-added: all individuals in GSOEP 2008 with available information on social capital in GSOEP 2001; 2SLS value-added: all individuals in GSOEP 2008 living in East Germany with available information on social capital in GSOEP 2001. Data source: GSOEP 2008.

Table 2: Descriptive statistics: measures of social capital
Theater, opera, and exhibitions
Cinema and concert
Restaurant and bar
Visit friends
Number of friends
Volunteer work
Political engagement
Interest in politics
OLS sample Mean 1.68 1.85 2.66 3.20 4.23 1.58 1.15 2.27 Std. dev. 0.66 0.81 0.95 0.91 3.71 1.04 0.49 0.81 Min 1 1 1 1 0 1 1 1 Max 5 5 5 5 90 5 5 4 N 18,846 18,822 18,842 18,805 18,296 18,813 18,787 18,831
Value-added sample Mean 1.63 1.72 2.55 3.11 4.03 1.56 1.14 2.25 Std. dev. 0.64 0.74 0.93 0.91 3.56 1.01 0.47 0.79 N 12,817 12,802 12,810 12,786 12,404 12,791 12,774 12,799
2SLS value-added sample Mean 1.62 1.71 2.29 2.99 4.08 1.45 1.13 2.21 Std. dev. 0.61 0.70 0.83 0.90 3.48 0.91 0.45 0.78 N 2,978 2,977 2,979 2,972 2,831 2,969 2,966 2,981
All variables coded in a way that higher values correspond to higher intensity. Samples: OLS: all individuals in GSOEP 2008; value-added: all individuals in GSOEP 2008 with available information on the respective social capital variable in GSOEP 2001; 2SLS value-added: all individuals in GSOEP 2008 living in East Germany with available information on the respective social capital variable in GSOEP 2001. “Number of friends”: count variable. “Interest in politics”: four-point scale running from 1 (“not interested at all”) to 4 (“very strong”). All other variables are categorical variables where individuals rank the frequency of the respective social activity, where 1 means “never”, 2 “less often than once a month”, 3 “at least once a month”, 4 “at least once a week”, and 5 “every day”. Data source: GSOEP 2008.

Table 3: Description of the broadband Internet users
Dependent variable: Broadband Internet access (DSL) at home
Female -0.032*** (0.007) Age 0.006*** (0.001) Age² (/100) -0.013*** (0.001)
Marital status (omitted category: married) Single -0.052*** (0.010) Widowed -0.019 (0.013)
Number of children in household 0.010** (0.004)
Schooling (omitted category: None/lower secondary) Medium secondary 0.074*** (0.009) Higher secondary 0.111*** (0.011) Other 0.009 (0.017) Pupil 0.140*** (0.026)
University education (omitted category: None) University of Applied Sciences 0.040*** (0.012) University 0.031** (0.012)
Occupational status (omitted category: non-working) Apprentice 0.039* (0.022) Unemployed -0.008 (0.021) Retired -0.065*** (0.018) Blue collar worker -0.035** (0.017) White collar worker 0.035** (0.015) Entrepreneur 0.036* (0.019)
Migration background (omitted category: none) Direct -0.045*** (0.013) Indirect -0.031* (0.016)
House/flat ownership 0.024*** (0.007) Log net household income 0.181*** (0.007) Federal state dummies (16) Yes N 17,997 R² 0.279
OLS regressions. Sample: all individuals in GSOEP 2008. Robust standard errors clustered at the household level in parentheses. *** 1%, ** 5%, and * 10% level of significance. Data source: GSOEP 2008.

Table 4: The association between broadband Internet access and social capital
Theater, opera, and exhibitions
Cinema and concert
Restaurant and bar
Visit friends
Number of friends
Volunteer work
Political engagement
Interest in politics
Broadband Internet access (DSL) at home
0.101*** (0.019) 0.106*** (0.017) 0.077*** (0.019) 0.030 (0.020) 0.037* (0.020) 0.038** (0.019) 0.024 (0.019) 0.070*** (0.017)
Female 0.174*** (0.012) 0.004 (0.011) -0.147*** (0.012) 0.070*** (0.013) -0.037*** (0.014) -0.138*** (0.014) -0.145*** (0.014) -0.383*** (0.013) Age 0.033*** (0.003) -0.042*** (0.003) -0.015*** (0.003) -0.040*** (0.004) -0.015*** (0.003) 0.015*** (0.003) 0.012*** (0.003) 0.028*** (0.003) Age2 (/100) -0.026*** (0.003) 0.019*** (0.003) 0.003 (0.003) 0.022*** (0.004) 0.013*** (0.003) -0.015*** (0.003) -0.007** (0.003) -0.014*** (0.003) Marital status
Single 0.134*** (0.021) 0.212*** (0.019) 0.232*** (0.022) 0.092*** (0.023) -0.011 (0.021) -0.053** (0.022) -0.006 (0.022) 0.068*** (0.020) Widowed -0.007 (0.035) 0.036 (0.024) 0.206*** (0.035) 0.194*** (0.039) -0.080* (0.042) 0.001 (0.032) -0.056* (0.034) 0.038 (0.033)
No. children in household -0.079*** (0.010) -0.117*** (0.010) -0.158*** (0.011) -0.013 (0.012) -0.043*** (0.012) 0.026** (0.011) -0.003 (0.011) -0.011 (0.010) Schooling
Medium secondary 0.269*** (0.020) 0.137*** (0.017) 0.072*** (0.019) 0.060*** (0.021) 0.077*** (0.021) 0.053*** (0.020) 0.055*** (0.019) 0.250*** (0.019) Higher secondary 0.427*** (0.026) 0.202*** (0.023) 0.148*** (0.024) 0.084*** (0.025) 0.119*** (0.027) 0.113*** (0.028) 0.122*** (0.029) 0.476*** (0.024) Other 0.022 (0.036) -0.038 (0.033) -0.121*** (0.039) -0.038 (0.042) 0.036 (0.044) -0.079** (0.032) 0.024 (0.034) 0.041 (0.037) Pupil 0.478*** (0.064) 0.109 (0.068) -0.115* (0.060) 0.088 (0.060) 0.244*** (0.094) 0.231*** (0.078) 0.163** (0.065) 0.379*** (0.064)
University education Univ. of Applied Sciences 0.224*** (0.028) 0.095*** (0.024) 0.103*** (0.025) 0.059** (0.026) -0.020 (0.028) 0.133*** (0.031) 0.056* (0.033) 0.182*** (0.026) University 0.429*** (0.029) 0.104*** (0.025) 0.129*** (0.026) 0.066** (0.027) 0.078*** (0.030) 0.112*** (0.032) 0.149*** (0.038) 0.338*** (0.027)
Occupational status Apprentice 0.242*** (0.048) 0.334*** (0.048) 0.013 (0.046) -0.159*** (0.047) 0.136** (0.058) 0.161*** (0.051) 0.043 (0.043) 0.168*** (0.046) Unemployed -0.100*** (0.038) -0.059 (0.038) -0.261*** (0.044) -0.140*** (0.050) -0.054 (0.045) -0.084** (0.041) -0.023 (0.037) -0.046 (0.042) Retired 0.138*** (0.037) 0.100*** (0.032) 0.152*** (0.037) 0.048 (0.040) 0.043 (0.037) -0.004 (0.039) -0.056 (0.039) 0.108*** (0.036) Blue collar worker -0.090*** (0.031) 0.109*** (0.029) -0.080** (0.033) -0.163*** (0.036) -0.015 (0.033) -0.062* (0.035) -0.044 (0.032) -0.092*** (0.032) White collar worker 0.038 (0.030) 0.239*** (0.027) 0.071** (0.030) -0.169*** (0.032) -0.018 (0.030) -0.008 (0.033) 0.018 (0.030) 0.061** (0.029) Entrepreneur 0.089** (0.039) 0.222*** (0.036) 0.191*** (0.040) -0.164*** (0.040) 0.047 (0.045) 0.044 (0.046) 0.120** (0.049) 0.110*** (0.038)
Migration background Direct -0.153*** (0.029) -0.071** (0.028) -0.140*** (0.031) 0.151*** (0.032) 0.018 (0.032) -0.242*** (0.028) -0.065** (0.028) -0.215*** (0.030) Indirect -0.008 (0.037) 0.030 (0.034) 0.010 (0.037) 0.062 (0.039) 0.054 (0.047) -0.108*** (0.038) -0.042 (0.032) -0.094*** (0.034)
House/flat ownership -0.062*** (0.018) -0.014 (0.015) 0.020 (0.018) -0.079*** (0.019) -0.094*** (0.019) -0.176*** (0.018) -0.094*** (0.017) -0.015 (0.016) Log net household income 0.262*** (0.018) 0.193*** (0.016) 0.347*** (0.018) -0.012 (0.018) 0.076*** (0.019) 0.033* (0.018) 0.056*** (0.020) 0.140*** (0.017) Federal state dummies (16) Yes Yes Yes Yes Yes Yes Yes Yes N 17,965 17,944 17,961 17,925 17,452 17,935 17,909 17,952 R² 0.207 0.364 0.210 0.103 0.027 0.060 0.038 0.222
OLS regressions. Dependent variable (z-standardized) reported on top of each column. Sample: all individuals in GSOEP 2008. Robust standard errors clustered at the household level in parentheses. *** 1%, ** 5%, and * 10% level of significance. Data source: GSOEP 2008.
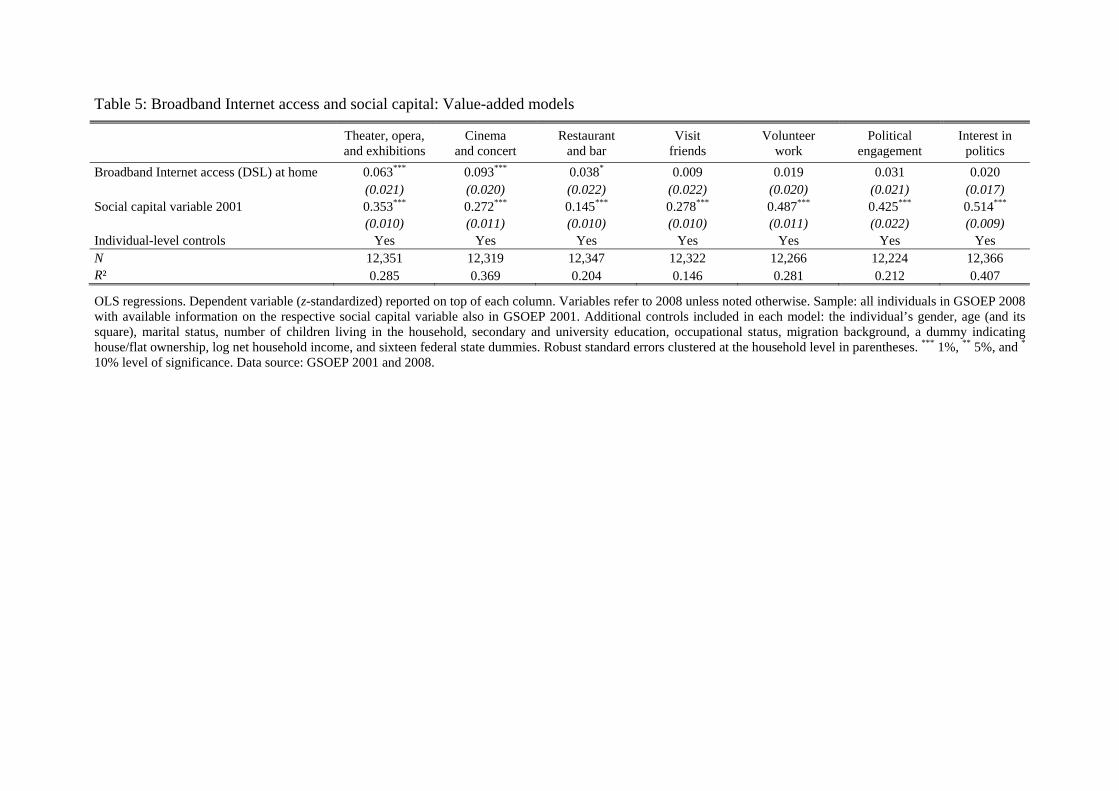
Table 5: Broadband Internet access and social capital: Value-added models
Theater, opera, and exhibitions
Cinema and concert
Restaurant and bar
Visit friends
Volunteer work
Political engagement
Interest in politics
Broadband Internet access (DSL) at home 0.063*** 0.093*** 0.038* 0.009 0.019 0.031 0.020 (0.021) (0.020) (0.022) (0.022) (0.020) (0.021) (0.017) Social capital variable 2001 0.353*** 0.272*** 0.145*** 0.278*** 0.487*** 0.425*** 0.514*** (0.010) (0.011) (0.010) (0.010) (0.011) (0.022) (0.009) Individual-level controls Yes Yes Yes Yes Yes Yes Yes N 12,351 12,319 12,347 12,322 12,266 12,224 12,366 R² 0.285 0.369 0.204 0.146 0.281 0.212 0.407
OLS regressions. Dependent variable (z-standardized) reported on top of each column. Variables refer to 2008 unless noted otherwise. Sample: all individuals in GSOEP 2008 with available information on the respective social capital variable also in GSOEP 2001. Additional controls included in each model: the individual’s gender, age (and its square), marital status, number of children living in the household, secondary and university education, occupational status, migration background, a dummy indicating house/flat ownership, log net household income, and sixteen federal state dummies. Robust standard errors clustered at the household level in parentheses. *** 1%, ** 5%, and * 10% level of significance. Data source: GSOEP 2001 and 2008.

Table 6: Broadband Internet access and social capital: Instrumental-variable results exploiting variation from a technological mistake
1st stage 2nd stage
Broadband
Internet access Theater, opera, and exhibitions
Cinema and concert
Restaurant and bar
Visit friends
Volunteer work
Political engagement
Interest in politics
OPAL access area in 1998 -0.113*** (0.027) Broadband Internet access (DSL) at home 0.786* 0.098 0.099 0.583 0.284 0.273 0.335 (0.411) (0.456) (0.483) (0.495) (0.440) (0.419) (0.369) GDP per capita 1995 0.003 0.000 0.005 0.013 0.010 -0.003 -0.004 -0.001 (0.005) (0.010) (0.007) (0.008) (0.007) (0.008) (0.006) (0.006) Population density 1995 (/100) 0.003 0.012* 0.010* 0.001 -0.005 -0.004 -0.006 0.002 (0.003) (0.007) ((0.006) (0.006) (0.007) (0.007) (0.005) (0.006) Individual-level controls Yes Yes Yes Yes Yes Yes Yes Yes 1st-stage F-statistic of excluded instrument 17.47 16.48 16.81 16.73 16.97 18.06 17.14 Robust exogeneity test: F-statistic 3.399 0.002 0.063 1.414 0.523 0.295 0.599
p-value 0.066 0.964 0.801 0.235 0.470 0.587 0.439 N 2,816 2,816 2,813 2,818 2,811 2,796 2,787 2,818 R² 0.237 0.166 0.388 0.173 0.093 0.274 0.204 0.415
2SLS regressions. Dependent variable reported on top of each column. The first column reports first-stage results; the other columns report second-stage results of separate 2SLS regressions. Variables refer to 2008 unless noted otherwise. Sample: all individuals in GSOEP 2008 living in East Germany with available information on the respective social capital variable also in GSOEP 2001. Additional controls included in each model: z-standardized lagged outcome variable measured in 2001, the individual’s gender, age (and its square), marital status, number of children living in the household, secondary and university education, occupational status, migration background, a dummy indicating house/flat ownership, log net household income, and five federal state dummies. Robust standard errors clustered at the level of the telephone access area in parentheses. *** 1%, ** 5%, and * 10% level of significance. Data source: GSOEP 2001 and 2008.

Table 7: Placebo first-stage specification: OPAL access areas and Internet access in 2000
Internet access at home in 2000 Broadband Internet access (DSL) at home in 2008
(sample of individuals also observed in 2000)
OPAL access area in 1998 0.020 -0.122*** (0.029) (0.029) County-level controls Yes Yes Individual-level controls Yes Yes N 2,470 2,496 R² 0.112 0.224
OLS regressions. Dependent variable reported on top of each column. Sample in both columns: all individuals in GSOEP 2008 living in East Germany who were also surveyed in 2000 and who did not move between telephone access areas in the meantime. Additional controls included in each model for the respective year of the dependent variable: the individual’s gender, age (and its square), marital status, number of children living in the household, secondary and university education, occupational status, migration background, a dummy indicating house/flat ownership, log net household income, population density of county in 1995, GDP per capita of county in 1995, and five federal state dummies. Robust standard errors clustered at the level of the telephone access area in parentheses. *** 1%, ** 5%, and * 10% level of significance. Data source: GSOEP 2000 and 2008.
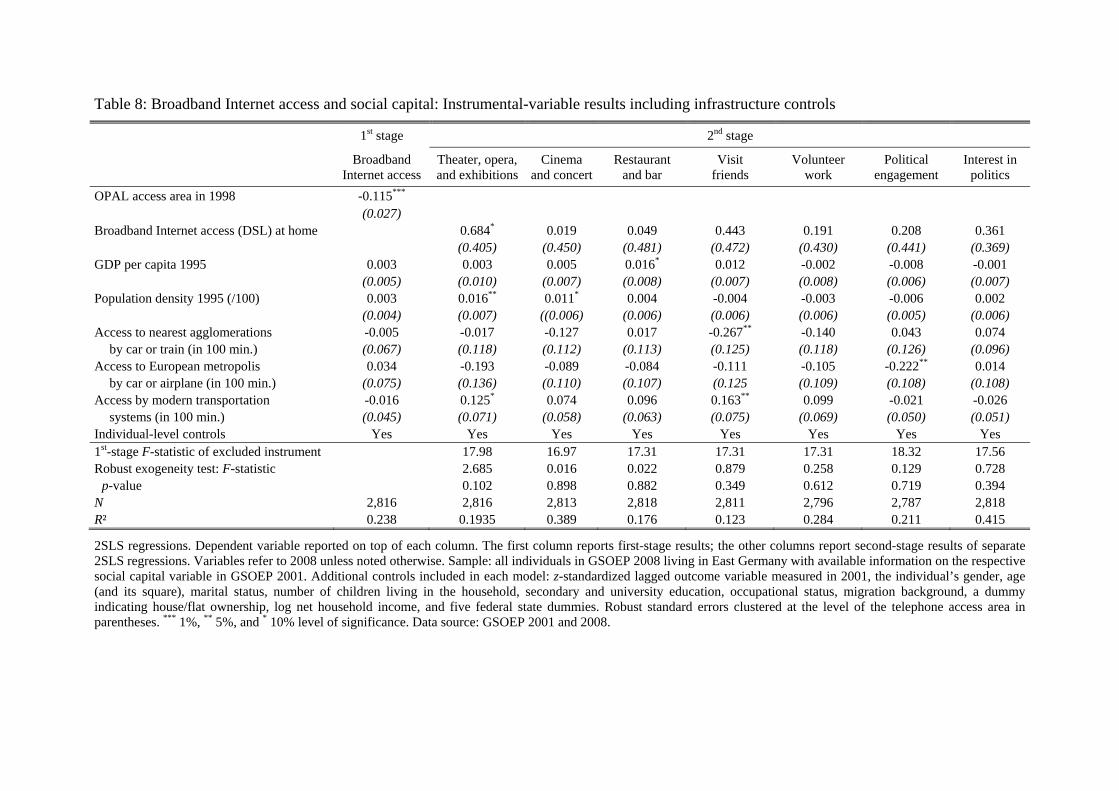
Table 8: Broadband Internet access and social capital: Instrumental-variable results including infrastructure controls
1st stage 2nd stage
Broadband
Internet access Theater, opera, and exhibitions
Cinema and concert
Restaurant and bar
Visit friends
Volunteer work
Political engagement
Interest in politics
OPAL access area in 1998 -0.115*** (0.027) Broadband Internet access (DSL) at home 0.684* 0.019 0.049 0.443 0.191 0.208 0.361 (0.405) (0.450) (0.481) (0.472) (0.430) (0.441) (0.369) GDP per capita 1995 0.003 0.003 0.005 0.016* 0.012 -0.002 -0.008 -0.001 (0.005) (0.010) (0.007) (0.008) (0.007) (0.008) (0.006) (0.007) Population density 1995 (/100) 0.003 0.016** 0.011* 0.004 -0.004 -0.003 -0.006 0.002 (0.004) (0.007) ((0.006) (0.006) (0.006) (0.006) (0.005) (0.006) Access to nearest agglomerations -0.005 -0.017 -0.127 0.017 -0.267** -0.140 0.043 0.074 by car or train (in 100 min.) (0.067) (0.118) (0.112) (0.113) (0.125) (0.118) (0.126) (0.096) Access to European metropolis 0.034 -0.193 -0.089 -0.084 -0.111 -0.105 -0.222** 0.014 by car or airplane (in 100 min.) (0.075) (0.136) (0.110) (0.107) (0.125 (0.109) (0.108) (0.108) Access by modern transportation -0.016 0.125* 0.074 0.096 0.163** 0.099 -0.021 -0.026 systems (in 100 min.) (0.045) (0.071) (0.058) (0.063) (0.075) (0.069) (0.050) (0.051) Individual-level controls Yes Yes Yes Yes Yes Yes Yes Yes 1st-stage F-statistic of excluded instrument 17.98 16.97 17.31 17.31 17.31 18.32 17.56 Robust exogeneity test: F-statistic 2.685 0.016 0.022 0.879 0.258 0.129 0.728
p-value 0.102 0.898 0.882 0.349 0.612 0.719 0.394 N 2,816 2,816 2,813 2,818 2,811 2,796 2,787 2,818 R² 0.238 0.1935 0.389 0.176 0.123 0.284 0.211 0.415
2SLS regressions. Dependent variable reported on top of each column. The first column reports first-stage results; the other columns report second-stage results of separate 2SLS regressions. Variables refer to 2008 unless noted otherwise. Sample: all individuals in GSOEP 2008 living in East Germany with available information on the respective social capital variable in GSOEP 2001. Additional controls included in each model: z-standardized lagged outcome variable measured in 2001, the individual’s gender, age (and its square), marital status, number of children living in the household, secondary and university education, occupational status, migration background, a dummy indicating house/flat ownership, log net household income, and five federal state dummies. Robust standard errors clustered at the level of the telephone access area in parentheses. *** 1%, ** 5%, and * 10% level of significance. Data source: GSOEP 2001 and 2008.

Table 9: Broadband Internet access and social capital: Instrumental-variable results including county fixed effects
1st stage 2nd stage
Broadband
Internet access Theater, opera, and exhibitions
Cinema and concert
Restaurant and bar
Visit friends
Volunteer work
Political engagement
Interest in politics
OPAL access area in 1998 -0.138*** (0.034) Broadband Internet access (DSL) at home 0.725* -0.145 -0.016 0.948** 0.133 -0.076 0.143 (0.377) (0.381) (0.414) (0.477) (0.440) (0.337) (0.401) County fixed effects (111) Yes Yes Yes Yes Yes Yes Yes Yes Individual-level controls Yes Yes Yes Yes Yes Yes Yes Yes 1st-stage F-statistic of excluded instrument 16.48 16.32 16.56 16.48 16.00 16.81 17.06 Robust exogeneity test: F-statistic 4.247 0.324 0.004 4.281 0.100 0.096 0.065
p-value 0.040 0.569 0.947 0.039 0.752 0.756 0.799 N 2,816 2,816 2,813 2,818 2,811 2,796 2,787 2,818 R² 0.302 0.226 0.412 0.221 0.057 0.319 0.252 0.449
2SLS regressions. Dependent variable reported on top of each column. The first column reports first-stage results; the other columns report second-stage results of separate 2SLS regressions. Variables refer to 2008 unless noted otherwise. Sample: all individuals in GSOEP 2008 living in East Germany with available information on the respective social capital variable also in GSOEP 2001. Additional controls included in each model: z-standardized lagged outcome variable measured in 2001, the individual’s gender, age (and its square), marital status, number of children living in the household, secondary and university education, occupational status, migration background, a dummy indicating house/flat ownership, log net household income, and county dummies. Robust standard errors clustered at the level of the telephone access area in parentheses. *** 1%, ** 5%, and * 10% level of significance. Data source: GSOEP 2001 and 2008.

Table 10: Broadband Internet access and children’s after-school activities
OLS 2SLS OLS 2SLS
1st stage 2nd stage 1st stage 2nd stage
Number of
out-of-school social activities
Broadband Internet access
Number of out-of-school
social activities
Number of extra-curricular
activities
Broadband Internet access
Number of extra-curricular
activities
OPAL access area in 1998 -0.257*** -0.257*** (0.083) (0.083) Broadband Internet access (DSL) at home 0.104** 1.037** 0.054 0.493 (0.044) (0.413) (0.048) (0.552) Child and mother controls Yes Yes Yes Yes Yes Yes County-level controls No Yes Yes No Yes Yes 1st-stage F-statistic of excluded instrument 9.61 9.61 Robust exogeneity test: F-statistic 6.938 0.207
p-value 0.009 0.650 N 2,453 338 338 2,453 338 338 R² 0.164 0.214 43,16 0.038 0.214 0.100
OLS and 2SLS regressions. Dependent variable reported on top of each column. Samples: OLS: all children aged 7-16 in GSOEP 2008; 2SLS: all children aged 7-16 in GSOEP 2008 living in East Germany. Additional controls included in each model: the child’s gender and age, mother’s marital status, number of children living in the household, mother’s secondary and university education, mother’s occupational status, mother’s migration background, a dummy indicating house/flat ownership, log net household income, population density of county in 1995, GDP per capita of county in 1995, and five federal state dummies. The IV models additionally include population density of the county in 1995 and GDP per capita of the county in 1995. Robust standard errors clustered at the level of the telephone access area in parentheses. *** 1%, ** 5%, and * 10% level of significance. Data source: GSOEP 2008.