surface characterization of plasma deposited nano-structured fluorocarbon coatings for promoting in...
TRANSCRIPT

www.elsevier.com/locate/susc
Surface Science 601 (2007) 1019–1025
Surface characterization of plasma depositednano-structured fluorocarbon coatings for promoting
in vitro cell growth
G.S. Senesi b,*, E. D’Aloia a, R. Gristina b, P. Favia a,b, R. d’Agostino a,b
a Dipartimento di Chimica, Universita di Bari, Via Orabona 4, I-70126 Bari, Italyb Istituto di Metodologie Inorganiche e dei Plasmi/CNR, c/o Dipartimento di Chimica, Via Orabona 4, I-70126 Bari, Italy
Received 28 July 2006; accepted for publication 23 November 2006Available online 14 December 2006
Abstract
Nano-structured ‘‘teflon-like’’ coatings characterized by highly-fluorinated, random, ribbon-shaped, micrometers-long structureswere deposited on polyethylenetherephtalate (PET) substrates by plasma enhanced-chemical vapour deposition (PE-CVD) using mod-ulated radiofrequency (RF, 13.56 MHz) glow discharges fed with C2F4 in modulated discharge (MD) and continuous wave (CW)regimes. Surfaces obtained in this way featured identical chemical composition and different roughness in the nanometric scale. Watercontact angle (WCA) measurements, scanning electron microscopy (SEM) and atomic force microscopy (AFM) were utilized to char-acterize the surfaces. A positive relationship was shown to exist between the WCA value and the mean nano-structure height and thearea root-mean-square (RMS) roughness of coatings. The possibility of obtaining coatings of varying nano-structure height, i.e., rough-ness, in a nanometric scale represents a promising result for further use of these surfaces as substrates for experiments on cell adhesion,proliferation and growth.� 2006 Elsevier B.V. All rights reserved.
Keywords: Nano-structured ‘‘teflon-like’’ coatings; Plasma enhanced-chemical vapour deposition; Surface morphology; Water contact angle; Atomicforce microscopy; Scanning electron microscopy
1. Introduction
In recent years numerous techniques have been em-ployed to modify the surface properties that control thefunctions and determine the success of various surface-ac-tive materials employed in many applications. Surfacemodifications aim to improve surface properties that in-clude, among many others, biocompatibility, adhesionand/or bonding, protective and/or barrier performance,and catalytic properties [1,2]. Radiofrequency (RF) plasmadeposition is, among various techniques, one of the mostpowerful and versatile tool to obtain the modification of
0039-6028/$ - see front matter � 2006 Elsevier B.V. All rights reserved.
doi:10.1016/j.susc.2006.11.046
* Corresponding author. Tel.: +39 080 5929505; fax: +39 080 5929520.E-mail address: [email protected] (G.S. Senesi).
surfaces employed in tissue engineering, medical implantsand production of pharmaceuticals.
In particular, the plasma enhanced-chemical vapourdeposition (PE-CVD) technique allows to vary continu-ously in a very broad range the morphology and chemicalcomposition of processed surfaces and, consequently, theirphysical and chemical properties, by depositing thin (10–1000 nm) organic or inorganic coatings on the surface ofsubstrates [1,3,4]. Fluorocarbon (CFx) films obtained byPE-CVD have been shown to be attractive materials forapplication in various fields. This is due to the possibilityof obtaining surfaces of tuneable wettability, adhesivityand hardness, elevated chemical inertness, and propertiesof biomedical interest [1].
Coatings with different surface properties can be ob-tained by PE-CVD in either the continuous wave (CW)

1020 G.S. Senesi et al. / Surface Science 601 (2007) 1019–1025
or modulated RF glow discharge (MD) regime. On depen-dence on the experimental parameters used, CFx films ob-tained in CW conditions are characterized by a variablefluorination degree and cross-linking character and bylow roughness [5]. In recent years PE-CVD processes havealso been conducted in MD conditions by modulating thedischarge, i.e., by pulsing the discharge on/off at definedtime intervals [5–9], thus improving the control of the pro-cess in both the plasma phase and in the deposited film[7,8].
The mechanism of plasma-discharges fed by C2F4 forthe production of nano-structured CFx coatings has beeninvestigated by Milella et al. [10]. The shape, size andheight of nano-structures were tuned by varying the dis-charge parameters such as the gas monomer, duty cycle,RF power, and deposition time. In comparison to CWplasma processes, the MD processes offer the possibilityof tuning the formation of growth precursors and, as a con-sequence, the structure, morphology and roughness ofresulting films [10,11].
The state of a cell on a surface, including its shape,structure, biological activity, etc., depends on the wholerange of signals the cell receives from its biological environ-ment [12]. For this reason, in designing new biomaterials,the specific chemical and topographical properties of thesurface are important in directing the response of the cellinteracting with it [13]. The effects of surface chemistryon cell and tissue functions have been explored extensivelyin the past few decades [14,15].
In addition to the perception of the chemistry, a cell thatcomes into contact with a biomaterial, must also sense thenearby three-dimensional topographical environment [14].Substrate topography is recognized to be an importantparameter in directly affecting the capacity of cells to orientthemselves, migrate, and produce organized cytoskeletalarrangements [16,17]. However, relatively little is knownabout its effects on cell behaviour [18]. Moreover, cellsin vivo appear to respond not only to micrometric-scale sur-face topography but also to topography at the nanometricscale. However, nano-fabrication techniques such as elec-tron beam lithography are expensive and time consuming,whereas MD processes represent a relatively simple tech-nique for producing ribbon-like, micrometers-long andhundreds-of-nanometers-high structures in a single stepprocess.
The aim of this paper was to conduct a study on themorphological characterization of CFx surfaces producedby RF (13.56 MHz) glow discharges fed with C2F4 gasesin MD and CW regimes, and featuring the same chemicalcomposition but tuneable roughness. Scanning electronmicroscopy (SEM) and atomic force microscopy (AFM)were used to evaluate the morphological features ofnano-structured samples obtained using different deposi-tion times and flow rates. The final objective of this inves-tigation was the individuation of nano-structured coatingswith the most interesting topographical properties worth tobe further investigated for cell growth applications.
2. Materials and methods
2.1. Preparation of samples
Fluorocarbon ‘‘teflon-like’’ nano-structured coatingswere plasma deposited on polyethyleneterephthalate(PET) substrates by RF (13.56 MHz)-PE-CVD in MD re-gime in a cylindrical stainless-steel reactor in the ‘‘parallelplate’’ configuration as described in detail previously[10,19]. In particular, the upper powered electrode (12-cmstainless steel disk) and the lower grounded electrode (19-cm stainless steel disk) were spaced 5-cm apart. The follow-ing MD experimental conditions were used: flow rate ofC2F4, 6 and 10 sccm; RF power, 100 W; duty cycle, 5%(16 ms time on, 304 ms time off, total period 320 ms); pres-sure, 200 mTorr; deposition time, 20 min, 50 min, and90 min. These conditions allowed to obtain ribbon-likenano-structured CFx coatings, where the ribbon structureswere found associated to the presence of teflon-like chains[10]. In particular, the deposition time used was importantin regulating the average height and density of structuresand, in turn, the roughness of final coatings.
After the MD deposition process the substrates werecoated in the CW regime for 60 sec under conditions de-scribed above, but at 100% duty cycle, in order to deposita thin conformal CW coating on the nano-structured sur-face. A homogeneous CFx chemical composition of thesurface characterized by a F/C ratio of 1.62 ± 0.02, wasmeasured by X-rays photoelectron spectroscopy (submit-ted for publication). The resulting surfaces were thereforecharacterized by various roughnesses, as determined bythe density and height of nano-structures, but the samechemical composition. In this way a different topographybut an equivalent surface chemistry was obtained.
Water contact angle (WCA, 2 ll drops, double-distilledwater) measurements were performed with a Rame-HartA-100 goniometer to probe the hydrophobic character ofthe surfaces as a function of the morphological surfaceparameters. An a-step (KLA Tencor) instrument was uti-lized to measure the thickness of the coatings.
For cell culture experiments 3T3 fibroblasts were usedwhich were obtained from stocks routinely grown in Dul-becco Modified Eagles Medium (DMEM, Sigma, IT), sup-plied with 10% fetal bovine serum and 200 mM glutamine,under 5% CO2/95% air atmosphere at 37 �C. Nano-struc-tured and flat samples were placed, modified side up, in24 well (Iwaki) culture plates. Cells were obtained aftertrypsinization of confluent or near-confluent culture andthen seeded at 1 · 104 cells/well in suspension on allmaterials.
After different culturing times (3 h, 24 h, 48 h, and 96 h),cells were fixed in a 4% formaldehyde/PBS solution(15 min) and stained (3 min) in a Coomassie blue in meth-anol/acetic acid/water solution. Automated detection ofcell outline was used to calculate sample area covered bycells using the Image J (National Institute of Health, US)analysis software. An unpaired Student’s t-test was used

100
110
120
130
140
150
160
170
0 20 40 60 80 100
Wat
er C
onta
ct A
ngle
(W
CA
/º)
Deposition Time (min)
6 sccm
10 sccm
Wat
er C
onta
ct A
ngle
(W
CA
/
6 sccm
10 sccm
6 sccm
10 sccm
Fig. 1. WCA values of teflon-like coatings deposited in MD regime atflow rates of 6 and 10 sccm as a function of the deposition time (blacksquares refer to samples considered further in this study).
G.S. Senesi et al. / Surface Science 601 (2007) 1019–1025 1021
to evaluate statistical significant differences among samplesperformed on at least four replicated samples. Differenceswere considered significant for p < 0.01. Cells were thenfixed with 1% glutaraldehyde/0.1 M sodium cacodylatesolution, and dehydrated by alcohol/water solutions forSEM observation.
2.2. SEM analysis
A Stereoscan 360 Cambridge SEM operating at 20 kVwith a 50� tilt was employed to examine the coating surfacemorphology and evaluate its distribution on the entire sam-ple surface. Being the samples non-conductive, before SEMexamination surfaces were coated with a thin layer of Auusing a plasma sputtering apparatus.
The SEM technique may be considered as complemen-tary to AFM (see below) in allowing the evaluation of dis-tribution on a small scale of homogeneity.
2.3. AFM analysis
An Autoprobe CP-Research scanning probe microscope(Thermomicroscopes, Sunnyvale, CA) fully equipped forsurface analysis was employed to evaluate the surfacetopography, the area root-mean-square (RMS) roughnessand the mean surface height of plasma-polymerised CFx
coatings on PET substrates as a function of the depositiontime.
All AFM measurements were performed in air on tripli-cate samples using the non-contact AFM (NC-AFM)mode in order to avoid damaging of the surface analysed.The AFM maps were acquired using commercial, unmod-ified conical silicon nitrade probe tips with high-resonancefrequency. To limit the risk that the surface morphologymeasured could be affected by possible random local ef-fects, and to increase the representativeness of the wholesample, ten areas of the surface were scanned for each sam-ple using four different spatial resolutions, i.e., 10 · 10,20 · 20, 50 · 50, and 80 · 80 lm2.
Neverthless, only two representative scan size areas,20 · 20 and 80 · 80 lm2, were examined in further detailfor the characterization of the topography of plasma pro-cessed substrates since these areas were considered morerelevant for the subsequent biological investigation. Manycells possess surface nanometric organelles, such as filopo-dia and microspikes, whose major function is to exploreand interact with the nano-features around them. For thispurpose, the AFM images of scan size area 20 · 20 lm2
were used for a detailed examination of the single nano-structure topographical properties. In particular, six Z-pro-files (total 320 Z-profiles) were traced out on each AFMimage to evaluate the mean height values of the nano-struc-tures, which were then elaborated through the SPM labAnalysis software.
Larger sample areas, i.e., 80 · 80 lm2, were scanned byAFM in order to evaluate the surface RMS roughness val-ues referred to the whole area of the nano-structured sam-
ples using the same software. This area was chosen alsoconsidering the size of a cell and the area of the environ-ment that usually comes into contact with a cell adheringon a biomaterial.
The area RMS roughness is defined as the square root ofthe mean value of the squares of the distances of the pointsfrom the image mean value according to:
RMS ¼
ffiffiffiffiffiffiffiffiffiffiffiffiffiffiffiffiffiffiffiffiffiffiffiffiffiffiffiffiffiffiffi1
N
XN
i¼1
ðZi � �ZÞ2vuut ð1Þ
3. Results and discussion
Fluorocarbon coatings deposited in the CW regimeshow a WCA value of 105�, characterized by very lowroughness, thus they can be considered as a flat surface.All the coatings deposited by the MD process show aWCA > 105�, in particular coatings obtained after longdeposition time are super-hydrophobic and have aWCA > 150�. Hydrophobicity is well known to be relatedto appropriate surface roughness combined with low sur-face energy.
In their studies of the wetting behaviour of rough sur-faces, Wenzel [20] and Cassie and Baxter [21] proposedtwo different models to describe hydrophobic surfaces withregards to chemical composition, roughness and surfaceenergy. The former model assumes that the liquid fills upthe rough surface, whereas the latter one assumes that anair layer is trapped between the liquid and the surface inthe roughness valleys. In the latter case, the contact be-tween the liquid and the solid layer is not complete.Although these two models are rarely compatible, bothsuggest a marked effect of the surface roughness on thecontact angle, and thus on surface wettability [22].
1022 G.S. Senesi et al. / Surface Science 601 (2007) 1019–1025
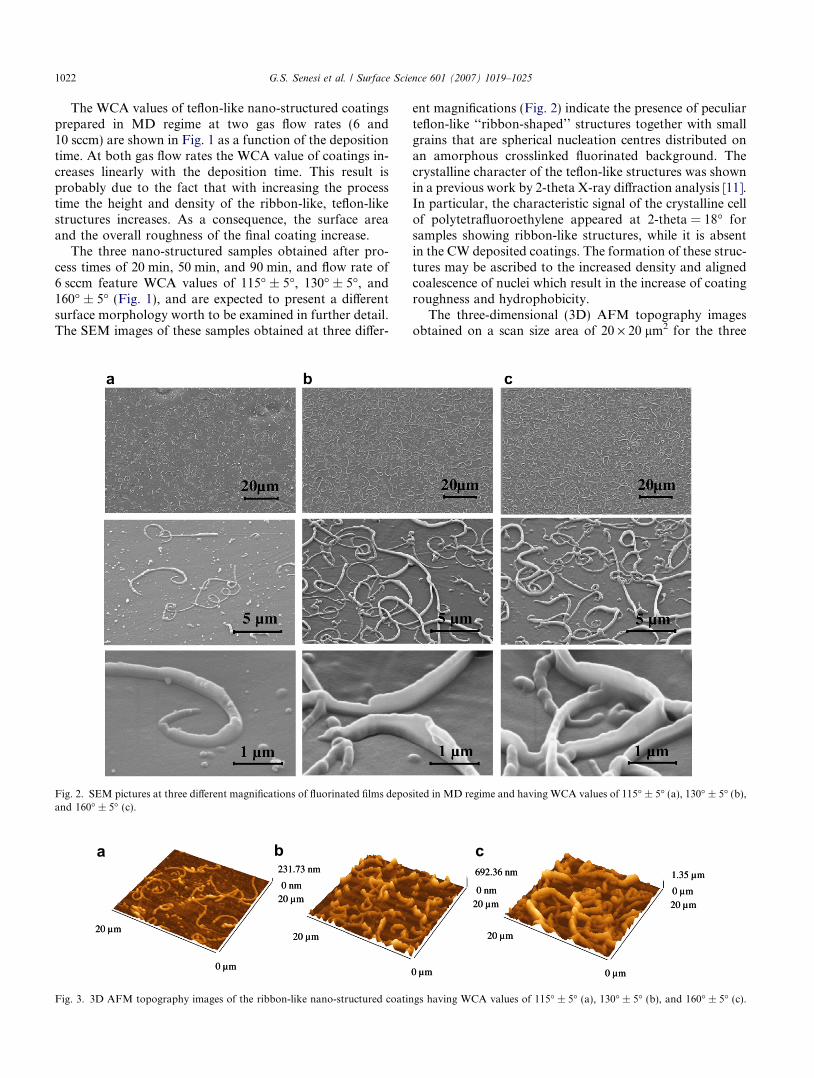
The WCA values of teflon-like nano-structured coatingsprepared in MD regime at two gas flow rates (6 and10 sccm) are shown in Fig. 1 as a function of the depositiontime. At both gas flow rates the WCA value of coatings in-creases linearly with the deposition time. This result isprobably due to the fact that with increasing the processtime the height and density of the ribbon-like, teflon-likestructures increases. As a consequence, the surface areaand the overall roughness of the final coating increase.
The three nano-structured samples obtained after pro-cess times of 20 min, 50 min, and 90 min, and flow rate of6 sccm feature WCA values of 115� ± 5�, 130� ± 5�, and160� ± 5� (Fig. 1), and are expected to present a differentsurface morphology worth to be examined in further detail.The SEM images of these samples obtained at three differ-
Fig. 2. SEM pictures at three different magnifications of fluorinated films depoand 160� ± 5� (c).
0 nm
20 µm
231.73 nm
20 µm
0 µm
20 µm
0 nm
20 µm
231.73 nm
20 µm
0 µm
20 µm
Fig. 3. 3D AFM topography images of the ribbon-like nano-structured coatin
ent magnifications (Fig. 2) indicate the presence of peculiarteflon-like ‘‘ribbon-shaped’’ structures together with smallgrains that are spherical nucleation centres distributed onan amorphous crosslinked fluorinated background. Thecrystalline character of the teflon-like structures was shownin a previous work by 2-theta X-ray diffraction analysis [11].In particular, the characteristic signal of the crystalline cellof polytetrafluoroethylene appeared at 2-theta = 18� forsamples showing ribbon-like structures, while it is absentin the CW deposited coatings. The formation of these struc-tures may be ascribed to the increased density and alignedcoalescence of nuclei which result in the increase of coatingroughness and hydrophobicity.
The three-dimensional (3D) AFM topography imagesobtained on a scan size area of 20 · 20 lm2 for the three
sited in MD regime and having WCA values of 115� ± 5� (a), 130� ± 5� (b),
0 µm
20 µm0 nm
692.36 nm
20 µm
20 µm
0 µm
0 µm
1.35 µm
0 µm
20 µm0 nm
692.36 nm
20 µm
20 µm
0 µm
0 µm
1.35 µm
gs having WCA values of 115� ± 5� (a), 130� ± 5� (b), and 160� ± 5� (c).

G.S. Senesi et al. / Surface Science 601 (2007) 1019–1025 1023
ribbon-like nano-structured coatings in Fig. 2 are shown inFig. 3. The different hydrophobic behaviour of the threecoatings can be explained according to the models pro-posed by Wenzel and/or Cassie & Baxter (see above).The differences in contact angle and surface energy maybe suggested to be related mainly to the different roughnessgenerated on the surface by varying deposition time.
After the longest deposition time (90 min) the structuredcoating appears (Fig. 3c) completely covered by the teflon-
CO
UN
TS
CO
UN
TS
CO
UN
TS
CO
UN
TS
CO
UN
TS
CO
UN
TS
W CA=130˚ ±5˚WCA=130˚±5˚W CA=130˚ ±5˚WCA=130˚±5˚
W CA=130˚ ±5˚WCA=130˚±5˚W CA=130˚ ±5˚WCA=115˚±5˚
WCA=160˚±5˚
Fig. 4. Nano-structure heights evaluated by the software SPM lab Analysis
like ‘‘ribbons’’. The film surface looks homogeneous thusoffering several contact points to liquid droplets that, con-sidering their size, can come into contact only with the topof the ridges. This situation is consistent with that de-scribed by the Cassie’s model, i.e., the super-hydrophobicbehavior of the surface may be explained by the possibilityfor a droplet to maintain an air layer below it. The surfacewettability can be easily switched from super-hydrophobicto hydrophobic only by reducing the deposition time.
0 200 400 600 800 10000
20
40
60
80
100
120
140
160
HEIGHT VALUES
0 200 400 600 800 10000
20
40
60
80
100
120
140
160
0 200 400 600 800 10000
20
40
60
80
100
120
140
160
110±44nm
HEIGHT VALUES
0 200 400 600 800 1000 12000
20
40
60
80
100
120
140
160
0 200 400 600 800 1000 12000
20
40
60
80
100
120
140
160
HEIGHT VALUES
0 200 400 600 800 1000 12000
20
40
60
80
100
120
140
160
0 200 400 600 800 1000 12000
20
40
60
80
100
120
140
160
0 200 400 600 800 1000 12000
20
40
60
80
100
120
140
160
0 200 400 600 800 1000 12000
20
40
60
80
100
120
140
160
282±120nm
HEIGHT VALUES
0 200 400 600 800 1000 12000
20
40
60
80
100
120
140
160
0 200 400 600 800 1000 12000
20
40
60
80
100
120
140
160
HEIGHT VALUES
0 200 400 600 800 1000 12000
20
40
60
80
100
120
140
160
0 200 400 600 800 1000 12000
20
40
60
80
100
120
140
160
0 200 400 600 800 1000 12000
20
40
60
80
100
120
140
160
0 200 400 600 800 1000 12000
20
40
60
80
100
120
140
160
526±214nm
HEIGHT VALUES
by tracing six Z-Profile on each 20 · 20 lm2 AFM topography image.

Flat
#*
#*
˚+
˚^
+^
#*
#*
˚+
˚^
+^
24h 48h 96h
#*
#*
˚+
˚^
+^
Student’s t Test (p<0.01)
0%
10%
20%
30%
40%
50%
60%
70%
80%
90%
10
3hTIME OF CELL CULTURE
AV
ER
AG
E %
CO
VE
RE
D A
RE
A
Hydrophobic
Super - hydrophobic
#*
#*
˚+
˚^
+^
ADHESION OF 3T3/AREA 2.8mm2(n>10)
#*
#*
˚+
˚^
+^
#*
#*
˚+
˚^
+^
24h 48h 96h
#*
#*
˚+
˚^
+^
0%
10%
20%
30%
40%
50%
60%
70%
80%
90%
100%
3h
#*
#*
˚+
˚^
+^
Fig. 6. Average percentages of sample areas covered by 3T3 fibroblastcells on flat, hydrophobic and super-hydrophobic nano-structured sampleswith increasing times of cell culture. The unpaired Student’s t-test wasused to evaluate statistical significant differences among samples.*,#,^,+,�: p < 0.01.
1024 G.S. Senesi et al. / Surface Science 601 (2007) 1019–1025
The sample obtained after 20 min of deposition time(Fig. 3a) shows a surface with few, thin and short ‘‘rib-bons’’ together with small grains and large smooth areas.The surface is not homogeneous and the space betweenthe different edges of the ribbons is too large to allow theequilibrium of droplets only on the peaks. Most reason-ably, droplets come into contact with the whole surfaceincluding peaks and valleys, thus, a situation consistentwith the Wenzel’s model can be suggested. A transition sit-uation from one model to the other, i.e., from a super-hydrophobic surface to a hydrophobic one, may explainthe wetting properties of the film deposited after 50 min.The transition state is based not only on the possibilityof maintaining an air layer below the droplet (high rough-ness) but also to the presence of large and numerous edgesthat increase the probability of contact between the dropletand the film [22].
A detailed knowledge of each single surface featurethrough AFM image analysis is crucial when studying thebehaviour of a cell that comes into contact with the surface.This because the cell can extend many filopodia, i.e., highlymotile nano-structures, for gathering special informationfrom the surrounding environment by interacting individu-ally with every single topographical feature on the surface[23,24]. The mean height values obtained by tracing outsix Z-profiles (total of 320 Z-profiles) on each20 · 20 lm2 AFM topography image of the three struc-tured samples obtained after deposition times of 20 min,50 min and 90 min are shown in Fig. 4. Mean height valuesof 110 ± 44 nm, 282 ± 120 nm, and 526 ± 214 nm were ob-tained for nano-structured samples with WCA values of115� ± 5�, 130� ± 5�, and 160� ± 5�, respectively. These re-sults confirm the increase of the WCA value with increas-ing the height of nano-structures shown in Fig. 5.
Larger areas (80 · 80 lm2) of these samples were alsoinvestigated on the basis of the area and mean roughness
0
50
100
150
200
250
100
200
300
400
500
600
110 120 130 140 150 160 170
Mean area RMS Roughness (nm)
Mean Height (nm)
Water Contact Angle (º)
Mean H
eight (nm)
0
50
100
150
200
250
100
200
300
400
500
600
110 120 130 140 150 160 170
Mea
n ar
ea R
MS
Rou
ghne
ss (
nm)
0
50
100
150
200
250
100
200
300
400
500
600
110 120 130 140 150 160 1700
50
100
150
200
250
100
200
300
400
500
600
110 120 130 140 150 160 170
Fig. 5. Relationships between WCA values, mean area RMS roughnessesand mean nano-structure heights of the three nano-structured samplesstudied.
commonly experienced by the cell. The calculated areaRMS roughness values were 40 ± 5 nm, 124 ± 15 nm,and 233 ± 21 nm, respectively, for WCA values of115� ± 5�, 130� ± 5�, and 160� ± 5�.
In general, a positive relationship exists between theWCA values, the mean nano-structure heights and the areaRMS roughnesses (Fig. 5). These results indicate that dif-ferent plasma deposition conditions can produce differentcontact angles and yield surfaces variously rough and fi-brous, and of varying hydrophobicity. In particular, theMD regime allows the step-by-step control of the deposi-tion process so that a coating can be obtained with chem-ical, physical and topographical surface properties that areable to affect various cell performances, including align-ment, mobility, proliferation, differentiation, etc. In orderto respond adequately, cells have to sense their environ-ment both chemically and topographically.
The 3T3 fibroblasts cell line was used in order to esti-mate adhesion, spread and growth of cells on the differentstructured samples in comparison with cell behaviour on aflat surface. The 3T3 fibroblast cells were thus seeded onflat, hydrophobic and super-hydrophobic nano-structuredsamples and the sample surface area covered by cells wasevaluated by optical microscopy analysis at different times(3 h, 24 h, 48 h, and 96 h) of cell culture.
The graph in Fig. 6 shows the mean values (±SD) ofsample surfaces covered by cells after different times. Theresults clearly show the greatest preference of cells fornano-structured samples with respect to the flat ones. Inparticular, this preference becomes more evident withincreasing the cell culture time especially on super-hydro-phobic surfaces.
The SEM pictures in Fig. 7 show the three examinedsurfaces on which cells were seeded and allowed to growfor 96 h. These images indicate that a higher number ofcells and a better cell morphology (adhesion, spreadnessand growth) are obtained at the greatest nano-structureheights and WCA values, i.e., at the greatest roughnessof the final coating (super-hydrophobic surfaces, Fig. 7c).

Fig. 7. SEM pictures of flat, hydrophobic and super-hydrophobic nano-structured samples on which 3T3 cells were seeded and grown for 96 h.
G.S. Senesi et al. / Surface Science 601 (2007) 1019–1025 1025
4. Conclusions
This study confirms that plasma processes are a versatileand easily tuneable deposition procedure that allows to ob-tain surfaces with different topography and nano-featuresthat are appropriate for use in cell-culture experiments.The increase measured for WCA values with increasingroughness of the CFx nano-structured coatings indicatesthe generation of fibrous surfaces that yield good resultsin terms of adhesion, spreading and growth of cells. SEMand 3D AFM topography analyses indicate that surfacesobtained are characterized by typical hydrophobic orsuper-hydrophobic properties. In particular, the MD filmwith the highest WCA value (160�) shows a typical super-hydrophobicity determined by the combined action oftopography (surface structures) and low surface energy(high F/C ratio).
Results obtained also suggest that, even if the chemistryacross the different surfaces is homogeneous, cells are ableto ‘explore’ the surrounding area of interest through filopo-dia and ‘feel’ the peculiar topographical features distrib-uted on a structured surface. Further studies are incourse to investigate filopodia as tools used by cells forthe exploration of the peculiar topographical featuresaround the cell.
Acknowledgements
The Italian FIRB project RBNE01458S_006 miur fromthe Italian Ministry of University and Research is grate-fully acknowledged for the financial support. The authorsacknowledge the laboratory support of Dr. M. Cavonefor SEM analysis.
References
[1] R. d’Agostino, F. Cramarossa, F. Fracassi, F. Illuzzi, in: R.d’Agostino (Ed.), Plasma Deposition, Treatment, Etching, of Poly-mers, Academic Press, San Diego, 1990, p. 95.
[2] B.D. Ratner, A. Chilkoti, G.P. Lopez, in: R. d’Agostino (Ed.),Plasma Deposition Treatment Etching of Polymers, Academic Press,San Diego, 1990, p. 464.
[3] R. d’Agostino, P. Favia, F. Fracassi (Eds.), Plasma Processing ofPolymers NATO ASI Series E: Applied Sciences, Kluwer AcademicPublishers, Dordrecht, The Netherlands, 1997.
[4] R. d’Agostino, P. Favia, C. Oehr, M.R. Wertheimer, Plasma Process.Polym. 2 (2005) 7.
[5] P. Favia, in: H. Biederman (Ed.), Plasma Polymers and RelatedMaterials, Imperial College, 2004, p. 25.
[6] V. Panchalingam, B. Poon, H. Hsiao-Hwei, C.R. Savage, R.B.Timmons, R.C. Eberhart, J. Biomater. Sci. Polymer Edn. 5 (1/2)(1993) 131.
[7] X. Chen, K. Rajeshwar, R.B. Timmons, J.-J. Chen, O.M.R. Chyan,Chem. Mater. 8 (1996) 1067.
[8] S.J. Limb, K.K.S. Lau, D.J. Edell, E.F. Gleason, K.K. Gleason,Plasma Polymer. 4 (1999) 21.
[9] L.M. Han, R.B. Timmons, W.W. Lee, J. Vac. Sci. Technol. B 18 2(2000) 799.
[10] A. Milella, F. Palumbo, P. Favia, G. Cicala, R. d‘Agostino, PureAppl. Chem. 77 (2005) 399.
[11] G. Cicala, A. Milella, F. Palumbo, P. Rossini, P. Favia, R.d’Agostino, Macromolecules 35 (2002) 8920.
[12] B. Alberts, A. Johnson, J. Lewis, M. Raff, K. Roberts, P. Walter(Eds.), Molecular Biology of the Cell, fourth ed., Garland SciencePublishing, 2003.
[13] A.S.G. Curtis, M. Varde, J. Natl. Cancer Inst. 33 (1964) 15.[14] A.S.G. Curtis, C.D.W. Wilkinson, Trends Biotechnol. 19 (3) (2001)
97.[15] C.D.W. Wilkinson, M. Riehle, M. Wood, J. Gallagher, A.S.G.
Curtis, Mater. Sci. Eng. C 19 (1–2) (2002) 263.[16] A.S.G. Curtis, P. Clark, Crit. Rev. Biocompat. 5 (1990) 343.[17] A.S.G. Curtis, C.D.W. Wilkinson, Biomaterials 18 (1997) 1573.[18] R.G. Flemming, C.J. Murphy, G.A. Abrams, S.L. Goodman, P.F.
Nealey, Biomaterials 20 (1999) 573.[19] M. Creatore, F. Palumbo, R. d’Agostino, Pure Appl. Chem. 74 (2002)
407.[20] R.N. Wenzel, Ind. Eng. Chem. 28 (1936) 988.[21] A.B.D. Cassie, S. Baxter, Trans. Faraday Soc. 40 (1944) 546.[22] L-M. Lacroix, M. Lejeune, L. Ceriotti, M. Kormunda, T. Meziani, P.
Colpo, F. Rossi, Surf. Sci. 592 (2005) 182.[23] M.J. Dalby, M.O. Riehle, S.S. Duncan, H. Agheli, A.S.G. Curtis,
Biomaterials 25 (2004) 5415.[24] A.S.G. Curtis, N. Gadegaard, M.J. Dalby, M.O. Riehle, C.D.W.
Wilkinson, G. Aitchison, IEEE Trans. Biosci. 3/1 (2004) 61.