supporting information supporting results optimizing ... · supporting information supporting...
TRANSCRIPT
1
SUPPORTING INFORMATION
SUPPORTING RESULTS
Optimizing methods for depleting rRNA and tRNA from total bacterial RNA
Developing custom rRNA depletion oligonucleotides for human gut bacteria - We initially screened combinations of several commercially available kits and published protocols for depleting 16S and 23S rRNA from total bacterial RNA. We judged kit performance based on visual inspection of agarose gels containing depleted and non-depleted RNA from the same sample of E. coli or B. thetaiotaomicron total RNA (grown to mid-log phase in Luria Broth or TYG for E. coli and B. thetaiotaomicron, respectively). Kits tested included: (i) mRNA-ONLY [Epicenter]; (ii) poly-A addition [Ambion] and capture using poly-T Dynal beads [Invitrogen] (1); and (iii) MICROBExpress [Ambion] (2,3) (Fig. S4). We were particularly attracted to the hybridization-capture method of MICROBExpress, as it was fast, scalable to 96-well format, and did not require enzymatic manipulation of the RNA. The kit performed well on E. coli total RNA, virtually eliminating detectable 16S and 23S rRNA bands on an agarose gel. However, when applied to B. thetaiotaomicron, a more abundant member of the distal human gut microbiota, we observed a prominent 16S rRNA band and a fainter 23S rRNA band (Fig. S4A, lane 1). We assumed this finding reflected the kit’s optimization for E. coli rRNA depletion. Therefore, we sought to develop a set of custom oligos that were broadly applicable to bacterial species representing multiple phyla in the human gut microbiota. Towards this end, we used RNAmmer (4) to identify one-hundred 5S, 16S, and 23S rRNA sequences present in 37 cultured members of this community that had deep draft assemblies available from the Human Gut Microbiome Initiative (HGMI; http://www.genome.gov/Pages/Research/Sequencing/SeqProposals/HGMISeq.pdf ). We subsequently aligned the sequences using clustalw (5) and designed five ~30bp ‘depletion’ oligos that targeted those regions of 16S and 23S rRNA where the oligos matched >90% of the rRNA sequences (Table S8A). 5S rRNA did not have enough conservation to design depletion oligos.
Several different oligo variants [with or without HPLC purification, with 3’ biotin or 5’biotin tags, with or without a tetraethylene glycol (TEG) spacer] were attached to Dynal M-280 streptavidin beads (Invitrogen) according to the kit manufacturer’s recommendations, and tested using different concentrations and different buffers [MICROBExpress binding buffer, or TES (500mM,1M, 1.5M, and 2M) or TEL (1M); where TES is TE plus XM NaCl and TEL is TE+ XM LiCl]. Oligo concentrations, buffers, and bead concentrations were all optimized, initially based on their ability to deplete B. thetaiotaomicron 16S rRNA, as judged by decreased intensity of the 16S rRNA band relative to the 23S rRNA band on an agarose gel [normalized using a non-depleted control and Quantity One gel analysis software (BioRad)] (Fig. S4B). Optimal results were obtained with a combination of two cycles of depletion with 3’ biotinylated oligos containing a TEG spacer in TES-1M (for oligo sequences, see Table S8A). When these 10 custom gut oligos were used in combination with the MICROBExpress kit, we observed only very faint 16S and 23S rRNA bands for B. thetaiotaomicron (e.g., Fig. S4A, lanes 1 and 2).
Developing barcodes and testing 16S and 23S rRNA depletion methods with a highly parallel Illumina GAII sequencer - We employed a greedy algorithm to choose a maximally distant set of sixteen 4-bp barcodes for multiplex sequencing, which could be used without modifying the Illumina Genome Analyzer library preparation protocol for generating unidirectional 36 nt reads (Table S8B).
These barcodes provided a cost-effective means for quantitative RNA-Seq based evaluation of the different combinations of rRNA depletion methods. Depletion combinations with mRNA-ONLY [Epicenter], MICROBExpress, and the custom gut oligos at first appeared to perform equally well, yielding up to 3-fold enrichment of mRNA, with mRNA representing 9±5% (range 4-14%) of the sequencing reads from rRNA-depleted B. thetaiotaomicron RNA that had been prepared from cells harvested during log-phase growth in TYG medium (Table S8C). However, by plotting the number of

2
raw reads for each base pair in the genome for different depletion methods, we observed that samples processed with the mRNA-ONLY kit yielded no reads that mapped to genes deemed highly expressed based on data obtained from rRNA-depleted RNA generated using the other methods, and from a non-depleted control. Based on these results we decided to use a combination of two depletions with MICROBExpress followed by two depletions with the custom gut oligos for all subsequent RNA-Seq experiments.
Depletion of 5S rRNA and tRNAs by size-selection - After optimizing the depletion of 16S and 23S rRNAs, 5S rRNA and tRNAs comprised a more dominant proportion of the reads (up to 35% and 4%, respectively; Table S8C row 8, and Table 8D, row 4). Although these sequences were too divergent to target with pulldown oligos, their short lengths provided an opportunity to deplete them by size-selection. Both the RNEasy [Qiagen] and MEGAclear [Ambion] RNA purification columns claim to significantly deplete the proportion of 5S and tRNAs from total RNA samples. We tried several combinations of these columns (Table S8D), and found that running RNA samples two times through either column substantially reduced the percentage of tRNA and 5S rRNA reads: MEGAClear columns produced the greatest removal of 5S rRNA and tRNAs (11% and 0.2% respectively of sequencing reads compared with 35% and 4% for a single-elution from an RNEasy column).
Benefits of combinatorial depletion – We subsequently used multiplex RNA-Seq to assay the depletion efficacy of each of these methods/steps individually and in combination. In addition, all of the depletion steps described above were optimized for 10 µg of total bacterial RNA. However, for many in vivo samples (particularly from feces obtained from gnotobiotic mice colonized with only a few strains of bacteria), we were not able to obtain this quantity of RNA. Therefore, we also tested the robustness of the individual steps in the depletion protocol to varying starting concentrations of B. thetaiotaomicron total RNA (Table S8E). Used individually, the MICROBExpress kit and custom gut oligos yield 1.2 fold and 1.7 fold mRNA enrichment, respectively (with mRNA representing 12% and 9.0% of the sequence reads). Used in combination, the enrichment of mRNA more than doubled to an average of 3.5-fold, with mRNA representing 26% of sequencing reads (see Table S8E for details). We observed no differences in depletion efficiency due to variations in the amount of starting RNA (p-val=0.47, two-tailed t-test).
Depletion across species and environments - Following optimization of rRNA and tRNA depletion from total bacterial RNA, we applied the RNA-Seq protocol to cecal and fecal samples obtained from gnotobiotic mice colonized with B. thetaiotaomicron with or without B. hydrogenotrophica or M. formatexigens, plus samples obtained from in vitro mono-cultures. Over the 89 samples assayed, mRNA represented on average 51% of sequencing reads, although this number varied with the type of sample (Table S8F,G): for the 19 cecal samples, bacterial mRNA represented 17±10% of the reads, whereas for in vitro samples of B. hydrogenotrophica and M. formatexigens, mRNA comprised 64±14% and 58±10% of the sequencing reads respectively.
Normalization of RNA-Seq data
Splitting barcodes - Sequence runs were split into their respective experiments using the 4-bp barcode at the beginning of each sequencing read. The 4-bp barcodes lack the redundancy required for error correction. However, with the low error rate at the beginning of each Illumina GA-II read, we were able to map on average 96% of the sequencing reads to a barcode (n=145,983,882 reads analyzed).
Mapping reads - After dividing sequence runs by barcode, we mapped the reads to the relevant genomes using the ssaha2 algorithm (6). Minimum score thresholds for ssaha were selected based on the distribution of scores for all mapped reads of a 32nt barcoded sample and a 36-nt non-barcoded sample (29 was selected as the minimum score for 32nt barcoded samples; 33 was the minimum score used for 36-nt non-barcoded samples).
3
Handling ties and normalization - Although an 18-nt read is sufficient to map more than 90% of the sequencing reads, even at 32-36nt there is a large fraction of the reads that map to multiple locations within a genome or across genomes. Reads that map non-uniquely were added to each gene in proportion to each gene’s fraction of unique-match counts (e.g., a non-unique read that maps equally well to gene A with 18 unique reads and gene B with 2 unique reads will be scored as 0.9 count to gene A and 0.1 count to gene B). We added a pseudocount (i.e. added 1) to each gene count prior to normalization to account for differences in sampling depth, although clearly a more appropriate model-based approach to smooth lower expression values is needed in the future, particularly with mixed species samples where one or more species is clearly undersampled. Raw counts were normalized to reads/kb/million mapped reads (7).
Validation of RNA-Seq using Affymetrix GeneChips
Importance of multiple DNAse digestions - During the optimization of RNA-Seq, we initially estimated the presence of genomic DNA (gDNA) contamination using a double-stranded DNA-specific fluorescent dye (Quant-iT dsDNA HS; Invitrogen). However, we found that even when gDNA was below the limit of detection (and several hundred-fold less than the quantity of rRNA-depleted RNA), the trace gDNA remaining in the sample was still preferentially amplified during the Illumina GA-II library preparation, resulting in background signal across all genes. Therefore, we replaced the original DNAse step used in the RNA extraction protocol with two separate DNAse steps that used large quantities of the optimized DNAses, DNA-free TURBO [Ambion] and Baseline-ZERO [Epicenter] (see Methods in SI for details). In addition, all samples were screened for gDNA contamination prior to rRNA/tRNA depletion using species-specific primers (30 cycles of PCR amplification) or degenerate bacterial 16S rDNA primers (35 cycles of PCR amplification). No gDNA contamination was observed in the RNA-Seq samples following this rigorous DNAse step (as measured by PCR and by visual inspection of sequencing reads mapped to the relevant genome so that we could verify that the reads were preferentially placed within genes and not assigned to intergenic regions).
Comparisons with Affymetrix GeneChips - Years of effort have gone into validating and determining the limitations of various DNA microarray platforms (8,9). Affymetrix GeneChips have consistently been among the top performing platforms in these studies. Therefore, we sought to compare gene expression using microbial RNA-Seq versus Affymetrix GeneChips and B. thetaiotaomicron as a model.
A common statistical model for describing DNA microarray data is:
Equation 1: Yijk = θi + φij + εijk
where Yijk represents measurement k of log2-scale expression of gene i measured by platform j, θi represents log2 of the absolute gene expression, φij is the platform-specific probe or spot effect, and εijk represents measurement error. Microarray platform comparisons have generally used hybridization of samples representing two different experimental conditions to compare gene expression ratios across platforms rather than absolute intensities, since it has been repeatedly found that when looking at the variance of components in the model above (vθ, vφ , and vε ), there is a sizable probe effect (vφ is large). This probe effect artificially inflates intraplatform correlation and decreases interplatform correlation. By comparing relative ratios across platforms, the φij are cancelled out (9). RNA-Seq presents an interesting test of this observation as the lack of any type of probe or spot would likely minimize the contributions of φij, which for RNA-Seq would represent gene-specific biases due to the depletion or sequencing protocol. As noted below, there appears to be little effect from the depletion protocol and since transcript quantities from RNA-Seq are calculated by summing the number of matches to a gene sequence from reads originating from randomly sheared dscDNA fragments. Sequencing biases are likely to be limited as well.
4
With these thoughts in mind, we took material from four cecal samples, obtained from B. thetaiotaomicron mono-associated mice, that had been analyzed with RNA-Seq and assayed them using custom B. thetaiotaomicron Affymetrix GeneChips containing probesets to >98% of its predicted genes (average tiling density of PM-MM probepairs/ORF=11; (10)). Standard Affymetrix protocols were employed: i.e., single-stranded cDNA synthesis started with 10 µg of total RNA without rRNA depletion and expression values were normalized using MAS5. As expected given the probe bias mentioned above, the Affymetrix GeneChip samples had slightly higher correlation among biological replicates than RNA-Seq although both values were quite high (0.91 versus 0.88) given the variation encountered with biological as opposed to analytic replicates from the cecum. Remarkably, when we directly compared the correlation between Affymetrix GeneChip intensities and RNA-Seq values, the average correlation was 0.79 [a similar comparison between Affymetrix GeneChips and two-color DNA microarrays produced intraplatform correlations of 0.98 and 0.91, respectively, and an interplatform correlation of 0.40; (9)]. If we compare the average of the four replicates for each method (RNA-Seq and GeneChips), the correlation increases further to 0.86 (Fig. 1B). This high correlation between platforms suggests that the probe effect for Affymetrix chips (φij) is small relative to the influence of absolute gene transcript abundance and that both Affymetrix GeneChips and RNA-Seq provide accurate log2 measurements of the absolute gene expression θi, with only minor contributions from probe effects and noise.
We lacked custom GeneChips containing probes to B. hydrogenotrophica, and M. formatexigens. Nonetheless, when this analysis was extended to the 2-member microbial communities in bi-associated gnotobiotic mice (n=14), and expression values were compared between platforms for only the B. thetaiotaomicron component of the model human gut microbiota, our results were similar to those described above with cecal samples harvested from mono-associated animals (Table S8H).
Effect of depletion on mRNA quantities - The multi-step mRNA enrichment procedure has the potential to alter the abundance of transcripts prior to their estimation with highly parallel sequencing. As noted above, the high correlation between RNA-Seq-based and Affymetrix GeneChip-based expression profiling provides evidence that bias due to the depletion procedure is likely to be minimal. In addition, we sequenced three non-depleted RNA samples isolated from M. formatexigens during log-phase culture in minimal medium plus glucose and xylose, and from B. hydrogenotrophica grown in minimal medium plus pyruvate (>250,000 mRNA reads/sample). In all three conditions, the correlation in expression between depleted and non-depleted samples was ≥0.94, providing further evidence that the depletion procedure does not markedly alter transcript abundance.
“Sufficient” sequencing - A decided advantage of RNA-Seq is the ability to choose sequencing depth based on the number of lanes in the flow cell used to sequence each sample or the number of samples pooled per lane. For a study focused only on large changes in gene expression, it may be possible to pool many samples for “screen-depth” RNA-Seq at a fraction of the cost of a DNA microarray. For RNA profiles of complex bacterial communities, it may be desirable to run several sequencing lanes per sample to explore changes in gene expression in less abundant species. As microbial RNA-Seq is more widely used, it will become increasingly important to define bounds on sufficient sequencing for different RNA-Seq applications.
To explore the effect of sequencing depth on microbial mRNA quantification, we randomly subsampled the RNA-Seq reads for the four B. thetaiotaomicron mono-associated cecal samples described above to obtain between 50,000 and 500,000 reads for each sample (note that two of the four samples had <200,000 mRNA reads and therefore were only sampled for data points requiring less than 200,000 mRNA reads). We then calculated the correlation between replicates at different sequencing depths. The rationale for this approach is that increasing sequencing depth (similar to increasing the number of replicates) will increase the precision of the transcript quantity estimates until the precision gained by increased sequencing depth is small relative to the amount of noise (εijk) in the biological system, and from the procedure used to prepare samples. Therefore, as we approach an infinite
sequencing depth, the correlation should converge to a maximum, after which increased sequencing depth provides little advantage for the majority of genes represented in the transcriptional profile. For B. thetaiotaomicron mono-association samples, we found that this convergence occurred after only 300,000 mRNA reads (blue line in Fig. 1A).
We then took samples of M. formatexigens and B. hydrogenotrophica harvested during in vitro culture for which we had a very large number of mRNA reads and performed a similar random subsampling procedure. For both of these species, we also found a convergence at ~300,000 mRNA reads with a slight gain in correlation if sequencing advanced towards 1 million reads (red and green lines in Fig. 1A). To move the correlation between replicates below 0.9 , we had to sample at or below 50,000 mRNA reads. These high correlations between sample replicates at very low sequencing depth likely reflect the distribution of mRNA concentrations within a cell. RNA abundance as well as metabolite and protein abundances have been shown to be distributed similar to a lognormal, power law, or perhaps most accurately a double Pareto-lognormal distribution (11). All of these distributions share the characteristic that the majority of biological features have very low abundances, while the majority of the molecules in the cell represent just a few biological features (the Pareto distribution is named after economist Vilfredo Pareto, whose Pareto principle states that 20% of a nation’s population controls 80% of the wealth; in our case, for M. formatexigens grown in vitro on melibiose, 15.8% of the genes represent 80% of the mRNA within a cell). For a sequence-based approach, this abundance distribution appears to have the convenient result that if we randomly sample mRNAs to a given sequencing depth, the accuracy of the quantity estimates for gene transcripts we have sampled to any particular depth remains roughly constant, as we will first sample (and quantify) very abundant transcripts to high precision, followed by medium abundance transcripts, and eventually the low abundance transcripts will reach high precision quantity estimates at very high sequencing depth.
The majority of transcriptional profile analyses involve comparing two or more conditions to identify a set of differentially expressed genes associated with various biological perturbations. Therefore, we continued the subsampling described above using a set of RNA-Seq profiles from two different M. formatexigens growth conditions for which we had a large number of mRNA reads (two replicates each in minimal medium plus xylose or mellibiose). The maximum number of mRNA reads available for all four RNA-Seq profiles was 800,000 so we sampled several different sequencing depths from 50,000 to 800,000. Although with these biological perturbations we have no knowledge of truth, we made the assumption that we approach the true set of differentially expressed genes as mRNA quantity estimates are improved by deeper sequencing. Therefore, all of the performance comparisons described below were done by comparing a subsampled dataset to the largest subsample of 800,000 reads.
We initially plotted the log-ratios of these lower subsamples versus the 800,000 read sample and found a high correlation between log-ratios that increased as we increased sequencing depth (r= 0.68, 0.87, 0.92 for 50,000, 300,000, and 500,000 mRNA read depths, respectively, compared to the 800,000 read sample; Fig. S5A). However, as with most transcriptional profile comparisons, the quantity of the majority of gene transcripts between these two conditions do not change, and they are scattered around a normal distribution with a few outliers representing the differentially expressed mRNAs (Fig. S5B).
To explore the influence of sequencing depth on the ability to identify differentially expressed genes, we initially performed a t-test across all genes at different sequencing depths, measuring the performance of each sequencing depth as:
Equation 2:)(
)(fullsamplen
fullsamplesubsamplenF I=
5
6
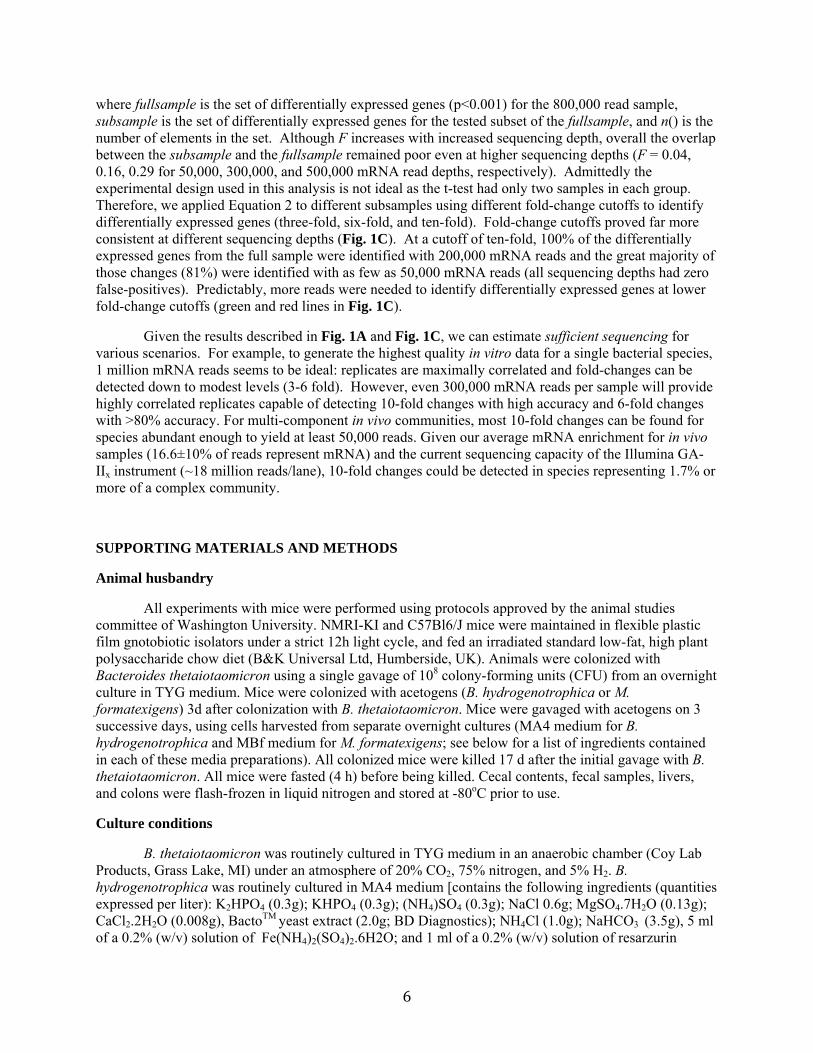
where fullsample is the set of differentially expressed genes (p<0.001) for the 800,000 read sample, subsample is the set of differentially expressed genes for the tested subset of the fullsample, and n() is the number of elements in the set. Although F increases with increased sequencing depth, overall the overlap between the subsample and the fullsample remained poor even at higher sequencing depths (F = 0.04, 0.16, 0.29 for 50,000, 300,000, and 500,000 mRNA read depths, respectively). Admittedly the experimental design used in this analysis is not ideal as the t-test had only two samples in each group. Therefore, we applied Equation 2 to different subsamples using different fold-change cutoffs to identify differentially expressed genes (three-fold, six-fold, and ten-fold). Fold-change cutoffs proved far more consistent at different sequencing depths (Fig. 1C). At a cutoff of ten-fold, 100% of the differentially expressed genes from the full sample were identified with 200,000 mRNA reads and the great majority of those changes (81%) were identified with as few as 50,000 mRNA reads (all sequencing depths had zero false-positives). Predictably, more reads were needed to identify differentially expressed genes at lower fold-change cutoffs (green and red lines in Fig. 1C).
Given the results described in Fig. 1A and Fig. 1C, we can estimate sufficient sequencing for various scenarios. For example, to generate the highest quality in vitro data for a single bacterial species, 1 million mRNA reads seems to be ideal: replicates are maximally correlated and fold-changes can be detected down to modest levels (3-6 fold). However, even 300,000 mRNA reads per sample will provide highly correlated replicates capable of detecting 10-fold changes with high accuracy and 6-fold changes with >80% accuracy. For multi-component in vivo communities, most 10-fold changes can be found for species abundant enough to yield at least 50,000 reads. Given our average mRNA enrichment for in vivo samples (16.6±10% of reads represent mRNA) and the current sequencing capacity of the Illumina GA-IIx instrument (~18 million reads/lane), 10-fold changes could be detected in species representing 1.7% or more of a complex community.
SUPPORTING MATERIALS AND METHODS
Animal husbandry
All experiments with mice were performed using protocols approved by the animal studies committee of Washington University. NMRI-KI and C57Bl6/J mice were maintained in flexible plastic film gnotobiotic isolators under a strict 12h light cycle, and fed an irradiated standard low-fat, high plant polysaccharide chow diet (B&K Universal Ltd, Humberside, UK). Animals were colonized with Bacteroides thetaiotaomicron using a single gavage of 108 colony-forming units (CFU) from an overnight culture in TYG medium. Mice were colonized with acetogens (B. hydrogenotrophica or M. formatexigens) 3d after colonization with B. thetaiotaomicron. Mice were gavaged with acetogens on 3 successive days, using cells harvested from separate overnight cultures (MA4 medium for B. hydrogenotrophica and MBf medium for M. formatexigens; see below for a list of ingredients contained in each of these media preparations). All colonized mice were killed 17 d after the initial gavage with B. thetaiotaomicron. All mice were fasted (4 h) before being killed. Cecal contents, fecal samples, livers, and colons were flash-frozen in liquid nitrogen and stored at -80oC prior to use.
Culture conditions
B. thetaiotaomicron was routinely cultured in TYG medium in an anaerobic chamber (Coy Lab Products, Grass Lake, MI) under an atmosphere of 20% CO2, 75% nitrogen, and 5% H2. B. hydrogenotrophica was routinely cultured in MA4 medium [contains the following ingredients (quantities expressed per liter): K2HPO4 (0.3g); KHPO4 (0.3g); (NH4)SO4 (0.3g); NaCl 0.6g; MgSO4.7H2O (0.13g); CaCl2.2H2O (0.008g), BactoTM yeast extract (2.0g; BD Diagnostics); NH4Cl (1.0g); NaHCO3 (3.5g), 5 ml of a 0.2% (w/v) solution of Fe(NH4)2(SO4)2.6H2O; and 1 ml of a 0.2% (w/v) solution of resarzurin
7
(Sigma). The pH of the medium was adjusted to 7, which was then autoclaved, and brought inside the anaerobic chamber where 0.6g cysteine, 10 ml of trace mineral solution (ATCC), and 10 ml of a vitamin solution (ATCC) were added. Fifty-milliliter aliquots of medium were combined with different carbon sources, filtered sterilized, then dispensed (as 7 ml aliquots) into previously autoclaved, anaerobically capped 27 ml Balch tubes.
For multiplex RNA-Seq analysis, B. hydrogenotrophica was grown in MA4 medium with the following carbon sources: D(+)glucose, D(-)fructose,
D(-)ribose, pyruvic acid, L-isoleucine, L-valine, L-phenylalanine, or tryptone (BD Biosciences), all carbon sources at a concentration of 1% (w/v) with the exception of tryptone (2% w/v). Growth at 37°C in 27 ml Balch anaerobic tubes on these different carbon sources was assessed using a spectrophotometer (Thermo Spectronic; monitoring at A600 nm). For testing the effects of H2 on expression of acetyl-CoA pathway components, B. hydrogenotrophica was grown in 125 ml serum bottles containing 15 ml of MA4 medium supplemented with 7g/L tryptone and 10g/L glucose (the resulting medium is referred to as MA2). The remaining volume in the bottle (headspace) contained either a 75:5:20 mixture of N2, H2 and CO2, or an 80:20 mixture of H2 and CO2. To test the effects of CO2 on expression of components of the acetylCoA pathway, B. hydrogenotrophica was grown at 37°C in ‘modified MA2 medium’ (NaHCO3 omitted), and the bottles’ headspace was replaced with 100% N2. Serum bottles were pressurized to 30 psi with the indicated gases.
M. formatexigens was routinely cultured in MBf medium containing the following ingredients (per liter): K2HPO4 (0.3g); KHPO4 (0.3g); (NH4)SO4 (0.3g); NaCl (0.6g); MgSO4.7H2O (0.13g); CaCl2.2H2O (0.008g), NH4Cl (0.5g), NaCHO2 (3g); 5 ml of a 0.2% (w/v) Fe(NH4)2(SO4)2.6H2O solution; and 1ml of a 0.2% (w/v) resarzurin solution. The pH was adjusted to 7, and NaHCO3 (3.5 g/L) and cysteine (0.6 g/L) were introduced. The medium was autoclaved and brought inside the anaerobic Coy chamber where 10 ml of trace mineral solution (ATCC), 10 ml of a vitamin solution (ATCC) and 10 ml of supplements solution A were added [Supplements solution A contains tryptone, Tween80, vitamin K3, histidine, hematin, acetic acid, isovaleric acid, propionic acid and n-butyric acid; the final concentrations of supplements in the medium after supplements solution A was added were tryptone (2 g/L), Tween80 (0.02 ml/L), vitamin K3 (0.2 mg/L), histidine (40 μM), hematin (0.38 μM), acetic acid (3.1 mM), isovaleric acid (0.1 mM), propionic acid (0.9 mM) and n-butyric acid (0.5 mM). These supplements were not required for growth but increased growth rate and final yield].
Fifty-milliliter aliquots of MBf medium were then combined with different carbon sources and filter sterilized (Steriflip® Filter Units; Millipore). Seven-milliliter aliquots were then injected into previously autoclaved, anaerobically capped 27 ml Balch tubes, and tubes were pressurized to 30psi with a mixture of N2, and CO2 gasses (80:20). M. formatexigens was cultured at 37°C. Growth was scored as positive if the A600 increased by 0.2 relative to a culture that did not contain any carbon source and attained an A600>0.5 in two consecutive passages.
For RNA-Seq experiments designed to test the effect of formate on expression of acetylCoA pathway components, we used minimal medium (i.e. supplements solution A was not added) and sodium formate was either not provided or provided at a final concentration of 45mM.
Whole Genome Transcriptional Profiling with B. thetaiotaomicron GeneChips
Transcriptional profiling was performed using custom B. thetaiotaomicron Affymetrix GeneChips (Sonnenburg et al., 2005). Targets were prepared from whole bacterial RNA as previously described and hybridized to the GeneChips according to standard Affymetrix protocols (www.affymetrix.com). Data were normalized using Microarray Suite 5 software (Affymetrix) by adjusting the average B. thetaiotaomicron transcript signal on each GeneChip to an arbitrary value of 500.
8
Measurements of colonization
Microbial colonization was assessed as previously described using qPCR (Mahowald et al., 2009). Briefly, frozen cecal contents (150-300 mg) from a given gnotobiotic mouse were mixed together with 250-500 μL of 0.1 mm-diameter zirconium/silica beads (Biospec Products), 0.5 mL of Buffer A (200 mM NaCl, 20 mM EDTA), 210 μL of 20% SDS, and 0.5 mL of a mixture of phenol:chloroform:isoamyl alcohol (25:24:1; pH 7.9; Ambion) and lysed with a bead beater. The aqueous phase was extracted after centrifugation (8,000 x g at 4°C for 3 min). DNA was then precipitated with 0.1 volume of 3M sodium acetate (pH 5.5) and 1 volume of isopropanol, pelleted (14,000 x g at 4°C for 20 min), and subsequently washed with ethanol. The resulting pellet was resuspended in water and further purified (DNeasy column, Qiagen).
qPCR was performed by using an Mx3000 real-time PCR system (Stratagene). Reaction mixtures (25 �l) contained SYBRGreen Supermix (Bio-Rad), 300 nM species-specific primers (see below), and 10 ng of gDNA isolated from cecal contents or microbial DNA purified from mono-cultures (the latter was used to construct standard curves). Primer pairs targeted the BT1028 gene of B. thetaiotaomicron encoding a SusD homolog (Bt1028fwd 5’-GACGCCAATTTTGCTGCCATCACTA-3’, Bt1028rev 5’-CAAATACGGCTTCGCTTCCACCTGT-3’), or the 16S rRNA gene of M. formatexigens (Bf432fwd 5’-ATGACGGTACCTGACCAAGA-3’, Bf613rev 5’-GGCACTCAAGCCATACAGTT-3’), or the 16S rRNA gene of B. hydrogenotrophica (Rh16Sfwd1:5’-GAACGGAGATTTCGGTTGAA-3’; Rh16Srev1 5’-GTGCAATATTCCCCACTGCT- 3’). Amplification conditions were 55°C for 2 min and 95°C for 15 min, followed by 40 cycles of 95°C (30 sec), 55°C (45 sec), and 72°C (30 sec). Data were collected at 78°C, 80°C, 82°C, and 84°C. The amount of DNA from each genome in each PCR was computed by comparison to a standard curve of genomic DNA prepared in the same manner from pure cultures of each bacterial species. Data were converted to genome equivalents (GE) by calculating the mass of each genome (B. thetaiotaomicron, 6.8E-6 ng/GE; M. formatexigens, 4.87E-6 ng/GE; B. hydrogenotrophica, 3.9E-6 ng/GE).
Biochemical analyses of cecal metabolites
Cecal samples were freeze-dried at –35°C for 2 d (yield 10-15 mg/dry weight) and stored under vacuum at −80°C until use. Fructan levels were assayed by using a microanalytic approach that has been described in detail previously (12). Briefly, samples (5–10 mg) were homogenized at 1°C in 0.25 ml of 1% oxalic acid (prepared in H2O) and divided into two equal-sized aliquots, one of which was heated to 100°C for 30 min (acid hydrolysis sample), while the other was maintained at 1°C (control sample). A 10 μl aliquot of each sample was added to a l ml solution containing 50 mM Tris·HCl (pH 8.1), 1 mM MgCl2, 0.02% BSA, 0.5 mM ATP, 0.1 mM NADP+, 2 μg/ml Leuconostoc mesenteroides glucose-6 phosphate dehydrogenase (Calbiochem), 10 μg/ml yeast hexokinase (Sigma), and 10 μg/ml yeast phosphoglucose isomerase (Sigma). The mixture subsequently was incubated for 30 min at 24°C. The resulting NADPH product was detected using a fluorimeter. Glucan levels were measured in a similar manner except that phosphoglucose isomerase was omitted from the reactions. Fructose and glucose standards (5–10 nmol) were carried through all steps.
For amino acid analysis, cecal samples were freeze-dried as described above. Samples were weighed, resuspended in a 100 times volume of HPLC grade water (Fischer), vortexed for 5 min at room temperature and centrifuged for 5 min at 14,000 x g. Supernatants were transferred to a clean tube and immediately frozen and stored at -80°C.
Mass Spectrometry
Measurements of acetate and propionate were performed as previously described, with the exception that acetic acid-1-13C,d4 (Sigma) was used as a standard to control for acetate recovery
9
(Mahowald et al., 2009). Targeted analysis of select amino acids in water lysates of cecal contents were conducted by stable-isotope dilution using flow-injection, tandem mass spectrometry (Turer et al., 2009) and GC/MS (13). Methods for non-targeted analysis of metabolites by GC/MS were derived with substantial modification from those of Fiehn et al. (14). Peak alignment was performed with SpectConnect (courtesy of the laboratory of Dr. Gregory Stephanopoulos, Massachusetts Institute of Technology, www.spectconnect.mit.edu; (15). Metabolite identification was aided by use of the Fiehn GC/MS Metabolomics RTL Library (a gift from Agilent Technologies, Santa Clara, CA).
Statistical analyses
Pairwise comparisons were made using an unpaired Student’s t test. One-way ANOVA followed by Tukey’s post hoc multiple comparison test was used to determine statistical significance of differences observed between three or more groups of mice.
Defining the representation of acetogens in the human gut microbiome
Datasets of shotgun 454 FLX pyrosequencing reads from the fecal microbiomes of 18 adult females living in the USA [6 sets of adult monozygotic twins and their mothers; (Turnbaugh et al., 2009)] were searched for significant homology to a set of proteins characteristic of different H2-consuming bacteria. For each characteristic protein, we used a set of 1-3 known examples of that protein and counted tblastn hits with an e-value<10-40. Only one hit was allowed per read (e.g., read SRR005169.414911 has a significant hit to the acsA gene present in Moorella thermoacetica, B. hydrogenitrophica, and M. formatexigens, but only counts as a single hit).

10
SUPPORTING REFERENCES 1. Frias-Lopez, J., Shi, Y., Tyson, G. W., Coleman, M. L., Schuster, S. C., Chisholm, S. W., and
Delong, E. F. (2008) Proc Natl Acad Sci U S A 105, 3805-3810 2. Passalacqua, K. D., Varadarajan, A., Ondov, B. D., Okou, D. T., Zwick, M. E., and Bergman, N.
H. (2009) J Bacteriol 191, 3203-3211 3. Yoder-Himes, D. R., Chain, P. S., Zhu, Y., Wurtzel, O., Rubin, E. M., Tiedje, J. M., and Sorek,
R. (2009) Proc Natl Acad Sci U S A 106, 3976-3981 4. Lagesen, K., Hallin, P., Rodland, E. A., Staerfeldt, H. H., Rognes, T., and Ussery, D. W. (2007)
Nucleic Acids Res 35, 3100-3108 5. Larkin, M. A., Blackshields, G., Brown, N. P., Chenna, R., McGettigan, P. A., McWilliam, H.,
Valentin, F., Wallace, I. M., Wilm, A., Lopez, R., Thompson, J. D., Gibson, T. J., and Higgins, D. G. (2007) Bioinformatics 23, 2947-2948
6. Ning, Z., Cox, A. J., and Mullikin, J. C. (2001) Genome Res 11, 1725-1729 7. Mortazavi, A., Williams, B. A., McCue, K., Schaeffer, L., and Wold, B. (2008) Nat Methods 5,
621-628 8. Shi, L., Reid, L. H., Jones, W. D., Shippy, R., Warrington, J. A., Baker, S. C., Collins, P. J., de
Longueville, F., Kawasaki, E. S., Lee, K. Y., Luo, Y., Sun, Y. A., Willey, J. C., Setterquist, R. A., Fischer, G. M., Tong, W., Dragan, Y. P., Dix, D. J., Frueh, F. W., Goodsaid, F. M., Herman, D., Jensen, R. V., Johnson, C. D., Lobenhofer, E. K., Puri, R. K., Schrf, U., Thierry-Mieg, J., Wang, C., Wilson, M., Wolber, P. K., Zhang, L., Amur, S., Bao, W., Barbacioru, C. C., Lucas, A. B., Bertholet, V., Boysen, C., Bromley, B., Brown, D., Brunner, A., Canales, R., Cao, X. M., Cebula, T. A., Chen, J. J., Cheng, J., Chu, T. M., Chudin, E., Corson, J., Corton, J. C., Croner, L. J., Davies, C., Davison, T. S., Delenstarr, G., Deng, X., Dorris, D., Eklund, A. C., Fan, X. H., Fang, H., Fulmer-Smentek, S., Fuscoe, J. C., Gallagher, K., Ge, W., Guo, L., Guo, X., Hager, J., Haje, P. K., Han, J., Han, T., Harbottle, H. C., Harris, S. C., Hatchwell, E., Hauser, C. A., Hester, S., Hong, H., Hurban, P., Jackson, S. A., Ji, H., Knight, C. R., Kuo, W. P., LeClerc, J. E., Levy, S., Li, Q. Z., Liu, C., Liu, Y., Lombardi, M. J., Ma, Y., Magnuson, S. R., Maqsodi, B., McDaniel, T., Mei, N., Myklebost, O., Ning, B., Novoradovskaya, N., Orr, M. S., Osborn, T. W., Papallo, A., Patterson, T. A., Perkins, R. G., Peters, E. H., Peterson, R., Philips, K. L., Pine, P. S., Pusztai, L., Qian, F., Ren, H., Rosen, M., Rosenzweig, B. A., Samaha, R. R., Schena, M., Schroth, G. P., Shchegrova, S., Smith, D. D., Staedtler, F., Su, Z., Sun, H., Szallasi, Z., Tezak, Z., Thierry-Mieg, D., Thompson, K. L., Tikhonova, I., Turpaz, Y., Vallanat, B., Van, C., Walker, S. J., Wang, S. J., Wang, Y., Wolfinger, R., Wong, A., Wu, J., Xiao, C., Xie, Q., Xu, J., Yang, W., Zhang, L., Zhong, S., Zong, Y., and Slikker, W., Jr. (2006) Nat Biotechnol 24, 1151-1161
9. Irizarry, R. A., Warren, D., Spencer, F., Kim, I. F., Biswal, S., Frank, B. C., Gabrielson, E., Garcia, J. G., Geoghegan, J., Germino, G., Griffin, C., Hilmer, S. C., Hoffman, E., Jedlicka, A. E., Kawasaki, E., Martinez-Murillo, F., Morsberger, L., Lee, H., Petersen, D., Quackenbush, J., Scott, A., Wilson, M., Yang, Y., Ye, S. Q., and Yu, W. (2005) Nat Methods 2, 345-350
10. Sonnenburg, J. L., Xu, J., Leip, D. D., Chen, C. H., Westover, B. P., Weatherford, J., Buhler, J. D., and Gordon, J. I. (2005) Science 307, 1955-1959
11. Lu, C., and King, R. D. (2009) Bioinformatics 25, 2020-2027 12. Passonneau, J., and Lowry, O. (1993) Enzymatic analysis: A Practical Guide (Humana, Totawa,
NJ) 13. Ferrara, C. T., Wang, P., Neto, E. C., Stevens, R. D., Bain, J. R., Wenner, B. R., Ilkayeva, O. R.,
Keller, M. P., Blasiole, D. A., Kendziorski, C., Yandell, B. S., Newgard, C. B., and Attie, A. D. (2008) PLoS Genet 4, e1000034
14. Fiehn, O., Wohlgemuth, G., Scholz, M., Kind, T., Lee do, Y., Lu, Y., Moon, S., and Nikolau, B. (2008) Plant J 53, 691-704
15. Styczynski, M. P., Moxley, J. F., Tong, L. V., Walther, J. L., Jensen, K. L., and Stephanopoulos, G. N. (2007) Anal Chem 79, 966-973

11
16. Pierce, E., Xie, G., Barabote, R. D., Saunders, E., Han, C. S., Detter, J. C., Richardson, P., Brettin, T. S., Das, A., Ljungdahl, L. G., and Ragsdale, S. W. (2008) Environ Microbiol 10, 2550-2573
SUPPORTING FIGURES
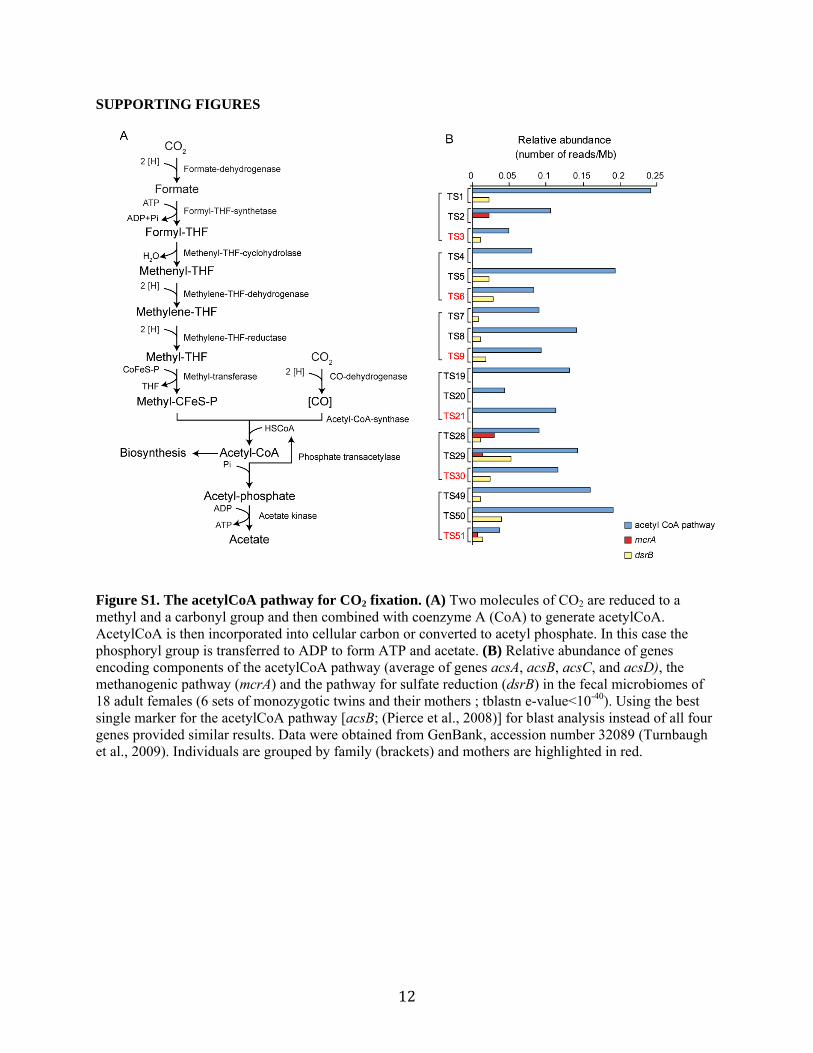
Figure S1. The acetylCoA pathway for CO2 fixation. (A) Two molecules of CO2 are reduced to a methyl and a carbonyl group and then combined with coenzyme A (CoA) to generate acetylCoA. AcetylCoA is then incorporated into cellular carbon or converted to acetyl phosphate. In this case the phosphoryl group is transferred to ADP to form ATP and acetate. (B) Relative abundance of genes encoding components of the acetylCoA pathway (average of genes acsA, acsB, acsC, and acsD), the methanogenic pathway (mcrA) and the pathway for sulfate reduction (dsrB) in the fecal microbiomes of 18 adult females (6 sets of monozygotic twins and their mothers ; tblastn e-value<10-40). Using the best single marker for the acetylCoA pathway [acsB; (Pierce et al., 2008)] for blast analysis instead of all four genes provided similar results. Data were obtained from GenBank, accession number 32089 (Turnbaugh et al., 2009). Individuals are grouped by family (brackets) and mothers are highlighted in red.
12
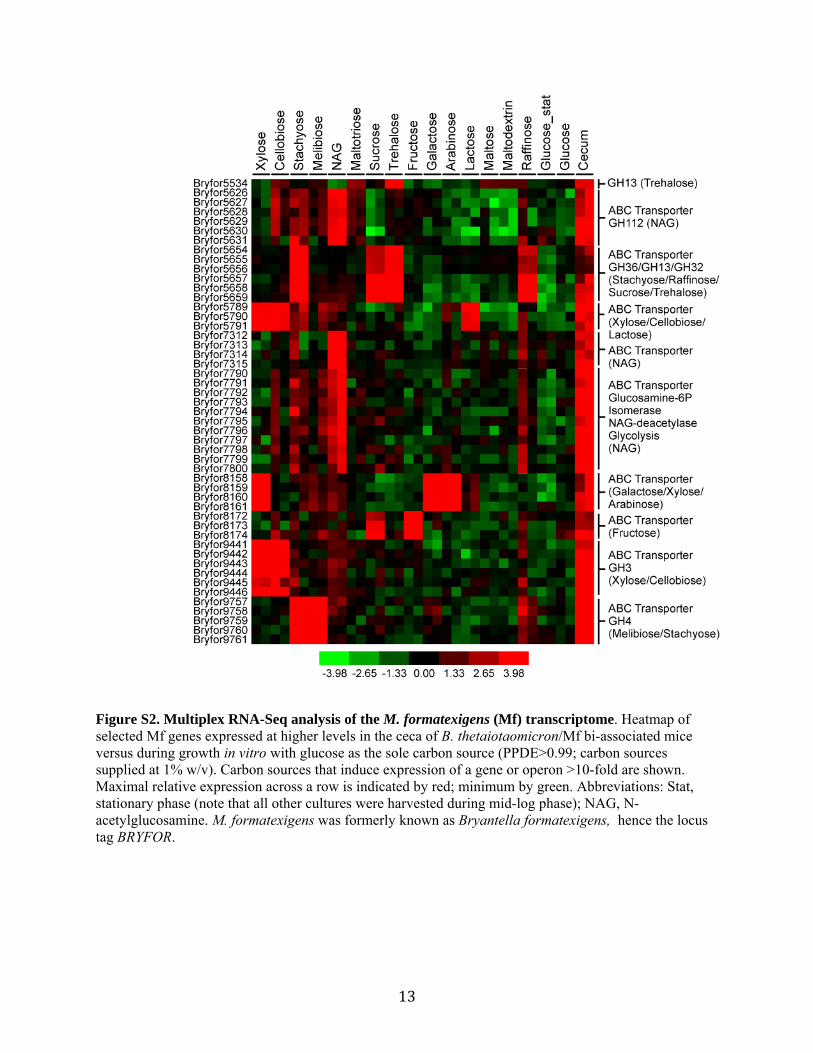
Figure S2. Multiplex RNA-Seq analysis of the M. formatexigens (Mf) transcriptome. Heatmap of selected Mf genes expressed at higher levels in the ceca of B. thetaiotaomicron/Mf bi-associated mice versus during growth in vitro with glucose as the sole carbon source (PPDE>0.99; carbon sources supplied at 1% w/v). Carbon sources that induce expression of a gene or operon >10-fold are shown. Maximal relative expression across a row is indicated by red; minimum by green. Abbreviations: Stat, stationary phase (note that all other cultures were harvested during mid-log phase); NAG, N-acetylglucosamine. M. formatexigens was formerly known as Bryantella formatexigens, hence the locus tag BRYFOR.
13
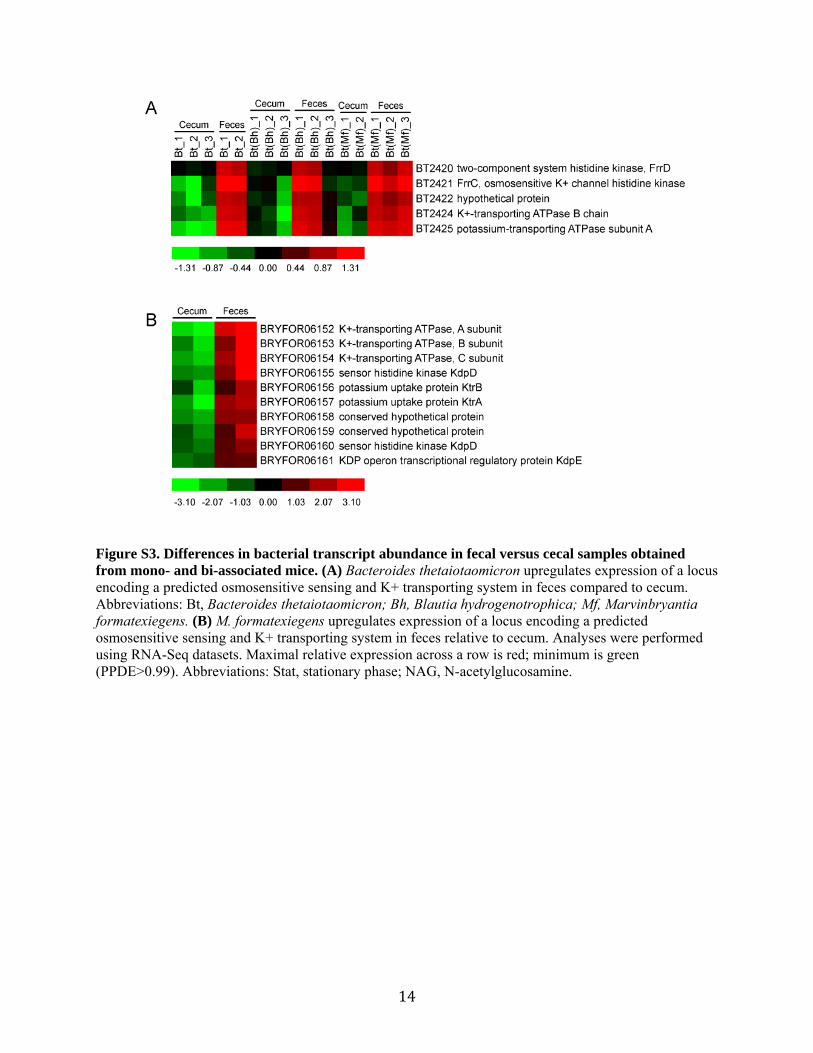
Figure S3. Differences in bacterial transcript abundance in fecal versus cecal samples obtained from mono- and bi-associated mice. (A) Bacteroides thetaiotaomicron upregulates expression of a locus encoding a predicted osmosensitive sensing and K+ transporting system in feces compared to cecum. Abbreviations: Bt, Bacteroides thetaiotaomicron; Bh, Blautia hydrogenotrophica; Mf, Marvinbryantia formatexiegens. (B) M. formatexiegens upregulates expression of a locus encoding a predicted osmosensitive sensing and K+ transporting system in feces relative to cecum. Analyses were performed using RNA-Seq datasets. Maximal relative expression across a row is red; minimum is green (PPDE>0.99). Abbreviations: Stat, stationary phase; NAG, N-acetylglucosamine.
14
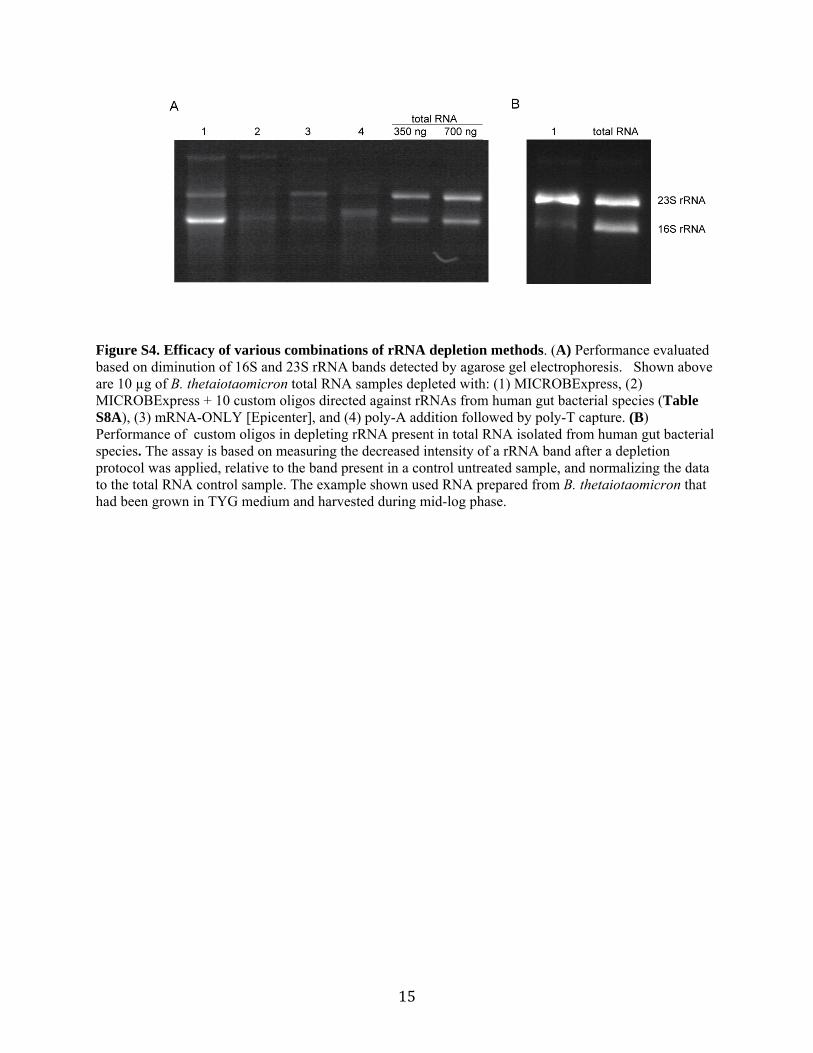
Figure S4. Efficacy of various combinations of rRNA depletion methods. (A) Performance evaluated based on diminution of 16S and 23S rRNA bands detected by agarose gel electrophoresis. Shown above are 10 µg of B. thetaiotaomicron total RNA samples depleted with: (1) MICROBExpress, (2) MICROBExpress + 10 custom oligos directed against rRNAs from human gut bacterial species (Table S8A), (3) mRNA-ONLY [Epicenter], and (4) poly-A addition followed by poly-T capture. (B) Performance of custom oligos in depleting rRNA present in total RNA isolated from human gut bacterial species. The assay is based on measuring the decreased intensity of a rRNA band after a depletion protocol was applied, relative to the band present in a control untreated sample, and normalizing the data to the total RNA control sample. The example shown used RNA prepared from B. thetaiotaomicron that had been grown in TYG medium and harvested during mid-log phase.
15
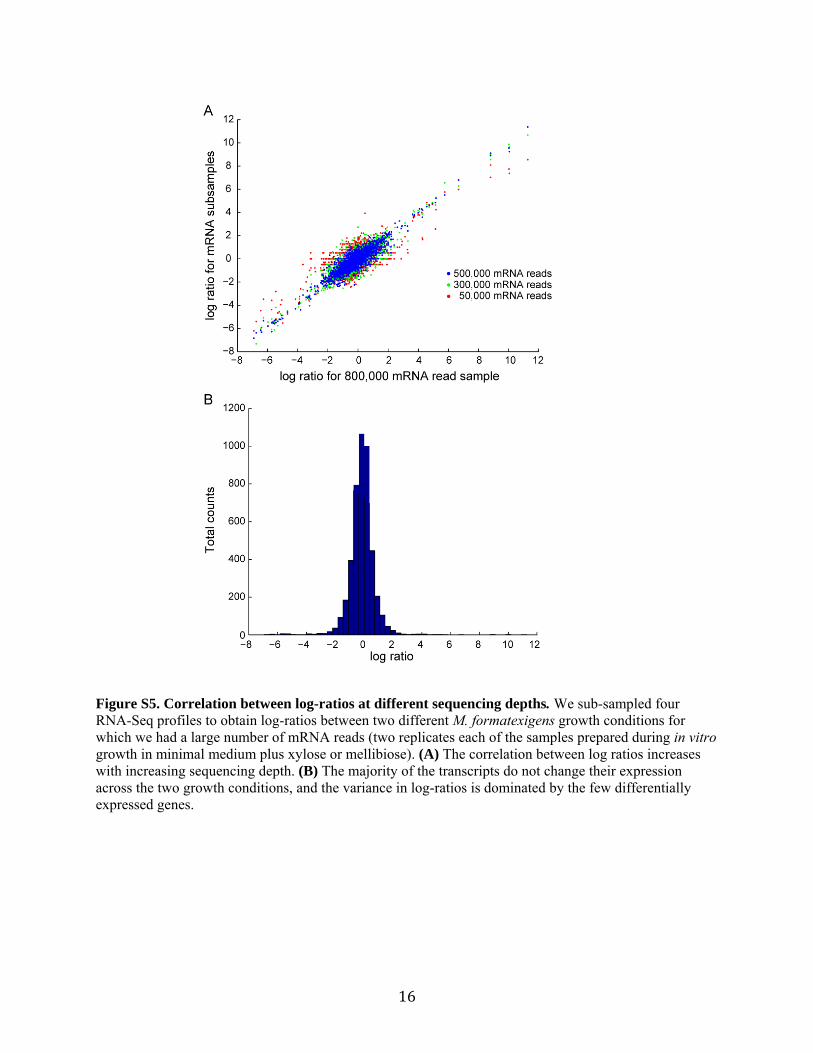
Figure S5. Correlation between log-ratios at different sequencing depths. We sub-sampled four RNA-Seq profiles to obtain log-ratios between two different M. formatexigens growth conditions for which we had a large number of mRNA reads (two replicates each of the samples prepared during in vitro growth in minimal medium plus xylose or mellibiose). (A) The correlation between log ratios increases with increasing sequencing depth. (B) The majority of the transcripts do not change their expression across the two growth conditions, and the variance in log-ratios is dominated by the few differentially expressed genes.
16