supplementary materials for -...
TRANSCRIPT
Originally published 9 May 2014; corected 30 May 2014
www.sciencemag.org/content/344/6184/641/suppl/DC1
Supplementary Materials for
Cancer Immunotherapy Based on Mutation-Specific CD4+ T Cells in a Patient with Epithelial Cancer
Eric Tran, Simon Turcotte, Alena Gros, Paul F. Robbins, Yong-Chen Lu, Mark E. Dudley, John R. Wunderlich, Robert P. Somerville, Katherine Hogan, Christian S.
Hinrichs, Maria R. Parkhurst, James C. Yang, Steven A. Rosenberg*
*Corresponding author. E-mail: [email protected]
Published 9 May 2014, Science 344, 641 (2014) DOI: 10.1126/science.1251102
This PDF file includes:
Materials and Methods Figs. S1 to S7 Tables S1 to S8 References
Correction: An earlier version of the supplementary materials was mistakenly posted. The data and conclusions were not affected.
2
Materials and Methods
Whole-exomic sequencing Whole-exomic sequencing of cryopreserved tumor tissue (embedded in OCT) and normal
peripheral blood cells was performed by Personal Genome Diagnostics (PGDx,
Baltimore, MD) as previously described (27). The average number of distinct high
quality sequence reads at each base was 155 and 160 for tumor and normal (PBMC)
DNA, respectively.
Patient treatment and generation of TIL for adoptive cell therapy
Patient 3737 was enrolled in the institutional-review board (IRB)-approved protocol: "A
Phase II Study Using Short-Term Cultured, Autologous Tumor-Infiltrating Lymphocytes
Following a Lymphocyte Depleting Regimen in Metastatic Digestive Tract Cancers"
(ClinicalTrials.gov number: NCT01174121), which was designed to evaluate the safety
and effectiveness of the adoptive transfer of autologous, ex vivo expanded tumor-
infiltrating lymphocytes (TIL) in patients with gastrointestinal cancers.
TIL used for patient’s first treatment was generated as previously described (28). Briefly,
resected tumors were minced into approximately 1-2 mm fragments and individual
fragments were placed in wells of a 24-well plate containing 2 ml of complete media
(CM) containing high dose IL-2 (6000 IU/ml, Chiron). CM consisted of RPMI
supplemented with 10% in-house human serum, 2 mM L-glutamine, 25 mM HEPES and
10 μg/ml gentamicin. Additionally, a mixed tumor digest was also cultured in CM with
high dose IL-2. After the initial outgrowth of T cells (between 2-3 weeks), 5e6 T cells
from select cultures were rapidly expanded in gas-permeable G-Rex100 flasks using
irradiated allogeneic PBMC at a ratio of 1 to 100 in 400 ml of 50/50 medium,
supplemented with 5% human AB serum, 3000 IU/ml of IL-2, and 30 ng/ml of OKT3
antibody (Miltenyi Biotec). 50/50 media consisted of a 1 to 1 mixture of CM with AIM-V
media. All cells were cultured at 37°C with 5% CO2. The cells were rapidly expanded for
two weeks prior to infusion. Patient 3737 underwent a non-myeloablative
lymphodepleting regimen consisting of cyclophosphamide and fludarabine prior to
receiving 42.4 billion total T cells in conjunction with four doses of high dose IL-2 (see
Fig. S4 for treatment scheme and details).
TIL used for the patient’s second treatment was generated in a similar manner as the first
treatment with the following changes. The first treatment product (Patient 3737-TIL) was
composed of a combination of 5 individual TIL cultures. These 5 cultures were
individually assessed for expression of CD4 and Vβ22, and reactivity against mutated
ERBB2IP, and one culture was found to be highly enriched in Vβ22+ ERBB2IP-
mutation-reactive CD4+ T cells (data not shown). This one TIL culture (after the initial
outgrowth with high dose IL-2) was then rapidly expanded as described above. The
patient underwent an identical non-myeloablative lymphodepleting regimen as the first
treatment prior to receiving 126 billion total T cells in conjunction with four doses of
high dose IL-2.
3
Generation of tandem minigene (TMG) constructs
The detailed methodology will be published elsewhere, but briefly, for each non-
synonymous substitution mutation identified by whole exome sequencing, a "minigene"
construct encoding the corresponding amino acid change flanked by 12 amino acids of
the wild-type protein sequence was made. Multiple minigenes were genetically fused
together to generate a tandem minigene (TMG) construct. These minigene constructs
were codon optimized and synthesized as DNA String constructs (Life Technologies).
TMGs were then cloned into the pcDNA3.1/V5-His TOPO vector using In-Fusion
technology (Clontech). Site-directed mutagenesis was used to generate the nine "wild-
type reversion" TMG-1 constructs (Gene Oracle). The nucleotide sequence of all TMGs
was verified by standard Sanger sequencing (Macrogen and Gene Oracle).
Generation of autologous antigen presenting cells (APCs)
Monocyte-derived, immature dendritic cells were generated using the plastic adherence
method. Briefly, autologous pheresis samples were thawed, washed, set to 5-10e6
cells/ml with neat AIM-V media (Life Technologies) and then incubated at
approximately 1e6 cells/cm2 in an appropriate sized tissue culture flask and incubated at
37°C, 5% CO2. After 90 min, non-adherent cells were collected, and the flasks were
vigorously washed with AIM-V media, and then incubated with AIM-V media for
another 60 min. The flasks were then vigorously washed again with AIM-V media and
then the adherent cells were incubated with DC media. DC media comprised of RPMI
containing 5% human serum (collected and processed in-house), 100 U/ml penicillin and
100 µg/ml streptomycin, 2 mM L-glutamine, 800 IU/ml GM-CSF and 800 U/ml IL-4
(media supplements were from Life Technologies and cytokines were from Peprotech).
On day 3, fresh DC media was added to the cultures. Fresh or freeze/thawed DCs were
used in experiments on day 5-7 after initial stimulation. In all experiments, flow
cytometry was used to phenotype the cells for expression of CD11c, CD14, CD80, CD86,
and HLA-DR (all from BD Bioscience) to ensure that the cells were predominantly
immature DCs (CD11c+, CD14-, CD80low
, CD86+, and HLA-DR+; data not shown).
Antigen presenting B cells were generated using the CD40L and IL-4 stimulation
method. Briefly, human CD19-microbeads (Miltenyi Biotec) were used to positively
select B cells from autologous pheresis samples. CD19+ cells were then cultured with
irradiated (6000 rad) 3T3 cells stably expressing CD40L (3T3-CD40L) at approximately
a 1:1 ratio in B-cell media. B-cell media comprised of IMDM media (Life Technologies)
supplemented with 7.5-10% human serum (in-house), 100 U/ml penicillin and 100 µg/ml
streptomycin (Life Technologies), 10 µg/ml gentamicin (CellGro), 2 mM L-glutamine
(Life Technologies), and 200 U/ml IL-4 (Peprotech). Fresh B-cell media was added
starting on day 3, and media added or replaced every 2-3 days thereafter. Additional
irradiated 3T3-CD40L feeder cells were also added as required. Antigen presenting B
cells were typically used in experiments 2-3 weeks after initial stimulation.
Generation of in vitro transcribed RNA (IVT) RNA
Plasmids encoding the tandem minigenes were linearized with the restriction enzyme Sac
II. A control pcDNA3.1/V5-His-TOPO vector encoding GFP was linearized with Not I.
Restriction digests were terminated with EDTA, sodium acetate and ethanol precipitation.
Complete plasmid digestion was verified by standard agarose gel electrophoresis.
4
Approximately 1 µg of linearized plasmid was used for the generation of IVT RNA using
the mmessage mmachine T7 Ultra kit (Life Technologies) as directed by the
manufacturer. RNA was precipitated using the LiCl2 method, and RNA purity and
concentrations were assessed using a NanoDrop spectrophotometer. RNA was then
aliquoted into microtubes and stored at -80°C until use.
RNA transfections APCs (DCs or B cells) were harvested, washed 1x with PBS, and then resuspended in
Opti-MEM (Life Technologies) at 10-30e6 cells/ml. IVT RNA (4 µg or 8 µg) was
aliquoted to the bottom of a 2 mm gap electroporation cuvette, and 50 µl or 100 µl of
APCs were added directly to the cuvette. The final RNA concentration used in
electroporations was thus 80 µg/ml. Electroporations were carried out using a BTX-830
square wave electroporator. DCs were electroporated with 150 V, 10 ms, and 1 pulse, and
B cells were electroporated with 150 V, 20 ms, and 1 pulse. Transfection efficiencies
using these settings were routinely between 70-90% as assessed with GFP RNA (data not
shown). All steps were carried out at room temperature. Following electroporation, cells
were immediately transferred to polypropylene tubes containing DC- or B-cell media
supplemented with the appropriate cytokines. Transfected cells were incubated overnight
(12-14 h) at 37°C, 5% CO2. Cells were washed 1x with PBS prior to use in co-culture
assays.
Peptide pulsing
Autologous B cells were harvested, washed, and then resuspended at 1e6 cells/ml in B-
cell media supplemented with IL-4, and then incubated with 1 µg/ml of a 25-mer peptide
overnight (12-14 h) at 37°C, 5% CO2. After overnight pulsing, B cells were then washed
2x with PBS, and then resuspended in T-cell media and immediately used in co-culture
assays. The peptides used were: mutated ERBB2IP
(TSFLSINSKEETGHLENGNKYPNLE); wild-type ERBB2IP
(TSFLSINSKEETEHLENGNKYPNLE); and, as a negative control, mutated ALK
(RVLKGGSVRKLRHAKQLVLELGEEA). The mutated ERBB2IP peptide was
purchased from three different sources (GenScript, Peptide 2.0, and SelleckChem) with
all yielding the same in vitro results, while the wild-type ERBB2IP and mutated ALK
peptides were purchased from Peptide 2.0. For culturing allogeneic EBV-B cells, RPMI
media containing 10% FBS, 100 U/ml penicillin and 100 µg/ml streptomycin (Life
Technologies), 10 µg/ml gentamicin (CellGro), and 2 mM L-glutamine was used instead
of B-cell media.
T-cell sorting, expansion, and cloning
The BD FACSAria IIu and BD FACSJazz were used in all experiments requiring cell
sorting. In indicated experiments, sorted T cells were expanded using excess irradiated
(4000 rad) allogeneic feeder cells (pool of three different donor leukapheresis samples) in
50/50 media containing 30 ng/ml anti-CD3 antibody (OKT3) and 3000 IU/ml IL-2.
Limiting dilution cloning was carried out in 96-well round bottom plates using the above
stimulation conditions with 5e4 feeder cells per well and 1-2 T cells per well. Media was
exchanged starting at approximately 1 week post stimulation and then every other day or
as required. Cells were typically used in assays, or further expanded, at approximately 2-
5
3 weeks after the initial stimulation.
Co-culture assays: IFN-γ ELISPOT and ELISA, flow cytometry for cell surface
activation markers, and intracellular cytokine staining (ICS)
When DCs were used as APCs, approximately 3.5e4 to 7e4 DCs were used per well of a
96-well flat or round-bottom plate. When B cells were used as APCs, approximately 2e5
cells were used per well of a 96-well round-bottom plate. In ELISPOT assays, 1e3 to 1e4
effector T cells were used per well, and in flow cytometry assays, 1e5 effector T cells
were used per well. T cells were typically thawed and rested in IL-2 containing 50/50
media (3000 IU/ml IL-2) for two days and then washed with PBS (3x) prior to co-culture
assays. All co-cultures were performed in the absence of exogenously added cytokines.
For all assays, plate-bound OKT3 (0.1 µg/ml or 1 µg/ml) was used as a positive control.
In experiments involving HLA blocking antibodies, the following antibodies were used:
pan-class-II (clone: IVA12), pan-class-I (clone: W6/32), HLA-DR (clone: HB55), HLA-
DP (clone: B7/21), and HLA-DQ (clone: SPV-L3). Cells were blocked with 20-50 µg/ml
of the indicated antibody for 1-2 h at 37°C, 5% CO2 prior to co-culture with T cells. T4
are T cells that have been transduced with an HLA-DR4-restricted TCR that is reactive
against an epitope in tyrosinase. DMF5 is an HLA-A2-restricted T-cell line reactive
against MART-1. 624-CIITA is a HLA-A2 and HLA-DR4-positive melanoma cell line
that stably expresses MHC-II due to ectopic expression of CIITA (class II, major
histocompatibility complex, transactivator), and is positive for MART-1 and tyrosinase
expression.
For IFN- ELISPOT assays, briefly, ELIIP plates (Millipore, MAIPSWU) were pre-
treated with 50 µl of 70% ethanol per well for 2 min, washed 3x with PBS, and then
coated with 50 µl of 10 µg/ml IFN- capture antibody (Mabtech, clone: 1-D1K) and
incubated overnight in the fridge. For OKT3 controls, wells were coated with a mixture
of IFN- capture antibody (10 µg/ml) and OKT3 (1 µg/ml). Prior to co-culture, the plates
were washed 3x with PBS, followed by blocking with 50/50 media for at least 1 h at
room temperature (RT). After 20-24 h of co-culture, cells were flicked out of the plate,
washed 6x with PBS + 0.05% Tween-20 (PBS-T), and then incubated for 2 h at RT with
100 µl/well of a 0.22 µm filtered 1 µg/ml biotinylated anti-human IFN-γ detection
antibody solution (Mabtech, clone: 7-B6-1). The plate was then washed 3x with PBS-T,
followed by a 1 h incubation with 100 µl/well of streptavidin-ALP (Mabtech, diluted
1:3000). The plate was then washed 6x with PBS followed by development with 100
µl/well of 0.45 µm filtered BCIP/NBT substrate solution (KPL, Inc.). The reaction was
stopped by rinsing thoroughly with cold tap water. ELISPOT plates were scanned and
counted using an ImmunoSpot plate reader and associated software (Cellular
Technologies, Ltd).
Expression of the T-cell activation markers OX40 and 4-1BB was assessed by flow
cytometry at approximately t=22-26h post-stimulation. Briefly, cells were pelleted,
washed with FACS buffer (1X PBS supplemented with 1% FBS and 2 mM EDTA), and
then stained with the appropriate antibodies for approximately 30 min, at 4°C in the dark.
Cells were washed at least once with FACS buffer prior to acquisition on a BD
FACSCanto II flow cytometer. All data were gated on live (PI negative), single cells.
6
Cytokine production was assessed using intracellular cytokine staining (ICS) and flow
cytometry. Briefly, after target and effector cells were combined in the wells of a 96-well
plate, both GolgiStop and GolgiPlug were added to the culture (BD Biosciences).
GolgiStop and GolgiPlug were used at 1/2 of the concentration recommended by the
manufacturer. At t=6h post stimulation, cells were processed using the Cytofix/Cytoperm
kit (BD Biosciences) according to the manufacturer's instructions. Briefly, cells were
pelleted, washed with FACS buffer, and then stained for cell surface markers (described
above). Cells were then washed 2x with FACS buffer prior to fixation and
permeabilization. Cells were then washed with Perm/Wash buffer and stained with
antibodies against cytokines for 30 min, at 4°C in the dark. Cells were washed 2x with
Perm/Wash buffer and resuspended in FACS buffer prior to acquisition on a
FACSCantoII flow cytometer. All flow cytometry data were analyzed using FlowJo
software (TreeStar Inc).
IFN- in serum samples was detected using a human IFN- ELISA kit as directed by the
manufacturer (Thermo Scientific).
Flow cytometry antibodies The following titrated anti-human antibodies were used for cell surface staining: CCR7-
FITC (clone: 150503), CD45RO-PE-Cy7 (clone: UCHL1), CD62L-APC (clone: DREG-
56), CD27-APC-H7 (clone: M-T271), CD4-efluor 605NC (clone: OKT4), CD57-FITC
(clone: NK-1), CD28-PE-Cy7 (clone: CD28.2), CD127-APC (clone: eBioRDR5), CD3-
AF700 (clone: UCHT1), CD4-FITC, PE-Cy7, APC-H7 (clone: SK3), CD8-PE-Cy7
(clone: SK1), Vβ22-PE (clone: IMMU 546), Vβ5.2-PE (clone: 36213), OX40-PE-Cy7 or
FITC (clone: Ber-ACT35), 4-1BB-APC (clone: 4B4-1), and CD107a-APC-H7 (clone:
H4A3). All antibodies were from BD Biosciences, except CD4-efluor605NC
(eBioscience), Vβ22-PE and Vβ5.2-PE (Beckman Coulter), and 4-1BB-APC and OX40-
PE-Cy7 (BioLegend). The following optimally titrated anti-human antibodies were used
for intracellular cytokine staining: IFN- -FITC (clone: 4S.B3), IL-2-APC (clone: MQ1-
17H12), TNF-PerCPCy5.5 or APC (clone: MAb11), IL-17-PE (clone: eBio64DEC17),
and IL-4-PE-Cy7 (clone: 8D4-8). All ICS antibodies were from eBioscience except IL-4-
PE-Cy7 (BD Bioscience). The IO Mark Beta Mark TCR V kit was used to assess the
TCR-Vβ repertoire (Beckman Coulter).
Sequencing of the ERBB2IP mutation
Sanger sequencing was used to validate the ERBB2IP mutation found by whole-exomic
sequencing. Total RNA was extracted from snap frozen T cells or tumor tissues (OCT
block) using the RNeasy Mini kit (Qiagen). Total RNA was then reverse transcribed to
cDNA using ThermoScript reverse transcriptase with oligo-dT primers (Life
Technologies). Normal and tumor cDNA were then used as templates in a PCR with the
following ERBB2IP primers flanking the mutation: ERBB2IP Seq Forward: 5’—TGT
TGA CTC AAC AGC CAC AG—3’; and ERBB2IP Seq Reverse: 5’—CTG GAC CAC
TTT TCT GAG GG—3’. Phusion DNA polymerase (Thermo Scientific) was used with
the recommended 3-step protocol with a 58°C annealing temperature (15 sec) and a 72°C
extension (30 sec). PCR products were isolated by standard agarose gel electrophoresis
7
and gel extraction (Clontech). Products were directly sequenced using the same PCR
primers (Macrogen).
Quantitative PCR
Total RNA was extracted from snap frozen T cells or tumor tissues (OCT block) using
the RNeasy Mini kit (Qiagen). Total RNA was then reverse transcribed to cDNA using
qScript cDNA Supermix (Quanta Biosciences). Gene-specific Taqman primer and probe
sets for human β-actin (catalogue #: 401846) and ERBB2IP (catalogue #: 4331182) were
purchased from Life Technologies. Quantitative PCR was carried out with TaqMan Fast
Advanced Master Mix using the 7500 Fast Real Time PCR machine (both from Applied
Biosystems). Specificity of amplified products was verified by standard agarose gel
electrophoresis. All calculated threshold cycles (Ct) were 30 or below.
TCR-Vβ deep sequencing
TCR-Vβ deep sequencing was performed by immunoSEQ, Adaptive Biotechnologies
(Seattle, WA) on genomic DNA isolated from peripheral blood, T cells, and frozen tumor
tissue using the DNeasy blood and tissue kit (Qiagen). The number of total productive
TCR reads per sample ranged from 279, 482 to 934,672. Only productive TCR
rearrangements were used in the calculations of TCR frequencies.
TCR sequencing and construction of the ERBB2IP-mutation reactive TCR
T cells were pelleted and total RNA isolated (RNeasy Mini kit, Qiagen). Total RNA then
underwent 5’RACE as directed by manufacturer (SMARTer RACE cDNA amplification
kit, Clontech) using TCR-alpha and -beta chain constant primers. Program 1 of the kit
was used for the PCR, with a modification to the extension time (2 min instead of 3 min).
The sequences of the alpha and beta chain constant primers are: TCR-alpha, 5’—GCC
ACA GCA CTG TGC TCT TGA AGT CC—3’; TCR-beta, 5’—CAG GCA GTA TCT
GGA GTC ATT GAG—3. TCR PCR products were then isolated by standard agarose gel
electrophoresis and gel extraction (Clontech). Products were then either directly
sequenced or TOPO-TA cloned followed by sequencing of individual colonies
(Macrogen). For sequencing of known Vβ22+ T-cell clones, cDNA was generated from
RNA using qScript cDNA Supermix (Quanta Biosciences). These cDNAs then were used
as templates in a PCR using the TCR-beta constant primer (above) and the Vβ22-specific
primer: 5’—CAC CAT GGA TAC CTG GCT CGT ATG C—3’. PCR products were
isolated by standard agarose gel electrophoresis and gel extraction (Clontech). Products
were directly sequenced (Macrogen) using the nested TCR-beta chain constant primer:
5’—ATT CAC CCA CCA GCT CAG—3’. Construction of the Vβ22+ ERBB2IP-mutation TCR was done by fusing the Vβ22+
TCR-alpha V-D-J regions to the mouse TCR-alpha constant chain, and the Vβ22+ TCR-
beta-V-D-J regions to the mouse TCR-beta constant chains. The alpha and beta chains
were separated by a furin SGSG P2A linker. Use of mouse TCR constant regions
promotes pairing of the introduced TCR and also facilitates identification of positively
transduced T cells by flow cytometry using an antibody specific for the mouse TCR-β
chain (eBioscience).The TCR construct was synthesized and cloned into the MSGV1
retroviral vector (Gene Oracle).
8
TCR transduction of peripheral blood T cells
Autologous pheresis samples were thawed and set to 2e6 cells/ml in T-cell media, which
consists of a 50/50 mixture of RPMI and AIM-V media supplemented with 5% in-house
human serum, 10 µg/ml gentamicin (CellGro), 100 U/ml penicillin and 100 µg/ml
streptomycin, 1.25 µg/ml amphotericin B (Fungizone) and 2 mM L-glutamine (all from
Life Technologies). 2e6 cells (1 ml) were stimulated in a 24-well plate with 50 ng/ml
soluble OKT3 (Miltenyi Biotec) and 300 IU/ml rhu IL-2 (Chiron) for 2 days prior to
retroviral transduction. To generate transient retroviral supernatants, the retroviral vector
MSGV1 encoding the Vβ22-positive, ERBB2IP-mutation-specific TCR (1.5 µg/well) and
the envelope encoding plasmid RD114 (0.75 µg/well) were co-transfected into the
retroviral packaging cell line 293GP (1e6 cells per well of a 6-well poly-D-lysine–coated
plates, plated the day prior to transfection) using Lipofectamine 2000 (Life
Technologies). Retroviral supernatants were collected at 42-48 h after transfection,
diluted 1:1 with DMEM media, and then centrifuged onto Retronectin-coated (10 µg/ml,
Takara), non–tissue culture–treated 6-well plates at 2,000 g for 2 h at 32°C. Activated T
cells (2e6 per well, at 0.5e6 cells/ml in IL-2 containing T-cell media) were then spun onto
the retrovirus plates for 10 min at 300 g. Activated T cells were transduced overnight,
removed from the plates and further cultured in IL-2 containing T-cell media. GFP and
mock transduction controls were included in transduction experiments. Cells were
typically assayed 10-14 days post-retroviral transduction.
9
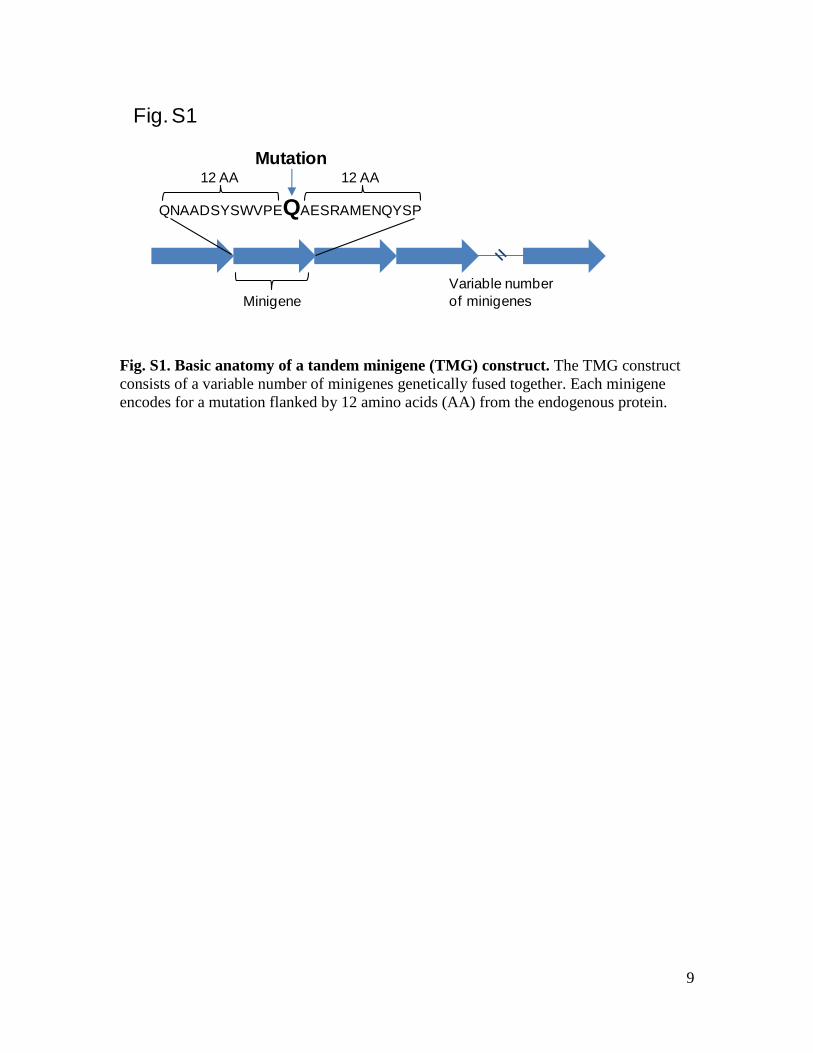
Fig. S1. Basic anatomy of a tandem minigene (TMG) construct. The TMG construct
consists of a variable number of minigenes genetically fused together. Each minigene
encodes for a mutation flanked by 12 amino acids (AA) from the endogenous protein.
Fig. S1
Minigene
QNAADSYSWVPEQAESRAMENQYSP
12 AA 12 AA
Mutation
Variable number
of minigenes
10
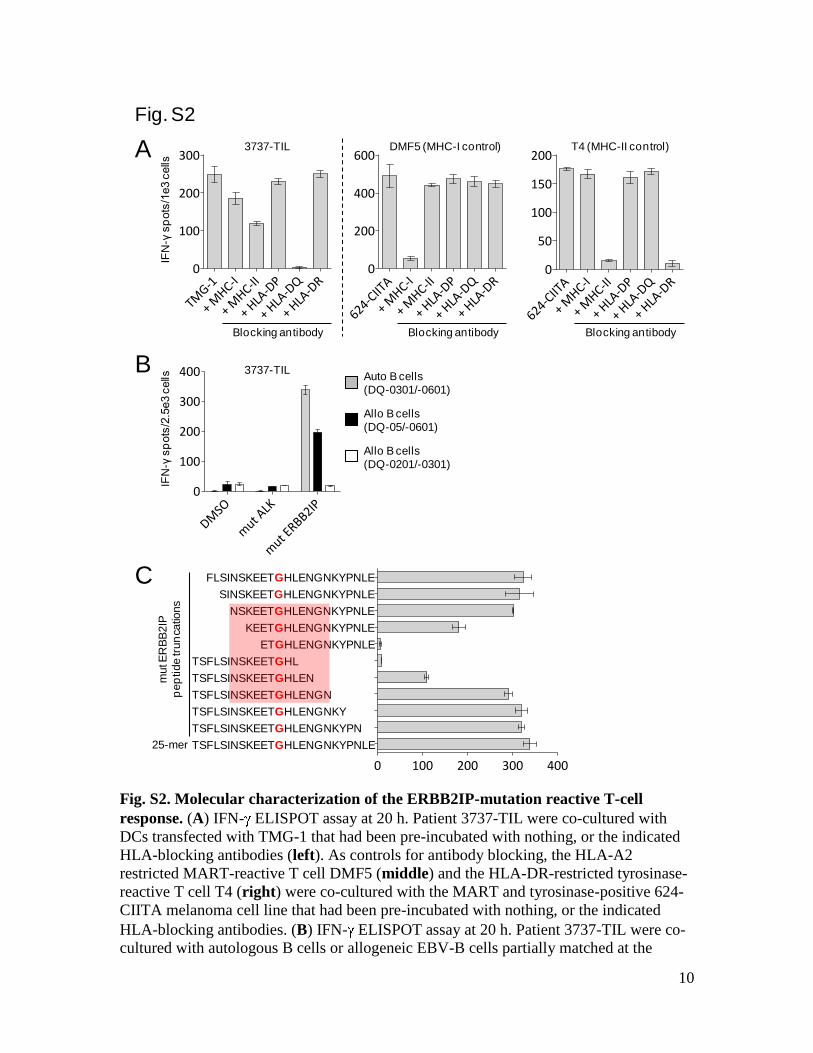
Fig. S2. Molecular characterization of the ERBB2IP-mutation reactive T-cell
response. (A) IFN- ELISPOT assay at 20 h. Patient 3737-TIL were co-cultured with
DCs transfected with TMG-1 that had been pre-incubated with nothing, or the indicated
HLA-blocking antibodies (left). As controls for antibody blocking, the HLA-A2
restricted MART-reactive T cell DMF5 (middle) and the HLA-DR-restricted tyrosinase-
reactive T cell T4 (right) were co-cultured with the MART and tyrosinase-positive 624-
CIITA melanoma cell line that had been pre-incubated with nothing, or the indicated
HLA-blocking antibodies. (B) IFN- ELISPOT assay at 20 h. Patient 3737-TIL were co-
cultured with autologous B cells or allogeneic EBV-B cells partially matched at the
13Nov13 Minimal epitope
0 100 200 300 400
TSFLSINSKEETGHLENGNKYPNLETSFLSINSKEETGHLENGNKYPN
TSFLSINSKEETGHLENGNKYTSFLSINSKEETGHLENGN
TSFLSINSKEETGHLENTSFLSINSKEETGHL
ETGHLENGNKYPNLEKEETGHLENGNKYPNLE
NSKEETGHLENGNKYPNLESINSKEETGHLENGNKYPNLE
FLSINSKEETGHLENGNKYPNLE
IFN- spots/2.5e3 cells
Pep
tid
e
FOR Paper 13Nov13 Infusion+SLP+B cells
DMSO
mut A
LK
mut E
RBB2IP0
100
200
300
400 Auto-DQ-0601/-0301
Allo-DQ-0601/-05
Allo-DQ-0201/-0301
Bachini infusion bag T cellsco-cultured with indicated peptide andB cell
IFN
- s
po
ts/2
.5e3
cel
ls
IFN-g ELISPOT: T4 controls for Bachini minigenes exp't
624-CIIT
A
+ MHC-I
+ MHC-II
+ HLA
-DP
+ HLA
-DQ
+ HLA
-DR
0
50
100
150
200
IFN
- s
po
ts/1
e3 c
ells
IFN-g ELISPOT: DMF5 controls for Bachini minigenes exp't
624-CIIT
A
+ MHC-I
+ MHC-II
+ HLA
-DP
+ HLA
-DQ
+ HLA
-DR
0
200
400
600
IFN
- s
po
ts/1
e3 c
ells
IFN-g ELISPOT: DCs blocking experiment
TMG-1
+ MHC-I
+ MHC-II
+ HLA
-DP
+ HLA
-DQ
+ HLA
-DR
0
100
200
300
est. 50K DC per well
IFN
- s
po
ts/1
e3 c
ells
Fig. S2
A
B
Blocking antibody
DMF5 (MHC-I control) T4 (MHC-II control)3737-TIL
Blocking antibodyBlocking antibody
3737-TILAuto B cells
(DQ-0301/-0601)
Allo B cells
(DQ-05/-0601)
Allo B cells
(DQ-0201/-0301)
C
TSFLSINSKEETGHLENGNKYPNLE
TSFLSINSKEETGHLENGNKYPN
TSFLSINSKEETGHLENGNKY
TSFLSINSKEETGHLENGN
TSFLSINSKEETGHLEN
TSFLSINSKEETGHL
FLSINSKEETGHLENGNKYPNLE
SINSKEETGHLENGNKYPNLE
NSKEETGHLENGNKYPNLE
KEETGHLENGNKYPNLE
ETGHLENGNKYPNLE
25-mer
mut E
RB
B2IP
pep
tide tr
un
catio
ns
IFN
-γ s
pots
/2.5
e3 c
ells
IFN
-γ s
pots
/1e3 c
ells
11
HLA-DQ locus that had been pulsed overnight with DMSO, mutated (mut) ALK or mut
ERBB2IP 25-AA long peptides. (C) IFN- ELISPOT assay at 20 h. Patient 3737-TIL
were co-cultured with autologous B cells that had been pulsed overnight with the mut
ERBB2IP 25-AA peptide, or the indicated truncated mut ERBB2IP peptides. All data is
representative of 2 independent experiments.
12
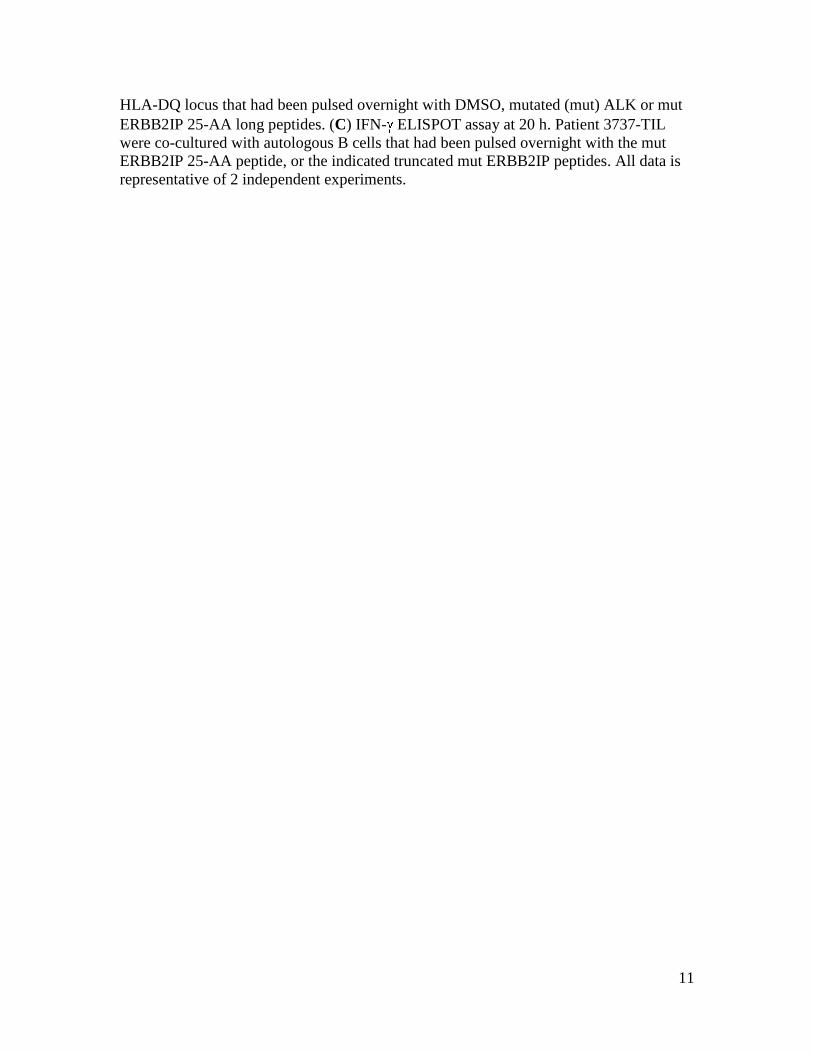
Fig. S3. Assessing clonality of ERBB2IP mutation-reactive CD4+ T cells. (A) Patient
3737-TIL were co-cultured with DCs transfected with nothing (Mock) or TMG-1. CD4+
T cells that upregulated OX40 at t = 24 h (red box) were sorted by FACS and then
expanded in bulk (B) or cloned by limiting dilution (C) using irradiated allogeneic
feeders in the presence of anti-CD3 antibody (OKT3, 30 ng/ml) and IL-2 (3000 IU/ml).
Flow-cytometry based TCR-Vβ repertoire analysis was performed on (B) and Vβ22-
specific staining was done on (C). Data are gated on live CD3+ cells.
CD4+OX40+ (99.3% CD4+, 0.06% CD8+)
TCR V
% P
osi
tive
37
.15
.3 16
17 9
20
5.1 18 8
13
.61
3.1 12 2
5.2
21
.3 12
31
42
21
17
.2 41
3.2
0
20
40
60
80
100A
Fig. S3
Mock TMG-1
CD4
OX
40
B
Limiting
Dilution
Cloning
Bulk
Expansion
Clone #1 Clone #2 Clone #3 Clone #4 Clone #5 Clone #6
Clone #7 Clone #8 Clone #9 Clone #10 Clone #11
Vβ22
CD
4
CTCR Vβ
13
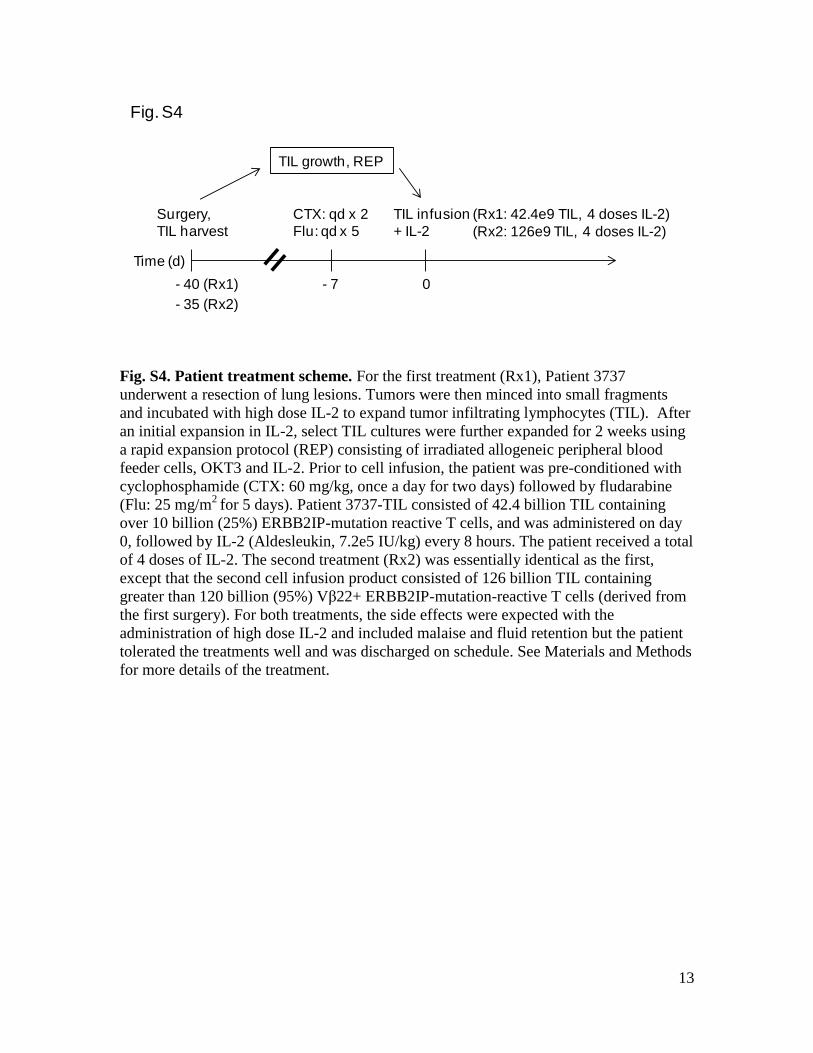
Fig. S4. Patient treatment scheme. For the first treatment (Rx1), Patient 3737
underwent a resection of lung lesions. Tumors were then minced into small fragments
and incubated with high dose IL-2 to expand tumor infiltrating lymphocytes (TIL). After
an initial expansion in IL-2, select TIL cultures were further expanded for 2 weeks using
a rapid expansion protocol (REP) consisting of irradiated allogeneic peripheral blood
feeder cells, OKT3 and IL-2. Prior to cell infusion, the patient was pre-conditioned with
cyclophosphamide (CTX: 60 mg/kg, once a day for two days) followed by fludarabine
(Flu: 25 mg/m2
for 5 days). Patient 3737-TIL consisted of 42.4 billion TIL containing
over 10 billion (25%) ERBB2IP-mutation reactive T cells, and was administered on day
0, followed by IL-2 (Aldesleukin, 7.2e5 IU/kg) every 8 hours. The patient received a total
of 4 doses of IL-2. The second treatment (Rx2) was essentially identical as the first,
except that the second cell infusion product consisted of 126 billion TIL containing
greater than 120 billion (95%) Vβ22+ ERBB2IP-mutation-reactive T cells (derived from
the first surgery). For both treatments, the side effects were expected with the
administration of high dose IL-2 and included malaise and fluid retention but the patient
tolerated the treatments well and was discharged on schedule. See Materials and Methods
for more details of the treatment.
Time (d)
- 40 (Rx1)
Surgery,
TIL harvest
- 7
CTX: qd x 2
Flu: qd x 5
0
TIL infusion
+ IL-2
TIL growth, REP
Fig. S4
- 35 (Rx2)
(Rx1: 42.4e9 TIL, 4 doses IL-2)
(Rx2: 126e9 TIL, 4 doses IL-2)
14
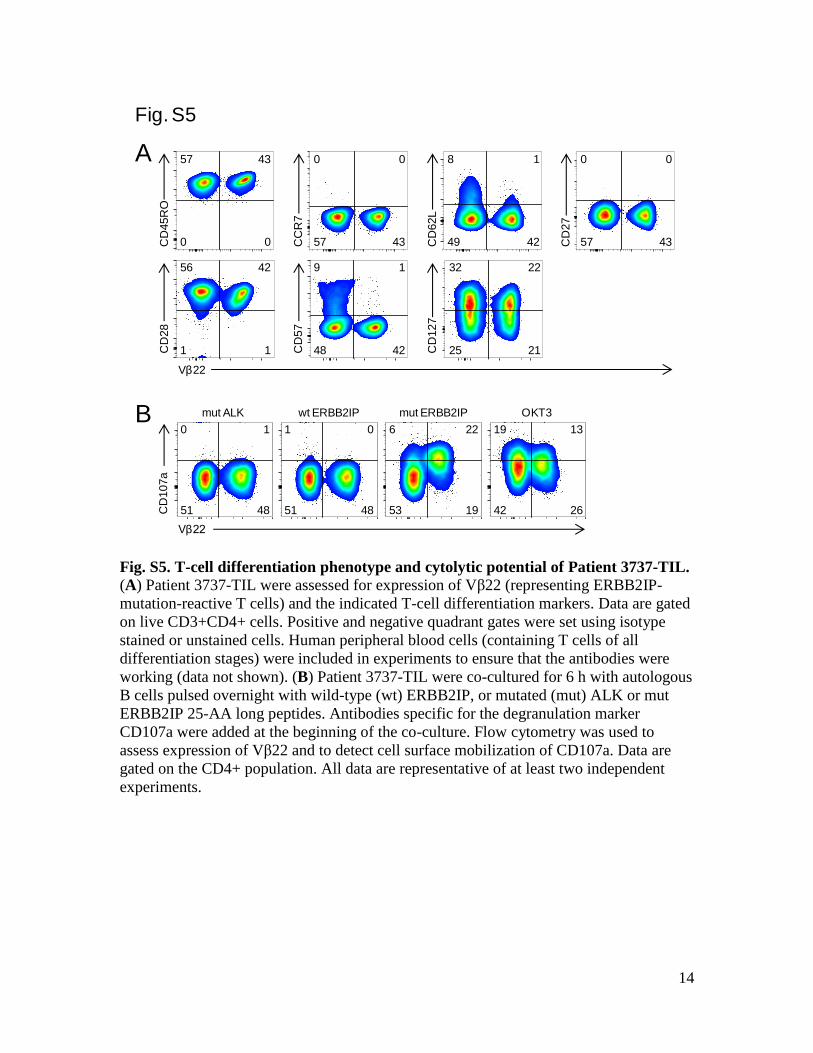
Fig. S5. T-cell differentiation phenotype and cytolytic potential of Patient 3737-TIL.
(A) Patient 3737-TIL were assessed for expression of Vβ22 (representing ERBB2IP-
mutation-reactive T cells) and the indicated T-cell differentiation markers. Data are gated
on live CD3+CD4+ cells. Positive and negative quadrant gates were set using isotype
stained or unstained cells. Human peripheral blood cells (containing T cells of all
differentiation stages) were included in experiments to ensure that the antibodies were
working (data not shown). (B) Patient 3737-TIL were co-cultured for 6 h with autologous
B cells pulsed overnight with wild-type (wt) ERBB2IP, or mutated (mut) ALK or mut
ERBB2IP 25-AA long peptides. Antibodies specific for the degranulation marker
CD107a were added at the beginning of the co-culture. Flow cytometry was used to
assess expression of Vβ22 and to detect cell surface mobilization of CD107a. Data are
gated on the CD4+ population. All data are representative of at least two independent
experiments.
Fig. S5
CD
45R
OC
D28
Vβ22
CC
R7
CD
57
CD
62L
CD
127
CD
27
57 43
0 0
0 0
57 43
8 1
49 42
0 0
57 43
56 42
1 1
9 1
48 42
32 22
25 21
A
B
Vβ22
mut ALK mut ERBB2IPwt ERBB2IP OKT3
CD
107a
0 1
51 48
1 0
51 48
6 22
53 19
19 13
42 26
15
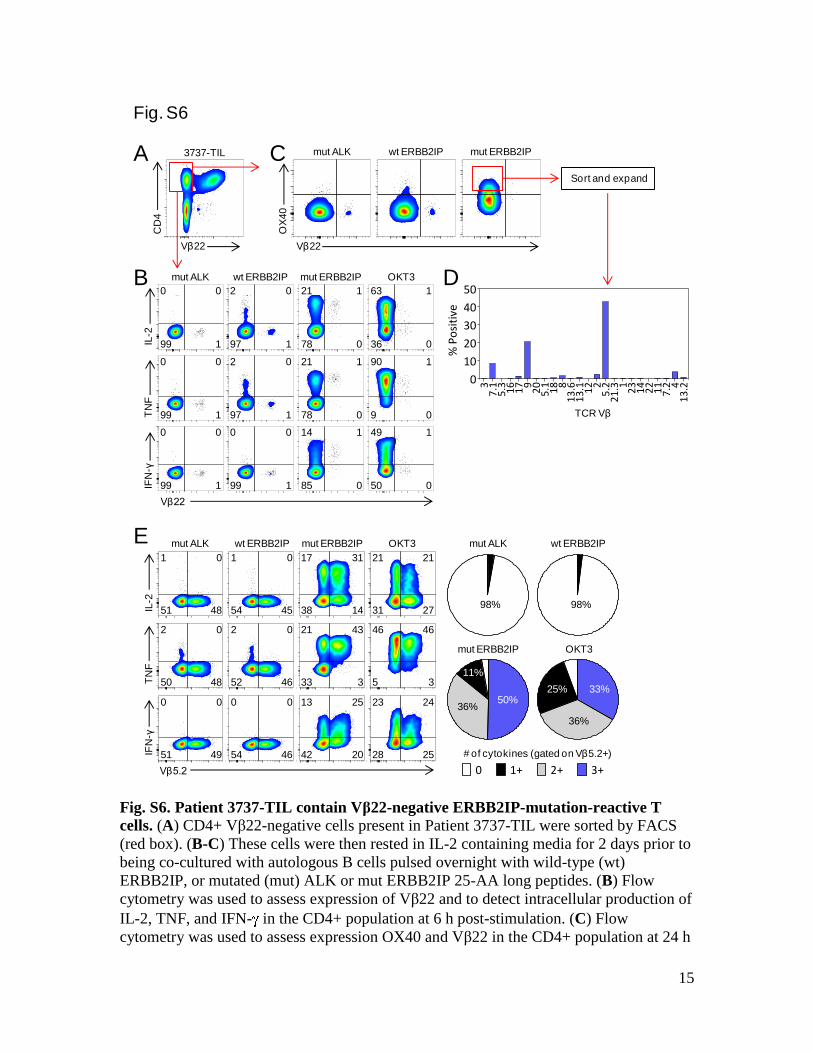
Fig. S6. Patient 3737-TIL contain Vβ22-negative ERBB2IP-mutation-reactive T
cells. (A) CD4+ Vβ22-negative cells present in Patient 3737-TIL were sorted by FACS
(red box). (B-C) These cells were then rested in IL-2 containing media for 2 days prior to
being co-cultured with autologous B cells pulsed overnight with wild-type (wt)
ERBB2IP, or mutated (mut) ALK or mut ERBB2IP 25-AA long peptides. (B) Flow
cytometry was used to assess expression of Vβ22 and to detect intracellular production of
IL-2, TNF, and IFN- in the CD4+ population at 6 h post-stimulation. (C) Flow
cytometry was used to assess expression OX40 and Vβ22 in the CD4+ population at 24 h
Vb22 neg (sorted on OX40+ after ERBB2IP stim)
TCR V
% P
osi
tive
37
.15
.3 16
17 9
20
5.1 18 8
13
.61
3.1 12 2
5.2
21
.3 12
31
42
21
17
.2 41
3.2
0
10
20
30
40
50D
Vβ22
CD
4A
Vβ22
mut ALK mut ERBB2IPwt ERBB2IP OKT3
IL-2
IFN
-γT
NF
B0 0
99 1
0 0
99 1
0 0
99 1
2 0
97 1
2 0
97 1
0 0
99 1
21 1
78 0
21 1
78 0
14 1
85 0
63 1
36 0
90 1
9 0
49 1
50 0
C3737-TIL
OX
40
Vβ22
mut ALK wt ERBB2IP mut ERBB2IP
Sort and expand
TCR Vβ
Fig. S6
OKT3
3+2+1+0
mut ALK
3+
2+
1+
0
wt ERBB2IP
3+
2+
1+
0
mut ERBB2IP
3+
2+
1+
0
OKT3
3+
2+
1+
0
E
Vβ5.2
mut ALK mut ERBB2IPwt ERBB2IP OKT3
IL-2
IFN
-γT
NF
1 0
51 48
1 0
54 45
17 31
38 14
21 21
31 27
2 0
50 48
2 0
52 46
21 43
33 3
46 46
5 3
0 0
51 49
0 0
54 46
13 25
42 20
23 24
28 25
mut ALK
mut ERBB2IP
wt ERBB2IP
OKT3
# of cytokines (gated on Vβ5.2+)
98% 98%
50%
11%
36%
33%25%
36%
16
post stimulation. Cells that upregulated OX40 were sorted (red box) and expanded, and
the TCR-Vβ repertoire was analyzed by flow cytometry (D). Data are gated on live CD4+
cells. (E) The sorted cells described in (D) were co-cultured for 6 h with autologous B
cells pulsed overnight with wt ERBB2IP, or mut ALK or mut ERBB2IP 25-AA long
peptides. Flow cytometry was used to assess expression of Vβ5.2 and to detect
intracellular production of IL-2, TNF, and IFN- in the CD4+ population. Pie charts
display the percentage of Vβ5.2+ cells that expressed the indicated number of cytokines.
17
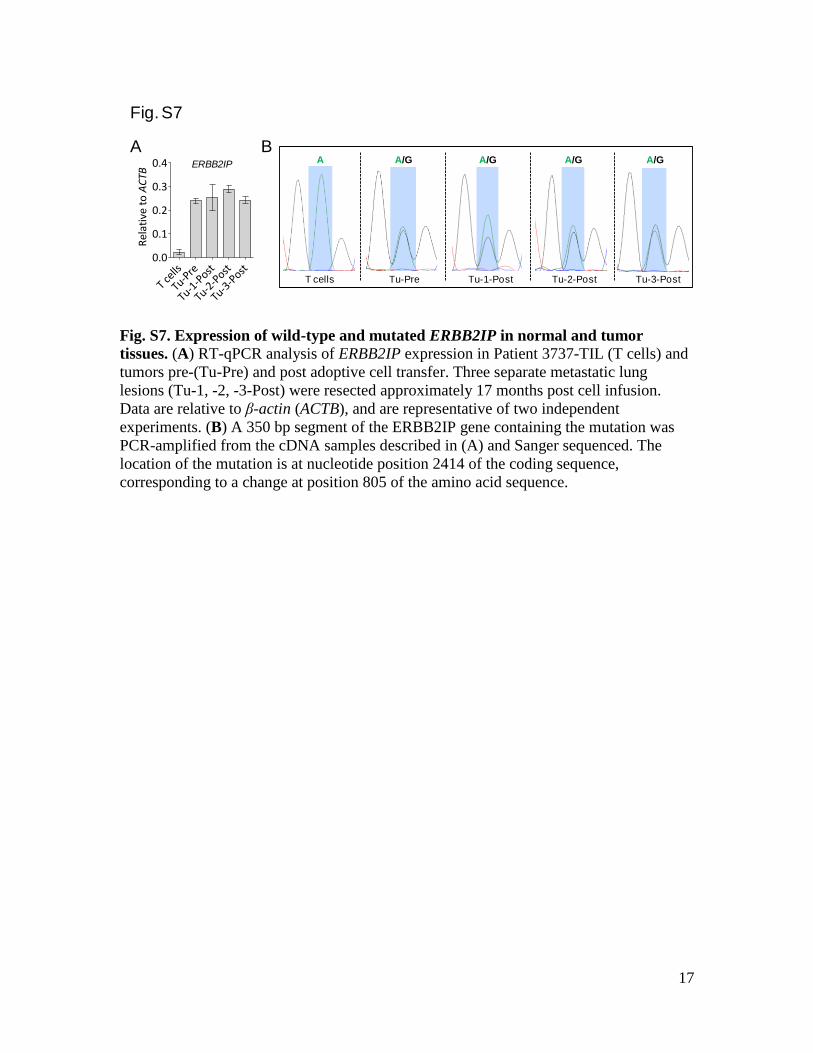
Fig. S7. Expression of wild-type and mutated ERBB2IP in normal and tumor
tissues. (A) RT-qPCR analysis of ERBB2IP expression in Patient 3737-TIL (T cells) and
tumors pre-(Tu-Pre) and post adoptive cell transfer. Three separate metastatic lung
lesions (Tu-1, -2, -3-Post) were resected approximately 17 months post cell infusion.
Data are relative to β-actin (ACTB), and are representative of two independent
experiments. (B) A 350 bp segment of the ERBB2IP gene containing the mutation was
PCR-amplified from the cDNA samples described in (A) and Sanger sequenced. The
location of the mutation is at nucleotide position 2414 of the coding sequence,
corresponding to a change at position 805 of the amino acid sequence.
Bachini OCT tumor: ERBB2IP RT-QPCR
Rel
ativ
e to
ACTB
T cells
Tu-Pre
Tu-1-P
ost
Tu-2-P
ost
Tu-3-P
ost0.0
0.1
0.2
0.3
0.4
Fig. S7
A
T cells Tu-Pre
A A/GB
Tu-1-Post Tu-2-Post Tu-3-Post
A/G A/G A/GERBB2IP
18
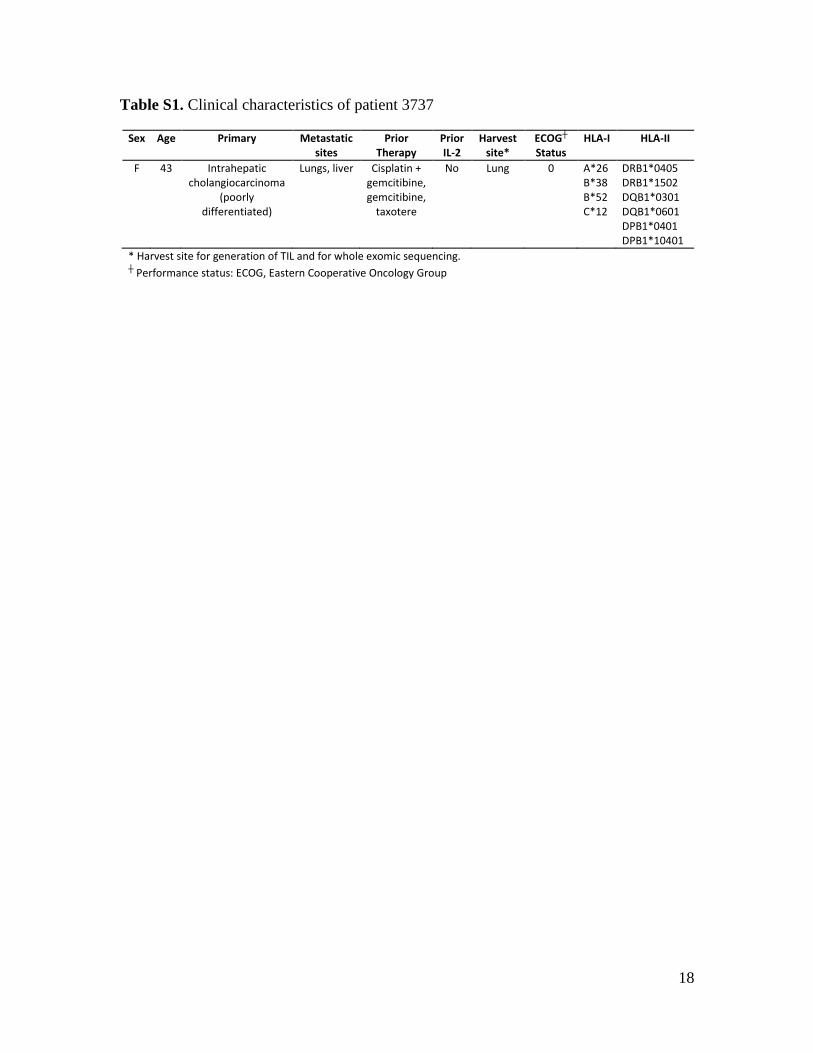
Table S1. Clinical characteristics of patient 3737
Sex Age Primary Metastatic sites
Prior Therapy
Prior IL-2
Harvest site*
ECOG┼ Status
HLA-I HLA-II
F 43 Intrahepatic cholangiocarcinoma
(poorly differentiated)
Lungs, liver Cisplatin + gemcitibine, gemcitibine,
taxotere
No Lung 0 A*26 B*38 B*52 C*12
DRB1*0405 DRB1*1502 DQB1*0301 DQB1*0601 DPB1*0401 DPB1*10401
* Harvest site for generation of TIL and for whole exomic sequencing. ┼ Performance status: ECOG, Eastern Cooperative Oncology Group

19
Table S2. Somatic mutations identified by whole-exome sequencing of a metastatic lung
nodule* from Patient 3737
Gene
Symbol Gene Description Transcript
Accession Mutation Position Mutation
Type Consequence %
Mutant
Reads*
Nucleotide (genomic)
Amino Acid
(protein)
ALK anaplastic lymphoma receptor tyrosine kinase
CCDS33172.1 chr2_29996620-29996620_C_T
137R>H Substitution Nonsynonymous coding
30%
AR androgen receptor CCDS14387.1 chrX_66858483-66858483__C
NA Insertion Frameshift 31%
CD93 CD93 molecule CCDS13149.1 chr20_23012929-23012929_C_T
634R>Q Substitution Nonsynonymous coding
26%
DIP2C DIP2 disco-interacting protein 2 homolog C
(Drosophila)
CCDS7054.1 chr10_365545-365545_C_T
NA Substitution Splice site acceptor
25%
ERBB2IP erbb2 interacting protein
CCDS3990.1 chr5_65385316-65385316_A_G
805E>G Substitution Nonsynonymous coding
59%
FCER1A Fc fragment of IgE; high affinity I; receptor for;
alpha polypeptide
CCDS1184.1 chr1_157544227-157544227_G_C
219D>H Substitution Nonsynonymous coding
30%
GRXCR1 glutaredoxin; cysteine rich 1
CCDS43225.1 chr4_42590102-42590102_C_T
21A>V Substitution Nonsynonymous coding
18%
HLA-DOA HLA class II histocompatibility
antigen, DO alpha chain precursor
CCDS4763.1 chr6_33085209-33085209_C_T
NA Substitution Splice site donor 36%
KIF9 kinesin family member 9
CCDS2752.1 chr3_47287859-47287859_T_C
155T>A Substitution Nonsynonymous coding
20%
KLHL6 kelch-like 6 (Drosophila) CCDS3245.2 chr3_184692410-184692413_CAGA_
NA Deletion Frameshift 20%
LHX9 LIM homeobox 9 CCDS1393.1 chr1_196164923-196164923_A_
NA Deletion Frameshift 21%
LONRF3 LON peptidase N-terminal domain and
ring finger 3
CCDS35374.1 chrX_118007666-118007666_A_C
NA Substitution Splice site donor 10%
NAGS N-acetylglutamate synthase
CCDS11473.1 chr17_39440355-39440355_G_A
412R>H Substitution Nonsynonymous coding
29%
NLRP2 NLR family; pyrin domain containing 2
CCDS12913.1 chr19_60186650-60186650_G_T
591S>I Substitution Nonsynonymous coding
32%
PDZD2 PDZ domain containing 2
CCDS34137.1 chr5_32124833-32124833_A_
NA Deletion Frameshift 30%
POU5F2 POU domain, class 5, transcription factor 2
NM_153216 chr5_93102847-93102847_A_C
60V>G Substitution Nonsynonymous coding
34%
RAC3 ras-related C3 botulinum toxin
substrate 3 (rho family; small GTP binding
protein Rac3)
CCDS11798.1 chr17_77584690-77584690_C_A
125T>N Substitution Nonsynonymous coding
27%
RAP1GDS1 RAP1; GTP-GDP dissociation stimulator
1
CCDS43253.1 chr4_99532209-99532209_C_A
198L>I Substitution Nonsynonymous coding
19%
RASA1 RAS p21 protein activator (GTPase
activating protein) 1
CCDS34200.1 chr5_86703757-86703757_C_T
589R>C Substitution Nonsynonymous coding
63%
RETSAT retinol saturase (all-trans-retinol 13;14-
reductase)
CCDS1972.1 chr2_85424308-85424308_C_T
553R>K Substitution Nonsynonymous coding
11%
SEC24D SEC24 family; member D (S. cerevisiae)
CCDS3710.1 chr4_119872085-119872085_A_G
901M>T Substitution Nonsynonymous coding
18%
SENP3 SUMO1/sentrin/SMT3 specific peptidase 3
ENST00000321337 chr17_7408824-7408824_A_G
292M>V Substitution Nonsynonymous coding
33%
SLIT1 slit homolog 1 (Drosophila)
CCDS7453.1 chr10_98753840-98753840_G_C
1280N>K Substitution Nonsynonymous coding
45%

20
TARBP1 TAR (HIV-1) RNA binding protein 1
CCDS1601.1 chr1_232649342-232649342_C_A
655G>V Substitution Nonsynonymous coding
18%
TGM6 transglutaminase 6 CCDS13025.1 chr20_2332325-2332325_G_A
398D>N Substitution Nonsynonymous coding
51%
TTC39C tetratricopeptide repeat domain 39C
CCDS32804.1 chr18_19966475-19966475_A_C
503N>T Substitution Nonsynonymous coding
24%
* The tumor nodule was estimated to be approximately 70% tumor by pathological analysis of an H&E stained section.
21
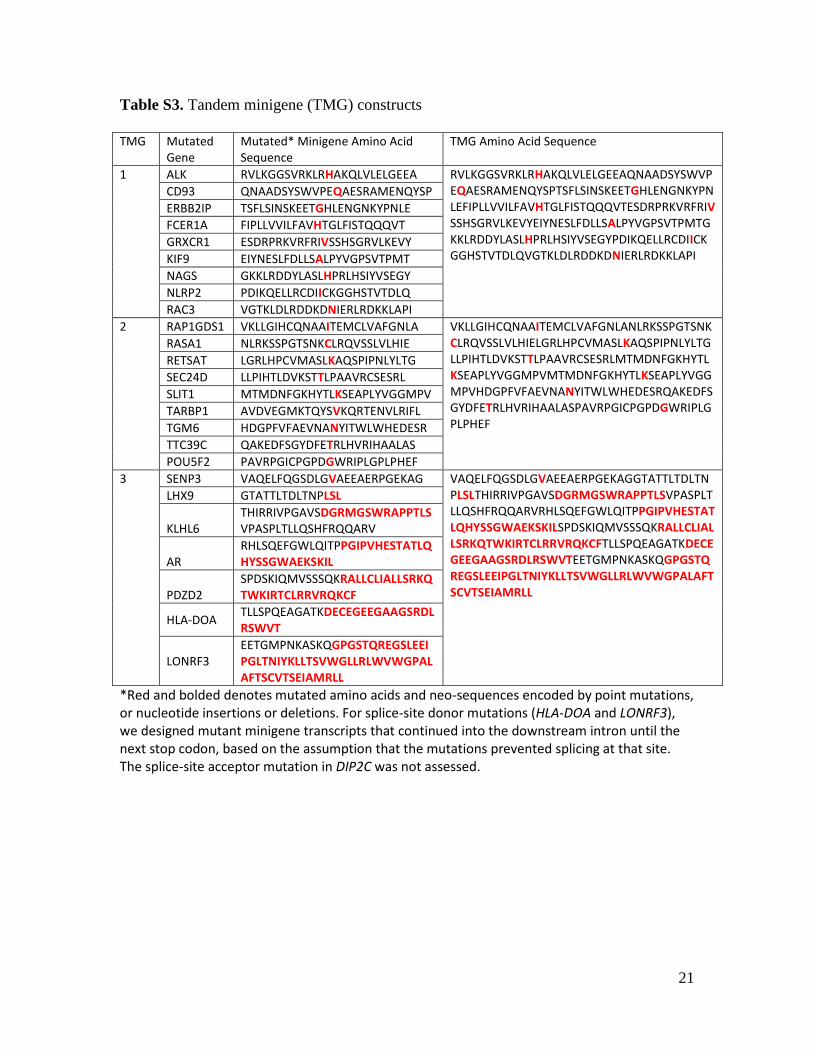
Table S3. Tandem minigene (TMG) constructs
TMG Mutated
Gene Mutated* Minigene Amino Acid Sequence
TMG Amino Acid Sequence
1 ALK RVLKGGSVRKLRHAKQLVLELGEEA RVLKGGSVRKLRHAKQLVLELGEEAQNAADSYSWVPEQAESRAMENQYSPTSFLSINSKEETGHLENGNKYPNLEFIPLLVVILFAVHTGLFISTQQQVTESDRPRKVRFRIVSSHSGRVLKEVYEIYNESLFDLLSALPYVGPSVTPMTGKKLRDDYLASLHPRLHSIYVSEGYPDIKQELLRCDIICKGGHSTVTDLQVGTKLDLRDDKDNIERLRDKKLAPI
CD93 QNAADSYSWVPEQAESRAMENQYSP
ERBB2IP TSFLSINSKEETGHLENGNKYPNLE
FCER1A FIPLLVVILFAVHTGLFISTQQQVT
GRXCR1 ESDRPRKVRFRIVSSHSGRVLKEVY
KIF9 EIYNESLFDLLSALPYVGPSVTPMT
NAGS GKKLRDDYLASLHPRLHSIYVSEGY
NLRP2 PDIKQELLRCDIICKGGHSTVTDLQ
RAC3 VGTKLDLRDDKDNIERLRDKKLAPI
2 RAP1GDS1 VKLLGIHCQNAAITEMCLVAFGNLA VKLLGIHCQNAAITEMCLVAFGNLANLRKSSPGTSNKCLRQVSSLVLHIELGRLHPCVMASLKAQSPIPNLYLTGLLPIHTLDVKSTTLPAAVRCSESRLMTMDNFGKHYTLKSEAPLYVGGMPVMTMDNFGKHYTLKSEAPLYVGGMPVHDGPFVFAEVNANYITWLWHEDESRQAKEDFSGYDFETRLHVRIHAALASPAVRPGICPGPDGWRIPLGPLPHEF
RASA1 NLRKSSPGTSNKCLRQVSSLVLHIE
RETSAT LGRLHPCVMASLKAQSPIPNLYLTG
SEC24D LLPIHTLDVKSTTLPAAVRCSESRL
SLIT1 MTMDNFGKHYTLKSEAPLYVGGMPV
TARBP1 AVDVEGMKTQYSVKQRTENVLRIFL
TGM6 HDGPFVFAEVNANYITWLWHEDESR
TTC39C QAKEDFSGYDFETRLHVRIHAALAS
POU5F2 PAVRPGICPGPDGWRIPLGPLPHEF
3 SENP3 VAQELFQGSDLGVAEEAERPGEKAG VAQELFQGSDLGVAEEAERPGEKAGGTATTLTDLTNPLSLTHIRRIVPGAVSDGRMGSWRAPPTLSVPASPLTLLQSHFRQQARVRHLSQEFGWLQITPPGIPVHESTATLQHYSSGWAEKSKILSPDSKIQMVSSSQKRALLCLIALLSRKQTWKIRTCLRRVRQKCFTLLSPQEAGATKDECEGEEGAAGSRDLRSWVTEETGMPNKASKQGPGSTQREGSLEEIPGLTNIYKLLTSVWGLLRLWVWGPALAFTSCVTSEIAMRLL
LHX9 GTATTLTDLTNPLSL
KLHL6 THIRRIVPGAVSDGRMGSWRAPPTLSVPASPLTLLQSHFRQQARV
AR RHLSQEFGWLQITPPGIPVHESTATLQHYSSGWAEKSKIL
PDZD2 SPDSKIQMVSSSQKRALLCLIALLSRKQTWKIRTCLRRVRQKCF
HLA-DOA TLLSPQEAGATKDECEGEEGAAGSRDLRSWVT
LONRF3 EETGMPNKASKQGPGSTQREGSLEEIPGLTNIYKLLTSVWGLLRLWVWGPALAFTSCVTSEIAMRLL
*Red and bolded denotes mutated amino acids and neo-sequences encoded by point mutations, or nucleotide insertions or deletions. For splice-site donor mutations (HLA-DOA and LONRF3), we designed mutant minigene transcripts that continued into the downstream intron until the next stop codon, based on the assumption that the mutations prevented splicing at that site. The splice-site acceptor mutation in DIP2C was not assessed.
22
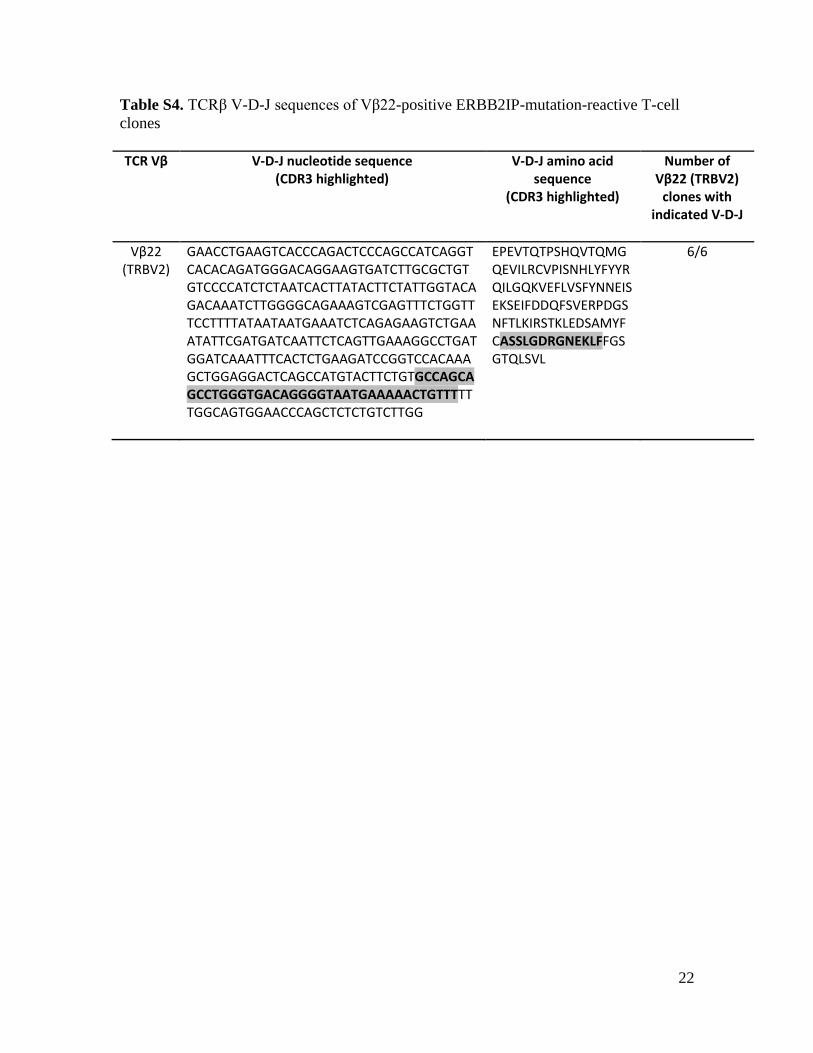
Table S4. TCRβ V-D-J sequences of Vβ22-positive ERBB2IP-mutation-reactive T-cell
clones
TCR Vβ V-D-J nucleotide sequence (CDR3 highlighted)
V-D-J amino acid sequence
(CDR3 highlighted)
Number of Vβ22 (TRBV2)
clones with indicated V-D-J
Vβ22 (TRBV2)
GAACCTGAAGTCACCCAGACTCCCAGCCATCAGGTCACACAGATGGGACAGGAAGTGATCTTGCGCTGTGTCCCCATCTCTAATCACTTATACTTCTATTGGTACAGACAAATCTTGGGGCAGAAAGTCGAGTTTCTGGTTTCCTTTTATAATAATGAAATCTCAGAGAAGTCTGAAATATTCGATGATCAATTCTCAGTTGAAAGGCCTGATGGATCAAATTTCACTCTGAAGATCCGGTCCACAAAGCTGGAGGACTCAGCCATGTACTTCTGTGCCAGCAGCCTGGGTGACAGGGGTAATGAAAAACTGTTTTTTGGCAGTGGAACCCAGCTCTCTGTCTTGG
EPEVTQTPSHQVTQMGQEVILRCVPISNHLYFYYRQILGQKVEFLVSFYNNEISEKSEIFDDQFSVERPDGSNFTLKIRSTKLEDSAMYFCASSLGDRGNEKLFFGSGTQLSVL
6/6
23
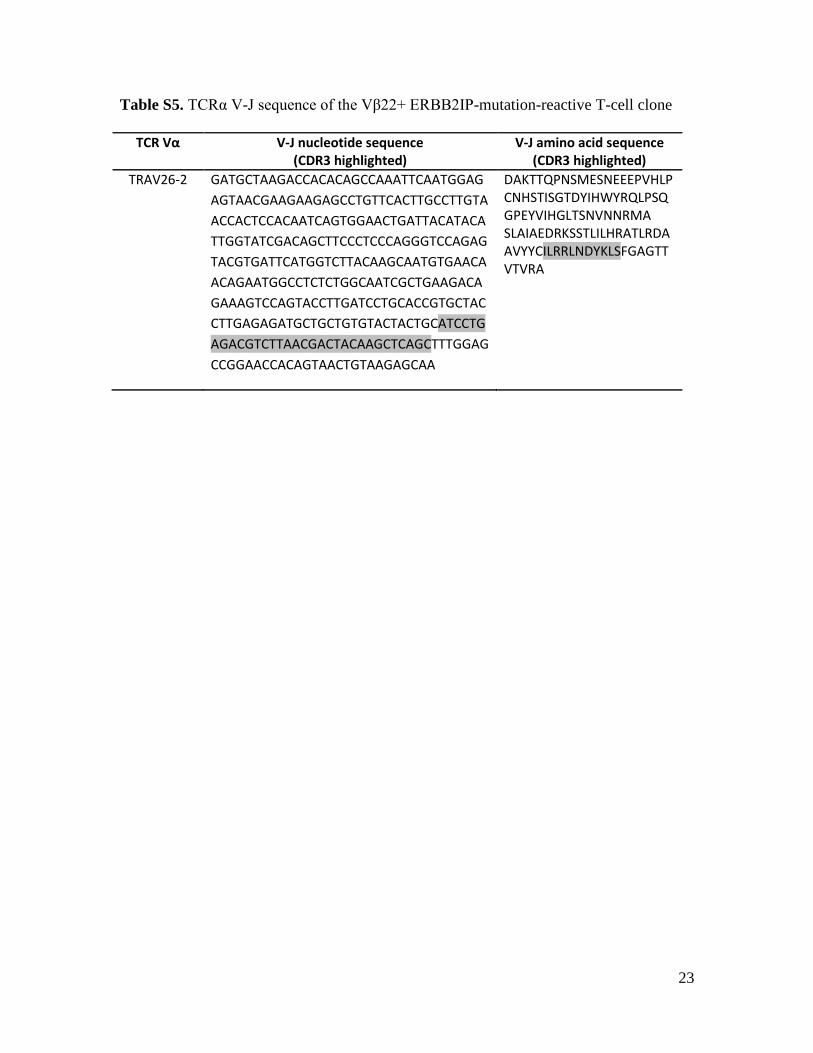
Table S5. TCRα V-J sequence of the Vβ22+ ERBB2IP-mutation-reactive T-cell clone
TCR Vα
V-J nucleotide sequence (CDR3 highlighted)
V-J amino acid sequence (CDR3 highlighted)
TRAV26-2 GATGCTAAGACCACACAGCCAAATTCAATGGAG
AGTAACGAAGAAGAGCCTGTTCACTTGCCTTGTA
ACCACTCCACAATCAGTGGAACTGATTACATACA
TTGGTATCGACAGCTTCCCTCCCAGGGTCCAGAG
TACGTGATTCATGGTCTTACAAGCAATGTGAACA
ACAGAATGGCCTCTCTGGCAATCGCTGAAGACA
GAAAGTCCAGTACCTTGATCCTGCACCGTGCTAC
CTTGAGAGATGCTGCTGTGTACTACTGCATCCTG
AGACGTCTTAACGACTACAAGCTCAGCTTTGGAG
CCGGAACCACAGTAACTGTAAGAGCAA
DAKTTQPNSMESNEEEPVHLPCNHSTISGTDYIHWYRQLPSQGPEYVIHGLTSNVNNRMA SLAIAEDRKSSTLILHRATLRDAAVYYCILRRLNDYKLSFGAGTTVTVRA
24
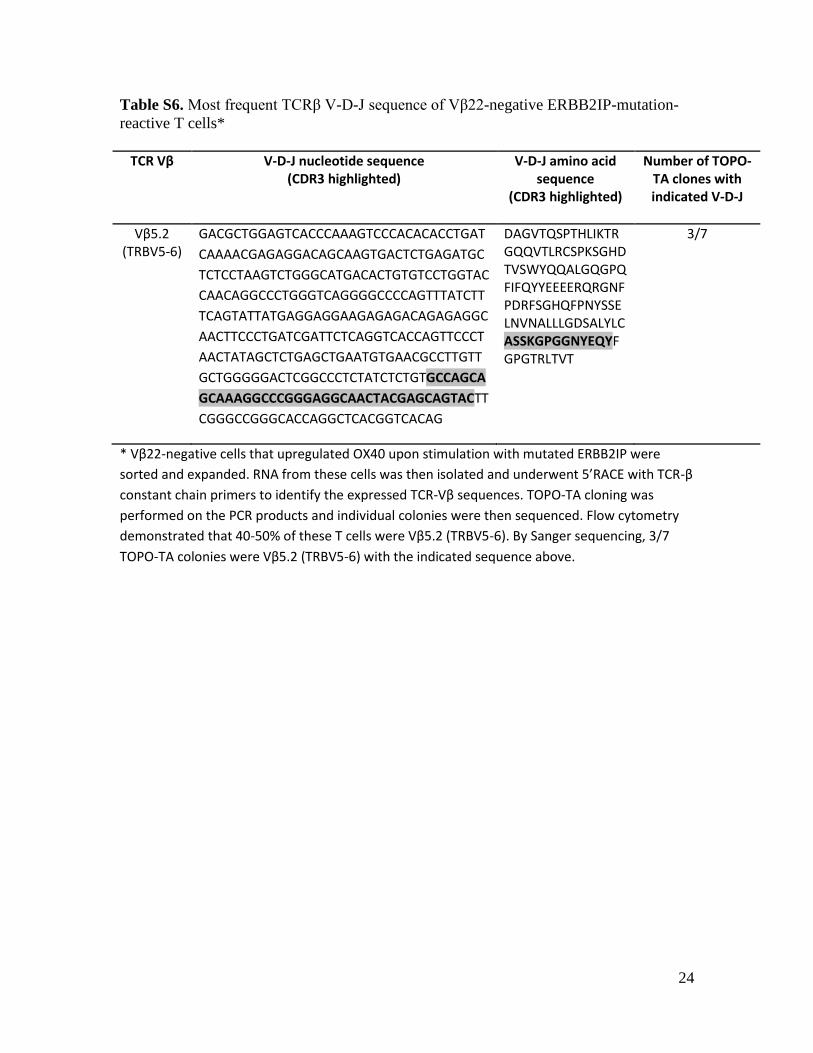
Table S6. Most frequent TCRβ V-D-J sequence of Vβ22-negative ERBB2IP-mutation-
reactive T cells*
TCR Vβ
V-D-J nucleotide sequence (CDR3 highlighted)
V-D-J amino acid sequence
(CDR3 highlighted)
Number of TOPO-TA clones with indicated V-D-J
Vβ5.2 (TRBV5-6)
GACGCTGGAGTCACCCAAAGTCCCACACACCTGAT
CAAAACGAGAGGACAGCAAGTGACTCTGAGATGC
TCTCCTAAGTCTGGGCATGACACTGTGTCCTGGTAC
CAACAGGCCCTGGGTCAGGGGCCCCAGTTTATCTT
TCAGTATTATGAGGAGGAAGAGAGACAGAGAGGC
AACTTCCCTGATCGATTCTCAGGTCACCAGTTCCCT
AACTATAGCTCTGAGCTGAATGTGAACGCCTTGTT
GCTGGGGGACTCGGCCCTCTATCTCTGTGCCAGCA
GCAAAGGCCCGGGAGGCAACTACGAGCAGTACTT
CGGGCCGGGCACCAGGCTCACGGTCACAG
DAGVTQSPTHLIKTRGQQVTLRCSPKSGHDTVSWYQQALGQGPQFIFQYYEEEERQRGNFPDRFSGHQFPNYSSELNVNALLLGDSALYLCASSKGPGGNYEQYFGPGTRLTVT
3/7
* Vβ22-negative cells that upregulated OX40 upon stimulation with mutated ERBB2IP were
sorted and expanded. RNA from these cells was then isolated and underwent 5’RACE with TCR-β
constant chain primers to identify the expressed TCR-Vβ sequences. TOPO-TA cloning was
performed on the PCR products and individual colonies were then sequenced. Flow cytometry
demonstrated that 40-50% of these T cells were Vβ5.2 (TRBV5-6). By Sanger sequencing, 3/7
TOPO-TA colonies were Vβ5.2 (TRBV5-6) with the indicated sequence above.
25
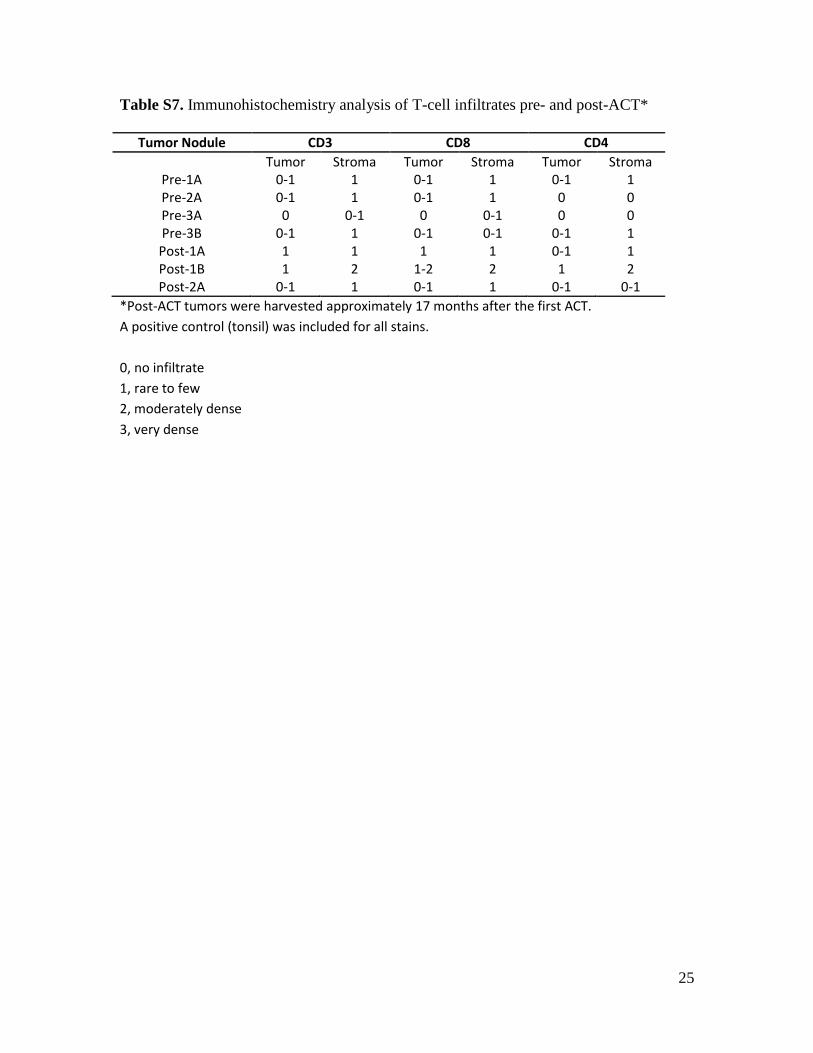
Table S7. Immunohistochemistry analysis of T-cell infiltrates pre- and post-ACT*
Tumor Nodule CD3 CD8 CD4
Tumor Stroma Tumor Stroma Tumor Stroma Pre-1A 0-1 1 0-1 1 0-1 1 Pre-2A 0-1 1 0-1 1 0 0 Pre-3A 0 0-1 0 0-1 0 0 Pre-3B 0-1 1 0-1 0-1 0-1 1 Post-1A 1 1 1 1 0-1 1 Post-1B 1 2 1-2 2 1 2 Post-2A 0-1 1 0-1 1 0-1 0-1
*Post-ACT tumors were harvested approximately 17 months after the first ACT.
A positive control (tonsil) was included for all stains.
0, no infiltrate
1, rare to few
2, moderately dense
3, very dense
26
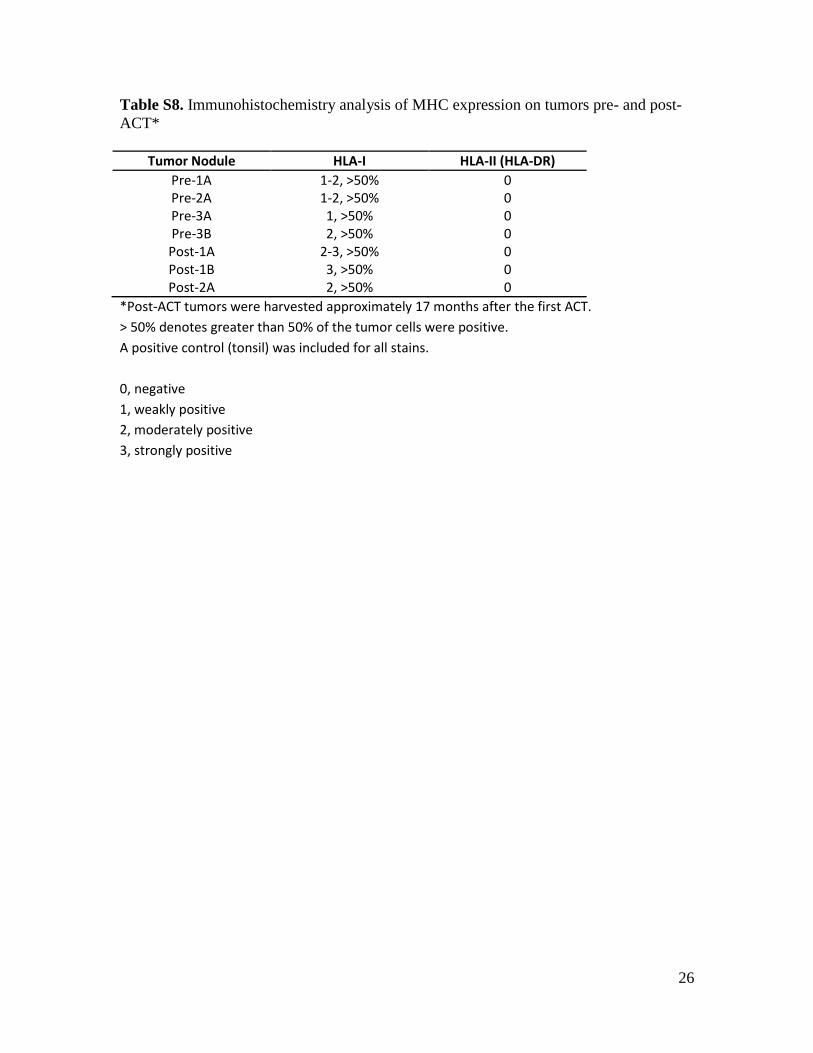
Table S8. Immunohistochemistry analysis of MHC expression on tumors pre- and post-
ACT*
Tumor Nodule HLA-I HLA-II (HLA-DR)
Pre-1A 1-2, >50% 0 Pre-2A 1-2, >50% 0 Pre-3A 1, >50% 0 Pre-3B 2, >50% 0 Post-1A 2-3, >50% 0 Post-1B 3, >50% 0 Post-2A 2, >50% 0
*Post-ACT tumors were harvested approximately 17 months after the first ACT.
> 50% denotes greater than 50% of the tumor cells were positive.
A positive control (tonsil) was included for all stains.
0, negative
1, weakly positive
2, moderately positive
3, strongly positive
References and Notes
1. B. Vogelstein, N. Papadopoulos, V. E. Velculescu, S. Zhou, L. A. Diaz Jr., K. W. Kinzler, Cancer genome landscapes. Science 339, 1546–1558 (2013). Medline doi:10.1126/science.1235122
2. P. van der Bruggen, V. Stroobant, N. Vigneron, B. Van den Eynde, “Tumor antigens resulting from mutations,” Cancer Immunity (2013), http://cancerimmunity.org/peptide/mutations/.
3. P. F. Robbins, Y. C. Lu, M. El-Gamil, Y. F. Li, C. Gross, J. Gartner, J. C. Lin, J. K. Teer, P. Cliften, E. Tycksen, Y. Samuels, S. A. Rosenberg, Mining exomic sequencing data to identify mutated antigens recognized by adoptively transferred tumor-reactive T cells. Nat. Med. 19, 747–752 (2013). Medline doi:10.1038/nm.3161
4. N. van Rooij, M. M. van Buuren, D. Philips, A. Velds, M. Toebes, B. Heemskerk, L. J. van Dijk, S. Behjati, H. Hilkmann, D. El Atmioui, M. Nieuwland, M. R. Stratton, R. M. Kerkhoven, C. Kesmir, J. B. Haanen, P. Kvistborg, T. N. Schumacher, Tumor exome analysis reveals neoantigen-specific T-cell reactivity in an ipilimumab-responsive melanoma. J. Clin. Oncol. 31, e439–e442 (2013). Medline doi:10.1200/JCO.2012.47.7521
5. Y. C. Lu, X. Yao, Y. F. Li, M. El-Gamil, M. E. Dudley, J. C. Yang, J. R. Almeida, D. C. Douek, Y. Samuels, S. A. Rosenberg, P. F. Robbins, Mutated PPP1R3B is recognized by T cells used to treat a melanoma patient who experienced a durable complete tumor regression. J. Immunol. 190, 6034–6042 (2013). Medline doi:10.4049/jimmunol.1202830
6. V. Corbière, J. Chapiro, V. Stroobant, W. Ma, C. Lurquin, B. Lethé, N. van Baren, B. J. Van den Eynde, T. Boon, P. G. Coulie, Antigen spreading contributes to MAGE vaccination-induced regression of melanoma metastases. Cancer Res. 71, 1253–1262 (2011). Medline doi:10.1158/0008-5472.CAN-10-2693
7. J. Huang, M. El-Gamil, M. E. Dudley, Y. F. Li, S. A. Rosenberg, P. F. Robbins, T cells associated with tumor regression recognize frameshifted products of the CDKN2A tumor suppressor gene locus and a mutated HLA class I gene product. J. Immunol. 172, 6057–6064 (2004). Medline
8. H. Echchakir, F. Mami-Chouaib, I. Vergnon, J. F. Baurain, V. Karanikas, S. Chouaib, P. G. Coulie, A point mutation in the alpha-actinin-4 gene generates an antigenic peptide recognized by autologous cytolytic T lymphocytes on a human lung carcinoma. Cancer Res. 61, 4078–4083 (2001). Medline
9. S. Mandruzzato, F. Brasseur, G. Andry, T. Boon, P. van der Bruggen, A CASP-8 mutation recognized by cytolytic T lymphocytes on a human head and neck carcinoma. J. Exp. Med. 186, 785–793 (1997). Medline doi:10.1084/jem.186.5.785
10. K. T. Hogan, D. P. Eisinger, S. B. Cupp 3rd, K. J. Lekstrom, D. D. Deacon, J. Shabanowitz, D. F. Hunt, V. H. Engelhard, C. L. Slingluff Jr., M. M. Ross, The
peptide recognized by HLA-A68.2-restricted, squamous cell carcinoma of the lung-specific cytotoxic T lymphocytes is derived from a mutated elongation factor 2 gene. Cancer Res. 58, 5144–5150 (1998). Medline
11. V. Karanikas, D. Colau, J. F. Baurain, R. Chiari, J. Thonnard, I. Gutierrez-Roelens, C. Goffinet, E. V. Van Schaftingen, P. Weynants, T. Boon, P. G. Coulie, High frequency of cytolytic T lymphocytes directed against a tumor-specific mutated antigen detectable with HLA tetramers in the blood of a lung carcinoma patient with long survival. Cancer Res. 61, 3718–3724 (2001). Medline
12. S. Wedén, M. Klemp, I. P. Gladhaug, M. Møller, J. A. Eriksen, G. Gaudernack, T. Buanes, Long-term follow-up of patients with resected pancreatic cancer following vaccination against mutant K-ras. Int. J. Cancer 128, 1120–1128 (2011). Medline doi:10.1002/ijc.25449
13. Materials and methods are available as supplementary materials on Science Online.
14. D. Mumberg, P. A. Monach, S. Wanderling, M. Philip, A. Y. Toledano, R. D. Schreiber, H. Schreiber, CD4(+) T cells eliminate MHC class II-negative cancer cells in vivo by indirect effects of IFN-gamma. Proc. Natl. Acad. Sci. U.S.A. 96, 8633–8638 (1999). Medline doi:10.1073/pnas.96.15.8633
15. A. Corthay, D. K. Skovseth, K. U. Lundin, E. Røsjø, H. Omholt, P. O. Hofgaard, G. Haraldsen, B. Bogen, Primary antitumor immune response mediated by CD4+ T cells. Immunity 22, 371–383 (2005). Medline doi:10.1016/j.immuni.2005.02.003
16. S. A. Quezada, T. R. Simpson, K. S. Peggs, T. Merghoub, J. Vider, X. Fan, R. Blasberg, H. Yagita, P. Muranski, P. A. Antony, N. P. Restifo, J. P. Allison, Tumor-reactive CD4(+) T cells develop cytotoxic activity and eradicate large established melanoma after transfer into lymphopenic hosts. J. Exp. Med. 207, 637–650 (2010). Medline doi:10.1084/jem.20091918
17. Y. Xie, A. Akpinarli, C. Maris, E. L. Hipkiss, M. Lane, E. K. Kwon, P. Muranski, N. P. Restifo, P. A. Antony, Naive tumor-specific CD4(+) T cells differentiated in vivo eradicate established melanoma. J. Exp. Med. 207, 651–667 (2010). Medline doi:10.1084/jem.20091921
18. P. D. Greenberg, D. E. Kern, M. A. Cheever, Therapy of disseminated murine leukemia with cyclophosphamide and immune Lyt-1+,2- T cells. Tumor eradication does not require participation of cytotoxic T cells. J. Exp. Med. 161, 1122–1134 (1985). Medline doi:10.1084/jem.161.5.1122
19. Z. C. Ding, L. Huang, B. R. Blazar, H. Yagita, A. L. Mellor, D. H. Munn, G. Zhou, Polyfunctional CD4⁺ T cells are essential for eradicating advanced B-cell lymphoma after chemotherapy. Blood 120, 2229–2239 (2012). Medline doi:10.1182/blood-2011-12-398321
20. K. A. Shafer-Weaver, S. K. Watkins, M. J. Anderson, L. J. Draper, A. Malyguine, W. G. Alvord, N. M. Greenberg, A. A. Hurwitz, Immunity to murine prostatic tumors: Continuous provision of T-cell help prevents CD8 T-cell tolerance and activates tumor-infiltrating dendritic cells. Cancer Res. 69, 6256–6264 (2009). Medline doi:10.1158/0008-5472.CAN-08-4516
21. N. N. Hunder, H. Wallen, J. Cao, D. W. Hendricks, J. Z. Reilly, R. Rodmyre, A. Jungbluth, S. Gnjatic, J. A. Thompson, C. Yee, Treatment of metastatic melanoma with autologous CD4+ T cells against NY-ESO-1. N. Engl. J. Med. 358, 2698–2703 (2008). Medline doi:10.1056/NEJMoa0800251
22. H. Braumüller, T. Wieder, E. Brenner, S. Aßmann, M. Hahn, M. Alkhaled, K. Schilbach, F. Essmann, M. Kneilling, C. Griessinger, F. Ranta, S. Ullrich, R. Mocikat, K. Braungart, T. Mehra, B. Fehrenbacher, J. Berdel, H. Niessner, F. Meier, M. van den Broek, H. U. Häring, R. Handgretinger, L. Quintanilla-Martinez, F. Fend, M. Pesic, J. Bauer, L. Zender, M. Schaller, K. Schulze-Osthoff, M. Röcken, T-helper-1-cell cytokines drive cancer into senescence. Nature 494, 361–365 (2013). Medline doi:10.1038/nature11824
23. Z. Qin, T. Blankenstein, CD4+ T cell—mediated tumor rejection involves inhibition of angiogenesis that is dependent on IFN gamma receptor expression by nonhematopoietic cells. Immunity 12, 677–686 (2000). Medline doi:10.1016/S1074-7613(00)80218-6
24. J. Yuan, S. Gnjatic, H. Li, S. Powel, H. F. Gallardo, E. Ritter, G. Y. Ku, A. A. Jungbluth, N. H. Segal, T. S. Rasalan, G. Manukian, Y. Xu, R. A. Roman, S. L. Terzulli, M. Heywood, E. Pogoriler, G. Ritter, L. J. Old, J. P. Allison, J. D. Wolchok, CTLA-4 blockade enhances polyfunctional NY-ESO-1 specific T cell responses in metastatic melanoma patients with clinical benefit. Proc. Natl. Acad. Sci. U.S.A. 105, 20410–20415 (2008). Medline doi:10.1073/pnas.0810114105
25. S. A. Rosenberg, J. C. Yang, R. M. Sherry, U. S. Kammula, M. S. Hughes, G. Q. Phan, D. E. Citrin, N. P. Restifo, P. F. Robbins, J. R. Wunderlich, K. E. Morton, C. M. Laurencot, S. M. Steinberg, D. E. White, M. E. Dudley, Durable complete responses in heavily pretreated patients with metastatic melanoma using T-cell transfer immunotherapy. Clin. Cancer Res. 17, 4550–4557 (2011). Medline doi:10.1158/1078-0432.CCR-11-0116
26. S. Turcotte, A. Gros, K. Hogan, E. Tran, C. S. Hinrichs, J. R. Wunderlich, M. E. Dudley, S. A. Rosenberg, Phenotype and function of T cells infiltrating visceral metastases from gastrointestinal cancers and melanoma: Implications for adoptive cell transfer therapy. J. Immunol. 191, 2217–2225 (2013). Medline doi:10.4049/jimmunol.1300538
27. S. Jones, T. L. Wang, IeM. Shih, T. L. Mao, K. Nakayama, R. Roden, R. Glas, D. Slamon, L. A. Diaz Jr., B. Vogelstein, K. W. Kinzler, V. E. Velculescu, N. Papadopoulos, Frequent mutations of chromatin remodeling gene ARID1A in ovarian clear cell carcinoma. Science 330, 228–231 (2010). Medline doi:10.1126/science.1196333
28. J. Jin, M. Sabatino, R. Somerville, J. R. Wilson, M. E. Dudley, D. F. Stroncek, S. A. Rosenberg, Simplified method of the growth of human tumor infiltrating lymphocytes in gas-permeable flasks to numbers needed for patient treatment. J. Immunother. 35, 283–292 (2012). Medline doi:10.1097/CJI.0b013e31824e801f