supplementary materials 2 -...
TRANSCRIPT
www.sciencemag.org/cgi/content/full/science.aac4263/DC1
Supplementary Materials for
The microbiota regulates type 2 immunity through RORγt T cells
Caspar Ohnmacht, Joo-Hong Park, Sascha Cording, James B. Wing, Koji Atarashi, Yuuki Obata, Valérie Gaboriau-Routhiau, Rute Marques, Sophie Dulauroy,
Maria Fedoseeva, Meinrad Busslinger, Nadine Cerf-Bensussan, Ivo G. Boneca, David Voehringer, Koji Hase, Kenya Honda, Shimon Sakaguchi, Gérard Eberl*
*Corresponding author. E-mail: [email protected]
Published 9 July 2015 on Science Express DOI: 10.1126/science.aac4263
This PDF file includes:
Materials and Methods Figs S1 to S13 References
2
Materials and Methods Mice
Foxp3Rfp mice (43) were crossed to Rorc(γt)Gfp mice (15) and maintained on a C57BL/6
background, as were Cd11cCre x Rosa26Dta (ΔDC) mice (44), IL-2-deficient (45), IL-10-
deficient (46), IL-6-deficient (47), Il23a-deficient (48), Nod1/Nod2- and Myd88/Trif-
double deficient mice, Il10Venus (21) and Gata3GFP mice (49). RORγt-deficient mice (14)
were backcrossed at least 8 generations to a C57BL/6 background. Foxp3Cre mice were
purchased on a NOD/ShiLt background (The Jackson Laboratory) and crossed to
Rorc(γt)Fl/KO mice (The Jackson laboratory) and to Stat3Fl/Fl mice (50) on a C57BL/6
background, as were Rorc(γt)Cre mice (51). OT-II TCR transgenic mice (specific for
OVA323-339 peptide) (52) were crossed with Rag2-deficient or RORγt-deficient mice. Fox-
IRES-cre mice were crossed with CTLA-4-floxed mice (38). Germfree mice were
generated from SPF C57BL/6 mice and maintained at the Gnotobiology Platform of the
Institut Pasteur. In all experiments, littermates were used as controls. All mice were kept
in specific pathogen-free conditions and all animal experiments were approved by the
committee on animal experimentation of the Institut Pasteur and by the French Ministry
of Agriculture.
Mouse treatments
For antibiotic treatment, pregnant females were fed three days before delivery with a
cocktail of the following antibiotics in their drinking water: 1 mg/ml Collistin, 5 mg/ml
Streptomycin, 1 mg/ml Ampicillin and 0.5 mg/ml Vancomycin (Sigma). The antibiotic-
containing drinking water was changed once a week until analysis. For DSS treatment,
mice received three cycles of seven days of 3% DSS (MP Biochemicals) in their drinking
water followed by ten days of normal drinking water. This cycle was repeated twice
before analysis. For oxazolone treatment, mice were presensitized with 200 ul of 2%
(w/v) oxazolone (4-ethoxymethylene-2-phenyl-2-oxazoline-5-one, Fluka) in 100%
ethanol by subcutaneous injection. Five days later, mice were challenged intrarectally
with 150µl of 1% oxazolone in 50% ethanol or only 50% ethanol under
anesthesia. Intrarectal injections were administered with a 3.5F polyurethane catheter.
3
Monocolonizations with SFB, E. coli or Clostridia were performed as described
previously (21, 24). For butyrate treatment, mice were fed a low fiber diet with or without
butyrylated high-amylose maize starches for 4 weeks. For diet study, vitamin A-deficient
and –sufficient diets were purchased from SAFE diets, and administered to pregnant
females from day 15 of gestation until weaning. Offspring were maintained on special
diet for 10 weeks. For inhibition of the retinoic acid receptor, 250 µg of the pan-retinoic
acid receptor inverse agonist BMS493 (R&D) was administered intraperitoneally to
C57BL/6 mice daily for 12 days. For infection with Heligmosomoides polygyrus, 200 L3
larvae were inoculated to each mouse by oral gavage, and from day 14 post-inoculation,
fecal pellets were collected and rehydrated. Following addition of saturated sodium
chloride solution, eggs were counted using a McMaster chamber.
Cell preparation and cultures
Small intestinal and colonic lamina propria cells were isolated as described previously
(53). Briefly, Peyer’s Patches were removed, and whole small intestine and colon were
opened longitudinally, cut into pieces and incubated for 30 minutes in 30mM EDTA,
washed extensively, and incubated for several rounds in 0.7mg/ml collagenase D. These
preparations, as well as thymus, spleen and lymph nodes, were then grinded through a
100μm filter to generate single cell suspensions. Cells were separated by a 40/80% (w/v)
Percoll (GE Healthcare) density gradient and washed prior to staining for flow cytometry
analysis. For intracellular cytokine staining, cells were restimulated with 50 ng/ml PMA
and 500 ng/ml ionomycin for 4 hours. Brefeldin A was added for the final 2 hours. For
analysis of cytokine production, cells were cultured for 1 day in round-bottomed 96-well
plates coated with anti-CD3 (10 µg/ml) in RPMI 1640 (Invitrogen) containing soluble
anti-CD28 (1 μg/ml) and 10% FCS, 25 mM HEPES, 0.05 mM 2-mercaptoethanol, and
100 U/ml of penicillin and streptomycin. Mesenteric lymph node cells isolated from H.
polygyrus-infected mice were incubated as above for 3 days. Cytokine levels in culture
supernatants were analysed by ELISA or LEGENDplexTM (Biolegend).
4
Flow cytometry
Cells were preincubated with Fc-Block for 5 minutes and stained for 20 minutes with the
following antibodies: FITC-conjugated anti-CD3 (clone 145-2C11), eFluor450-
conjugated anti-CD3 (clone 17A2), APC-eFluor780-conjugated CD3 (clone 17A2),
PerCP-Cy-5.5-conjugated anti-CD3 (clone 17A2) or Brilliant Violett 785-conjugated
anti-CD3 (clone 17A2; BioLegend), eFluor450-conjugated anti-CD4 (clone GK1.5) or
Horizon V500-conjugated anti-CD4 (clone RM4-5; BD), biotin-conjugated anti-CD8
(clone 53-6.7), eFluor450-conjugated anti-CD25 (clone PC61.5), eFluor660-conjugated
anti-CD39 (clone 24DMS1), APC-conjugated anti-CD44 (clone IM7), FITC-conjugated
anti-CD45.2 (clone 104; BD), APC-conjugated anti-CD45R (clone RA3-6B2) or A700-
conjugated anti-CD45R (clone RA3-6B2), Brilliant Violet 650-conjugated anti-CD19
(clone 6D5, Biolegend), eFluor450-conjugated anti-MHC II (clone M5/114.15.2),
eFluor660-conjugated anti-CD11c (clone N418), PE-Cy7-conjugated anti-CD80 (clone
16-10A1), FITC-conjugated anti-CD86 (clone GL1), PE-conjugated anti-CD49b (clone
DX5), biotin-conjugated anti-CD62L (MEL-14), APC-conjugated PE-Cy7-conjugated
anti-CD73 (clone Ty/11.8), biotin-conjugated anti-CD103 (clone 2E7), PE-conjugated
CD196 (clone 140706; R&D), APC-conjugated anti-CD278 (clone C398.4A), APC-
conjugated ployclonal anti-Neuropilin 1 (R&D), PE-conjugated anti-TCR Vβ5.1&5.2
(clone MR9-4; BD), PE-Cy7-conjugated anti-TCR Vα2 (clone B20.1, BD), eFluor660-
conjugated anti-IRF4 (clone 3E4, eBioscience). PE-, PerCP-Cy-5.5- (both eBioscience)
or AlexaFluor647- (Invitrogen) conjugated streptavidin was used for detection of
biotinylated antibodies. For intracellular stainings, cells were fixed and permeabilized
with a commercially available fixation/permeabilization buffer (eBioscience). After
restimulation, LIVE/DEAD fixable violet dead stain kit (Invitrogen) was used prior to
fixation. Intracellular staining was performed with the following antibodies: Pacific Blue-
conjugated anti-Helios (clone 22F6; BioLegend), PE- or APC-conjugated anti-RORγt
(clone AFKJS-9), PerCP-Cy5.5-conjugated Foxp3 (clone FJK-16s), APC-conjugated
anti-CD152 (UC10-4B9), eFluor660-conjugated anti-Gata3 (clone TWAJ), APC-
conjugated anti-IL-10 (clone JES5-16E3), APC- or PE-conjugated anti-IL-17A (clone
TC11-18H10; BD). All antibodies were from eBioscience unless stated otherwise.
5
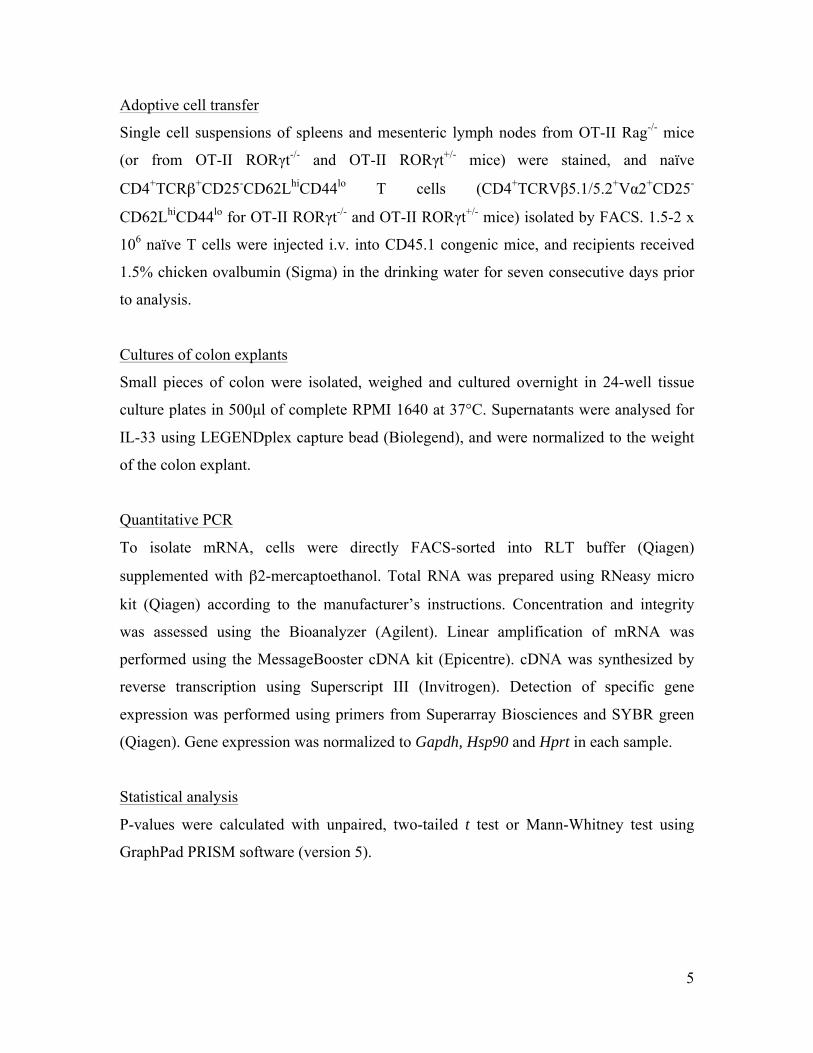
Adoptive cell transfer
Single cell suspensions of spleens and mesenteric lymph nodes from OT-II Rag-/- mice
(or from OT-II RORγt-/- and OT-II RORγt+/- mice) were stained, and naïve
CD4+TCRβ+CD25-CD62LhiCD44lo T cells (CD4+TCRVβ5.1/5.2+Vα2+CD25-
CD62LhiCD44lo for OT-II RORγt-/- and OT-II RORγt+/- mice) isolated by FACS. 1.5-2 x
106 naïve T cells were injected i.v. into CD45.1 congenic mice, and recipients received
1.5% chicken ovalbumin (Sigma) in the drinking water for seven consecutive days prior
to analysis.
Cultures of colon explants
Small pieces of colon were isolated, weighed and cultured overnight in 24-well tissue
culture plates in 500μl of complete RPMI 1640 at 37°C. Supernatants were analysed for
IL-33 using LEGENDplex capture bead (Biolegend), and were normalized to the weight
of the colon explant.
Quantitative PCR
To isolate mRNA, cells were directly FACS-sorted into RLT buffer (Qiagen)
supplemented with β2-mercaptoethanol. Total RNA was prepared using RNeasy micro
kit (Qiagen) according to the manufacturer’s instructions. Concentration and integrity
was assessed using the Bioanalyzer (Agilent). Linear amplification of mRNA was
performed using the MessageBooster cDNA kit (Epicentre). cDNA was synthesized by
reverse transcription using Superscript III (Invitrogen). Detection of specific gene
expression was performed using primers from Superarray Biosciences and SYBR green
(Qiagen). Gene expression was normalized to Gapdh, Hsp90 and Hprt in each sample.
Statistical analysis
P-values were calculated with unpaired, two-tailed t test or Mann-Whitney test using
GraphPad PRISM software (version 5).
6
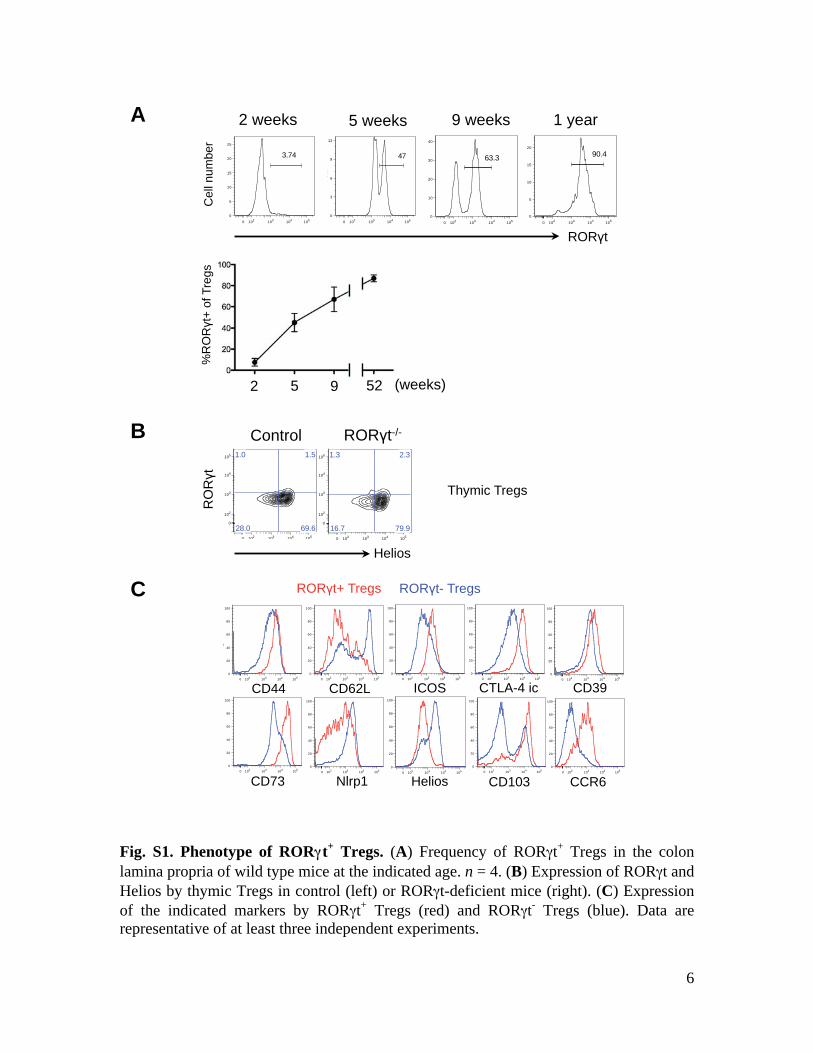
Fig. S1. Phenotype of RORγγt+ Tregs. (A) Frequency of RORγt+ Tregs in the colon lamina propria of wild type mice at the indicated age. n = 4. (B) Expression of RORγt and Helios by thymic Tregs in control (left) or RORγt-deficient mice (right). (C) Expression of the indicated markers by RORγt+ Tregs (red) and RORγt- Tregs (blue). Data are representative of at least three independent experiments.
A 9 weeks 2 weeks 1 year
RORγt
Cel
l num
ber
0 102 103 104 1050
5
10
15
20
25
3.74
0 102 103 104 1050
3
6
9
12
# C
ells
47
0 102 103 104 1050
10
20
30
40
63.3
0 102 103 104 1050
5
10
15
20
90.4
5 weeks
RORγt- Tregs RORγt+ Tregs
CCR6
CD62L ICOS CTLA-4 ic
CD103
CD39
CD73 Nlrp1
CD44
0 102 103 104 1050
20
40
60
80
100
0 102 103 104 1050
20
40
60
80
100
0 102 103 104 1050
20
40
60
80
100
0 102 103 104 105
PE A CD44
0
20
40
60
80
100
%
Helios
0 102 103 104 1050
20
40
60
80
100
0 102 103 104 1050
20
40
60
80
100
0 102 103 104 1050
20
40
60
80
100
0 102 103 104 1050
20
40
60
80
100
0 102 103 104 105
APC A CCR6
0
20
40
60
80
100
%
0 102 103 104 1050
20
40
60
80
100
C
2 5 9 52 (weeks)
B
0 102 103 104 105
0
102
103
104
105 1.0 1.5
69.628.00 102 103 104 105
0
102
103
104
105 1.3 2.3
79.916.7
Control RORγt-/-
RO
Rγt
Helios
Thymic Tregs
%R
ORγt
+ of
Tre
gs
7
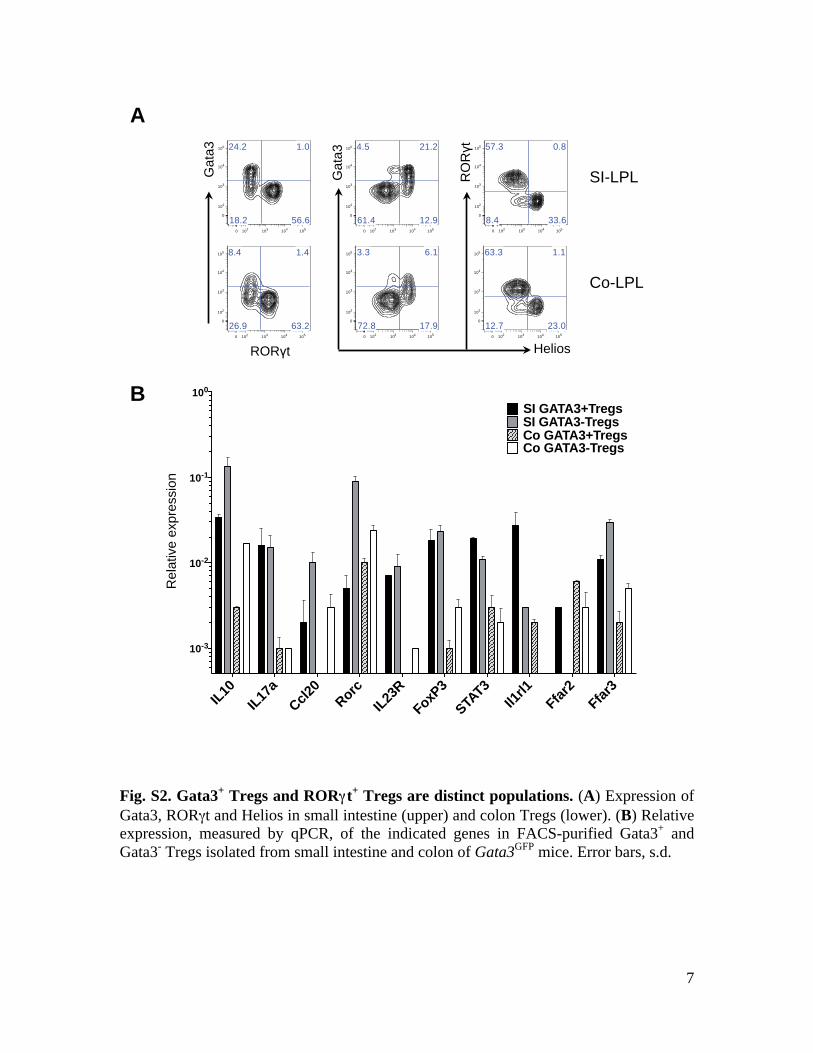
Fig. S2. Gata3+ Tregs and RORγγt+ Tregs are distinct populations. (A) Expression of Gata3, RORγt and Helios in small intestine (upper) and colon Tregs (lower). (B) Relative expression, measured by qPCR, of the indicated genes in FACS-purified Gata3+ and Gata3- Tregs isolated from small intestine and colon of Gata3GFP mice. Error bars, s.d.
A
0 102 103 104 105
0
102
103
104
105 24.2 1.0
56.618.20 102 103 104 105
0
102
103
104
105 4.5 21.2
12.961.40 102 103 104 105
0
102
103
104
105 57.3 0.8
33.68.4
0 102 103 104 105
0
102
103
104
105 63.3 1.1
23.012.70 102 103 104 105
0
102
103
104
105 3.3 6.1
17.972.8AP
CA
GAT
A3
0 102 103 104 105
0
102
103
104
105 8.4 1.4
63.226.9
Helios
RO
Rγt
Gat
a3
Gat
a3
RORγt
SI-LPL
Co-LPL
B
Rel
ativ
e ex
pres
sion
IL10IL17
aCcl2
0Rorc
IL23R
FoxP3
STAT3
Il1rl1
Ffar2
Ffar3
10-3
10-2
10-1
100
SI GATA3+TregsSI GATA3-TregsCo GATA3+TregsCo GATA3-Tregs
8
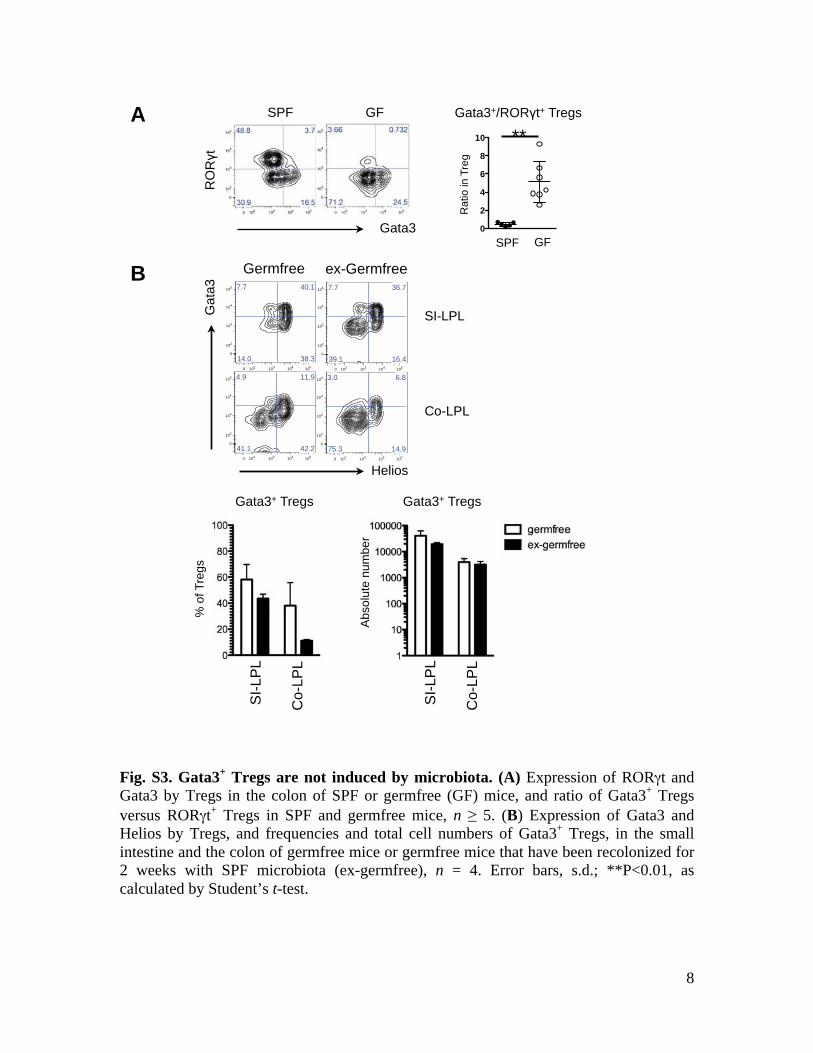
Fig. S3. Gata3+ Tregs are not induced by microbiota. (A) Expression of RORγt and Gata3 by Tregs in the colon of SPF or germfree (GF) mice, and ratio of Gata3+ Tregs versus RORγt+ Tregs in SPF and germfree mice, n ≥ 5. (B) Expression of Gata3 and Helios by Tregs, and frequencies and total cell numbers of Gata3+ Tregs, in the small intestine and the colon of germfree mice or germfree mice that have been recolonized for 2 weeks with SPF microbiota (ex-germfree), n = 4. Error bars, s.d.; **P<0.01, as calculated by Student’s t-test.
0
2
4
6
8
10
0 102 103 104 105
0
102
103
104
105 4.9 11.9
42.241.10 102 103 104 105
0
102
103
104
105 3.0 6.8
14.975.3
0 102 103 104 105
0
102
103
104
105 7.7 40.1
38.314.00 102 103 104 105
0
102
103
104
105 7.7 36.7
16.439.1
Germfree ex-Germfree
Helios
Gat
a3
SI-LPL
Co-LPL S
I-LP
L
Co-
LPL
Abs
olut
e nu
mbe
r
SI-L
PL
Co-
LPL
% o
f Tre
gs
A
B
Rat
io in
Tre
g
Gata3 R
ORγt
SPF GF Gata3+/RORγt+ Tregs
SPF GF
Gata3+ Tregs Gata3+ Tregs
**
9
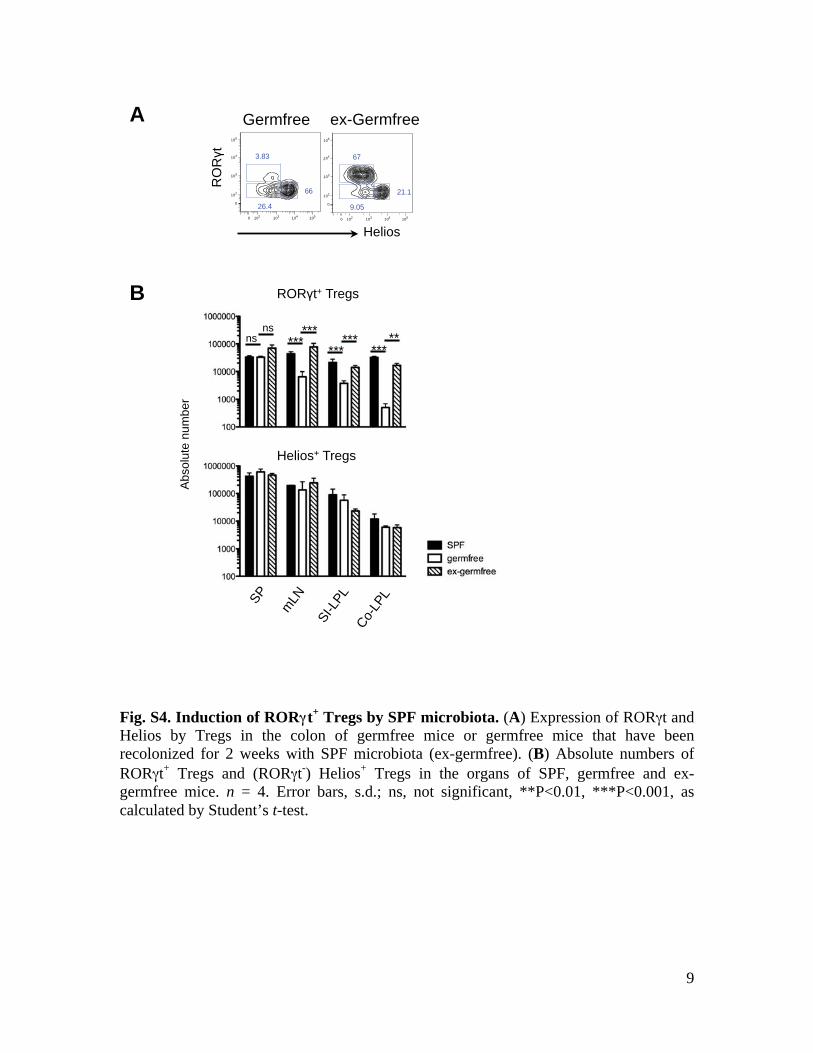
Fig. S4. Induction of RORγγt+ Tregs by SPF microbiota. (A) Expression of RORγt and Helios by Tregs in the colon of germfree mice or germfree mice that have been recolonized for 2 weeks with SPF microbiota (ex-germfree). (B) Absolute numbers of RORγt+ Tregs and (RORγt-) Helios+ Tregs in the organs of SPF, germfree and ex-germfree mice. n = 4. Error bars, s.d.; ns, not significant, **P<0.01, ***P<0.001, as calculated by Student’s t-test.
Germfree ex-Germfree
Helios R
ORγt
0 102 103 104 105
0
102
103
104
105
3.83
26.4
66
0 102 103 104 105
0
102
103
104
105
g 67
9.05
21.1
A
B
** ***
*** ***
*** ***
ns ns
SP
mLN
SI-L
PL
Co-LP
L
RORγt+ Tregs
Helios+ Tregs
Abs
olut
e nu
mbe
r
10
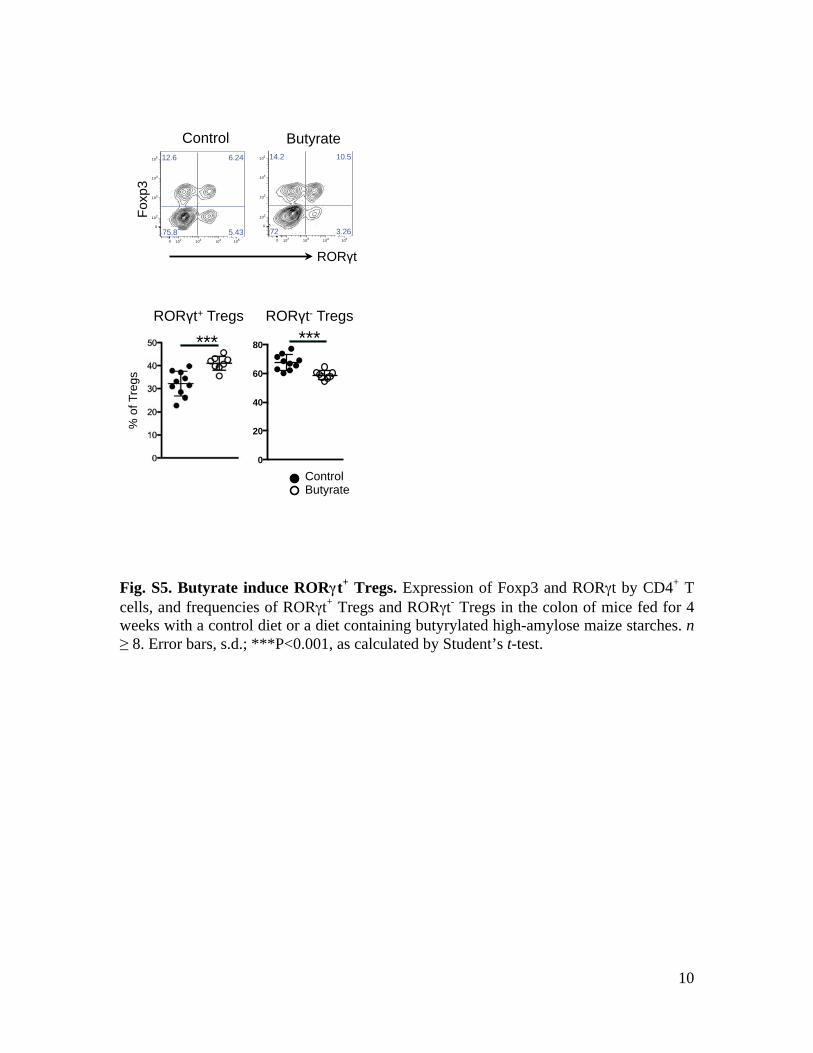
Fig. S5. Butyrate induce RORγγt+ Tregs. Expression of Foxp3 and RORγt by CD4+ T cells, and frequencies of RORγt+ Tregs and RORγt- Tregs in the colon of mice fed for 4 weeks with a control diet or a diet containing butyrylated high-amylose maize starches. n≥ 8. Error bars, s.d.; ***P<0.001, as calculated by Student’s t-test.
Butyrate Control
Control Butyrate
***
Foxp
3
RORγt
14.2 10.5
3.26720
105
104
g
103
102
1051041031020
12.6 6.24
5.4375.80
105
104
g
103
102
1051041031020
% o
f Tre
gs
0
20
40
60
80 *** RORγt+ Tregs RORγt- Tregs
11
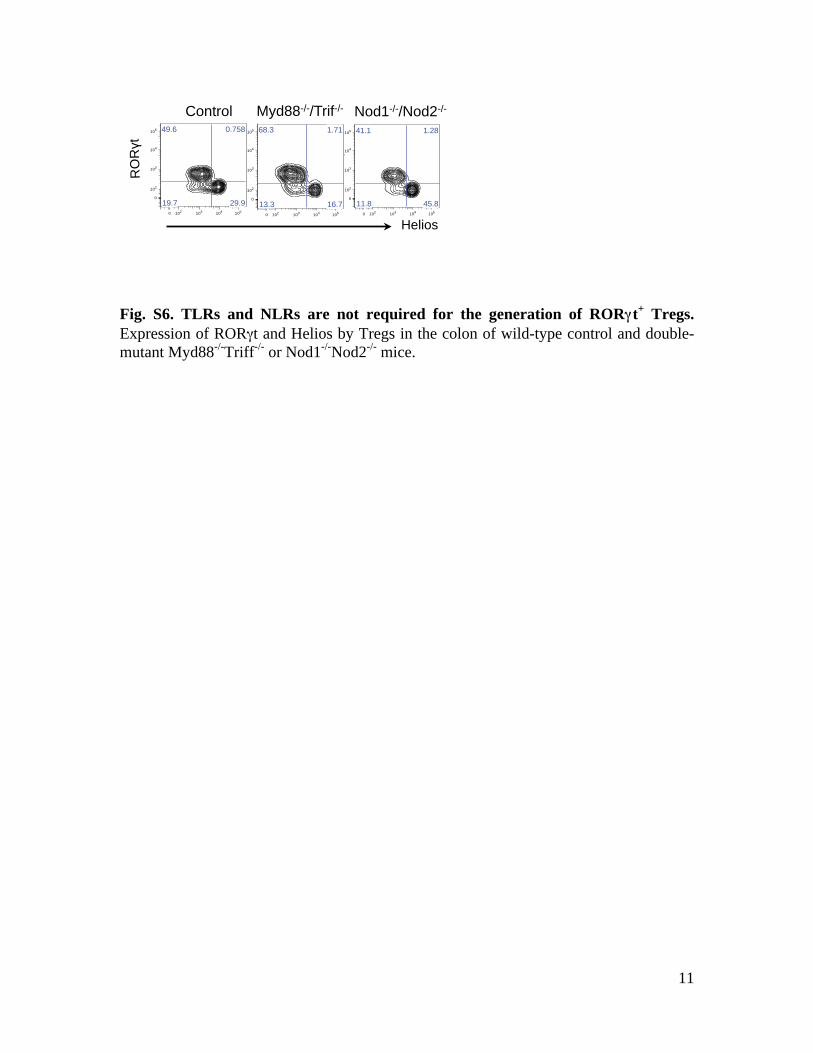
Fig. S6. TLRs and NLRs are not required for the generation of RORγγt+ Tregs. Expression of RORγt and Helios by Tregs in the colon of wild-type control and double-mutant Myd88-/-Triff-/- or Nod1-/-Nod2-/- mice.
RO
Rγt
Control Myd88-/-/Trif-/- Nod1-/-/Nod2-/-
0 102 103 104 105
0
102
103
104
105 68.3 1.71
16.713.30 102 103 104 105
0
102
103
104
105 49.6 0.758
29.919.70 102 103 104 105
0
102
103
104
105
g
41.1 1.28
45.811.8
Helios

12
Fig. S7. Gata3+ Tregs are generated independently of IL-6 and IL-23. (A) Frequencies of Gata3+ Tregs, Gata3+ non-Treg cells and ILC2s (right) in the colon of Il6-
/- (open circles) or littermate control mice (filled circles). n = 4. (B) Frequencies of Gata3+ Tregs, Gata3+ non-Treg cells and ILC2s in the colon of Il23a-/- (open circles) or control mice (filled circles). n ≥ 3. Error bars, s.d.; ns, not significant, *P<0.05, **P<0.01, as calculated by Student’s t-test.
0
1
2
3
4
5
0
2
4
6
8
0
2
4
6
8
10
0
10
20
30
A
B
*
ns
ns
ns
% o
f Th
% o
f ILC
s
0102030405060
% o
f Tre
gs
**
0
10
20
30
40
50
% o
f Tre
gs
**
GATA3+ Tregs Th2 ILC2
GATA3+ Tregs Th2 ILC2
% o
f Th
% o
f ILC
s
Control Il6-/-
Control Il23a-/-
13
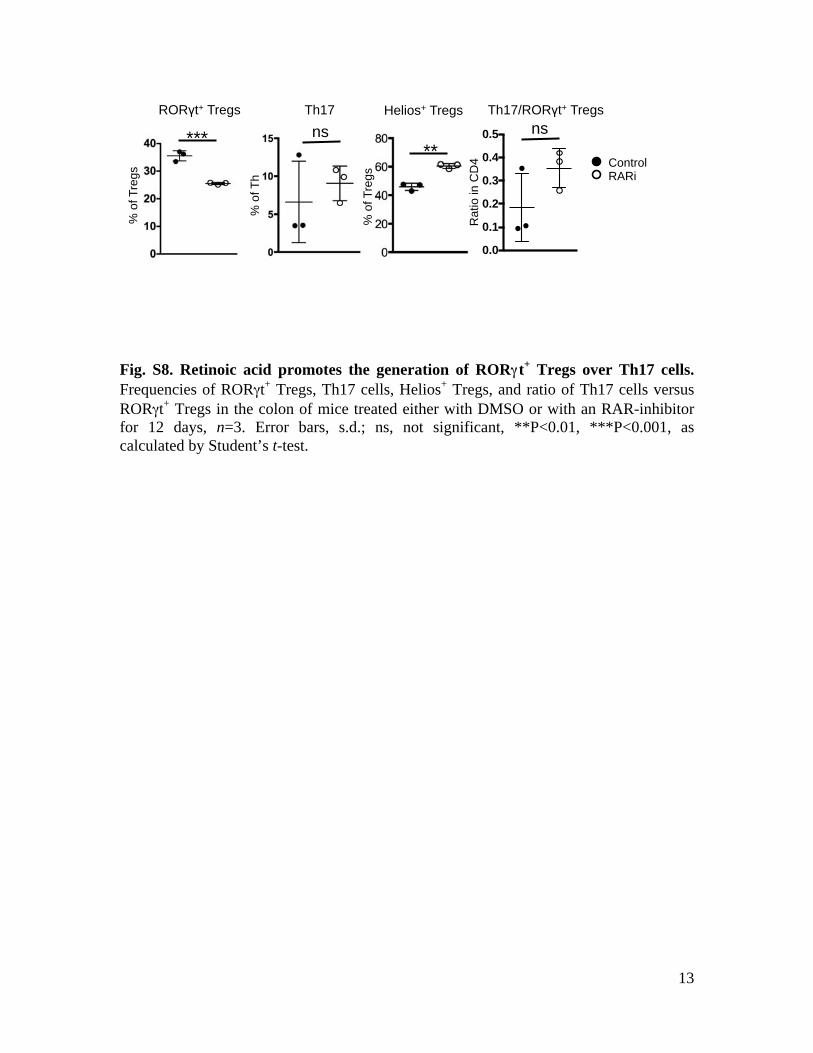
Fig. S8. Retinoic acid promotes the generation of RORγγt+ Tregs over Th17 cells. Frequencies of RORγt+ Tregs, Th17 cells, Helios+ Tregs, and ratio of Th17 cells versus RORγt+ Tregs in the colon of mice treated either with DMSO or with an RAR-inhibitor for 12 days, n=3. Error bars, s.d.; ns, not significant, **P<0.01, ***P<0.001, as calculated by Student’s t-test.
Control RARi
ns **
*** %
of T
regs
% o
f Tre
gs
% o
f Th
0.0
0.1
0.2
0.3
0.4
0.5
Rat
io in
CD
4
ns RORγt+ Tregs Helios+ Tregs Th17 Th17/RORγt+ Tregs
14
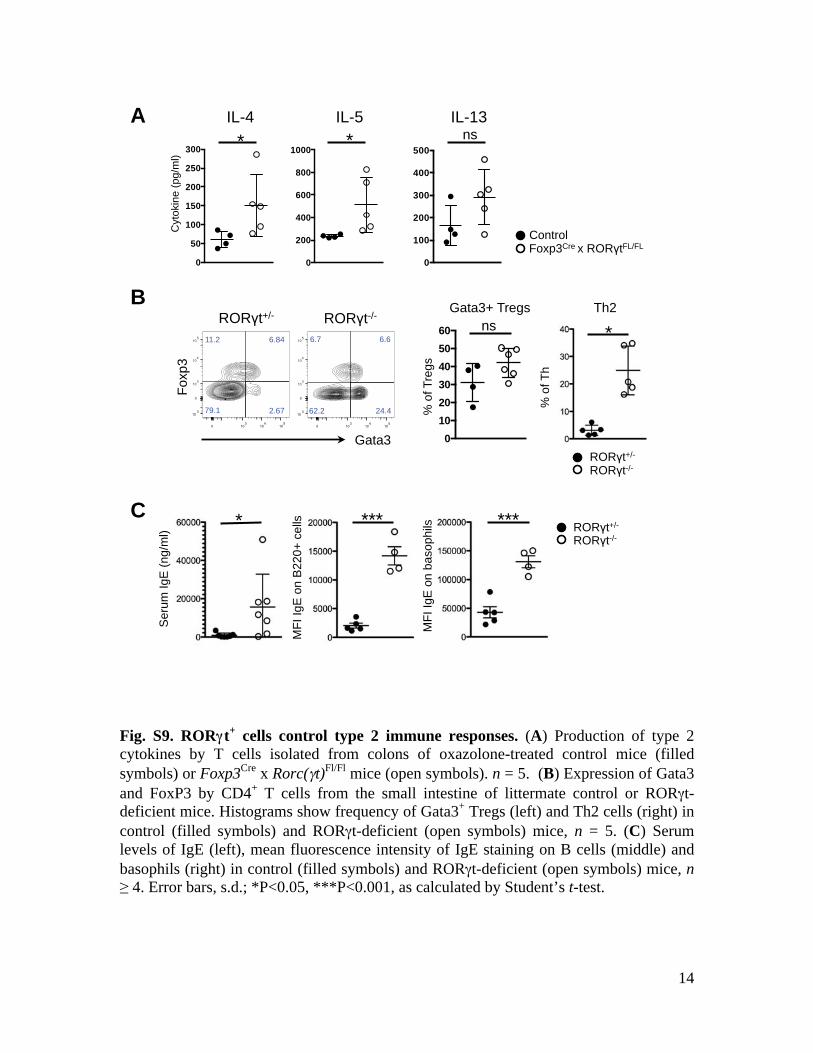
Fig. S9. RORγγt+ cells control type 2 immune responses. (A) Production of type 2 cytokines by T cells isolated from colons of oxazolone-treated control mice (filled symbols) or Foxp3Cre x Rorc(γt)Fl/Fl mice (open symbols). n = 5. (B) Expression of Gata3 and FoxP3 by CD4+ T cells from the small intestine of littermate control or RORγt-deficient mice. Histograms show frequency of Gata3+ Tregs (left) and Th2 cells (right) in control (filled symbols) and RORγt-deficient (open symbols) mice, n = 5. (C) Serum levels of IgE (left), mean fluorescence intensity of IgE staining on B cells (middle) and basophils (right) in control (filled symbols) and RORγt-deficient (open symbols) mice, n≥ 4. Error bars, s.d.; *P<0.05, ***P<0.001, as calculated by Student’s t-test.
2.67 79.1
6.84 11.2
0102030405060
*** *** * C
* ns
B RORγt+/- RORγt-/-
Foxp
3
Gata3 RORγt+/-
RORγt-/-
RORγt+/-
RORγt-/-
Ser
um Ig
E (n
g/m
l)
MFI
IgE
on
B22
0+ c
ells
MFI
IgE
on
baso
phils
%
of T
regs
% o
f Th
Th2 Gata3+ Tregs
24.4 62.2
6.6 6.7
A
0
50
100
150
200
250
300 * C
ytok
ine
(pg/
ml)
0
200
400
600
800
1000
0
100
200
300
400
500* ns
IL-4 IL-5 IL-13
Control Foxp3Cre x RORγtFL/FL
15
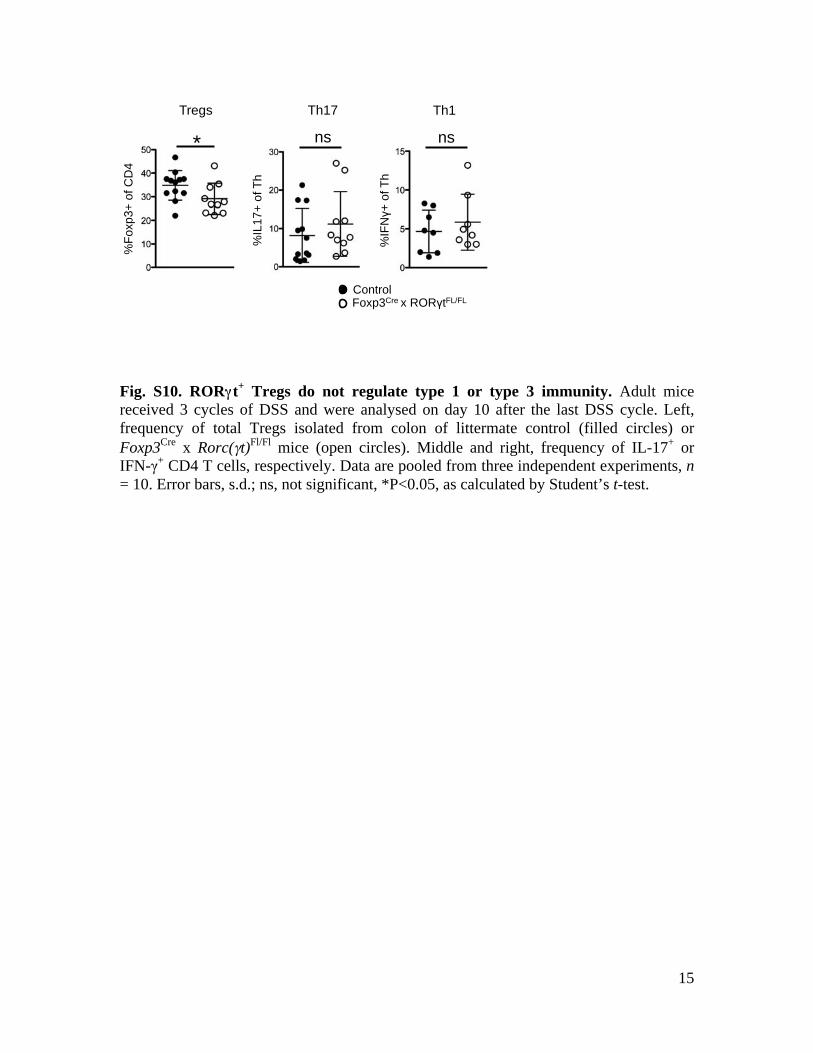
Fig. S10. RORγγt+ Tregs do not regulate type 1 or type 3 immunity. Adult mice received 3 cycles of DSS and were analysed on day 10 after the last DSS cycle. Left, frequency of total Tregs isolated from colon of littermate control (filled circles) or Foxp3Cre x Rorc(γt)Fl/Fl mice (open circles). Middle and right, frequency of IL-17+ or IFN-γ+ CD4 T cells, respectively. Data are pooled from three independent experiments, n= 10. Error bars, s.d.; ns, not significant, *P<0.05, as calculated by Student’s t-test.
Foxp3Cre x RORγtFL/FL Control
%IL
17+
of T
h
%Fo
xp3+
of C
D4
%IF
Nγ+
of T
h
* ns ns
Th17 Tregs Th1

16
Fig. S11. Mechanisms of regulation by RORγγt+ Tregs. (A) Naïve CD4+ T cells were isolated from CD45.2+ OT-II wild-type or CD45.2+ OT-IIRORγt -/- mice and adoptively transferred into CD45.1+ congenic mice, subsequently fed for 7 days with 1.5% chicken ovalbumin. Frequency of RORγt+ Tregs and Th17 cells in the small intestine in host (CD45.1) and donor (CD45.2) cells, n = 3. (B) Expression of RORγt and Gata3 by Tregs and effector CD4+ T cells in the colon of littermate control and RORγt Cre x Stat3Fl/Fl mice. (C) Production of IL-33 in cultures of colon explant from SPF and germfree mice, n ≥ 4. Error bars, s.d.; ns, not significant, *P<0.05, ***P<0.001, as calculated by Student’s t-test.
0.0
0.1
0.2
0.3
0.4
0
20
40
60
80
100
A
B C
Gata3
RO
Rγt
RORγtCre x STAT3FL/FL Control
Tregs
Effectors pg
/ml p
er m
g tis
sue
SPF GF
OT-II control OT-II RORγt-/-
Th17 RORγt+ Tregs
% o
f Tre
gs
Host Donor
*** ns
% o
f CD
4 T
0
10
20
30
40
Host Donor
***
ns
*IL-33
17
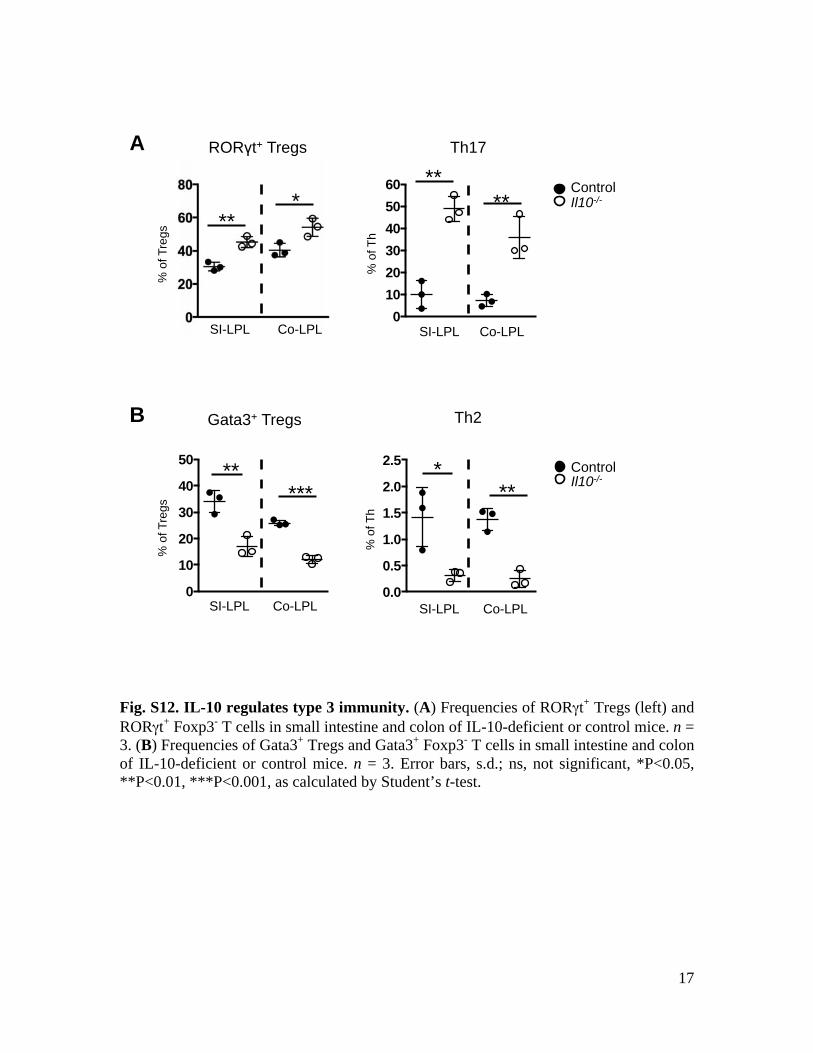
Fig. S12. IL-10 regulates type 3 immunity. (A) Frequencies of RORγt+ Tregs (left) and RORγt+ Foxp3- T cells in small intestine and colon of IL-10-deficient or control mice. n = 3. (B) Frequencies of Gata3+ Tregs and Gata3+ Foxp3- T cells in small intestine and colon of IL-10-deficient or control mice. n = 3. Error bars, s.d.; ns, not significant, *P<0.05, **P<0.01, ***P<0.001, as calculated by Student’s t-test.
0102030405060
0.0
0.5
1.0
1.5
2.0
2.5
0
10
20
30
40
50
A
B
Control Il10-/-
Control Il10-/-
** *
Co-LPL SI-LPL Co-LPL SI-LPL
** **
* **
Co-LPL SI-LPL Co-LPL SI-LPL
% o
f Th
% o
f Th
% o
f Tre
gs
RORγt+ Tregs Th17
Th2 Gata3+ Tregs
** ***
% o
f Tre
gs
18
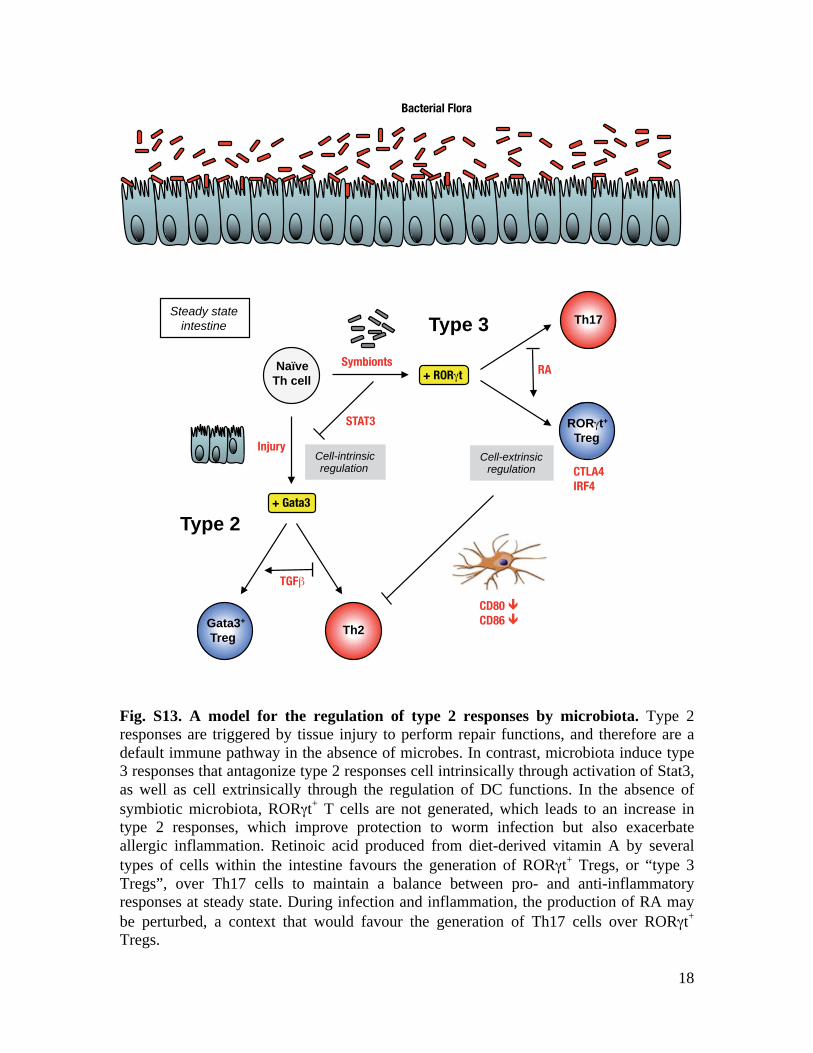
Fig. S13. A model for the regulation of type 2 responses by microbiota. Type 2 responses are triggered by tissue injury to perform repair functions, and therefore are a default immune pathway in the absence of microbes. In contrast, microbiota induce type 3 responses that antagonize type 2 responses cell intrinsically through activation of Stat3, as well as cell extrinsically through the regulation of DC functions. In the absence of symbiotic microbiota, RORγt+ T cells are not generated, which leads to an increase intype 2 responses, which improve protection to worm infection but also exacerbate allergic inflammation. Retinoic acid produced from diet-derived vitamin A by several types of cells within the intestine favours the generation of RORγt+ Tregs, or “type 3 Tregs”, over Th17 cells to maintain a balance between pro- and anti-inflammatory responses at steady state. During infection and inflammation, the production of RA may be perturbed, a context that would favour the generation of Th17 cells over RORγt+
Tregs.
Bacterial Flora
Steady state intestine
Naïve Th cell
+ Gata3
TGFβ
Th2 Gata3+ Treg
Injury
Type 2
+ RORγt
RORγt+ Treg
Th17
RA Symbionts
Type 3
STAT3
Cell-intrinsic regulation
CD80 CD86
CTLA4 IRF4
Cell-extrinsic regulation
19
References 1. J. F. Bach, The effect of infections on susceptibility to autoimmune and allergic
diseases. N Engl J Med 347, 911 (2002). 2. G. Prioult, C. Nagler-Anderson, Mucosal immunity and allergic responses: lack of
regulation and/or lack of microbial stimulation? Immunol Rev 206, 204 (2005). 3. J. Cahenzli, Y. Koller, M. Wyss, M. B. Geuking, K. D. McCoy, Intestinal microbial
diversity during early-life colonization shapes long-term IgE levels. Cell Host Microbe 14, 559 (2013).
4. K. D. McCoy et al., Natural IgE production in the absence of MHC Class II cognate help. Immunity 24, 329 (2006).
5. T. Herbst et al., Dysregulation of allergic airway inflammation in the absence of microbial colonization. Am J Respir Crit Care Med 184, 198 (2011).
6. D. A. Hill et al., Commensal bacteria-derived signals regulate basophil hematopoiesis and allergic inflammation. Nat Med 18, 538 (2012).
7. M. E. Bashir, S. Louie, H. N. Shi, C. Nagler-Anderson, Toll-like receptor 4 signaling by intestinal microbes influences susceptibility to food allergy. J Immunol 172, 6978 (2004).
8. S. L. Russell et al., Early life antibiotic-driven changes in microbiota enhance susceptibility to allergic asthma. EMBO Rep 13, 440 (2012).
9. T. Olszak et al., Microbial exposure during early life has persistent effects on natural killer T cell function. Science 336, 489 (2012).
10. Ivanov, II et al., Specific microbiota direct the differentiation of IL-17-producing T-helper cells in the mucosa of the small intestine. Cell Host Microbe 4, 337 (2008).
11. S. K. Lathrop et al., Peripheral education of the immune system by colonic commensal microbiota. Nature 478, 250 (2011).
12. S. Z. Josefowicz et al., Extrathymically generated regulatory T cells control mucosal TH2 inflammation. Nature 482, 395 (2012).
13. Ivanov, II et al., The orphan nuclear receptor RORγt directs the differentiation program of proinflammatory IL-17+ T helper cells. Cell 126, 1121 (2006).
14. G. Eberl et al., An essential function for the nuclear receptor RORγt in the generation of fetal lymphoid tissue inducer cells. Nat Immunol 5, 64 (2004).
15. M. Lochner et al., In vivo equilibrium of proinflammatory IL-17+ and regulatory IL-10+ Foxp3+ RORγt+ T cells. J Exp Med 205, 1381 (2008).
16. M. Lochner et al., Restricted microbiota and absence of cognate TCR antigen leads to an unbalanced generation of Th17 cells. J Immunol 186, 1531 (2011).
17. A. M. Thornton et al., Expression of Helios, an Ikaros transcription factor family member, differentiates thymic-derived from peripherally induced Foxp3+ T regulatory cells. J Immunol 184, 3433 (2010).
18. J. M. Weiss et al., Neuropilin 1 is expressed on thymus-derived natural regulatory T cells, but not mucosa-generated induced Foxp3+ T reg cells. J Exp Med 209, 1723 (2012).
19. E. A. Wohlfert et al., GATA3 controls Foxp3(+) regulatory T cell fate during inflammation in mice. J Clin Invest 121, 4503 (2011).
20. C. Schiering et al., The alarmin IL-33 promotes regulatory T-cell function in the intestine. Nature 513, 564 (2014).

20
21. K. Atarashi et al., Induction of colonic regulatory T cells by indigenous Clostridium species. Science 331, 337 (2011).
22. Y. Furusawa et al., Commensal microbe-derived butyrate induces the differentiation of colonic regulatory T cells. Nature 504, 446 (2013).
23. P. M. Smith et al., The microbial metabolites, short-chain fatty acids, regulate colonic Treg cell homeostasis. Science 341, 569 (2013).
24. V. Gaboriau-Routhiau et al., The key role of segmented filamentous bacteria in the coordinated maturation of gut helper T cell responses. Immunity 31, 677 (2009).
25. I. I. Ivanov et al., Induction of Intestinal Th17 Cells by Segmented Filamentous Bacteria. Cell 139, 485 (2009).
26. C. T. Weaver, R. D. Hatton, P. R. Mangan, L. E. Harrington, IL-17 family cytokines and the expanding diversity of effector T cell lineages. Annu Rev Immunol 25, 821 (2007).
27. E. Bettelli et al., Reciprocal developmental pathways for the generation of pathogenic effector TH17 and regulatory T cells. Nature 441, 235 (2006).
28. C. L. Langrish et al., IL-23 drives a pathogenic T cell population that induces autoimmune inflammation. J Exp Med 201, 233 (2005).
29. D. Mucida et al., Reciprocal TH17 and regulatory T cell differentiation mediated by retinoic acid. Science 317, 256 (2007).
30. S. P. Spencer et al., Adaptation of innate lymphoid cells to a micronutrient deficiency promotes type 2 barrier immunity. Science 343, 432 (2014).
31. S. A. van de Pavert et al., Maternal retinoids control type 3 innate lymphoid cells and set the offspring immunity. Nature 508, 123 (2014).
32. M. Boirivant, I. J. Fuss, A. Chu, W. Strober, Oxazolone colitis: A murine model of T helper cell type 2 colitis treatable with antibodies to interleukin 4. J Exp Med 188, 1929 (1998).
33. F. Heller, I. J. Fuss, E. E. Nieuwenhuis, R. S. Blumberg, W. Strober, Oxazolone colitis, a Th2 colitis model resembling ulcerative colitis, is mediated by IL-13-producing NK-T cells. Immunity 17, 629 (2002).
34. F. Yu, S. Sharma, J. Edwards, L. Feigenbaum, J. Zhu, Dynamic expression of transcription factors T-bet and GATA-3 by regulatory T cells maintains immunotolerance. Nat Immunol, (2014).
35. D. Rudra et al., Transcription factor Foxp3 and its protein partners form a complex regulatory network. Nat Immunol 13, 1010 (2012).
36. L. Zhou et al., TGF-beta-induced Foxp3 inhibits T(H)17 cell differentiation by antagonizing RORgammat function. Nature 453, 236 (2008).
37. H. Yasukawa et al., IL-6 induces an anti-inflammatory response in the absence of SOCS3 in macrophages. Nat Immunol 4, 551 (2003).
38. K. Wing et al., CTLA-4 control over Foxp3+ regulatory T cell function. Science 322, 271 (2008).
39. Y. Zheng et al., Regulatory T-cell suppressor program co-opts transcription factor IRF4 to control T(H)2 responses. Nature 458, 351 (2009).
40. J. E. Allen, T. E. Sutherland, Host protective roles of type 2 immunity: parasite killing and tissue repair, flip sides of the same coin. Semin Immunol 26, 329 (2014).
41. E. Kernbauer, Y. Ding, K. Cadwell, An enteric virus can replace the beneficial function of commensal bacteria. Nature 516, 94 (2014).
21
42. T. A. Wynn, Cellular and molecular mechanisms of fibrosis. J Pathol 214, 199 (2008).
43. Y. Y. Wan, R. A. Flavell, Identifying Foxp3-expressing suppressor T cells with a bicistronic reporter. Proc Natl Acad Sci U S A 102, 5126 (2005).
44. C. Ohnmacht et al., Constitutive ablation of dendritic cells breaks self-tolerance of CD4 T cells and results in spontaneous fatal autoimmunity. J Exp Med 206, 549 (2009).
45. H. Schorle, T. Holtschke, T. Hunig, A. Schimpl, I. Horak, Development and function of T cells in mice rendered interleukin-2 deficient by gene targeting. Nature 352, 621 (1991).
46. R. Kuhn, J. Lohler, D. Rennick, K. Rajewsky, W. Muller, Interleukin-10-deficient mice develop chronic enterocolitis. Cell 75, 263 (1993).
47. M. Kopf et al., Impaired immune and acute-phase responses in interleukin-6-deficient mice. Nature 368, 339 (1994).
48. P. Thakker et al., IL-23 is critical in the induction but not in the effector phase of experimental autoimmune encephalomyelitis. J Immunol 178, 2589 (2007).
49. D. Grote, A. Souabni, M. Busslinger, M. Bouchard, Pax 2/8-regulated Gata 3 expression is necessary for morphogenesis and guidance of the nephric duct in the developing kidney. Development 133, 53 (2006).
50. K. Takeda et al., Enhanced Th1 activity and development of chronic enterocolitis in mice devoid of Stat3 in macrophages and neutrophils. Immunity 10, 39 (1999).
51. G. Eberl, D. R. Littman, Thymic origin of intestinal αβ T cells revealed by fate mapping of RORγt+ cells. Science 305, 248 (2004).
52. M. J. Barnden, J. Allison, W. R. Heath, F. R. Carbone, Defective TCR expression in transgenic mice constructed using cDNA-based alpha- and beta-chain genes under the control of heterologous regulatory elements. Immunol Cell Biol 76, 34 (1998).
53. S. Sawa et al., RORgammat(+) innate lymphoid cells regulate intestinal homeostasis by integrating negative signals from the symbiotic microbiota. Nat Immunol 12, 320 (2011).