supplementary figure s1
DESCRIPTION
Supplementary Figure S1. 1 H- 15 N HSQC spectra of 15 N-labeled ZG16p titrated with Man- O - Thr (a), Man- O -peptide (b), Manα1-3Man (c) and Glc 1-3Glc (d). Marked peaks are selected for the calculation of dissociation constants (Figure 4). (a) Man- O -Thr. (b) Mannose- O -peptide. - PowerPoint PPT PresentationTRANSCRIPT
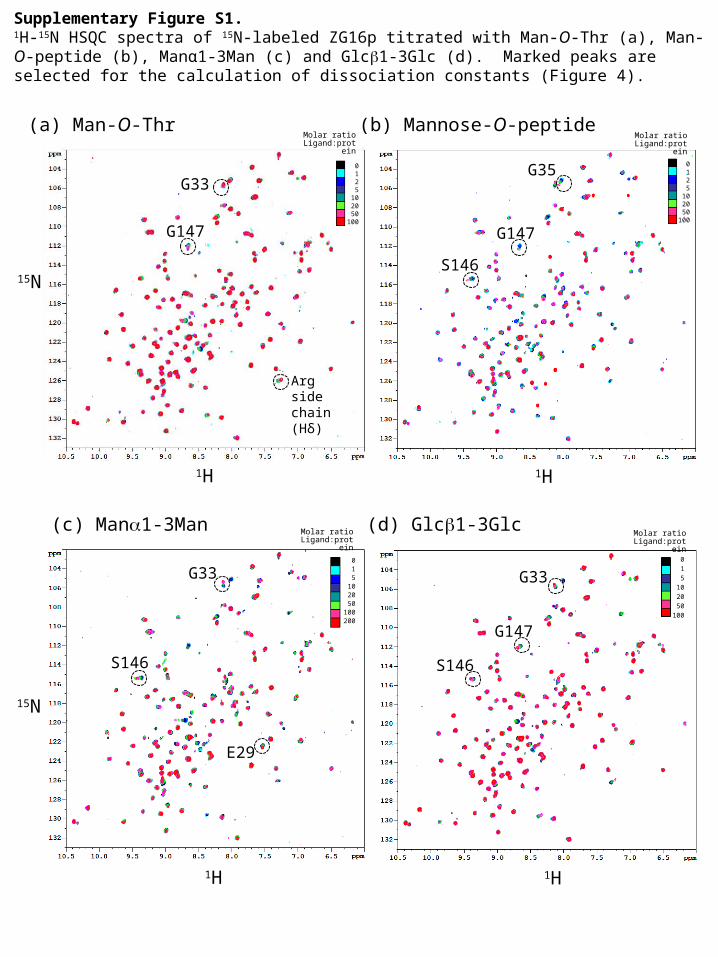
Supplementary Figure S1.1H-15N HSQC spectra of 15N-labeled ZG16p titrated with Man-O-Thr (a), Man-O-peptide (b), Manα1-3Man (c) and Glc1-3Glc (d). Marked peaks are selected for the calculation of dissociation constants (Figure 4).
15N
15N
1H 1H
Arg side chain (Hδ)
G147
G33
S146
G147
G35
E29
S146
G33
S146
G147
G33
(a) Man-O-Thr (b) Mannose-O-peptide
(c) Mana1-3Man (d) Glcb1-3Glc
0125
102050
100
0125
102050
100
015
102050
100200
0
1
5
10
20
50
100
Molar ratioLigand:protei
n
Molar ratioLigand:protei
n
Molar ratioLigand:protei
n
Molar ratioLigand:protei
n
1H 1H
(a) Man-O-Ser (b) Man-O-Thr
(c) Mana1-3Man (d) Glcb1-3Glc
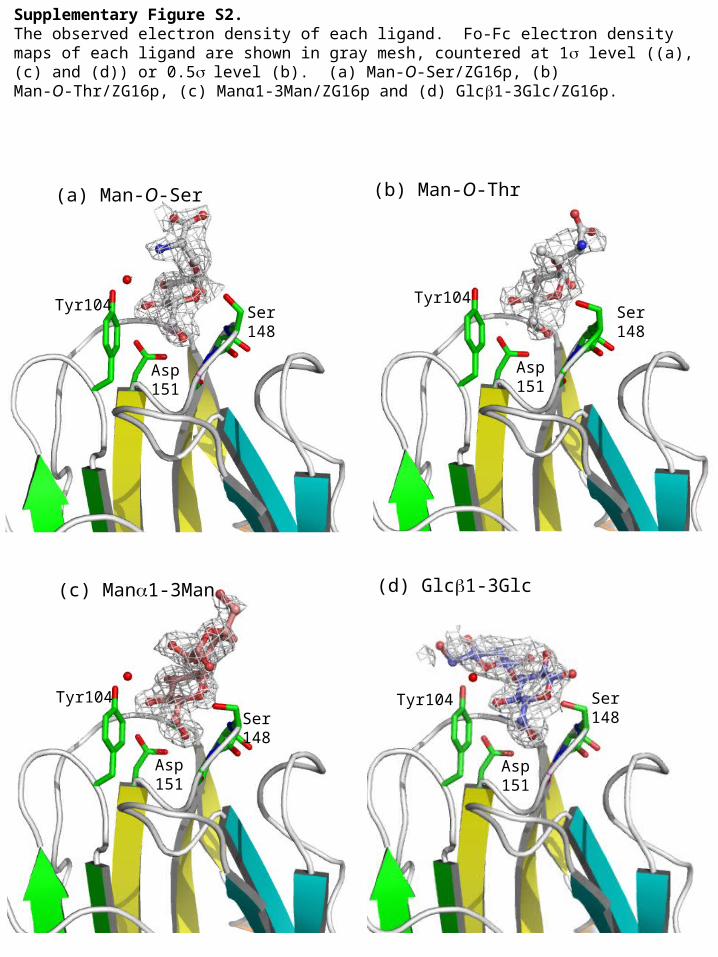
Supplementary Figure S2. The observed electron density of each ligand. Fo-Fc electron density maps of each ligand are shown in gray mesh, countered at 1s level ((a), (c) and (d)) or 0.5 s level (b). (a) Man-O-Ser/ZG16p, (b) Man-O-Thr/ZG16p, (c) Manα1-3Man/ZG16p and (d) Glc1-3Glc/ZG16p.
Asp151
Tyr104 Tyr104
Asp151
Tyr104
Asp151
Asp151
Tyr104
Ser148
Ser148
Ser148Ser
148