supplementary figure 1
DESCRIPTION
Supplementary Figure 1. Red: stable co-clustering Blue: no co-clustering. 2-cluster. 3-cluster. 5-cluster. 4-cluster. Supplementary Figure 2. Supplementary Figure 3. EGFR mutation. P=0.16. Supplementary Figure 4. Supplementary Figure 5. EGFR mutation. Supplementary Figure 6. - PowerPoint PPT PresentationTRANSCRIPT
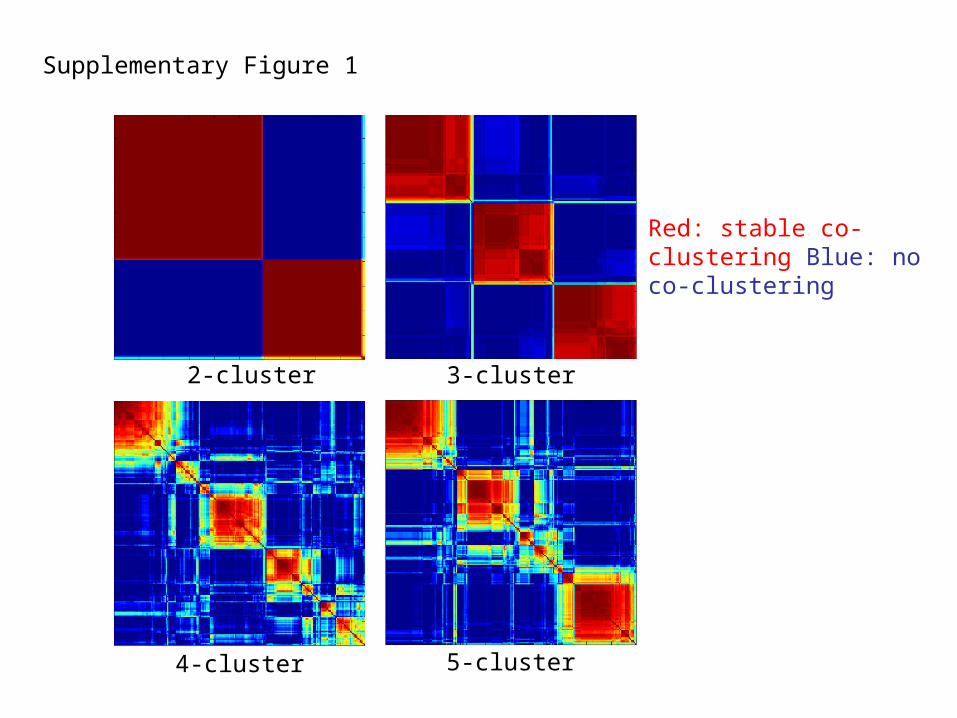
Supplementary Figure 1
2-cluster 3-cluster
4-cluster 5-cluster
Red: stable co-clustering Blue: no co-clustering
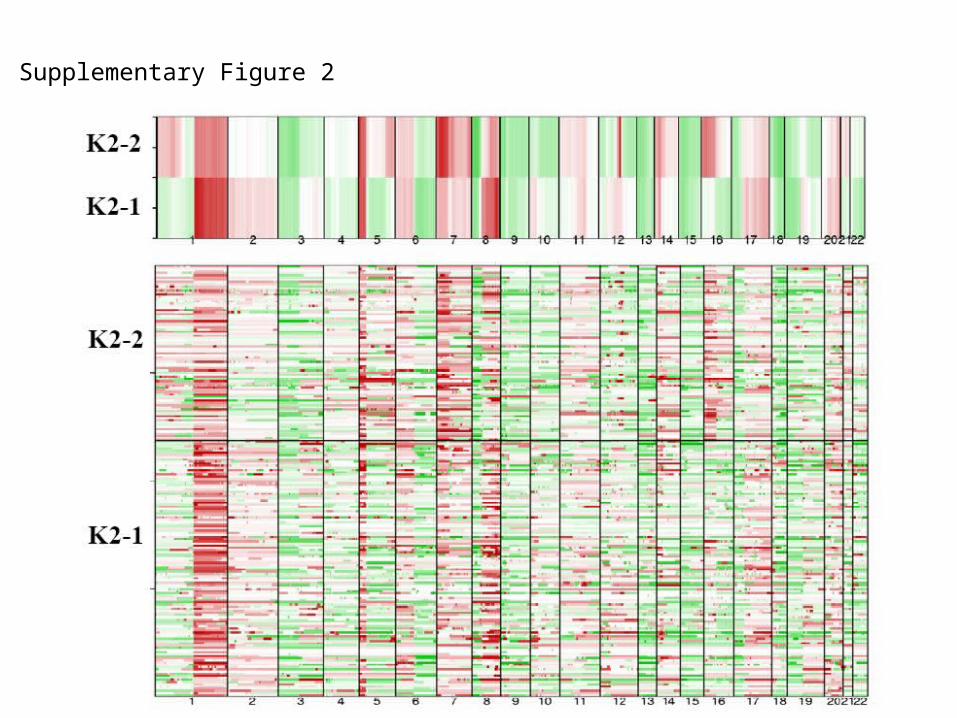
Supplementary Figure 2
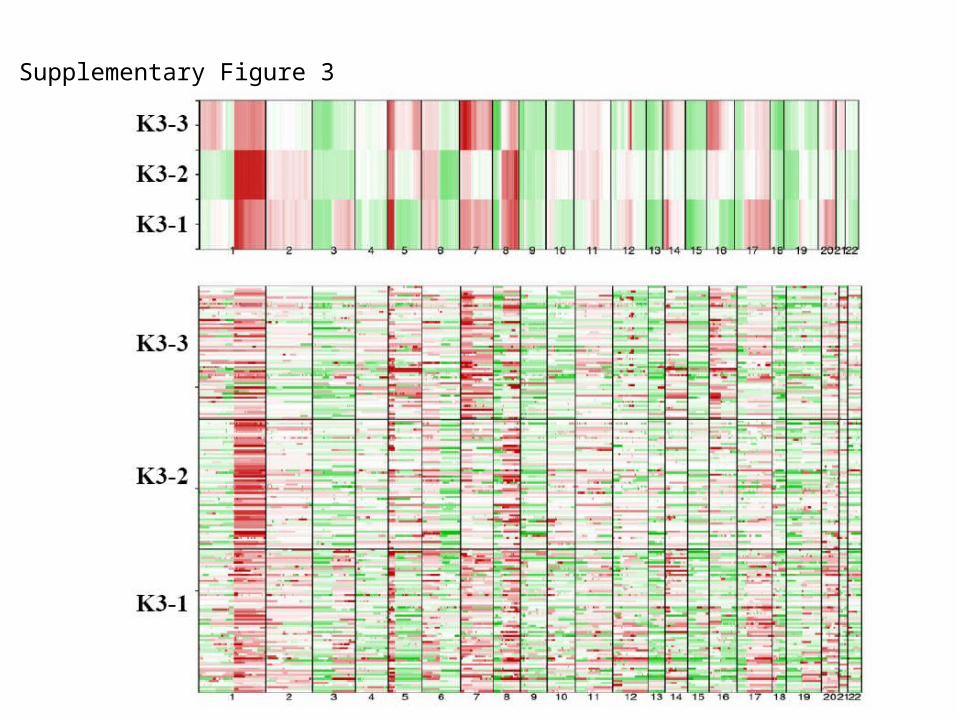
Supplementary Figure 3

Supplementary Figure 4
P=0.16
EGFR mutation
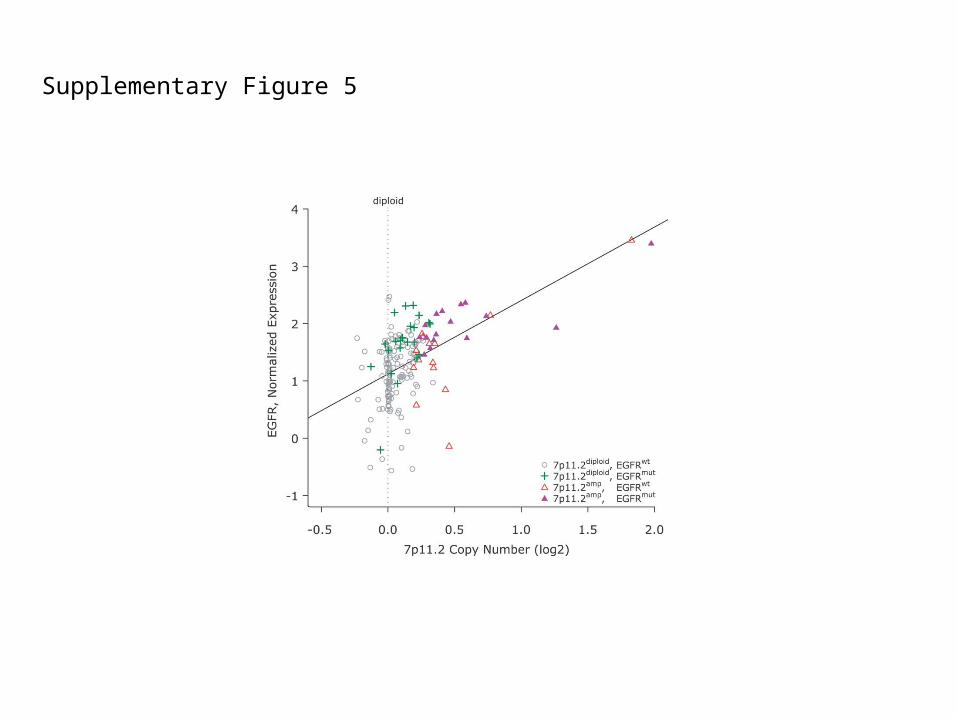
Supplementary Figure 5

KRAS mutation
EGFR mutation
Supplementary Figure 6
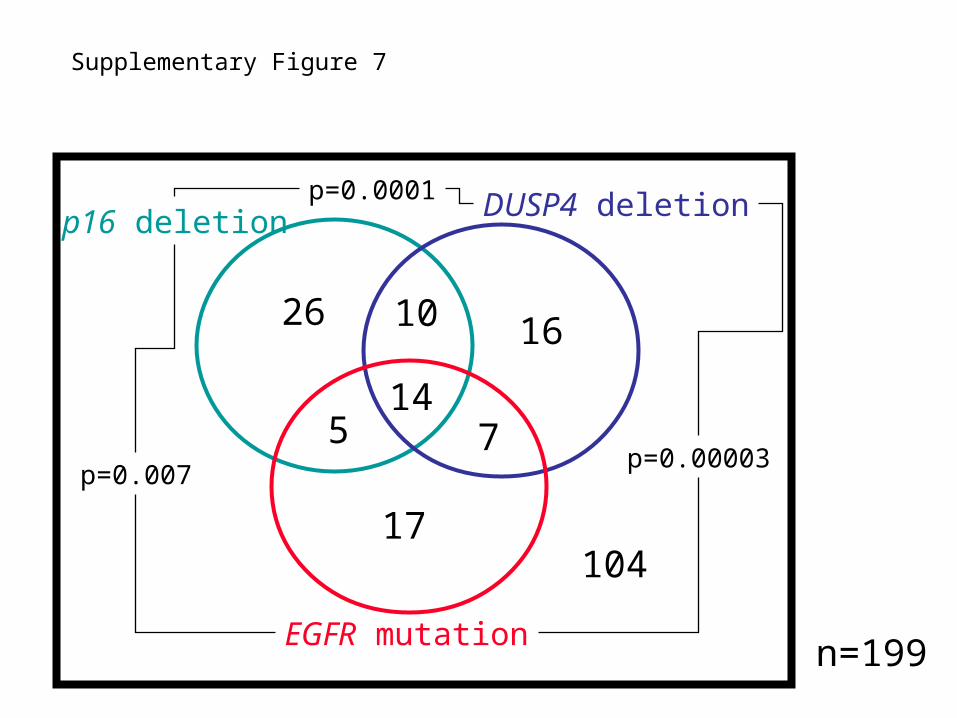
Supplementary Figure 7
147
10
5
17
1626
EGFR mutation
DUSP4 deletionp16 deletion
104
n=199
p=0.007
p=0.0001
p=0.00003
0
1E-16
2E-16
3E-16
4E-16
5E-16
6E-16
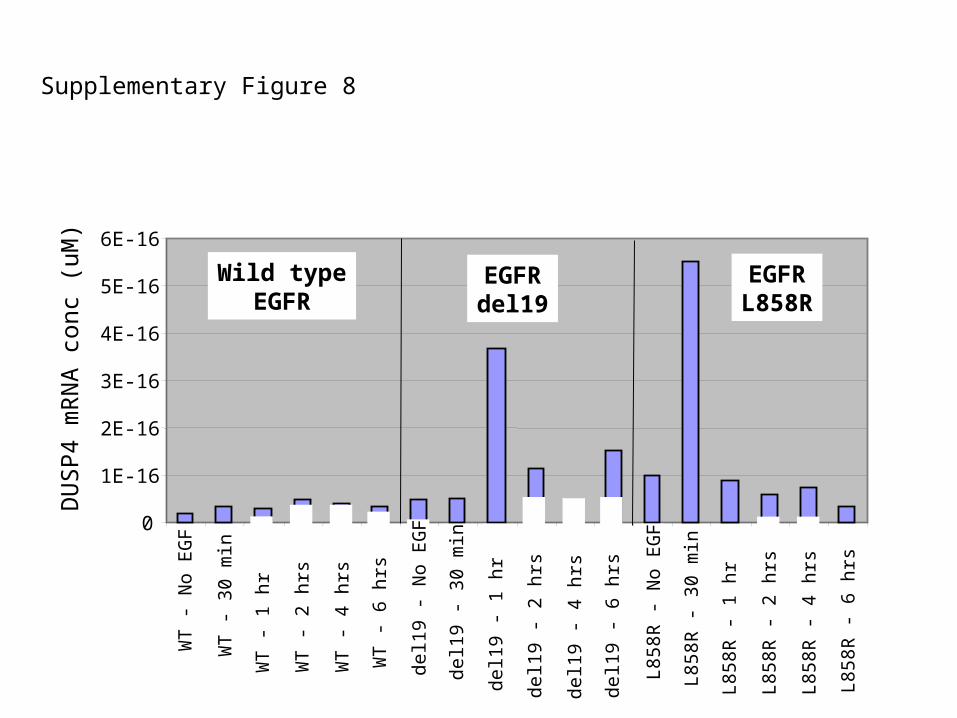
Wild typeEGFR
EGFRdel19
EGFRL858R
Supplementary Figure 8D
US
P4
mR
NA
con
c (u
M)
WT
- N
o E
GF
WT
- 3
0 m
in
WT
- 1
hr
WT
- 2
hrs
WT
- 4
hrs
WT
- 6
hrs
del1
9 -
No
EG
F
del1
9 -
30 m
in
del1
9 -
1 hr
del1
9 -
2 hr
s
del1
9 -
4 hr
s
del1
9 -
6 hr
s
L85
8R -
No
EG
F
L85
8R -
30
min
L85
8R -
1 h
r
L85
8R -
2 h
rs
L85
8R -
4 h
rs
L85
8R -
6 h
rs
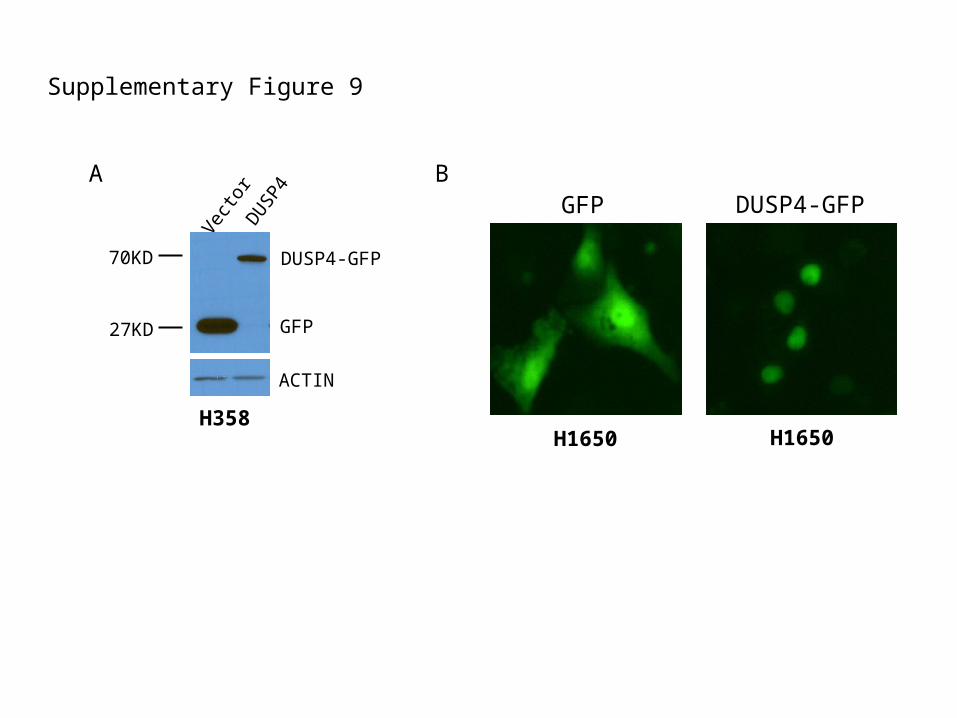
H1650
GFP DUSP4-GFP
Supplementary Figure 9
GFP
DUSP4-GFP
27KD
70KD
ACTIN
H358
Vect
orD
USP
4A B
H1650
GFP DUSP4-GFP
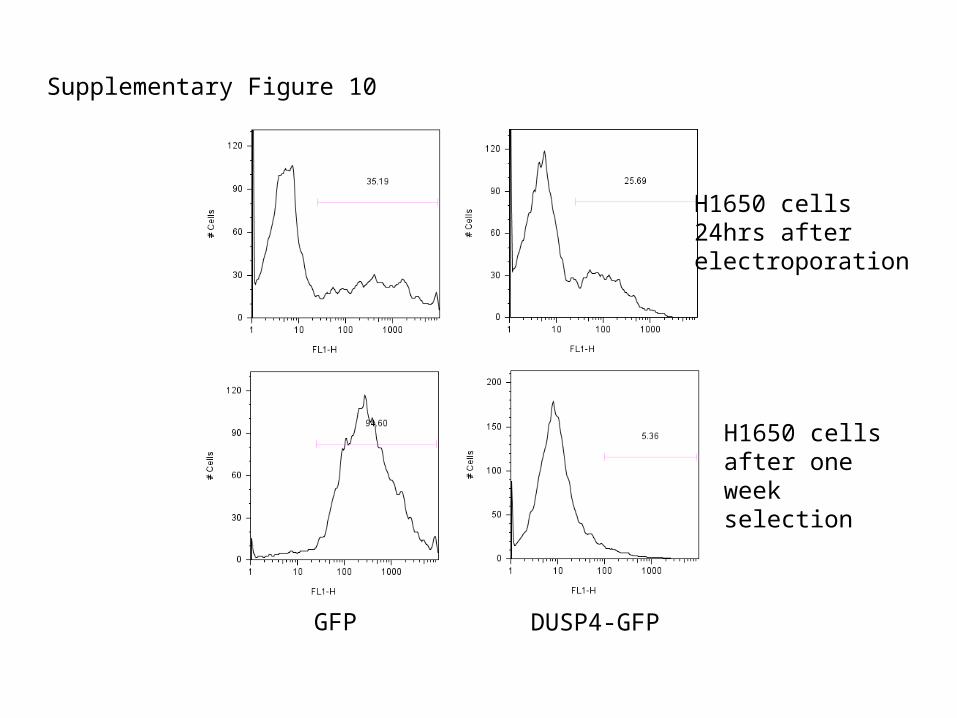
H1650 cells24hrs afterelectroporation
H1650 cellsafter one week selection
Supplementary Figure 10