superhydrophobic surfaces from nano- and microstructured ... · 1 supplementary information...
TRANSCRIPT
1
Supplementary information
Superhydrophobic surfaces from nano- and microstructured
cellulose stearoyl ester
Andreas Geissler,a,1
Longquan Chen,b,1
Kai Zhang,a* Elmar Bonaccurso
b and Markus Biesalski
a
a Institute of Macromolecular Chemistry and Paper Chemistry, Technische Universität
Darmstadt, Petersenstr. 22, D-64287 Darmstadt, Germany. Fax: +49 6151 16 72931; Tel.: +49
6151 16 75381; Email: [email protected] b
Center of Smart Interfaces, Technische Universität Darmstadt, Petersenstr. 17, D-64287
Darmstadt, Germany 1
AG and LQC contributed equally to this work.
Electronic Supplementary Material (ESI) for Chemical CommunicationsThis journal is © The Royal Society of Chemistry 2013
2
Experimental section
Materials: Microcrystalline cellulose (MCC) with granule size of 50 µm and stearoyl
chloride (90%) were bought from Sigma-Aldrich (Steinheim, Germany). Dry pyridine, ethyl
acetate and dichloromethane were received from VWR International GmbH (Darmstadt,
Germany). Glycerol (99.5%) was purchased from Carl Roth GmbH (Karlsruhe, Germany).
Other chemicals are all of analytical grade and used as received.
Synthesis of cellulose stearoyl ester (CSE): CSE was prepared according to ref. [17b]
with a few modifications. In a typical case, 1 g MCC was washed with methanol and pyridine
to remove traces of moisture before it was suspended in 30 ml pyridine. Then, the cellulose
suspension was heated up to 100°C and 13.83 ml stearoyl acid chloride (6 mol stearoyl acid
chloride per mol anhydroglucose units of cellulose) was dropped to the hot cellulose
suspension, while it was purged with nitrogen. After 2 h stirring at 100°C, the reaction
mixture (still hot) was poured into 200 ml ethanol. The precipitate was separated by
centrifugation. Thereafter, the product was purified through repeated dissolution in
dichloromethane and precipitation in ethanol. Finally, the product was dried under vacuum at
room temperature for further use.
Nanoprecipitation of CSE: CSE was turned into nano- or microparticle via
nanoprecipitation. Briefly, CSE was dissolved in dichloromethane at a concentration of 1
mg/ml. Then, 30 ml CSE solution was precipitated in 250 ml acetone or 90 ml ethyl acetate
under vigorous stirring for further 30 min, leading to white suspensions. Thereafter, the
suspension in acetone was centrifuged at 4500 rpm for 10 min at 4°C. 200 mg of precipitate
were re-dispersed in 4 ml ethanol for further spin coating or solvent casting and in 8 ml
Electronic Supplementary Material (ESI) for Chemical CommunicationsThis journal is © The Royal Society of Chemistry 2013
3
ethanol for spray coating. The suspension in ethyl acetate was maintained still for about 20 h
and ready for further processing.
Preparation of superhydrophobic films: CSE particles were used to fabricate
superhydrophobic films using diverse film-formation techniques. Spray coating was carried
out using an airbrush (model: Colani) from Harder & Steenbeck GmbH & Co. KG
(Norderstedt, Germany) at a pressure of 4 bar and a distance of 25 cm under air conditions.
Spin coating was performed on Delta 6RC spin coater (Süss MicroTec AG, Garching,
Germany) at room temperature. Solvent casting was done by pipetting 1 ml of suspension
onto glass surface under careful shaking until evenly distribution of the suspension and then
dried in air.
Characterization: The contents of carbon, hydrogen and nitrogen were determined
with Elemental Analyser vario EL III CHN from Elementar (Hanau, Germany). The total
degree of substitution ascribed to stearoyl groups (DSSE) was calculated based on their
contents.[17a]
Scanning electron microscopy (SEM) images were obtained on a Philips XL30
FEG high-resolution scanning electron microscope (HR-SEM) (SEMTech Solutions, Inc.,
North Billerica, MA). A layer from platinum/palladium of 3 nm was coated on the surface of
samples before SEM measurements.
Drop and jet impact measurements: Water drops with radius of ~1.3 mm were
released at different heights above the surfaces. The water jet was generated through a needle
with volume velocity controlled by a syringe pump. A cold light source with a diffuser was
used to illuminate on the drop and surface from the back. The impact process was recorded by
a high-speed video camera (FASTCAM SA-1, Photron Inc., USA) with 10,000 fps.
Electronic Supplementary Material (ESI) for Chemical CommunicationsThis journal is © The Royal Society of Chemistry 2013
4
In droplet impact dynamics, there is a threshold velocity above which the drop
rebounds from a surface. For a surface with an advancing contact angle and a receding
contact angle θR, the lowest rebound velocity is estimated to be [ | |
]
;22
where , , are the surface tension, density and radius of drop. VT quantifies the water-
repellency of a surface: the smaller VT, the higher the water-repellency. As shown in Figure 3a,
the lowest velocity for full rebound of a ~9 water droplet on nanostructured or nano-
/microstructured surfaces was ~0.05 m/s. This value is close to the estimated threshold
velocity VT ~ 0.04 m/s (θA ≈ 160°, θR ≈ 155°) and to the value observed on lotus leaves.23
The stability of superhydrophobicity in dynamic testing is determined by the structure
of the surface. The wetting state of impinging drops or liquid jets is determined by the
competition between the wetting pressure and the anti-wetting pressure . The wetting
pressure scales as , which is from the inertia of the drop or jet,
[23b,24] where V is the
velocity of the impinging drop or liquid jet. The anti-wetting pressure is the capillary pressure
estimated as √
.[23b,24]
S is the average size of pores on a surface. For our
nanostructured and nano-/microstructured films, the average pore size in the substrate near the
surface is ~200 nm (Fig. 2c & 2f). These pores exert a capillary pressure of ~0.18 MPa
according to the equation above, which is much larger than the wetting pressure (~2 kPa with
V of ~1.5 m/s). Thus, our films have the appropriate surface structure required for
superhydrophobicity in addition to the hydrophobic chemical feature.
Electronic Supplementary Material (ESI) for Chemical CommunicationsThis journal is © The Royal Society of Chemistry 2013

5
Further methods:
FT IR:
Experimental: FT IR was conducted on Spectrum One FT IR Spectrometer (PerkinElmer,
Massachusetts, USA) at room temperature (RT) between 4000 and 600 cm-1
with a resolution
of 4 cm-1
. The samples were measured twice per 16 scans and an average spectrum was then
generated for each sample. Baseline correction was conducted using the method ‘concave
rubber band algorithm’ with 200 baseline points and 5 iterations.
Results: Bands at 2916 and 2849 cm-1
are due to asymmetric C-H stretching vibrations and
symmetric C-H stretching vibrations, respectively.25
The signal at 1746 cm-1
is ascribed to
C=O stretching vibrations of ester bonds.26
The bands at 1467 cm-1
is attributed to symmetric
C-H deformation vibrations, band at 1158 cm-1
derived from C-O-C stretching vibrations and
signal at 720 cm-1
due to C-C rocking vibrations.25,27,28
Fig. S1. FT IR spectrum (3500-500 cm-1
) of cellulose (red) and CSE (black). It is visible that
CSE shows characteristic signals due to the presence of stearoyl groups, while the bands due
to vibrations of cellulose backbone disappeared, e.g. at 1030 cm-1
.
Electronic Supplementary Material (ESI) for Chemical CommunicationsThis journal is © The Royal Society of Chemistry 2013
6
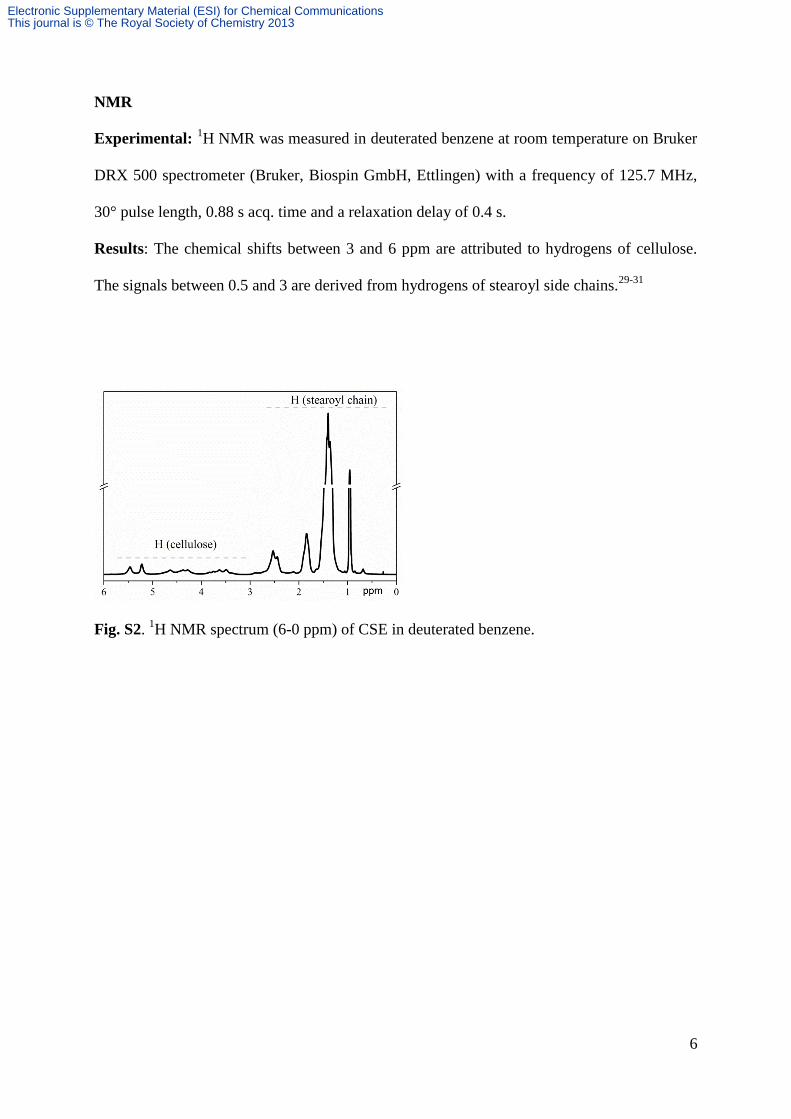
NMR
Experimental: 1H NMR was measured in deuterated benzene at room temperature on Bruker
DRX 500 spectrometer (Bruker, Biospin GmbH, Ettlingen) with a frequency of 125.7 MHz,
30° pulse length, 0.88 s acq. time and a relaxation delay of 0.4 s.
Results: The chemical shifts between 3 and 6 ppm are attributed to hydrogens of cellulose.
The signals between 0.5 and 3 are derived from hydrogens of stearoyl side chains.29-31
Fig. S2. 1H NMR spectrum (6-0 ppm) of CSE in deuterated benzene.
Electronic Supplementary Material (ESI) for Chemical CommunicationsThis journal is © The Royal Society of Chemistry 2013
7
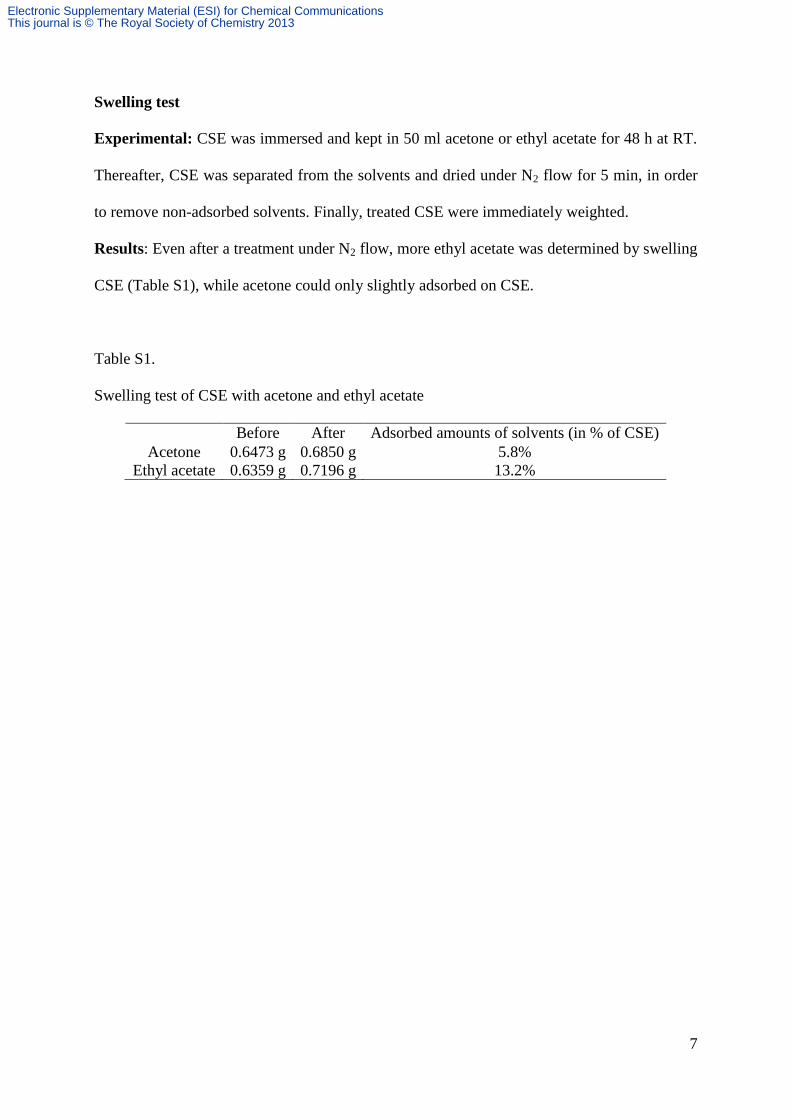
Swelling test
Experimental: CSE was immersed and kept in 50 ml acetone or ethyl acetate for 48 h at RT.
Thereafter, CSE was separated from the solvents and dried under N2 flow for 5 min, in order
to remove non-adsorbed solvents. Finally, treated CSE were immediately weighted.
Results: Even after a treatment under N2 flow, more ethyl acetate was determined by swelling
CSE (Table S1), while acetone could only slightly adsorbed on CSE.
Table S1.
Swelling test of CSE with acetone and ethyl acetate
Before After Adsorbed amounts of solvents (in % of CSE)
Acetone 0.6473 g 0.6850 g 5.8%
Ethyl acetate 0.6359 g 0.7196 g 13.2%
Electronic Supplementary Material (ESI) for Chemical CommunicationsThis journal is © The Royal Society of Chemistry 2013
8
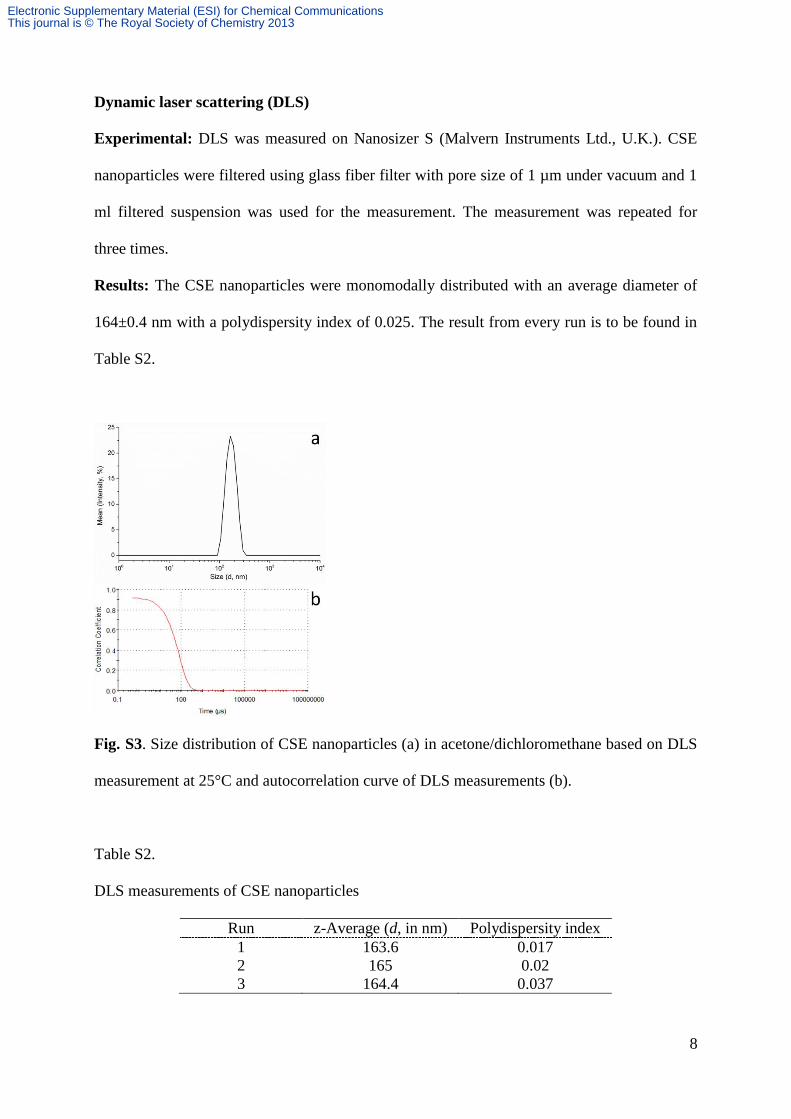
Dynamic laser scattering (DLS)
Experimental: DLS was measured on Nanosizer S (Malvern Instruments Ltd., U.K.). CSE
nanoparticles were filtered using glass fiber filter with pore size of 1 µm under vacuum and 1
ml filtered suspension was used for the measurement. The measurement was repeated for
three times.
Results: The CSE nanoparticles were monomodally distributed with an average diameter of
164±0.4 nm with a polydispersity index of 0.025. The result from every run is to be found in
Table S2.
Fig. S3. Size distribution of CSE nanoparticles (a) in acetone/dichloromethane based on DLS
measurement at 25°C and autocorrelation curve of DLS measurements (b).
Table S2.
DLS measurements of CSE nanoparticles
Run z-Average (d, in nm) Polydispersity index
1 163.6 0.017
2 165 0.02
3 164.4 0.037
Electronic Supplementary Material (ESI) for Chemical CommunicationsThis journal is © The Royal Society of Chemistry 2013
9
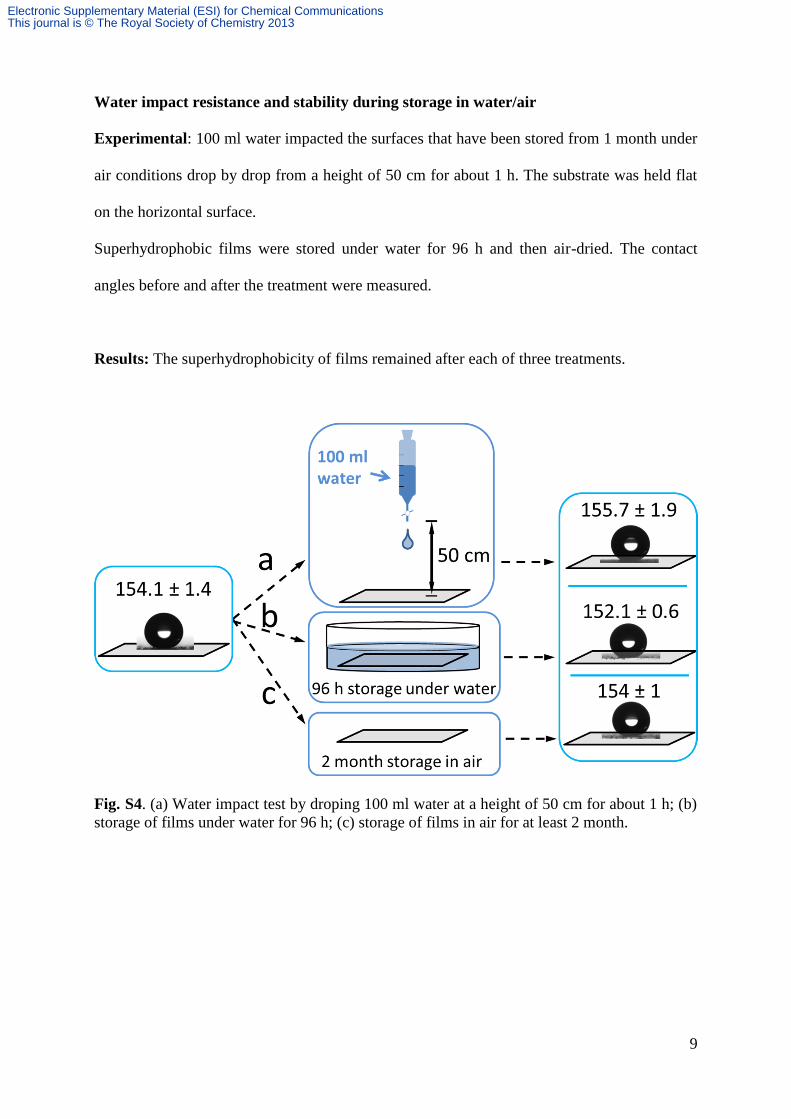
Water impact resistance and stability during storage in water/air
Experimental: 100 ml water impacted the surfaces that have been stored from 1 month under
air conditions drop by drop from a height of 50 cm for about 1 h. The substrate was held flat
on the horizontal surface.
Superhydrophobic films were stored under water for 96 h and then air-dried. The contact
angles before and after the treatment were measured.
Results: The superhydrophobicity of films remained after each of three treatments.
Fig. S4. (a) Water impact test by droping 100 ml water at a height of 50 cm for about 1 h; (b)
storage of films under water for 96 h; (c) storage of films in air for at least 2 month.
Electronic Supplementary Material (ESI) for Chemical CommunicationsThis journal is © The Royal Society of Chemistry 2013
10
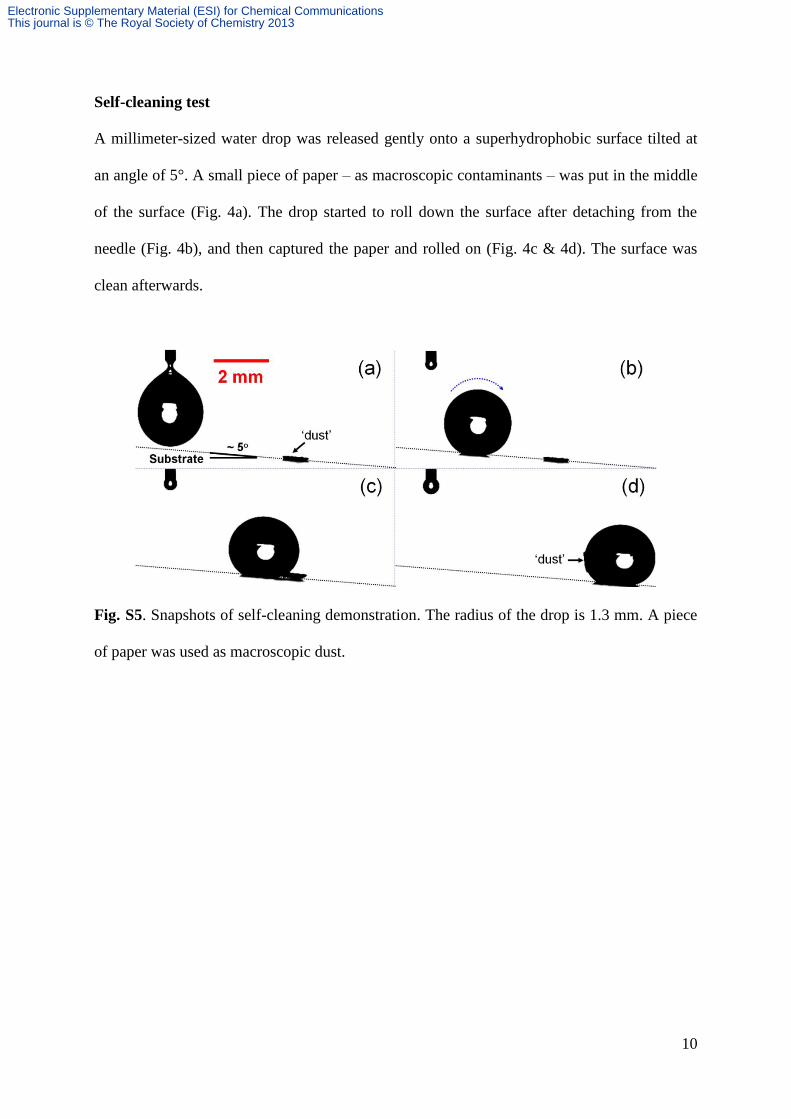
Self-cleaning test
A millimeter-sized water drop was released gently onto a superhydrophobic surface tilted at
an angle of 5°. A small piece of paper – as macroscopic contaminants – was put in the middle
of the surface (Fig. 4a). The drop started to roll down the surface after detaching from the
needle (Fig. 4b), and then captured the paper and rolled on (Fig. 4c & 4d). The surface was
clean afterwards.
Fig. S5. Snapshots of self-cleaning demonstration. The radius of the drop is 1.3 mm. A piece
of paper was used as macroscopic dust.
Electronic Supplementary Material (ESI) for Chemical CommunicationsThis journal is © The Royal Society of Chemistry 2013
11
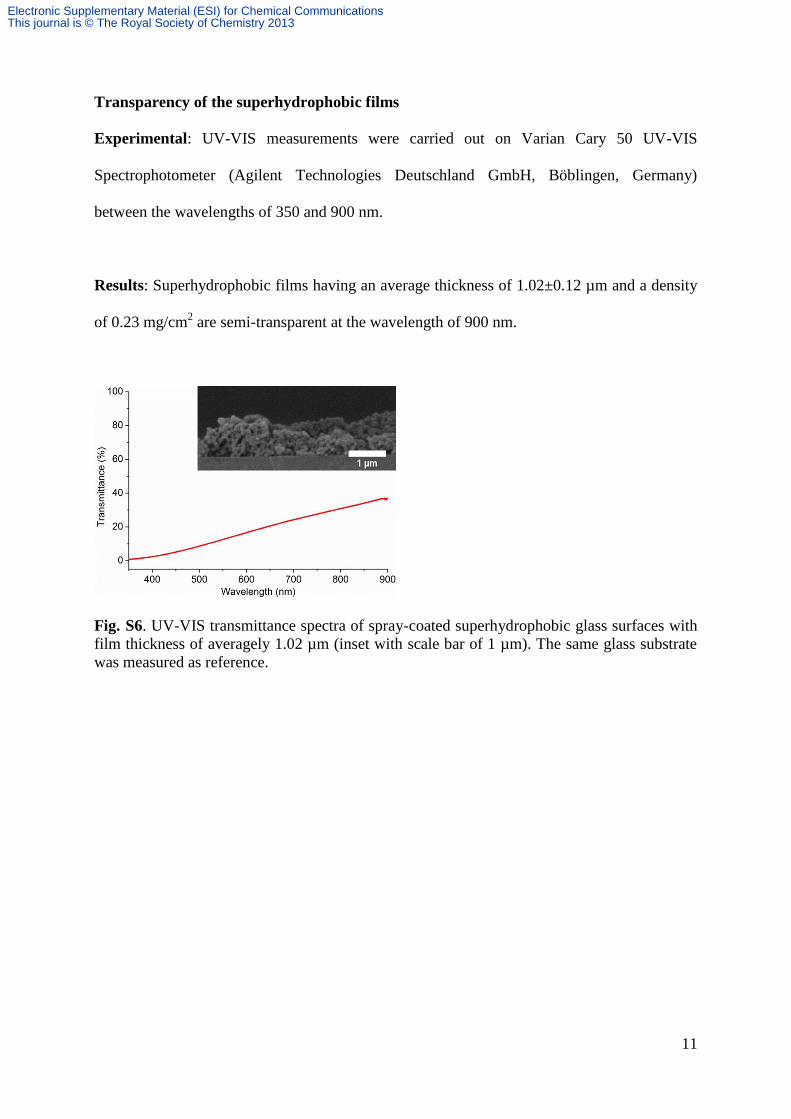
Transparency of the superhydrophobic films
Experimental: UV-VIS measurements were carried out on Varian Cary 50 UV-VIS
Spectrophotometer (Agilent Technologies Deutschland GmbH, Böblingen, Germany)
between the wavelengths of 350 and 900 nm.
Results: Superhydrophobic films having an average thickness of 1.02±0.12 µm and a density
of 0.23 mg/cm2 are semi-transparent at the wavelength of 900 nm.
Fig. S6. UV-VIS transmittance spectra of spray-coated superhydrophobic glass surfaces with
film thickness of averagely 1.02 µm (inset with scale bar of 1 µm). The same glass substrate
was measured as reference.
Electronic Supplementary Material (ESI) for Chemical CommunicationsThis journal is © The Royal Society of Chemistry 2013
12
Acknowledgement
We thank Prof. Jörg Schneider from Technische Universität Darmstadt for the access to
Nanosizer S.
References:
25 N. Joly, P. Martin, L. Lienard, D. Rutot, F. Stassin, R. Granet, P. Krausz and J. P. Cavrot, E-Polymers, 2006, 70, 1-9. 26 P. Jandura, B. V. Kokta and B. Riedl, J. Appl. Polym. Sci., 2000, 78, 1354-1365. 27 L. Crépy, V. Miri, N. Joly, P. Martin and J.-M. Lefebvre, Carbohydr. Polym., 2011, 83, 1812-1820. 28 C. S. R. Freire, A. J. D. Silvestre, C. Pascoal Neto and R. M. A. Rocha, Cellulose, 2005, 12, 449-458. 29 C. M. Buchanan, J. A. Hyatt and D. W. Lowman, Macromolecules, 1987, 20, 2750-2754. 30 M. A. Hussain, T. Liebert and T. Heinze, Macromol. Rapid Commun., 2004, 25, 916-920. 31 J. E. Sealey, G. Samaranayake, J. G. Todd and W. G. Glasser, J. Polymer Sci. B Polymer Phys., 1996, 34, 1613-1620.
Electronic Supplementary Material (ESI) for Chemical CommunicationsThis journal is © The Royal Society of Chemistry 2013