sunset observation project - eric withrowericwithrow.com/~other/phys2021/sunset/sunset observation...
TRANSCRIPT
Sunset Observation Project
Eric Withrow PHYS 2021-A
November 20, 2006 Professor J.R. Sowell
Withrow 2
Purpose:
The objective of this experiment was to observe the motions and position of the
Sun throughout its seasonal motion. During the course of the semester, numerous
observations were taken during sunset in order to determine where the Sun sets on the
horizon as the seasons progressed from summer into fall. By recording this data, it was
not only possible to see the differing positions of sunset, but also the rate of change in the
Sun’s azimuth, change of sunset time, and how the position of the Sun influenced factors
such as weather and temperature.
Background:
The yearly trek of the Sun on the celestial sphere is what causes the temperature
and seasonal changes we are all familiar with. The reason for this varying path of the
Sun involves several factors. The Sun rises in the east and sets in the west due to the
Earth’s rotation about its axis. However, the positions of sunrise and sunset change day
by day because the Earth is tilted 23.5° with respect to the ecliptic, or the orbital plane on
which the Earth sweeps around the sun. Because of the revolution of the Earth around
the Sun, specific terrestrial locations will receive varying amounts of sunlight depending
on the position of Earth in its orbit. In June, the Sun is directly overhead the Tropic of
Cancer. This causes summer in the northern hemisphere because the effective heating is
greater, causing warmer temperatures. The opposite is true in December, when the Earth
has traveled halfway through its yearly orbit. Here the Sun will be directly overhead the
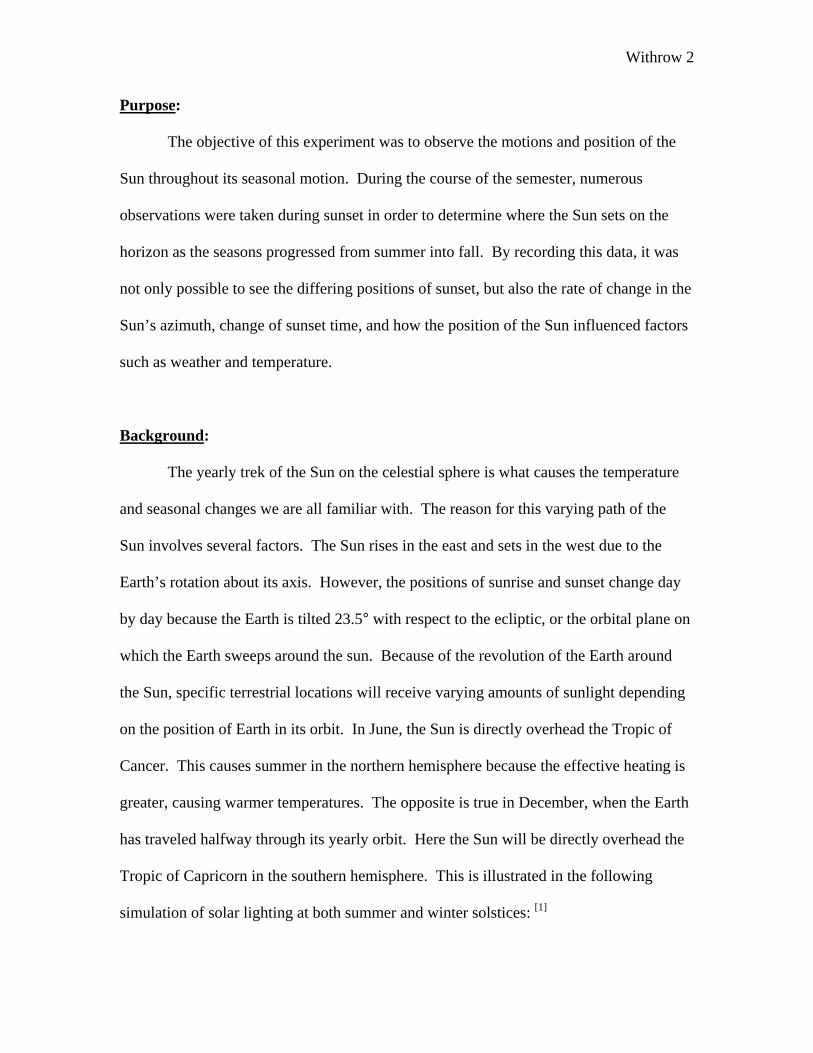
Tropic of Capricorn in the southern hemisphere. This is illustrated in the following
simulation of solar lighting at both summer and winter solstices: [1]
Withrow 3
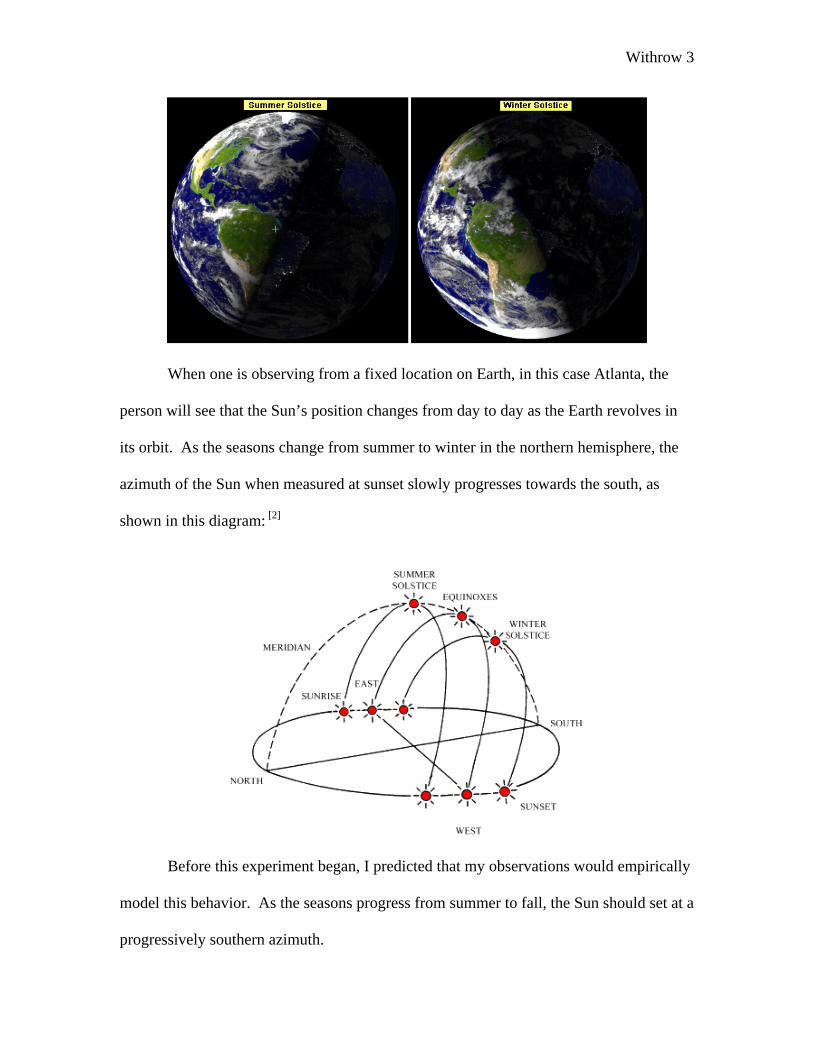
When one is observing from a fixed location on Earth, in this case Atlanta, the
person will see that the Sun’s position changes from day to day as the Earth revolves in
its orbit. As the seasons change from summer to winter in the northern hemisphere, the
azimuth of the Sun when measured at sunset slowly progresses towards the south, as
shown in this diagram: [2]
Before this experiment began, I predicted that my observations would empirically
model this behavior. As the seasons progress from summer to fall, the Sun should set at a
progressively southern azimuth.
Withrow 4
Observation Location:
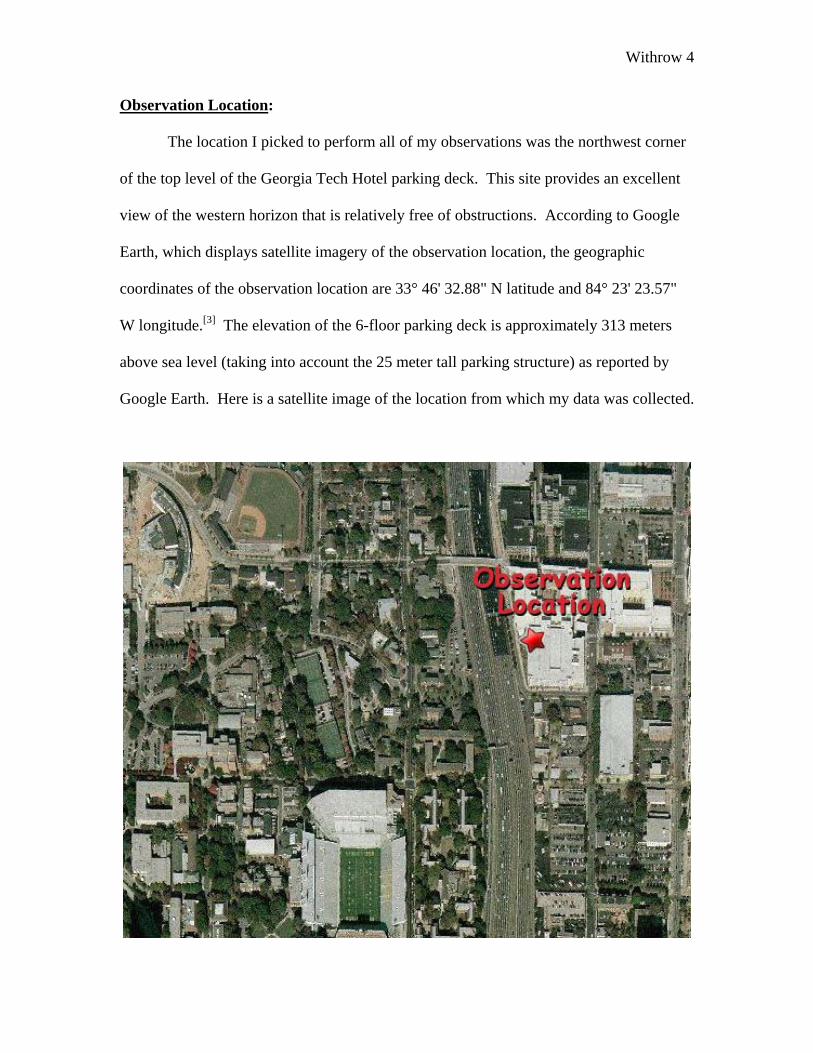
The location I picked to perform all of my observations was the northwest corner
of the top level of the Georgia Tech Hotel parking deck. This site provides an excellent
view of the western horizon that is relatively free of obstructions. According to Google
Earth, which displays satellite imagery of the observation location, the geographic
coordinates of the observation location are 33° 46' 32.88" N latitude and 84° 23' 23.57"
W longitude.[3] The elevation of the 6-floor parking deck is approximately 313 meters
above sea level (taking into account the 25 meter tall parking structure) as reported by
Google Earth. Here is a satellite image of the location from which my data was collected.
Withrow 5
Determining the Sun’s Position:
The instructions for this project suggest using one’s wrist to determine the
position of the Sun with respect to some fixed object. However, my opinion is that this
method would not be accurate enough for real scientific measurements as wrist size
differs from person to person. Also, it is nearly impossible to hold the wrist in the same
position as the previous observations. For these reasons I decided to take a different, and
hopefully more accurate, approach. By knowing about a specific camera’s optics, it is
possible to calculate the field of view seen through an image produced by that camera.
The equation for determining total field of view is given by:
Where d is sensor size and f is the focal length of the lens.[4] According to the
specification of the camera used for observation, a Canon A80, the CCD sensor’s
horizontal length is 7.2 mm and has a focal length of 7.8 mm when set fully toward the
wide angle.[5] This produces images which have a 49.55° field of view. Since the camera
produces photos that are 2272 pixels wide, it is easy to calculate that each degree
corresponds to 45.85 pixels in the image file. It is a simple operation to measure the
number of pixels the Sun has changed relative to a fixed point and calculate the
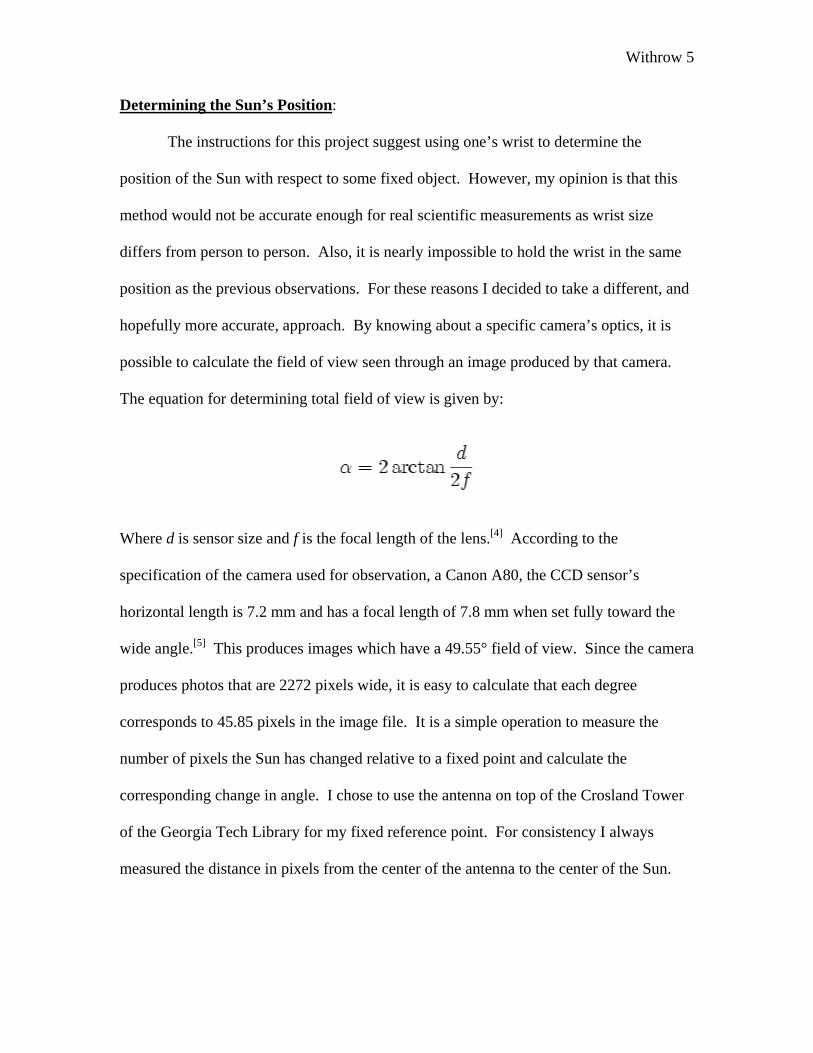
corresponding change in angle. I chose to use the antenna on top of the Crosland Tower
of the Georgia Tech Library for my fixed reference point. For consistency I always
measured the distance in pixels from the center of the antenna to the center of the Sun.
Withrow 6
Observational Data:
For each observation I recorded the following data:
• The date and time. All time values recorded are Eastern Standard Time
(GMT -0500). This allows for the negation of the Daylight Saving Time change
which occurred on October 29, 2006.
• The visibility due to weather (partly cloudy, clear, etc…).
• The temperature and official sunset time, which was found using weather.com
immediately after the observation.[6]
• Pictures used to determine the Sun’s position relative to the fixed reference point.
The position was calculated using the pixel distance from the Crosland Tower
antenna to the center of the Sun.
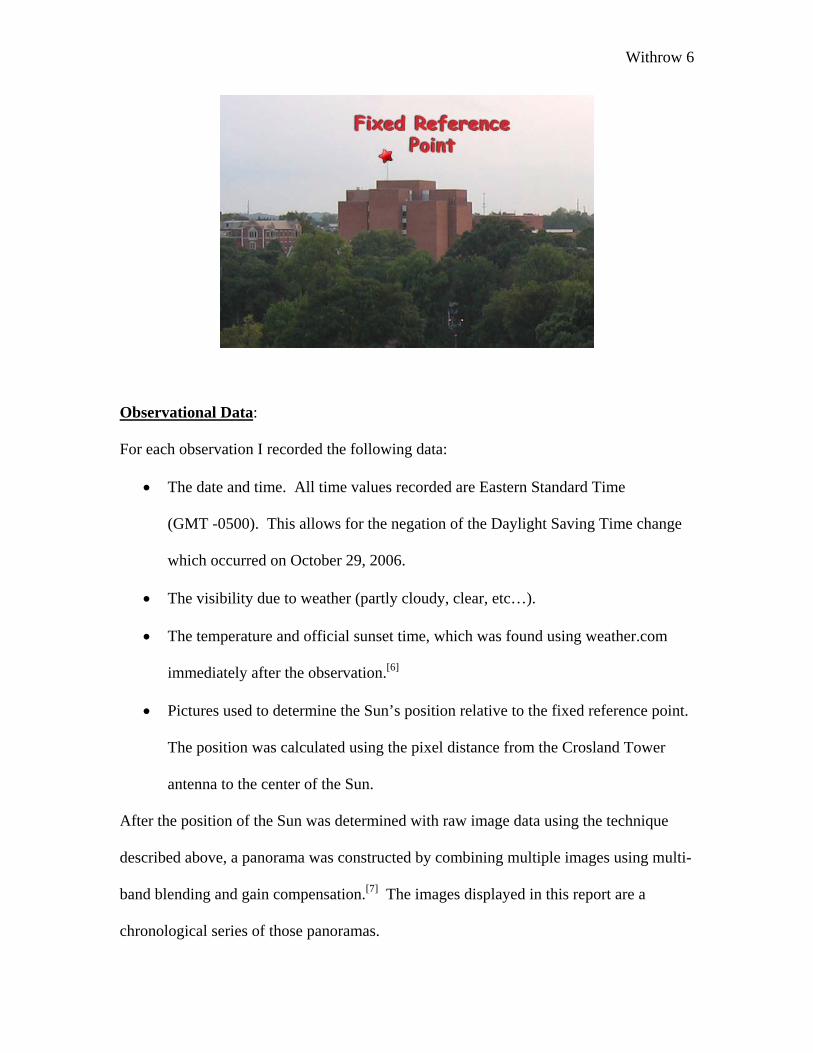
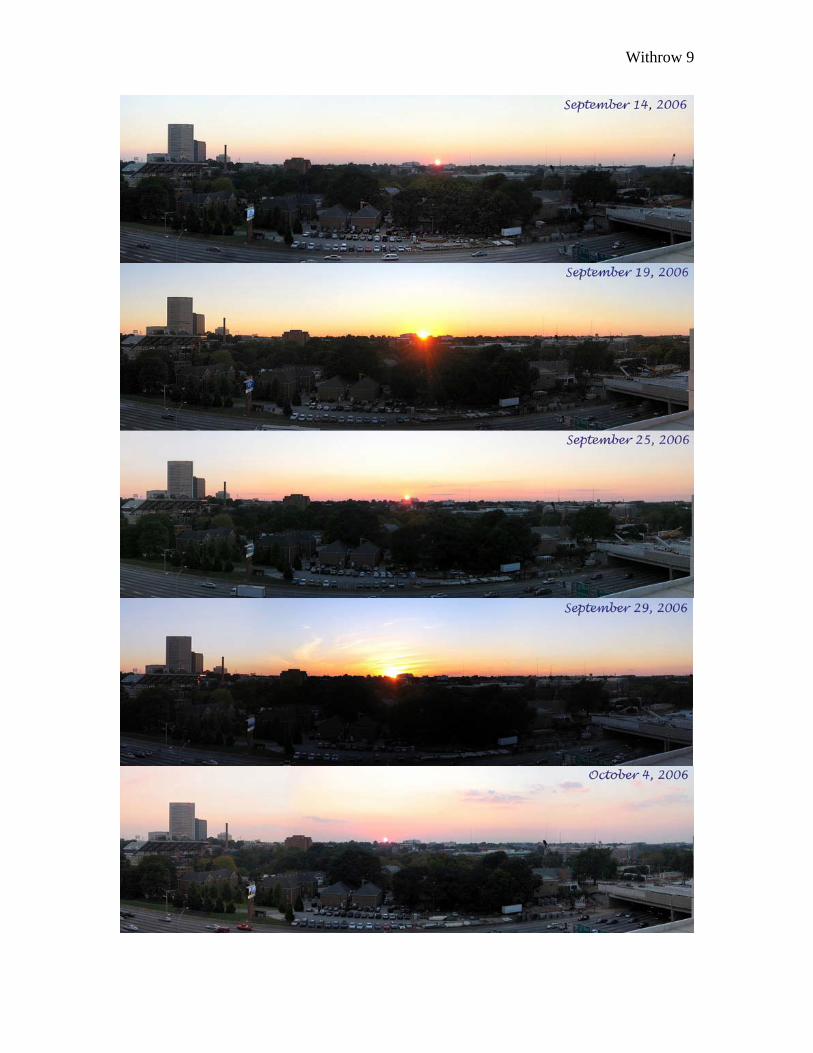
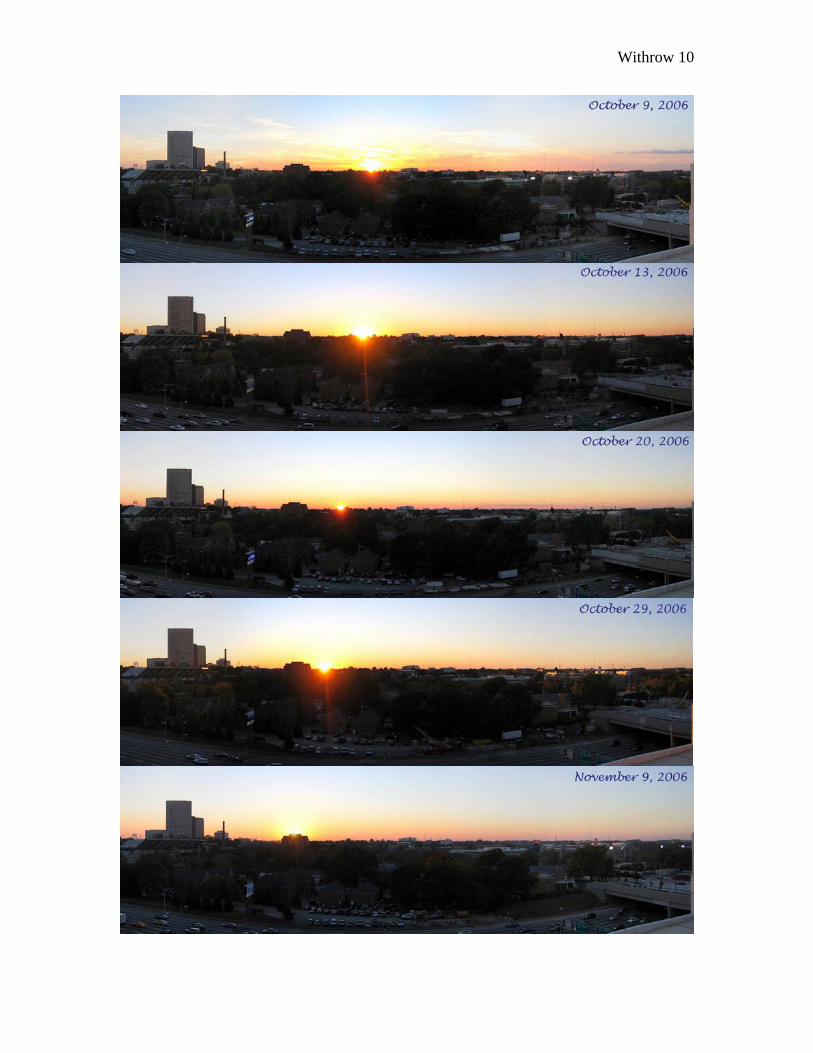
After the position of the Sun was determined with raw image data using the technique
described above, a panorama was constructed by combining multiple images using multi-
band blending and gain compensation.[7] The images displayed in this report are a
chronological series of those panoramas.
Withrow 7
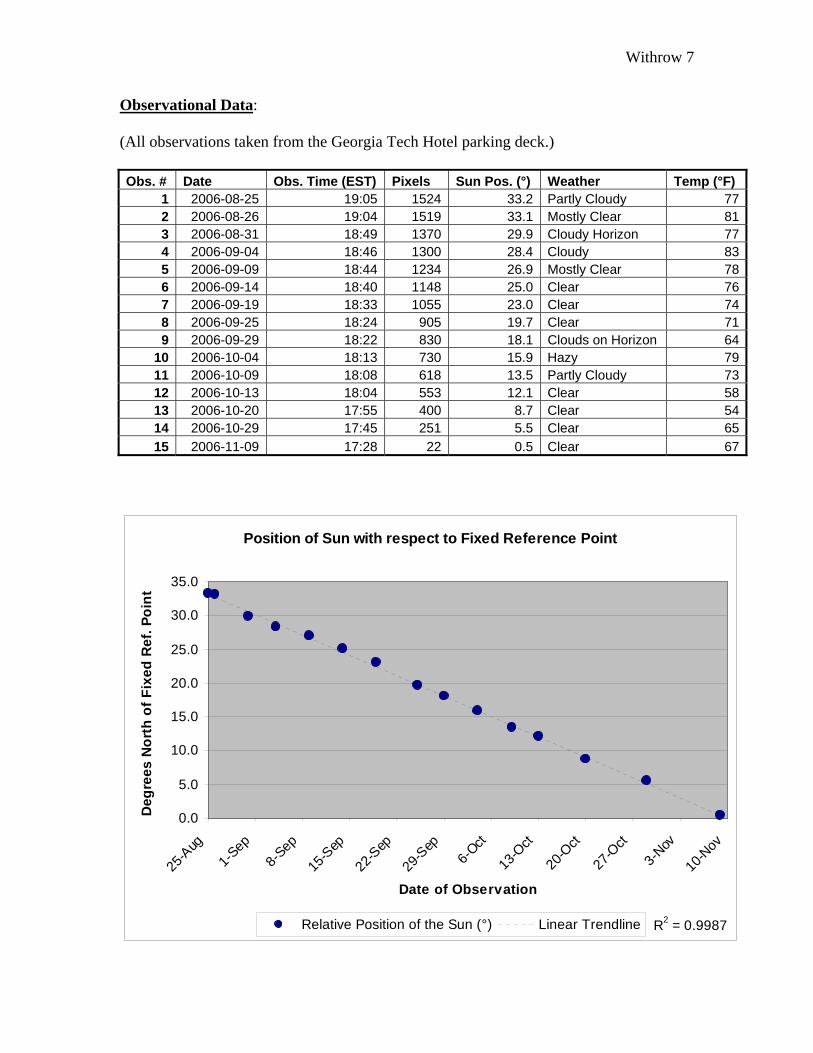
Observational Data: (All observations taken from the Georgia Tech Hotel parking deck.) Obs. # Date Obs. Time (EST) Pixels Sun Pos. (°) Weather Temp (°F)
1 2006-08-25 19:05 1524 33.2 Partly Cloudy 772 2006-08-26 19:04 1519 33.1 Mostly Clear 813 2006-08-31 18:49 1370 29.9 Cloudy Horizon 774 2006-09-04 18:46 1300 28.4 Cloudy 835 2006-09-09 18:44 1234 26.9 Mostly Clear 786 2006-09-14 18:40 1148 25.0 Clear 767 2006-09-19 18:33 1055 23.0 Clear 748 2006-09-25 18:24 905 19.7 Clear 719 2006-09-29 18:22 830 18.1 Clouds on Horizon 64
10 2006-10-04 18:13 730 15.9 Hazy 7911 2006-10-09 18:08 618 13.5 Partly Cloudy 7312 2006-10-13 18:04 553 12.1 Clear 5813 2006-10-20 17:55 400 8.7 Clear 5414 2006-10-29 17:45 251 5.5 Clear 6515 2006-11-09 17:28 22 0.5 Clear 67
Position of Sun with respect to Fixed Reference Point
R2 = 0.9987
0.0
5.0
10.0
15.0
20.0
25.0
30.0
35.0
25-A
ug1-S
ep8-S
ep
15-S
ep
22-S
ep
29-S
ep6-O
ct
13-O
ct
20-O
ct
27-O
ct3-N
ov
10-N
ov
Date of Observation
Deg
rees
Nor
th o
f Fix
ed R
ef. P
oint
Relative Position of the Sun (°) Linear Trendline
Withrow 8
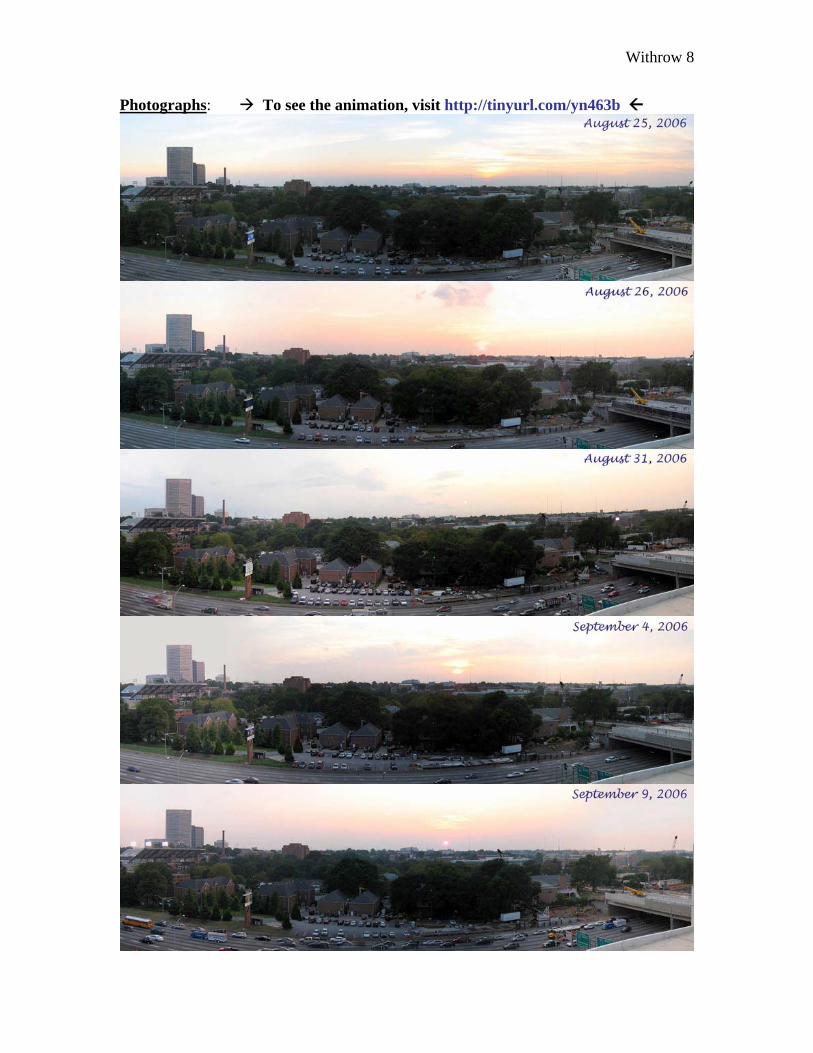
Photographs: To see the animation, visit http://tinyurl.com/yn463b
Withrow 9
Withrow 10
Withrow 11
Conclusions: 1. Which way was the Sun moving along the horizon? Was its motion uniform or did the rate of motion change with time? Explain. My data ended up supporting my hypothesis that the Sun would progressively set
further to the south as the semester progressed. Between my first and last observations
the Sun moved a total of 32.7° south, which is an average of 2.35° per day. My method
of using the camera optics to measure the change in position turned out to be amazingly
accurate. According to an online Sun position calculator, the observed total motion from
first observation to last observation was only off by 1.5° compared to accepted values.[8]
Using Excel to plot a linear curve fit, an R2 value of 0.9987 was obtained. This
seems to indicate the rate of change in azimuth is linear. However, I do not believe this
would be correct if observations were taken through the course of a whole year. Since
the Earth moves around the Sun in a near circular orbit, the position of the Sun should
change cyclically and have a sinusoidal shape when plotting position with respect to time.
The lack of a sinusoidal graph can be easily explained because observations were only
taken over a three month period centered around the autumnal equinox, where the sine
curve is most linear.
Several derivations from linearity from one observation to another in the graph
can be explained because some observations were taken as much as 15 minutes before the
official sunset time, due to cloud cover on the horizon. Clouds definitely were a
complication in the early phases of this project. Because of their limited height, at a large
distance some clouds and haze were inevitably blocking the Sun at the horizon unless it
was an exceptionally clear day. These effects can be seen in both the sunset time and Sun
position graphs around early September.
Withrow 12
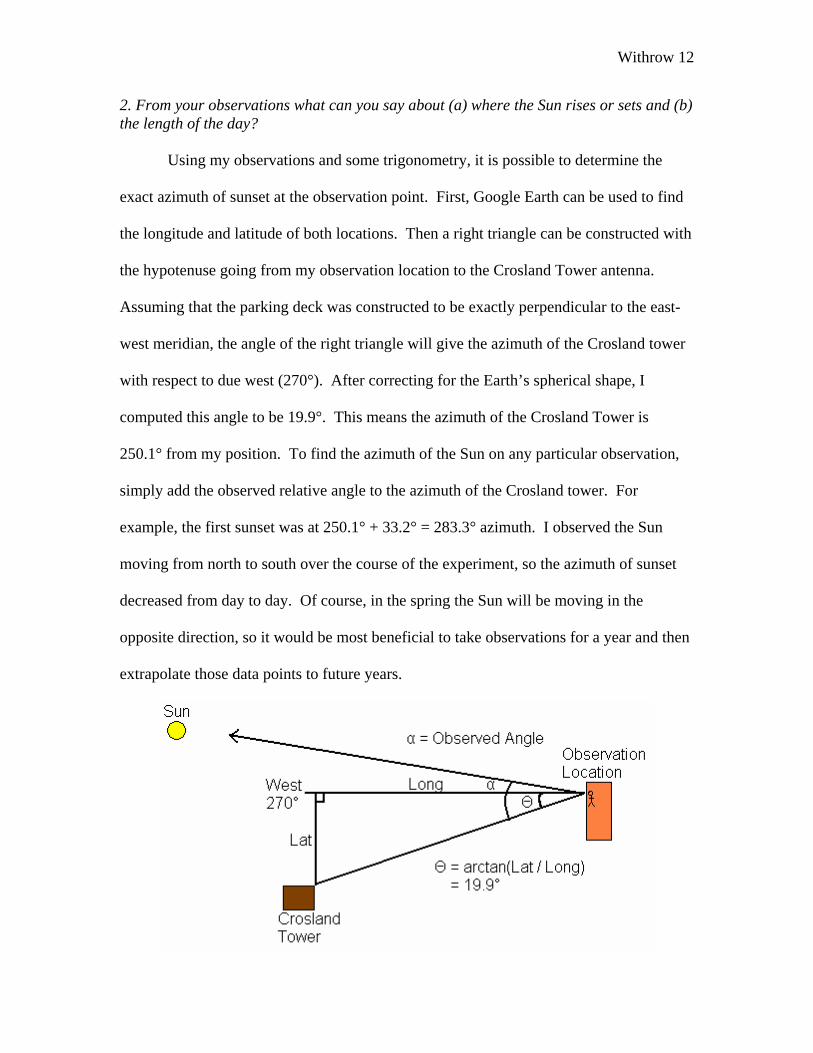
2. From your observations what can you say about (a) where the Sun rises or sets and (b) the length of the day? Using my observations and some trigonometry, it is possible to determine the
exact azimuth of sunset at the observation point. First, Google Earth can be used to find
the longitude and latitude of both locations. Then a right triangle can be constructed with
the hypotenuse going from my observation location to the Crosland Tower antenna.
Assuming that the parking deck was constructed to be exactly perpendicular to the east-
west meridian, the angle of the right triangle will give the azimuth of the Crosland tower
with respect to due west (270°). After correcting for the Earth’s spherical shape, I
computed this angle to be 19.9°. This means the azimuth of the Crosland Tower is
250.1° from my position. To find the azimuth of the Sun on any particular observation,
simply add the observed relative angle to the azimuth of the Crosland tower. For
example, the first sunset was at 250.1° + 33.2° = 283.3° azimuth. I observed the Sun
moving from north to south over the course of the experiment, so the azimuth of sunset
decreased from day to day. Of course, in the spring the Sun will be moving in the
opposite direction, so it would be most beneficial to take observations for a year and then
extrapolate those data points to future years.
Withrow 13
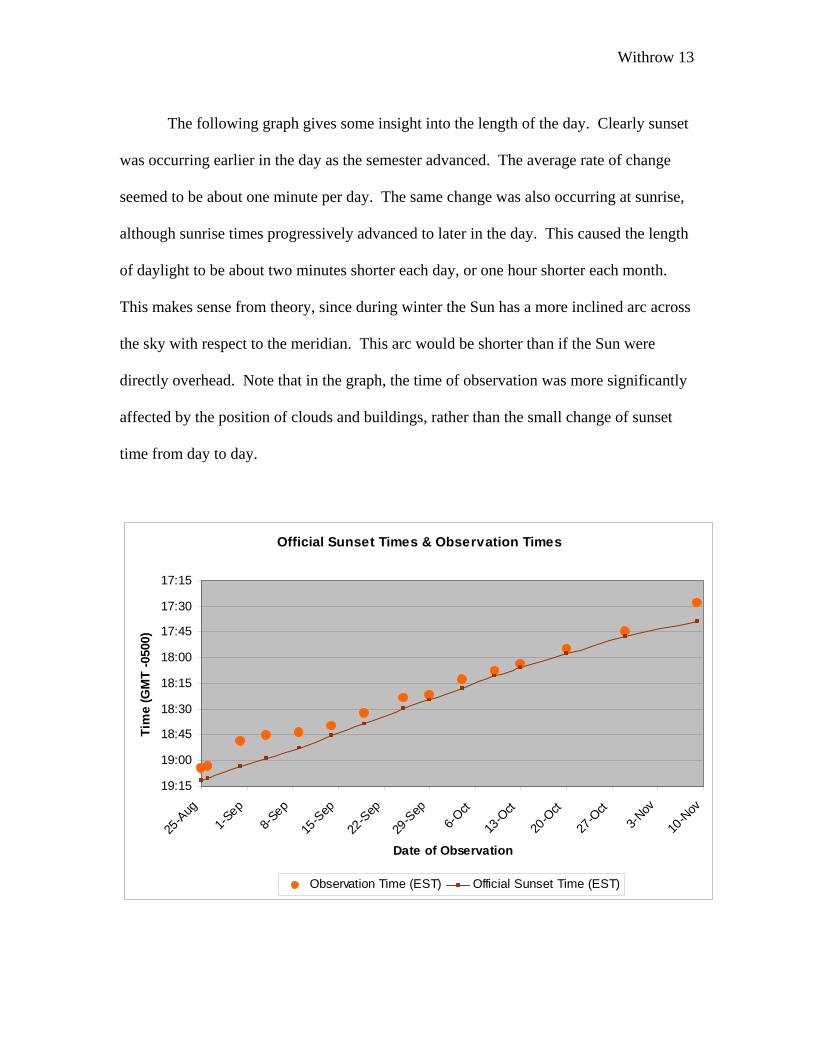
The following graph gives some insight into the length of the day. Clearly sunset
was occurring earlier in the day as the semester advanced. The average rate of change
seemed to be about one minute per day. The same change was also occurring at sunrise,
although sunrise times progressively advanced to later in the day. This caused the length
of daylight to be about two minutes shorter each day, or one hour shorter each month.
This makes sense from theory, since during winter the Sun has a more inclined arc across
the sky with respect to the meridian. This arc would be shorter than if the Sun were
directly overhead. Note that in the graph, the time of observation was more significantly
affected by the position of clouds and buildings, rather than the small change of sunset
time from day to day.
Official Sunset Times & Observation Times
17:15
17:30
17:45
18:00
18:15
18:30
18:45
19:00
19:15
25-A
ug1-S
ep8-S
ep
15-S
ep
22-S
ep
29-S
ep6-O
ct
13-O
ct
20-O
ct
27-O
ct3-N
ov
10-N
ov
Date of Observation
Tim
e (G
MT
-050
0)
Observation Time (EST) Official Sunset Time (EST)

Withrow 14
3. From your observations, what can you infer about the position of the Sun at noon during the semester? Since the Sun was both rising and setting further to the south each day, it can be
inferred that the position of the Sun at noon is progressively further south with respect to
the zenith. This agrees with the increasingly tilted arc the Sun makes in the sky as shown
in the figure on page 3. The temperature data I collected also agrees with this prediction.
Since a progressively southern-positioned Sun at noon would be lower in altitude on
average, temperatures would tend to decrease, which was observed.
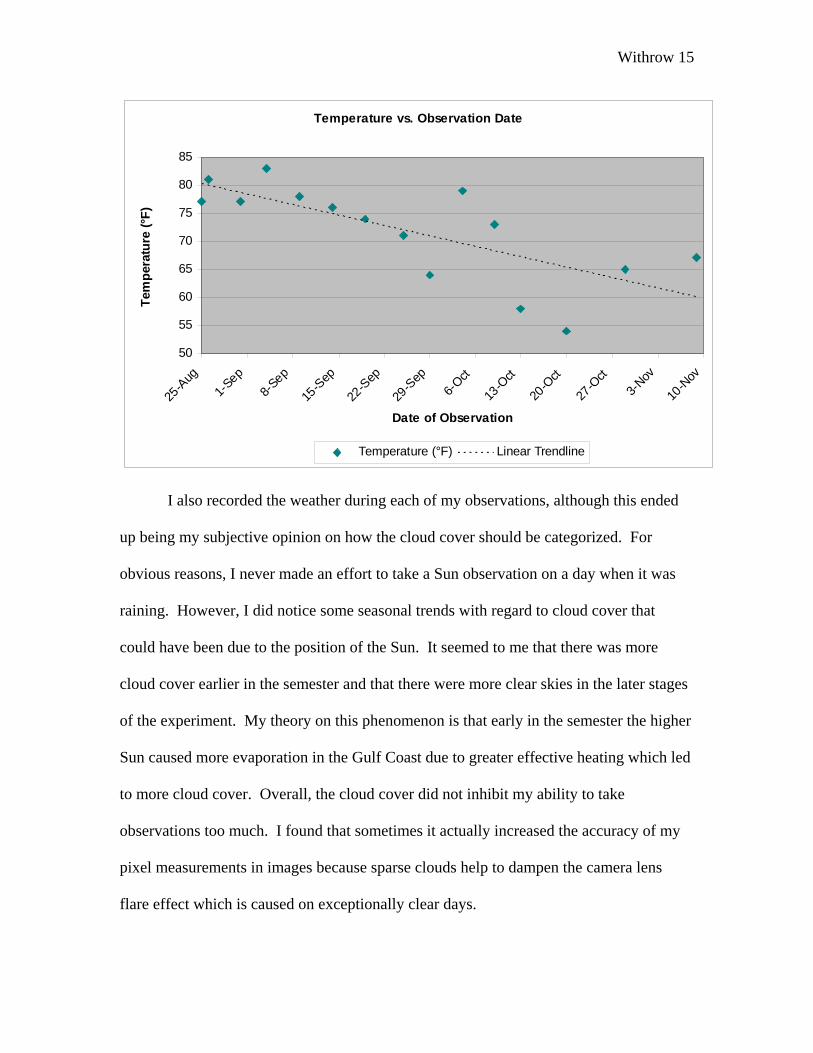
4. How does the altitude of the Sun affect the seasons? Was this effect evident during the semester (e.g., temperature, weather, etc.)? Because the Sun was positioned progressively further south from day to day, this
also meant that the Sun was lower in altitude as the semester progressed. Because the
Sun was increasingly low in the sky, this would cause the effective heating from the
Sun’s radiant energy to decrease and it would become cooler over the course of the
semester. Immediately after each of my observations, I recorded the temperature and
plotted these data points with respect to the date. From the following graph, it is clear
that the temperature does in fact have a decreasing trend. It is worth noting that the
temperature did not always decrease on progressively later observations. This would be
due to the fact that temperature also depends on other weather factors such as cold fronts
and heat waves, which cannot accurately be predicted long in advance.
Withrow 15
Temperature vs. Observation Date
50
55
60
65
70
75
80
85
25-A
ug1-S
ep8-S
ep
15-S
ep
22-S
ep
29-S
ep6-O
ct
13-O
ct
20-O
ct
27-O
ct3-N
ov
10-N
ov
Date of Observation
Tem
pera
ture
(°F)
Temperature (°F) Linear Trendline
I also recorded the weather during each of my observations, although this ended
up being my subjective opinion on how the cloud cover should be categorized. For
obvious reasons, I never made an effort to take a Sun observation on a day when it was
raining. However, I did notice some seasonal trends with regard to cloud cover that
could have been due to the position of the Sun. It seemed to me that there was more
cloud cover earlier in the semester and that there were more clear skies in the later stages
of the experiment. My theory on this phenomenon is that early in the semester the higher
Sun caused more evaporation in the Gulf Coast due to greater effective heating which led
to more cloud cover. Overall, the cloud cover did not inhibit my ability to take
observations too much. I found that sometimes it actually increased the accuracy of my
pixel measurements in images because sparse clouds help to dampen the camera lens
flare effect which is caused on exceptionally clear days.
Withrow 16
5. What surprised or impressed you the most as you performed this observational project? When I started this project, I was not even sure how early I would need to be at
the observation location in order to record my data. This led to some long waiting times
and some rushing to get to the observation location before sunset. Later in the semester, I
could predict to the minute at which time I would need to arrive. I was very surprised at
how far the Sun moved over the course of a semester. I never realized that in three short
months the Sun could cover an area as big as 18% of the western horizon. I was also
surprised at how accurate I became when trying to predict if a particular evening would
be good for a sunset observation. The view from outside my room faces in the opposite
direction of sunset, and even then the view of the sky is mostly blocked by large trees.
However, just by looking at the light reflection gradient off the leaves, I could tell
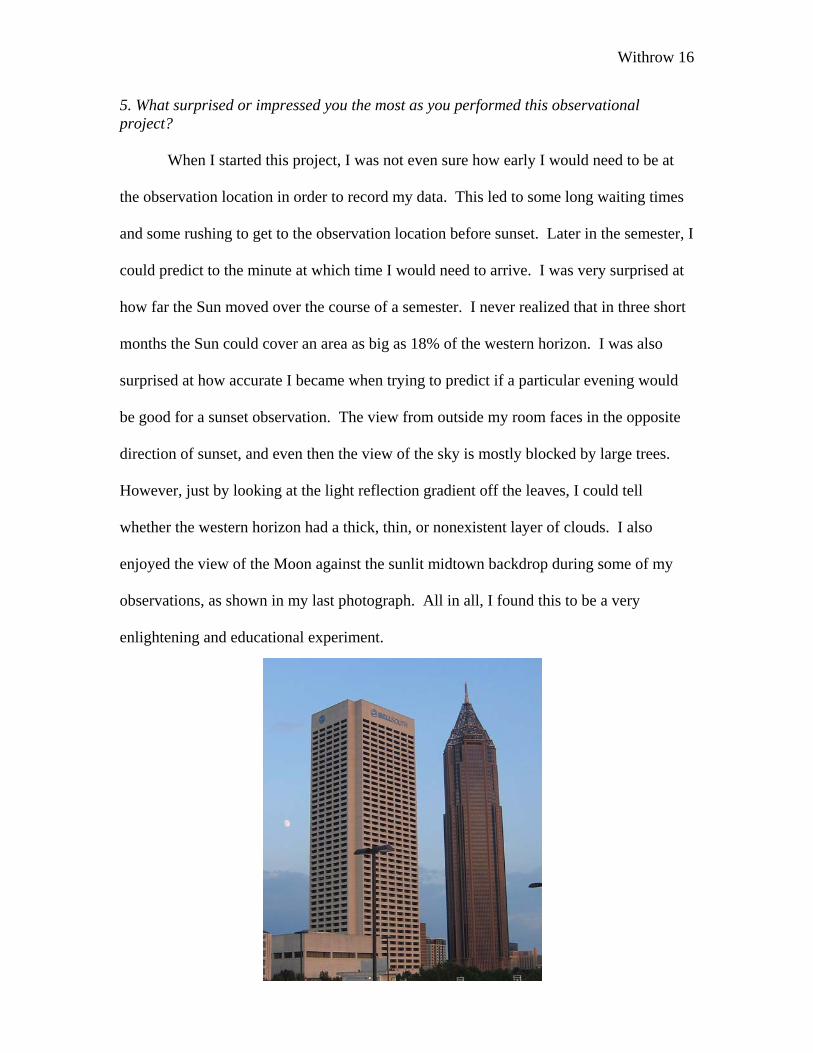
whether the western horizon had a thick, thin, or nonexistent layer of clouds. I also
enjoyed the view of the Moon against the sunlit midtown backdrop during some of my
observations, as shown in my last photograph. All in all, I found this to be a very
enlightening and educational experiment.
Withrow 17
References
1. Tom Ruen, Full Sky Observatory. http://commons.wikimedia.org/wiki/Image:Seasonearth.png 2. Hong Kong Observatory, Paths of the Sun throughout the Year 2006. http://www.weather.gov.hk/gts/astron2006/sunpath_e.htm 3. Google, Sanborn, Europa Technologies. Google Earth. http://earth.google.com/ 4. Wikipedia. Angle of View. http://en.wikipedia.org/wiki/Angle_of_view 5. Photo.net. Canon Powershot A80 Digital Camera Review. http://www.photo.net/equipment/canon/a80/ 6. Weather.com. Local Weather Forecast for Atlanta, GA (30332). http://www.weather.com/weather/local/30332?lswe=30332 7. AutoStitch. A new dimension in automatic image stitching. http://www.cs.ubc.ca/~mbrown/autostitch/autostitch.html 8. NOAA Surface Radiation Research Branch. Solar Position Calculator. http://www.srrb.noaa.gov/highlights/sunrise/azel.html