summer-temperature evolution on the kamchatka peninsula
TRANSCRIPT
1
Summer-temperature evolution on the Kamchatka Peninsula, Russian Far
East, during the past 20,000 years
Vera D. Meyer1,2, Jens Hefter1, Gerrit Lohmann1, Ralf Tiedemann1 and Gesine Mollenhauer1,2,3 1 Alfred Wegener Institute Helmholtz Centre for Polar and Marine Research, Bremerhaven, 27570, Germany 2 Department of Geosciences University of Bremen, Bremen, 28359, Germany 5 3 MARUM- Centre for Environmental Sciences, University of Bremen, Bremen, 28359, Germany Correspondence to: V. D. Meyer ([email protected])
Abstract. Little is known about the climate evolution on the Kamchatka Peninsula during the last deglaciation as existing 10
climate records do not reach beyond 12 ka BP. In this study, a summer-temperature record for the past 20 ka is presented.
Branched Glycerol Dialkyl Glycerol Tetraethers, terrigenous biomarkers suitable for continental air temperature
reconstructions, were analyzed in a sediment core from the western continental margin off Kamchatka/marginal Northwest
Pacific (NW Pacific). The record reveals that summer temperatures on Kamchatka during the Last Glacial Maximum (LGM)
equaled modern. We suggest that strong southerly winds associated with a pronounced North Pacific High pressure system 15
over the subarctic NW Pacific accounted for the warm conditions. A comparison with outputs from an Earth System Model
reveals discrepancies between model and proxy-based reconstructions for the LGM-temperature and atmospheric circulation
in the NW Pacific realm. The deglacial temperature development is characterized by abrupt millennial-scale temperature
oscillations. The Bølling/Allerød warm-phase and the Younger Dryas cold-spell are pronounced events, providing evidence
for a strong impact of North-Atlantic climate variability on temperature development in southeastern Siberia. Summer 20
insolation and teleconnections with the North Atlantic determine the long-term temperature development during the Holocene.
Key words: CBT/MBT, summer temperature, Northwest Pacific, deglaciation, atmospheric circulation
1. Introduction 25
The Kamchatka Peninsula is attached to Siberia and protrudes into the North Pacific Ocean separating the Sea of Okhotsk
from the Northwest Pacific (NW Pacific) and the Bering Sea (Fig. 1a). The Peninsula is a remote part of western Beringia.
“Beringia” extends from the Lena River in Northeast Russia to the lower Mackenzie River in Canada (Fig. 1a, Hopkins et al.,
Clim. Past Discuss., doi:10.5194/cp-2016-21, 2016Manuscript under review for journal Clim. PastPublished: 6 April 2016c© Author(s) 2016. CC-BY 3.0 License.
2
1982). During Pleistocene sea-level low-stands the Bering Land Bridge (BLB) linked Eastern and Western Beringia as the
Chukchi and Bering Shelves became exposed (Fig. 1a). Kamchatka is one of the least studied areas of Beringia since the 30
available terrestrial climate archives, such as peat sections or lake sediments, do not reach beyond 12 ka BP (e.g. Dirksen et
al., 2013, 2015; Nazarova et al., 2013a; Hoff et al. 2015; Klimaschewski et al., 2015; Self et al., 2015; Solovieva et al., 2015)
and the climatic conditions during the LGM and the deglaciation are poorly understood. However, the climatic history of
Kamchatka may provide important insights into the deglacial development of regional atmospheric and oceanic circulation,
since the Holocene climate evolution largely responds to those regional forcing mechanisms (Nazarova et al., 2013a; Brooks 35
et al., 2015; Hammarlund et al., 2015; Self et al., 2015) next to global or supra-regional climate drivers, e.g. summer insolation
(Savoskul, 1999; Dirksen et al., 2013; Brooks et al., 2015; Self et al., 2015). Particularly, information about atmospheric and
oceanic circulation in the Northwest Pacific (NW Pacific) realm is important to confirm outputs from climate models.
The investigation of deglacial climate change on Kamchatka may also contribute to the understanding of the spatial dimension
of atmospheric teleconnections with abrupt climate change in the North Atlantic (N-Atlantic). The majority of sea surface 40
temperature records from the subarctic NW Pacific and the marginal seas mirror the N-Atlantic climate oscillations (e.g.
Caissie et al., 2010; Max et al., 2012; Meyer et al., submitted) suggesting that atmospheric teleconnections with the North
Atlantic controlled deglacial temperature development in the N-Pacific realm (Max et al., 2012; Meyer et al., submitted).
However, climate records from Siberia and Alaska provide an ambiguous picture concerning the sensitivity of Beringia to
climate oscillations in the N Atlantic. Some studies in Siberia and interior Alaska found patterns similar to the N-Atlantic 45
climate variability, including a Bølling/Allerød (B/A)-equivalent warm-phase and a subsequent climatic reversal during the
Younger Dryas (YD; Anderson et al., 1990; Andreev et al., 1997; Pisaric et al., 2001; Bigelow and Edwards, 2001; Brubaker
et al., 2001; Anderson et al., 2002; Meyer et al., 2010; Anderson and Lozhkin, 2015), while other Alaskan and east Siberian
records show progressive warming during the postglacial climate amelioration, without a YD-cold spell (Lozhkin et al., 1993,
2001; Anderson et al., 1996, 2002; Lozhkin and Anderson, 1996; Nowaczyk et al., 2002; Anderson et al., 2003; Nolan et al., 50
2003; Kokorowski et al., 2008a,b; Kurek et al., 2009). As pointed out by Kokorowski et al. (2008a,b) this may attest to regional
differences or to uncertainties in chronologies. Therefore, further deglacial climate records with high resolution are necessary.
Clim. Past Discuss., doi:10.5194/cp-2016-21, 2016Manuscript under review for journal Clim. PastPublished: 6 April 2016c© Author(s) 2016. CC-BY 3.0 License.
3
This particularly applies for easternmost Siberia, since most deglacial records are obtained from sites west of 150°N and north
of 65°N (Kokorowski et al., 2008a).
In this study, we analyzed branched glycerol dialkyl glycerol tetraethers (brGDGTs), terrigenous biomarkers as recorders of 55
continental temperature (Weijers et al., 2006a, 2007), in a marine sediment core retrieved at the eastern continental margin off
Kamchatka/NW Pacific (site SO201-2-12KL, NW Pacific, Fig. 1a, b). We present a continuous, quantitative record of summer-
temperature on Kamchatka for the past 20 ka. The impact of global climate drivers, N-Atlantic climate change, and regional
atmospheric/oceanic circulation is investigated. The record reveals new aspects of LGM atmospheric circulation in the NW
Pacific-realm, which are compared to an Earth System Model (ESM), and provides new insights into the interplay of global 60
and regional climate drivers in the south-eastern edge of western Beringia since the LGM.
2. Regional Setting
The Kamchatka Peninsula is situated south of the Koryak Uplands in Siberia. It is characterized by strong variations in relief
with lowlands in the coastal areas (Western Lowlands; Eastern Coast) and mountain ranges further inland (Fig. 1b). The
mountain ranges, the Sredinny and the Eastern Ranges, encircle the lowlands of the Central Kamchatka Depression (CKD; 65
Fig. 1b). The CKD is the largest watershed of the Peninsula and is drained by the Kamchatka River, the largest river of
Kamchatka. The river discharges into the Bering Sea near 56°N (Fig. 1b). The climate is determined by marine influences
from the surrounding seas, by the East Asian continent, and by the interplay of the major atmospheric pressure systems over
NE-Asia and the North Pacific (e.g. Mock et al., 1998; Glebova et al., 2009). In general the climate is classified as sub-arctic
maritime (Dirksen et al., 2013). The winters are characterized by cold and relatively continental conditions since northerly 70
winds prevail over Kamchatka which are mainly associated with the Aleutian Low over the N Pacific and the Siberian High
over the continent (Mock et al., 1998). In summer, Kamchatka experiences warm maritime conditions owing to the East Asian
Low over the continent and the North Pacific High (NPH) over the N-Pacific (Mock et al., 1998). Furthermore, there are the
influences of the East Asian Trough (EAT) which has its average position over the northern shelves of central Beringia, as
well as the influences of the westerly Jet and the associated polar front (Mock et al., 1998). Variations in the position and 75
strength of the EAT affect precipitation and temperature over Beringia and can cause climatic contrasts between Siberia and
Clim. Past Discuss., doi:10.5194/cp-2016-21, 2016Manuscript under review for journal Clim. PastPublished: 6 April 2016c© Author(s) 2016. CC-BY 3.0 License.
4
Alaska (Mock et al., 1998 and references therein). With respect to Kamchatka westerly to northwesterly winds associated with
the Jetstream and the EAT form a source of continental air masses from Siberia/East Asia (Mock et al., 1998).
The mountainous terrain with strongly variable relief results in pronounced climatic diversity on the Peninsula (Fig. 1b). The
coastal areas, the western Lowlands and the Eastern Coast, are dominated by marine influences. In the coastal areas, summers 80
are cool and wet and winters are relatively mild. Precipitation is high along the coast and in the mountains throughout the year
(Kondratyuk, 1974; Dirksen et al., 2013). Being protected from marine influences by the mountain ranges the CKD has more
continental conditions with less precipitation and a larger annual temperature range than in the coastal areas (Ivanov, 2002;
Dirksen et al., 2013, Kondratyuk, 1974; Jones and Solomina, 2015). Averaged for the entire Peninsula mean temperatures
range from -8 to -26°C in January and from 10 to 15°C in July (Ivanov, 2002). 85
3. Material and Methods
3.1. Core material and chronology
Within a joint German/Russian research program (KALMAR Leg 2) core SO201-2-12KL (Fig. 1a, b) was recovered with a
piston-corer device during cruise R/V SONNE SO201 in 2009 (Dullo et al., 2009). The core material was stored at 4°C prior
to sample preparation. Age control is based on accelerator mass spectrometry (AMS) radiocarbon dating of planktic 90
foraminifera (Neogloboquadrina pachyderma sin.) as well as on core-to-core correlations of high-resolution
spectrophotometric (color b*) and X-ray fluorescence (XRF) data. For detailed information and AMS-14C results, see Max et
al. (2012).
3.2. Lipid extraction
For GDGT analyses, freeze-dried and homogenized sediment samples (approx. 5 g) were extracted with dichloromethane : 95
methanol (DCM:MeOH, 9:1 v/v) using accelerated solvent extraction (ASE). Prior to extraction, 10 µg of a C46-GDGT internal
standard was added to each sample. The extraction was conducted on a “Dionex ASE 200”-device and was performed in three
cycles, each of them lasting for five minutes. During the extraction cycles the temperature was maintained at 100°C and the
Clim. Past Discuss., doi:10.5194/cp-2016-21, 2016Manuscript under review for journal Clim. PastPublished: 6 April 2016c© Author(s) 2016. CC-BY 3.0 License.
5
pressure at 1000 psi. After drying with a rotary-evaporator, extracts were hydrolyzed with 0.1N potassium hydroxide (KOH)
in MeOH:H2O 9:1 (v/v) to separate carbonic acids from neutral compound classes. After the hydrolyzation, neutral compounds 100
such as hydrocarbons, ketones, alcohols and GDGTs were extracted with n-hexane, from the saponified solution. Dissolved in
n-hexane the neutral compound-classes were separated using silica gel columns. Columns were built with Pasteur pipettes
(6 mm diameter) which were filled with deactivated SiO2 (mesh size 60, filling height 4 cm). After having eluted a less polar
fraction with n-hexane, a polar fraction, containing the GDGTs, was eluted with DCM:MeOH (1:1 v/v). Dried polar fractions
were dissolved in n-hexane:isopropanol (99:1, v/v) and were filtered through PTFE syringe filters (4 mm diameter, 0.45 µm 105
pore size). Afterwards, samples were brought to a concentration of 2 µg/µl in order to prepare them for GDGT analysis.
3.3. GDGT analysis
GDGTs were analyzed by High Performance Liquid Chromatography (HPLC) and a single quadrupole mass spectrometer
(MS). The systems were coupled via an atmospheric pressure chemical ionization (APCI) interface. The applied method was
slightly modified from Hopmans et al. (2000). Analyses were performed on an Agilent 1200 series HPLC system and an 110
Agilent 6120 MSD. Separation of the individual GDGTs was performed on a Prevail Cyano column (Grace, 3 µm, 150 mm x
2.1 mm) which was maintained at 30°C. After sample injection (20 µL) and 5 min isocratic elution with solvent A (hexane)
and B (hexane with 5% isopropanol) at a mixing ratio of 80:20, the proportion of B was increased linearly to 36% within 40
min. The eluent flow was 0.2 ml/min. After each sample, the column was cleaned by back-flushing with 100% solvent B (8
min) and re-equilibrated with solvent A (12 min, flow 0.4 ml/min). GDGTs were detected using positive-ion APCI-MS and 115
selective ion monitoring (SIM) of their (M+H)+ ions (Schouten et al., 2007). APCI spray-chamber conditions were set as
follows: nebulizer pressure 50 psi, vaporizer temperature 350 °C, N2 drying gas flow 5 l/min and 350 °C, capillary voltage
(ion transfer tube) -4 kV and corona current +5 µA. The MS-detector was set in SIM-mode detecting the following (M+H)+
ions with a dwell time of 67 ms per ion: m/z 1292.3 (GDGT 4 + 4´ / crenarcheol + regio-isomer), 1050 (GDGT IIIa), 1048
(GDGT IIIb), 1046 (GDGT IIIc), 1036 (GDGT IIa), 1034 (GDGT IIb), 1032 (GDGT IIc), 1022 (GDGT Ia), 1020 (GDGT Ib), 120
1018 (GDGT Ic) and 744 (C46-internal standard).
Clim. Past Discuss., doi:10.5194/cp-2016-21, 2016Manuscript under review for journal Clim. PastPublished: 6 April 2016c© Author(s) 2016. CC-BY 3.0 License.
6
GDGTs were quantified by peak-integration and the obtained response factor from the C46 -standard. Concentrations were
normalized to the dry weight (dw) of the extracted sediment and to total organic carbon contents (TOC). It has to be noted that
the quantification should only be regarded as semi-quantitative because individual relative response factors between the C46-
standard and the different GDGTs could not be determined due to the lack of appropriate standards. Fractional abundances of 125
single GDGTs were calculated relative to the total abundance of the all nine brGDGTs. The standard deviation was determined
from repeated measurements of a standard sediment and resulted in an uncertainty of 9 % for the concentration of the sum of
all nine brGDGT (ƩbrGDGT).
3.4. Temperature determination
The Cyclysation of Branched Tetraether index (CBT) and Methylation of Branched Tetraether index (MBT) were introduced 130
as proxies for soil-pH (CBT) and mean annual air temperature (MAT, CBT/MBT) by Weijers et al. (2007). The CBT-index
was calculated after Weijers et al. (2007). For calculating the MBT-index we used a modified version of the original index,
the MBT’ which excludes GDGTs IIIb and IIIc, and was introduced by Peterse et al. (2012). From repeated measurements the
standard deviation for CBT and MBT’ were determined as 0.01 and 0.04, respectively. CBT and MBT’-values were converted
into temperature using the global-soil dataset calibration by Peterse et al. (2012). The residual standard mean error of this 135
calibration is 5°C (Peterse et al., 2012). The standard deviation of CBT and MBT’ translates into an uncertainty of max. 0.1°C.
Although terrestrial soils are supposed to be the main source of branched GDGTs (Weijers et al., 2007) brGDGT can also be
produced in-situ in marine water systems (Peterse et al., 2009; Zhu et al., 2011; Zell et al., 2014) as well as in fresh water
environments such as rivers or lakes (Tierney 2010; Zell et al., 2013; De Jonge et al., 2014; Dong et al., 2015). As in-situ
production can bias temperature reconstructions, particularly in marine settings where the input of terrigenous GDGTs is low 140
(Weijers et al., 2006b; Peterse et al., 2009, 2014; DeJonge et al., 2014), the contribution of brGDGTs to the marine sediments
needs to be estimated prior to any paleoclimatic interpretation of CBT/MBT’-derived temperatures. A common means to
estimate the relative input of marine and terrestrial GDGTs is the BIT-index (Branched and isoprenoid tetraether index) which
quantifies the relative contribution of the marine-derived Crenarchaeol and terrigenous brGDGTs (Hopmans et al., 2004). BIT-
values were adopted from Meyer et al. (submitted) who worked on the same sample used in this present study. 145
Clim. Past Discuss., doi:10.5194/cp-2016-21, 2016Manuscript under review for journal Clim. PastPublished: 6 April 2016c© Author(s) 2016. CC-BY 3.0 License.
7
3.5. Climate simulations with the Earth System Model COSMOS
In order to compare inferences for atmospheric circulation during the summer months to computer model outputs, model
simulations for the glacial climate were performed with the Earth System model COSMOS for pre-industrial (Wei et al.,
2012) and glacial conditions (Zhang et al., 2013). The model configuration includes the atmosphere component ECHAM5 at
T31 resolution (~3.75°) with 19 vertical layers (Roeckner et al., 2006), complemented by a land-surface scheme including 150
dynamical vegetation (Brovkin et al., 2009). The ocean component MPI-OM, including the dynamics of sea ice formulated
using viscous-plastic rheology, has an average horizontal resolution of 3ºx1.8° with 40 uneven vertical layers (Marsland et
al, 2003). The performance of this climate model was evaluated for the Holocene (Wei and Lohmann, 2012; Lohmann et al.,
2013), the last millennium (Jungclaus et al., 2006), glacial millennial-scale variability (Gong et al., 2013; Weber et al., 2014;
Zhang et al., 2014), and warm climates in the Miocene (Knorr and Lohmann, 2014) and Pliocene (Stepanek and Lohmann, 155
2012).
The climate model was integrated for 3000 model years and provides monthly output. Here, anomalies in sea-level pressure
(SLP), wind directions (1000 hPa level) and surface air temperature (SAT) between the LGM and pre-industrial conditions
were analyzed for the boreal summer season - June, July and August (JJA). All produced Figures show climatological mean
characteristics averaged over a period of 100 years at the end of each simulation. 160
4. Results
4.1. Concentrations and fractional abundance of brGDGT
The summed concentration of all nine brGDGTs (ΣbrGDGT) is shown in Figure. 2a. The concentration of ΣbrGDGTs vary
between 40 and 160 ng/g dw throughout the record. Ranging between 60-80 ng/g dw, they are lowest during the LGM and the 165
late Holocene. During the deglaciation and the early Holocene (17-8 ka BP) lowest values are approx. 80 ng/g dw, except for
two peaks at 15-16 ka BP and 12-13 ka BP, respectively, where concentrations reach 160 ng/g dw (Fig. 2a).
Clim. Past Discuss., doi:10.5194/cp-2016-21, 2016Manuscript under review for journal Clim. PastPublished: 6 April 2016c© Author(s) 2016. CC-BY 3.0 License.
8
The fractional abundance of all nine brGDGTs, calculated relative to the ΣbrGDGT, is shown in Figure. 3. All samples are
characterized by a similar pattern. The composition of the brGDGT assemblage is dominated by brGDGTs without cyclopentyl
moieties which together account for 60-80% of the total GDGT-assemblage (GDGT Ia, IIa, IIIa; Fig. 3). GDGTs with a higher 170
degree of methylation are more abundant than lesser methylated ones. In 83 out of 90 samples GDGT IIIa is the most prominent
GDGT accounting for 22-37% of the total GDGT distribution. It is closely followed by GDGT IIa with 16-29% and GDGT Ia
which accounts for 14-23% of the total GDGT distribution. As for GDGTs containing cyclopentyl moieties, GDGT IIb is most
abundant accounting for 9-16% of the total GDGT assemblage. GDGT IIc, Ib, Ic, IIIb and IIIc are less abundant reaching 2-
6%, 3-7%, 1-3%, 2-4%, and 1-2%. In one outlying sample GDGT IIc accounts for 24% (Fig. 3). 175
4.2. Temperature development over the past 20 ka
The CBT/MBT’-derived temperatures are plotted in Fig. 2b. During the late Holocene (approx. 1 ka BP), the reconstructed
temperature is 7.5°C. Interestingly, glacial temperatures (between 20-18 ka) are the same (Fig. 2b). At 18 ka temperature drops
by about 1.5°C. At 16 ka temperature jumps back to the glacial level. As this increase is based on one single data point, it
cannot be excluded that this warming is an artifact resulting from an outlier. Deeming the data-point an outlier, temperature 180
increases progressively until the onset of the Bølling/Allerød at approx. 14.6 ka BP, where it abruptly jumps back to the glacial
and Holocene level of 7.5°C (Fig. 2e). Between 14.6 and 13 ka, temperature progressively decreases about 1-0.5°C. During
the Younger Dryas (YD) temperature abruptly decreases by about 2°C (at approx. 13 ka BP) and remains cold until 12 ka BP
(Fig. 2b). With approx. 4.5°C the YD is the coldest episode during the Glacial-Holocene transition. The cold spell is followed
by a sharp temperature increase of approx. 3°C at the onset of the Preboreal (PB)/early Holocene (Fig. 2b). After the abrupt 185
temperature increase into the PB temperature progressively increases culminating in a Mid-Holocene Thermal Maximum
(HTM) between 8.0-4.0 ka BP. With 8°C being reached between 6 and 4 ka BP, the mid-Holocene is the warmest episode
since the Last Glacial Maximum (LGM). At 4 ka BP a cooling trend initiates and temperature decreases by about 0.5°C (Fig.
2b). Compared to the deglacial temperature variations the Holocene variability is relatively small.
190
Clim. Past Discuss., doi:10.5194/cp-2016-21, 2016Manuscript under review for journal Clim. PastPublished: 6 April 2016c© Author(s) 2016. CC-BY 3.0 License.
9
4.3. LGM-climate simulation with COSMOS
4.3.1. Sea-level pressure and wind patterns
Model-simulations for SLP (JJA) are shown Fig. 4a. The LGM-simulation is characterized by strong positive anomalies in
sea-level pressure (SLP) over the American Continent (Fig. 4a). Positive SLP-anomalies also occur over the Arctic Ocean.
Negative SLP anomalies occur south of 50°N and are centered over the NW Pacific and East Asia, but are also observed in a 195
few grid-cells over the central and NE Pacific and over the Sea of Okhotsk. In the Bering Sea, the northern N-Pacific (north
of 50°N) and Beringia SLP does not change significantly relative to present.
The strong positive SLP-anomalies over North America are associated with pronounced anticyclonic anomalies in the wind
directions, which expand to the Chukchi-Sea and to the formerly exposed BLB (Fig. 4a). Over western Beringia as well as the
adjacent Arctic Ocean small northerly anomalies are present. Between 100°E and 110°E pronounced anticyclonic anomalies 200
are present over Russia. Over Kamchatka and the adjacent East Siberian Coast small northerly anomalies occur. The western
Bering Sea is characterized by easterly anomalies. Over the NW Pacific anomalies are small and show now general pattern. In
the NE Pacific relatively strong westerly to southwesterly anomalies are present.
4.3.2. Surface air temperature
Model simulations for SAT (JJA) are shown in Fig. 4b. The model predicts widespread negative surface air temperature (SAT)-205
anomalies over Beringia, East Asia, North America, the Arctic Ocean and the entire N-Pacific (Fig. 4b). However, in small
parts of the formerly exposed BLB slightly warmer-than-present conditions are simulated. On the arctic shelf a small band
where temperature may equal the PI-conditions as the SAT anomaly falls in the window of -1 to +1°C, occurs. The temperature
anomalies are strongest over North America where they reach -17°C. Over western Beringia the SAT anomaly increases from
east to west with SAT ranging between -1 and -5 over East Siberia and between -5 and -9 further west. Over the N-Pacific 210
SAT anomalies are smaller than over western Beringia and range between -1 and -5°C. SAT anomalies are smallest in the
Bering Sea and along the eastern coast of Kamchatka. Over the Peninsula itself, the majority of grid-cells indicate a negative
Clim. Past Discuss., doi:10.5194/cp-2016-21, 2016Manuscript under review for journal Clim. PastPublished: 6 April 2016c© Author(s) 2016. CC-BY 3.0 License.
10
anomaly (-3 to -5°C). In the northern part and over the adjacent Bering Sea the SAT anomalies are very small within the
window of -1 to +1°C (Fig. 4b).
5. Discussion 215
5.1. Sources of brGDGT and implications for CBT/MBT’-derived temperatures
Considering that brGDGT are thought to be synthesized by terrestrial bacteria which thrive in peats and soils (e. g. Weijers et
al., 2006b) it is most likely that the major origin of brGDGT in the marine sediments of the Bering Sea/NW Pacific would be
the Kamchatka Peninsula. However, BIT-values from core 12KL range between 0.08 and 0.2 (Meyer et al., submitted)
throughout the entire record, indicating that marine derived GDGT dominate the total GDGT composition and that terrigenous 220
input is low (Fig. 2c). Since a bias from in-situ production is particularly eminent in marine settings where terrigenous input
is low (e.g. Weijers et al., 2006b; Peterse et al., 2009; Zhu et al., 2011), non-soil derived brGDGTs potentially have a
considerable effect on the temperature reconstruction at site 12KL. However, the concentrations of ΣbrGDGT show strong
similarities with the trend of Titanium/Calcium ratios (Ti/Ca-ratios, Fig. 2d) from core 12KL (XRF-data from Max et al.
(2012)). Reflecting the proportion of terrigenous and marine derived inorganic components of the sediment, Ti/Ca-ratios can 225
be used as an estimator of terrigenous input. With relatively high values at 15.5 and 12 ka BP, and minima at 14 and 11 ka BP.
As intervals of relatively high/low terrigenous input (as suggested by Ti/Ca) coincide with relatively high/low ΣbrGDGT-
concentrations brGDGTs seem to be terrigenous (Fig. 2b, d). Moreover, the distribution of the brGDGTs the samples from site
12KL resemble the GDGT composition described for soils world-wide (Weijers et al., 2007; Blaga et al., 2010) as GDGT Ia,
IIa and IIIa dominate over GDGTs with cyclopentyl moieties (e.g. Ib, IIb) accounting for 60-80% of the total brGDGT 230
assemblage (Fig. 3). By contrast, in areas where GDGTs are thought to be produced in-situ, the GDGT compositions were
dominated by GDGTs containing cyclopentyl moieties (Peterse et al., 2009; Zell et al., 2014). Thus, brGDGT seem to be soil-
derived and a bias from in-situ production is unlikely. We also exclude changes in the source of brGDGTs through time because
the relative abundance of the brGDGTs is similar in all samples indicating that the source of brGDGTs remained constant
throughout the past 20 ka (Fig. 3). We consider the catchment of the Kamchatka River (CKD and inner flanks of the mountains) 235
and the Eastern Coast as the likely sources of brGDGTs deposited in the marine sediments at the core site since the Kamchatka
Clim. Past Discuss., doi:10.5194/cp-2016-21, 2016Manuscript under review for journal Clim. PastPublished: 6 April 2016c© Author(s) 2016. CC-BY 3.0 License.
11
River and several small rivers draining the Eastern Coast discharge into the western Bering Sea. Flowing southward along
Kamchatka, the East Kamchatka Current would carry the load of the Kamchatka River to site 12KL (Fig. 1b)
Although the CBT/MBT-paleothermometre has been suggested to generally record mean annual air temperatures (Weijers et
al., 2007) it is assumed to be biased to the summer months/ice-free season in high latitudes (Rueda et al., 2009, Shannahan et 240
al., 2013; Peterse et al., 2014). According to Klyuchi climate station (for location see Fig. 1b), mean annual air temperatures
in the northern CKD are approx. -0.5°C (http://en.climate-data.org/location/284590/). The CBT/MBT’-derived temperatures
for the core-top/late Holocene (7.5°C; Fig. 2) exceed the annual mean by approx. 8°C and are similar to mean air temperatures
from the ice-free season (Mai-October) at Klyuchi (approx. 9°C). Therefore, they are interpreted as summer temperature and
will be referred to as “Mean Air Temperature of the ice-free season” (MATifs) henceforth. 245
5.2. Temperature evolution over the past 20 ka
5.2.1. The LGM (20-18 ka) – warm summers and the regional context
The finding that LGM and Holocene MATifs are equal contrasts with the general understanding of the glacial climate according
to which the extratropics were significantly colder than today, as documented by several proxy-based temperature
reconstructions (e.g. MARGO compilation, Kageyama et al., 2006; Waelbroeck et al., 2009) and computer model simulations 250
(e.g. Kutzbach et al., 1998; Kageyama et al., 2006; Kim et al., 2008; Alder and Hostetler, 2015). The general cooling tendency
is thought to result from low summer insolation, reduced carbon-dioxide concentrations in the atmosphere and extensive
continental ice caps (Berger and Loutre 1991; Monnin et al., 2001; Kageyama et al., 2006, Shakun et al., 2012). Therefore,
one may expect that the Kamchatka Peninsula would experience a glacial-interglacial warming trend. As MATifs deviates from
the trends in CO2atm and insolation (Fig. 2b, e, f) regional climate drivers may have overprinted the effects of CO2atm and 255
summer insolation. Interestingly, several studies investigating climate in Beringia based on pollen and beetle-assemblages
indicate that in NE Siberia and the formerly exposed BLB (catchments of the Lena, Kolyma and Indigirka Rivers, Ayon Island,
Anadyr Lowlands, Lake El’Gygytgen, Seward Peninsula, Fig. 4c) summers during the LGM were as warm as at present or
were even warmer (Fig. 4c; Elias et al., 1996, 1997; Elias, 2001; Alfimov and Berman, 2001; Kienast, 2002; Kienast et al.,
2005; Sher et al., 2005; Berman et al., 2011). Only a few pollen and insect-data from Markovo, Lakes Jack London and 260
Clim. Past Discuss., doi:10.5194/cp-2016-21, 2016Manuscript under review for journal Clim. PastPublished: 6 April 2016c© Author(s) 2016. CC-BY 3.0 License.
12
El’Gygytgyn (Fig. 1a), point to colder-than-present conditions (Fig. 4c; Lozhkin et al., 1993; Alfimov and Bermann, 2001;
Lozhkin et al., 2007; Pitul’ko et al., 2007). The fairly large number of sites indicating warm summers in Siberia suggests that
a thermal anomaly was widespread over western/central Beringia (Fig. 4c) and extended to Kamchatka. The thermal anomaly
did probably not extend to eastern Beringia as insect-data as well as pollen consistently point to summer cooling of up to 4°C
(Fig. 4c; e.g. Mathews and Telka, 1997; Elias, 2001; Kurek et al., 2009). 265
5.2.2. Controls on MATifs
The warm Siberian summers were attributed to increased continentality, which would arise from the exposure of the extensive
Siberian and Chukchi shelves at times of lowered sea-level (Fig. 1a; e.g. Guthrie, 2001; Kienast et al., 2005; Berman et al.,
2011). The greater northward extent of the Beringian landmass (approx. +800 km relative to today) would have minimized
maritime influences from the cold Siberian and Chukchi Seas (Guthrie, 2001; Alfimov and Berman, 2001; Kienast et al., 2005; 270
Sher et al., 2005; Berman et al., 2011). Increased seasonal contrasts resulting in warmer summers and colder winters would
have been the result (e.g. Guthrie, 2001; Kienast et al., 2005). Winter cooling in Siberia (relative to modern) is indicated by
ice-wedge data (Meyer et al., 2002) from Bykovski Peninsula (Fig. 1a). Also, the presence of stronger-than-present sea-ice
cover in the Bering Sea (Caissie et al., 2010; Smirnova et al., 2015) points to cold winters in Siberia and Kamchatka during
the LGM. However, for Kamchatka it is unlikely that the thermal anomaly and an increased seasonal contrast were a direct 275
result from lowered sea-level as the bathymetry around the Peninsula is relatively steep and the exposed shelf area was very
small. (Fig. 1a, b). Thus, other climate drivers were likely responsible for the relatively warm summer conditions. Potential
mechanisms are changes in oceanic or atmospheric circulation.
Intriguingly, alkenone-based SST reconstructions from the Sea of Okhotsk indicate that glacial SST were slightly warmer than
today or equal to modern conditions (Seki et al., 2004, 2009; Harada et al., 2004, 2012; Fig. 4c). However, these records are 280
considered to be biased by seasonal variations in the alkenone production rather than to reflect real temperature anomalies
(Seki et al., 2004, 2009; Harada et al., 2004, 2012). This seems to be supported by a few TEXL86-based SST reconstruction
from the Sea of Okhotsk suggesting that LGM SST were approx. 5°C colder than at present (Seki et al. 2009; 2014). In this
light, a climatic relation between alkenone-based SST and MATifs seems very unlikely. Interestingly, LGM-SST in the
Clim. Past Discuss., doi:10.5194/cp-2016-21, 2016Manuscript under review for journal Clim. PastPublished: 6 April 2016c© Author(s) 2016. CC-BY 3.0 License.
13
subarctic NW Pacific (site 12KL) were only 1°C lower than at present (Fig. 2 h), a relatively small temperature difference 285
compared to other SST records from the NW Pacific and its marginal seas which suggest a cooling of 4-5°C on average (e.g.
Seki et al., 2009; 2014; Harada et al., 2012, Meyer et al., submitted). The relatively warm SST at site 12KL were explained by
a stronger-than-present influence of the Alaskan Stream (Fig. 1a) in the marginal NW Pacific (Meyer et al., submitted). Such
warm SST may have supported the establishment of warm conditions on Kamchatka. However, it is unlikely, that the
temperature development on Kamchatka was fully controlled by oceanic influences since this would probably cause a similar 290
temperature reduction as in the SST record of site 12KL.
If oceanic circulation alone is unlikely to have caused the warm temperatures on Kamchatka, atmospheric circulation may
have exerted a strong control on glacial summer temperatures in the region. In terms of atmospheric circulation the summer
climate of the Kamchatka is largely determined by the strength and position of the North Pacific High (NPH) over the N Pacific
(Mock et al., 1998). As the southerly flow at the southwestern edge of the NPH brings warm and moist air masses to Kamchatka 295
summers on the Peninsula become warmer when the NPH and the associated warm southerly flow increase in strength (Mock
et al., 1998). This modern analogue suggests that the LGM-NPH over the subarctic NW was stronger than today and the
resulting warming effect may have balanced the cooling effects of CO2atm and insolation. This atmospheric pattern could be
explained by an increased thermal gradient between western/central Beringia and the N-Pacific Ocean. While warm summers
were widespread in western Beringia, the majority of sea surface temperature (SST) records from the open N Pacific and the 300
Bering Sea indicate colder conditions during the LGM (Fig. 4A; deVernal and Pedersen, 1997; Seki et al., 2009, 2014; Kiefer
and Kienast, 2005; Harada et al., 2004; 2012; Maier et al., 2015; Meyer et al., submitted). Under the assumption that alkenone-
based reconstructions of LGM SST in the Sea of Okhotsk are biased, also the Sea of Okhotsk may have been 4-5°C colder
than at present as suggested by TEXL86-based SST reconstruction (Seki et al. 2009; 2014). An increased thermal gradient
between the subarctic N Pacific and western Beringia would translate into an increased pressure gradient between the low-305
pressure over western Beringia and the high pressure over the subarctic NW Pacific, and in response the southerly flow over
the Kamchatka would have intensified relative to today. (Fig. 4c).
Clim. Past Discuss., doi:10.5194/cp-2016-21, 2016Manuscript under review for journal Clim. PastPublished: 6 April 2016c© Author(s) 2016. CC-BY 3.0 License.
14
5.2.2.1. Comparison to the COSMOS-simulations
These inferences contrast with results from the climate simulations with COSMOS. For JJA the model predicts a decrease in 310
SLP over the NW-Pacific suggesting that the southerly flow at the western edge of the NPH was reduced rather than
strengthened (Fig. 4a). The weakening of the southerly flow is also discernable in the anomaly of the major wind-patterns
over the NW Pacific (Fig. 4a) as a small northerly anomaly occurs north of Kamchatka (Fig. 4a). The weakening of the NPH
is agreement with several other General Circulation Model (GCM) outputs, which consistently predict a reduction in SLP
over the N-Pacific (Kutzbach and Wright, 1985; Bartlein et al., 1998; Dong and Valdes, 1998; Vetteoretti et al., 2000; 315
Yanase and Abe-Ouchi, 2007; Alder and Hostetler, 2015). According to the climate synopsis by Mock et al (1998) a
northerly anomaly would have caused summer cooling on Kamchatka. It has been suggested that a pronounced positive SLP-
anomaly and a persistent anticyclone over the American continent resulted in reduced SLP over the Western North Pacific
(Yanase and Abe Ouchi, 2010). The positive SLP-anomaly and the strong anticyclonic tendencies are clearly present in the
COSMOS simulation of SLP and wind-patterns (Fig. 4a) and were also simulated by several other GCMs (e.g. Yanase and 320
Abe-Ouchi, 2007; 2010; Alder and Hostetler, 2015). Its development was attributed to the presence of extensive ice sheets
on the American continent (Yanase and Abe-Ouchi, 2010), which would have caused severe cooling of the overlying
atmosphere. Considering the consistency of different GCMs, the anticyclonic anomalies over North America as well as
resulting cyclonic anomalies over the N-Pacific seem to be a robust feature of the glacial atmospheric circulation. As this
contrast with the inferences made from the MATifs-record, one may speculate that the effect of the ice-caps on the NPH 325
mainly influenced the NE Pacific and that a strengthened anticyclone (as suggested in sec. 5.2.2) was restricted to the
subarctic NW Pacific. In other words, the NPH may have shifted westward in response to the presence of a strong
anticyclonic anomaly over the LIS.
The COSMOS-simulation also contrasts with the temperature patterns in western Beringia suggested by proxy-based climate
reconstructions (see. Sec. 5.1) as summers were simulated to be colder than at present on Kamchatka and in Siberia (Fig. 4b). 330
However, in small parts of the formerly exposed BLB and the arctic shelves temperatures level or exceed PI-conditions (Fig.
4b). These positive anomalies in the model are probably associated with the dominant anticyclonic flow over North America
Clim. Past Discuss., doi:10.5194/cp-2016-21, 2016Manuscript under review for journal Clim. PastPublished: 6 April 2016c© Author(s) 2016. CC-BY 3.0 License.
15
and the associated easterly to southeasterly winds over south-Alaska and the BLB (Fig. 4b). The exposure of the Siberian Shelf
may also have an effect. However, these anomalies are restricted to a relatively small area and are not comparable with the
widespread warming tendencies over Siberia, which are visible in the proxy-compilation (Fig. 4b, c). Given the discrepancies 335
between proxy-based temperature reconstructions for Siberia and computer-model simulations, the thermal gradient between
western Beringia and the subarctic NW Pacific may also differ. In the model simulation the thermal contrast between land and
ocean tends to become smaller since the negative temperature anomaly over western Beringia for the most part is more
pronounced than over the subarctic N-Pacific (Fig. 4b). This contrasts with the proxy compilation according to which the
thermal gradient was increased relative to present (Fig. 4c). As the model predicts a reduction of the thermal gradient the 340
preconditions for the increased landward air-flow are not given. In contrast a reduced thermal gradient would support a
northerly anomaly, which is in accordance with the simulated wind-patterns over Kamchatka (Fig. 4a). Hence, the
discrepancies between proxies and model-outputs concerning glacial summer temperature over western Beringia potentially
entail the mismatch regarding the atmospheric circulation patterns over the NW Pacific.
5.2.3. The deglaciation (18 ka-10 ka BP) 345
The deglacial short-term variability strongly resembles the climate development in the N-Atlantic as MATifs follows the
deglacial oscillations recorded in the NGRIP-δ18O (Fig. 2b, i), particularly after 15 ka BP. MATifs clearly mirrors the
Bølling/Allerød (B/A)-interstadial, the Younger Dryas (YD)-cold reversal and the subsequent temperature increase into the
Preboreal (PB; Fig. 2b, i). This similarity suggests a strong coupling with climate change in the N-Atlantic realm and hence
variations in the AMOC-strength. The pronounced response to N-Atlantic climate change is in line with the temperature 350
development in the surrounding seas where the majority of climate-records shows a Greenland-like pattern (Ternois et al.,
2000; Seki et al., 2004; Max et al., 2012; Caissie et al., 2010; Praetorius and Mix, 2014; Meyer et al., submitted). This in-phase
variability is assumed to result from atmospheric teleconnections between the N-Atlantic and the N-Pacific Oceans (e.g.
Manabe and Stouffer, 1988; Mikolajewicz et al., 1997; Vellinga and Wood, 2002; Okumura et al., 2009; Chikamoto et al.,
2012; Max et al., 2012; Kuehn et al., 2014). While the effects of an atmospheric coupling with the N-Atlantic are undoubtedly 355
present between 15 and 10 ka BP their relevance is questionable during Heinrich Stadial 1 (HS1). The cold-spell between 18
Clim. Past Discuss., doi:10.5194/cp-2016-21, 2016Manuscript under review for journal Clim. PastPublished: 6 April 2016c© Author(s) 2016. CC-BY 3.0 License.
16
ka BP and 14.6 ka BP as evident in the MATifs record may coincide with the HS1 in the N-Atlantic but initiates 2 ka earlier
than in NGRIP-δ18O. Considering that also SST records from the Western Bering Sea indicate that the Heinrich-equivalent
cold-spell commenced at approx. 16.5 ka BP (site 114KL, Meyer et al., submitted), the event in MATifs is probably not
associated with climate change in the N-Atlantic (Fig. 2b, g). This temporal offset cannot be explained by age-model 360
uncertainties in core 12KL since the error (1σ) of the calibrated radiocarbon ages is smaller than 100 yrs (Max et al., 2012). If
the cooling was not associated with climate change in the N-Atlantic, it could perhaps represents a local event on Kamchatka,
and potentially western Beringia, marking the abrupt end of the warm LGM-conditions. Since, to the knowledge of the authors,
such an event is not reported in the terrestrial realm of western Beringia, it is difficult to identify the driving processes. One
may speculate that the southerly flow abruptly weakened over Kamchatka. 365
A clear similarity between MATifs and NGRIP-δ18O establishes at approx. 15 ka BP. This has recently been described for the
SST in the marginal NW Pacific (Meyer et al., submitted) reconstructed for the same core site as investigated in the present
study (site 12KL, Fig. 2h). This record implies that the climate of the Kamchatka Peninsula until 15 ka BP was tied to the
climate change in the NW Pacific rather than to climate change in the Western Bering Sea (Fig. 2b, g, h, i). For SST this pattern
was explained by accumulation of AS waters in the NW Pacific, which likely overprinted the effect of the atmospheric 370
teleconnection by linking the western and the eastern basins of the N Pacific (Meyer et al., submitted). Hence, the effect of the
AS may have also determined temperature evolution on Kamchatka during the early deglaciation, restricting the teleconnection
to the period after 15 ka BP.
The clear and constant impact of N-Atlantic climate change between 15 and approx. 10 ka BP on Kamchatka is in agreement
with palynological data from the Kankaren Range/Northeast Siberia (Fig. 1a) where abrupt climatic changes corresponding to 375
the B/A and the YD are reported (Anderson and Lozhkin, 2015). Abrupt warming at the onset of the B/A is also evident in a
high resolution record from Lake Elikchan 4 (Lozhkin and Anderson, 1996; Kokorowski et al., 2008b) and may indicate a
linkage to N-Atlantic climate change. However, a climatic reversal equivalent to the YD is often absent in records from
northeast Siberia (east of 140°N and north of 65°N; Fig. 1a; e.g. Lake Jack London, Lake El’Gygytgyn and Wrangel Island;
Lozhkin et al., 1993, 2001, 2007; Lozhkin and Anderson, 1996; Nowaczyk et al., 2002; Nolan et al., 2003, Kokorowski et al., 380
Clim. Past Discuss., doi:10.5194/cp-2016-21, 2016Manuscript under review for journal Clim. PastPublished: 6 April 2016c© Author(s) 2016. CC-BY 3.0 License.
17
2008a,b), as compiled by Kokorowski et al. (2008a). By contrast, palynological data from Siberia (e.g. Lakes Dolgoe,
Smorodynovoye and Ulkhan Chabyda, Fig. 1a) indicates that a YD climatic reversal was present west of 140°N (Pisaric et al.,
2001; Anderson et al., 2002, Kokorowski et al., 2008a). This east-west gradient was explained by a westward shift of the East
Asian Trough (EAT; normally situated over the central Beringian coast; Mock et al., 1998) which caused cooling west of
140°N by enhancing cold northerly winds, and together with an anticyclone over the Beaufort Sea brought warming through 385
stronger easterlies into the region east of 140°N (Kokorowski et al., 2008a). The presence of a YD-cold reversal on Kamchatka
and in the Kankaren Range implies that the southeastern edge of Siberia was probably not affected by the shifting EAT. Several
general circulation models investigating the nature of teleconnections between the N-Atlantic and N-Pacific realms suggest
that the westerly Jet played an important role by acting as heat-conveyor between the N-Atlantic and the N-Pacific-Oceans
(e.g. Manabe and Stouffer, 1988; Okumura et al., 2009). Considering the modern average position of the westerly Jet (between 390
30 and 60°N) Kamchatka likely received the YD-cold reversal through the westerlies. Also, relatively strong marine influences
from the N-Pacific may have induced cooling on Kamchatka and may have also affected the Kankaren Range. Together with
the atmospheric patterns suggested by Kokorowski et al. (2008a), northward decreasing influences of the westerly Jet and the
Pacific Ocean north may explain north-south differences in northeast Siberia.
5.2.4. The Holocene 395
Although not quite pronounced in magnitude, the long-term MATifs evolution during the Holocene is characterized by a mid-
Holocene Thermal Maximum (HTM) between 8 and 4 ka BP which is followed by neoglacial cooling (Fig. 2b). This long-
term development is in good agreement with existing climate records from central and southern Kamchatka (Fig. 2j) where
pollen-based records indicate warm and wet conditions between 8 and 5 ka BP, which are associated with the HTM (Dirksen
et al., 2013). According to MATifs the climate deterioration after the HTM started at approx. 4 ka BP. This timing is 400
consistent with diatom-based climate reconstructions as well as chironomid-based temperatures from central and south
Kamchatka (Dirksen et al., 2013; Hoff et al., 2014) and with re-advancing mountain glaciers (Savoskul et al., 1999, Barr and
Solomina, 2014). As already discussed in previous studies this long-term temperature development is thought to respond to
changes in mean summer insolation (Fig. 2b, e, j). As summarized by Brooks et al. (2015), the timing of the HTM (approx.
Clim. Past Discuss., doi:10.5194/cp-2016-21, 2016Manuscript under review for journal Clim. PastPublished: 6 April 2016c© Author(s) 2016. CC-BY 3.0 License.
18
9-4 ka BP) on Kamchatka as well as in southern parts of eastern Siberia is delayed compared to northern parts of Chukotka 405
and Siberia where the HTM initiated at 9-8 ka BP (Biskaborn et al., 2012 and references therein; Nazarova et al., 2013b;
Anderson and Lozhkin, 2015). Since a similar delay of the HTM has been found in northern Europe (Seppä et al., 2009),
Brooks et al. (2015) concluded that the climate on Kamchatka was connected with the N-Atlantic realm by an atmospheric
coupling. Furthermore, the fact that Andrén et al. (2015) detected an 8.2 cooling-event in pollen-based climate records from
Kamchatka also points to a linkage with N-Atlantic climate. 410
Hence, it seems that the atmospheric linkage that determined climate variability during the deglaciation likely persisted into
the Holocene where it acted as an important driver for long-term climate changes as well as for abrupt, short-lived climatic
events.
6. Summary and Conclusion
Based on the CBT/MBT’-paleothermometre a continuous LGM-to-late Holocene record of summer-temperature in Kamchatka 415
is presented. The temperature evolution and the driving mechanisms were investigated. The record allows inferences for the
glacial atmospheric circulation patterns (i) and to describe how regional climate drivers (such as oceanic and atmospheric
circulation) as well as global and supra-regional drivers (including CO2atm, summer insolation and N-Atlantic climate
variability) influenced the climate change on Kamchatka (ii). The findings can be summarized as follows:
(i) LGM-summer temperatures were as high as at present. The warm summers likely result from a change in the regional 420
atmospheric circulation including a stronger-than-present southerly winds over Kamchatka as a result of a stronger-than-
present anticyclone over the subarctic NW Pacific. This was potentially driven by increased thermal gradients between
western Beringia and the N-Pacific Ocean. The temperature reconstruction as well as the inferences for atmospheric
circulation contrasts with model simulations, which predict widespread cooling over Siberia and Kamchatka, and a
weakening of the NPH over the NW Pacific together with a reduction of southerly winds over Kamchatka. These 425
discrepancies underline the need of further investigations of the LGM-climate in the NW Pacific realm using
environmental indicators and model simulations.
Clim. Past Discuss., doi:10.5194/cp-2016-21, 2016Manuscript under review for journal Clim. PastPublished: 6 April 2016c© Author(s) 2016. CC-BY 3.0 License.
19
During the LGM the warming effect of the altered regional atmospheric circulation likely balanced the cooling-effects
of lowered CO2atm and summer insolation.
(ii) Abrupt millennial-scale fluctuations characterize the deglacial temperature development and represent the most 430
prominent temperature changes during the past 20 ka. A first abrupt cooling-event at 18 ka BP marks the end of the
warm LGM conditions and is likely caused by regional climate change, the origin of which cannot be identified, yet.
From 15 ka onwards the temperature variations are obviously linked to climate change in the N-Atlantic, presumably
via rapid atmospheric teleconnections, as the B/A-interstadial and the YD cold reversal are clearly present. Regional
differences regarding the presence of a YD-cold reversal in Siberia are possibly related to the position of the westerly 435
Jet. During the Holocene the atmospheric linkage with the N-Atlantic remained active and together with summer
insolation is a primary driver for the long-term temperature development.
Acknowledgments
The study was part of a PhD project funded by the Helmholtz association through the President’s Initiative and Networking
Fund and is supported by GLOMAR – Bremen International Graduate School for Marine Sciences. Core SO201-2-12KL 440
was recovered during cruise SO201-2 which took place in 2009 within the frame of the German-Russian research project
“KALMAR” – Kurile-Kamchatka and Aleutian Marginal Sea Island Arc Systems: Geodynamic and Climate Interaction in
Space and Time”. We thank the Master and the crew of R/V SONNE for their professional support during the cruise. Dirk
Nürnberg is thanked for providing sample material. Alexander Weise is acknowledged for his assistance on the geochemical
sample preparation in the laboratories at the University of Bremen. The data obtained during this study are available online 445
on the “Pangaea”-database (www.pangaea.de).
References
Alder, J. R., Hostetler, S. W. and Sciences, A.: Global climate simulations at 3000-year intervals for the last 21 000 years with
the GENMOM coupled atmosphere – ocean model, Clim. Past, 11, 449–471, doi:10.5194/cp-11-449-2015, 2015.
Clim. Past Discuss., doi:10.5194/cp-2016-21, 2016Manuscript under review for journal Clim. PastPublished: 6 April 2016c© Author(s) 2016. CC-BY 3.0 License.
20
Alfimov, A. V. and Berman, D. I.: Beringian climate during the Late Pleistocene and Holocene, Quat. Sci. Rev., 20(1-3), 127–450
134, doi:10.1016/S0277-3791(00)00128-1, 2001.
Anderson, P. M., Edwards, M. E., Brubaker, L. B.: Results and Paleoclimate implications of 35 years of paleoecological
research in Alaska, Development in Quaternary Science 1, 427–440, 2003.
Anderson, P. M., Lozhkin, A. V., Brubaker, L. B.: A lacustrine pollen record from North Priokhot’ya: new information
about late Quaternary vegetational variations in western Beringia, Arctic Alpine Res., 28, 93–98, 1996. 455
Anderson, P. M., Lozhkin, A. V., Brubaker, L. B.: Implications of a 24000-yr palynological record for a Younger Dryas
cooling and for boreal forest development in northeastern Siberia, Quat. Res. 57, 325–333, 2002.
Anderson, P. A., and Lozhkin, A. V.: Late Quaternary vegetation of Chukotka (Northeast Russia), implications for Glacial and
Holocene environments of Beringia, Quat. Sci. Rev., 107, 112-128, 2015.
Anderson, P. M., Reanier, R. E., Brubaker, L. B.: A 14000-year pollen record from Sithylemenkat Lake, north-central 460
Alaska. Quat. Res., 33, 400–404, 1990.
Andrén, E., Klimaschewski, A., Self, A. E., Amour, N. St., Andreev, A. a., Bennett, K. D., Conley, D. J., Edwards, T. W. D.,
Solovieva, N. and Hammarlund, D.: Holocene climate and environmental change in north-eastern Kamchatka (Russian Far
East), inferred from a multi-proxy study of lake sediments, Glob. Planet. Change, 134, 41–54,
doi:10.1016/j.gloplacha.2015.02.013, 2015. 465
Andreev, A. A., Klimanov, V. A. and Sulerzhitsky, L. D.: Younger Dryas pollen records from central and southern Yakutia,
Quat. Int., 41/42, 111–117, 1997.
Barr, I. D. and Solomina, O.: Pleistocene and Holocene glacier fluctuations upon the Kamchatka Peninsula, Glob. Planet.
Change, 1–11, 2014.
Clim. Past Discuss., doi:10.5194/cp-2016-21, 2016Manuscript under review for journal Clim. PastPublished: 6 April 2016c© Author(s) 2016. CC-BY 3.0 License.
21
Bartlein, P. J., Anderson, K. H., Anderson, P. M., Edwards, M. E., Mock, C. J., Thompson, R. S., Webb, R. S., Webb, T. and 470
Whitlock, C.: Paleoclimate simulations for North America over the past 21,000 years: Features of the simulated climate and
comparisons with paleoenvironmental data, Quat. Sci. Rev., 17(6-7), 549–585, doi:10.1016/S0277-3791(98)00012-2, 1998.
Berger A. and Loutre M. F.: Insolation values for the climate of the last 10 million years. Quat. Sci. Rev., 10, pp. 297-317,
1991
Berman, D., Alfimov, A. and Kuzmina, S.: Invertebrates of the relict steppe ecosystems of Beringia, and the reconstruction 475
of Pleistocene landscapes, Quat. Sci. Rev., 30(17-18), 2200–2219, doi:10.1016/j.quascirev.2010.09.016, 2011.
Bigelow, N. H. and Edwards, M. E.: A 14000 yr paleoenvironmental record from Windmill Lake, central Alaska: evidence
for high-frequency climatic and vegetation fluctuations, Quat. Sci. Rev., 20, 203–215, 2001.
Biskaborn, B. K., Herzschuh, U., Bolshiyanov, D., Savelieva, L. and Diekmann, B.: Environmental variability in
northeastern Siberia during the last ~13,300yr inferred from lake diatoms and sediment-geochemical parameters, 480
Palaeogeogr. Palaeoclimatol. Palaeoecol., 329-330, 22–36, doi:10.1016/j.palaeo.2012.02.003, 2012.
Brooks, S. J., Diekmann, B., Jones, V. J. and Hammarlund, D.: Holocene environmental change in Kamchatka: A synopsis,
Glob. Planet. Change, 134, 166–174, doi:10.1016/j.gloplacha.2015.09.004, 2015.
Brovkin, V., Raddatz, T. Reick, C., Claussen, M. and Gayler, V.: Global biogeophysical interactions between forest and
climate, Geophys. Res. Lett. 36, L07405, doi:10.1029/2009GL037543, 2009. 485
Brubaker, L. B., Anderson, P. M. and Hu, F. S.: Vegetation ecotone dynamics in southwest Alaska during the late
Quaternary, Quat. Sci. Rev. 20, 175–188, 2001.
Caissie, B. E., Brigham-Grette, J., Lawrence, K. T., Herbert, T. D. and Cook, M. S.: Last Glacial Maximum to Holocene sea
surface conditions at Umnak Plateau, Bering Sea, as inferred from diatom, alkenone, and stable isotope records,
Paleoceanography, 25(1), PA1206, doi:10.1029/2008PA001671, 2010. 490
Clim. Past Discuss., doi:10.5194/cp-2016-21, 2016Manuscript under review for journal Clim. PastPublished: 6 April 2016c© Author(s) 2016. CC-BY 3.0 License.
22
Chikamoto, M. O., Menviel, L., Abe-Ouchi, A., Ohgaito, R., Timmermann, A., Okazaki, Y., Harada, N., Oka, A. and Mouchet,
A.: Variability in North Pacific intermediate and deep water ventilation during Heinrich events in two coupled climate models,
Deep Sea Res. Part II Top. Stud. Oceanogr., 61-64, 114–126, doi:10.1016/j.dsr2.2011.12.002, 2012.
De Jonge, C., Stadnitskaia, A., Hopmans, E. C., Cherkashov, G., Fedotov, A. and Sinninghe Damsté, J. S.: In situ produced
branched glycerol dialkyl glycerol tetraethers in suspended particulate matter from the Yenisei River, Eastern Siberia, 495
Geochim. Cosmochim. Acta, 125, 476–491, doi:10.1016/j.gapprox.2013.10.031, 2014.
de Vernal, A. and Pedersen, T. F.: Micropaleontology and palynology of core PAR87A-10: A 23,000 year record of
paleoenvironmental changes in the Gulf of Alaska, northeast North Pacific, Paleoceanography, 12(6), 821,
doi:10.1029/97PA02167, 1997.
Dirksen, V., Dirksen, O. and Diekmann, B.: Holocene vegetation dynamics and climate change in Kamchatka Peninsula, 500
Russian Far East, Rev. Palaeobot. Palynol., 190, 48–65, doi:10.1016/j.revpalbo.2012.11.010, 2013.
Dirksen, V., Dirksen, O., van den Bogaard, C. and Diekmann, B.: Holocene pollen record from Lake Sokoch, interior
Kamchatka (Russia), and its paleobotanical and paleoclimatic interpretation, Glob. Planet. Change, 134, 129–141,
doi:10.1016/j.gloplacha.2015.07.010, 2015.
Dong, B. and Valdes, P. J.: Simulations of the Last Glacial Maximum climates using a general circulation model: prescribed 505
versus computed sea surface temperatures, Clim. Dyn., 14, 571– 591, 1998.
Dong, L., Li, Q., Li, L. and Zhang, C. L.: Glacial – interglacial contrast in MBT/CBT proxies in the South China Sea:
Implications for marine production of branched GDGTs and continental teleconnection, Org. Geochem., 79, 74–82,
doi:10.1016/j.orggeochem.2014.12.008, 2015.
Dullo, W. C., Baranov, B. and van den Bogaard, C.: FS Sonne Fahrtbericht/Cruise Report SO201–2. IFM-GEOMAR, Report 510
35, Kiel, IFM262 GEOMAR, 2009.
Clim. Past Discuss., doi:10.5194/cp-2016-21, 2016Manuscript under review for journal Clim. PastPublished: 6 April 2016c© Author(s) 2016. CC-BY 3.0 License.
23
Elias, S. a., Short, S. K. and Birks, H. H.: Late Wisconsin environments of the Bering Land Bridge, Palaeogeogr.
Palaeoclimatol. Palaeoecol., 136(1-4), 293–308, doi:10.1016/S0031-0182(97)00038-2, 1997.
Elias, S. A., Short, S. K., Nelson, C. H. and Birks, H. H.: Life and times of the Bering land bridge, Nature, 382(6586), 60–
63, doi:10.1038/382060a0, 1996. 515
Elias, S. A.: Mutual climatic range reconstructions of seasonal temperatures based on Late Pleistocene fossil beetle
assemblages in Eastern Beringia, Quat. Sci. Rev., 20, 77–91, doi:10.1016/S0277-3791(00)00130-X, 2001.
Glebova, S., Ustinova, E. and Sorokin, Y.: Long-termchanges of atmospheric centers and climate regime of the Okhotsk Sea
in the last three decades. PICES Sci. Rep. 36, 3–9, 2009.
Gong, X., Knorr, G., Lohmann, G. and Zhang, X.: Dependence of abrupt Atlantic meridional ocean circulation changes on 520
climate background states. Geophys. Res. Lett. 40 (14), 3698–3704, doi:10.1002/grl.50701, 2013.
Guthrie, R. D.: Origin and causes of the mammoth steppe: a story of cloud cover, woolly mammal tooth pits, buckles, and
inside-out Beringia, Quat. Sci. Rev., 20, 549–574, 2001.
Hammarlund, D., Klimaschewski, A., St. Amour, N. A., Andrén, E., Self, A. E., Solovieva, N., Andreev, A. A., Barnekow, L.
and Edwards, T. W. D.: Late Holocene expansion of Siberian dwarf pine (Pinus pumila) in Kamchatka in response to increased 525
snow cover as inferred from lacustrine oxygen-isotope records, Glob. Planet. Change, 134, 91–100,
doi:10.1016/j.gloplacha.2015.04.004, 2015.
Harada, N., Ahagon, N., Uchida, M. and Murayama, M.: Northward and southward migrations of frontal zones during the past
40 kyr in the Kuroshio – Oyashio transition area. Geochem. Geophys. Geosyst. 5, Q09004, 2004.
Harada, N., Sato, M., Seki, O., Timmermann, A., Moossen, H., Bendle, J., Nakamura, Y., Kimoto, K., Okazaki, Y., Nagashima, 530
K., Gorbarenko, S. A., Ijiri, A., Nakatsuka, T., Menviel, L., Chikamoto, M. O., Abe-Ouchi, A. and Schouten, S.: Sea surface
Clim. Past Discuss., doi:10.5194/cp-2016-21, 2016Manuscript under review for journal Clim. PastPublished: 6 April 2016c© Author(s) 2016. CC-BY 3.0 License.
24
temperature changes in the Okhotsk Sea and adjacent North Pacific during the last glacial maximum and deglaciation, Deep
Sea Res. Part II Top. Stud. Oceanogr., 61-64, 93–105, doi:10.1016/j.dsr2.2011.12.007, 2012.
Hoff, U., Dirksen, O., Dirksen, V., Kuhn, G., Meyer, H. and Diekmann, B.: Holocene freshwater diatoms: palaeoenvironmental
implications from south Kamchatka, Russia, Boreas, 43(1), 22–41, doi:10.1111/bor.12019, 2014. 535
Hoff, U., Biskaborn, B. K., Dirksen, V. G., Dirksen, O., Kuhn, G., Meyer, H., Nazarova, L., Roth, A. and Diekmann, B.:
Holocene environment of Central Kamchatka, Russia: Implications from a multi-proxy record of Two-Yurts Lake, Glob.
Planet. Change, 134, 101–117, doi:10.1016/j.gloplacha.2015.07.011, 2015.
Hopkins, D. M., Matthews Jr., J. V., Schweger, C. E. and Young, S. B. (Eds.): Paleoecology of Beringia. Academic Press,
New York, 1982. 540
Hopmans, E. C., Schouten, S., Pancost, R. D., Van Der Meer, M. T. J., & Sinninghe Damsté, J. S. (2000). Analysis of intact
tetraether lipids in archaeal cell material and sediments by high performance liquid chromatography/atmospheric pressure
chemical ionization mass spectrometry. Rapid Commun. Mass Spectrom: RCM, 14(7), 585–9.
Hopmans, E. C., Weijers, J. W. ., Schefuß, E., Herfort, L., Sinninghe Damsté, J. S. and Schouten, S.: A novel proxy for
terrestrial organic matter in sediments based on branched and isoprenoid tetraether lipids, Earth Planet. Sci. Lett., 224(1-2), 545
107–116, doi:10.1016/j.epsl.2004.05.012, 2004.
Climate data from Klyuchi climate station. http://de.climate-data.org/location/284590/, 2015
Ivanov, A.: The Far East. In: The Physical Geography of Northern Eurasia, Shahgedanova M. (ed.). Oxford University Press:
Oxford, 422-447, 2002.
Jungclaus, J. H., Keenlyside, N., Botzet, M., Haak, H., Luo, J.-J., Latif, M., Marotzke, J., Mikolajewic, M. and Roeckner, E.: 550
Ocean circulation and tropical variability in the coupled model ECHAM5/MPI-OM, J. Climate, 19, 3952–3972, 2006.
Clim. Past Discuss., doi:10.5194/cp-2016-21, 2016Manuscript under review for journal Clim. PastPublished: 6 April 2016c© Author(s) 2016. CC-BY 3.0 License.
25
Jones, V. and Solomina, O.: The Geography of Kamchatka, Glob. Planet. Change, 134, 3–9,
doi:10.1016/j.gloplacha.2015.06.003, 2015.
Kageyama, M., Laîné, a., Abe-Ouchi, a., Braconnot, P., Cortijo, E., Crucifix, M., de Vernal, a., Guiot, J., Hewitt, C. D., Kitoh,
a., Kucera, M., Marti, O., Ohgaito, R., Otto-Bliesner, B., Peltier, W. R., Rosell-Melé, a., Vettoretti, G., Weber, S. L. and Yu, 555
Y.: Last Glacial Maximum temperatures over the North Atlantic, Europe and western Siberia: a comparison between PMIP
models, MARGO sea-surface temperatures and pollen-based reconstructions, Quat. Sci. Rev., 25(17-18), 2082–2102,
doi:10.1016/j.quascirev.2006.02.010, 2006.
Kiefer, T. and Kienast, M.: Patterns of deglacial warming in the Pacific Ocean: a review with emphasis on the time interval of
Heinrich event 1, Quat. Sci. Rev., 24(7-9), 1063–1081, doi:10.1016/j.quascirev.2004.02.021, 2005. 560
Kienast, F.: Die Rekonstruktion der spätquartären Vegetations- und Klimageschichte der Laptewsee-Region auf der Basis
botanischer Großrestuntersuchungen. Ph.D. Dissertation, Potsdam University, 116pp, 2002.
Kienast, F., Schirrmeister, L., Siegert, C. and Tarasov, P.: Palaeobotanical evidence for warm summers in the East Siberian
Arctic during the last cold stage, Quat. Res., 63(3), 283–300, doi:10.1016/j.yqres.2005.01.003, 2005.
Kim, S. J., Crowley, T. J., Erickson, D. J., Govindasamy, B., Duffy, P. B. and Lee, B. Y.: High-resolution climate simulation 565
of the last glacial maximum, Clim. Dyn., 31(1), 1–16, doi:10.1007/s00382-007-0332-z, 2008.
Kiselev, S. V.: Beetles in North-East Siberia during the Late Cenozoic. Nauka Press, Moscow, 1981 (in Russian).
Klimaschewski, A., Barnekow, L., Bennett, K. D., Andreev, A. A., Andrén, E., Bobrov, A. A. and Hammarlund, D.:
Holocene environmental changes in southern Kamchatka, Far Eastern Russia, inferred from a pollen and testate amoebae
peat succession record, Glob. Planet. Change, 134, 142–154, doi:10.1016/j.gloplacha.2015.09.010, 2015. 570
Knorr, G. and Lohmann, G.: Climate warming during Antarctic ice sheet expansion at the Middle Miocene transition, Nature
Geosci. 7, 376–381, 2014.
Clim. Past Discuss., doi:10.5194/cp-2016-21, 2016Manuscript under review for journal Clim. PastPublished: 6 April 2016c© Author(s) 2016. CC-BY 3.0 License.
26
Kokorowski, H. D., Anderson, P. M., Mock, C. J. and Lozhkin, A. V.: A re-evaluation and spatial analysis of evidence for a
Younger Dryas climatic reversal in Beringia, Quat. Sci. Rev., 27, 1710–1722, doi:10.1016/j.quascirev.2008.06.010, 2008a.
Kokorowski, A. H. D., Anderson, P. M., Sletten, R. S., Lozhkin, A. V. and Brown, T. A.: Late Glacial and Early Holocene 575
Climatic Changes Based on a Multiproxy Lacustrine Sediment Record from Northeast Siberia, Arctic, Antarct. Alp. Res.,
40(3), 497–505, doi:10.1657/1523-0430(07-036), 2008b.
Kondratyuk, V. I.: Climate of Kamchatka. Hydrometeoizdat, Moscow, 1974 (In Russian).
Kuehn, H., Lembke-Jene, L., Gersonde, R., Esper, O., Lamy, F., Arz, H., Kuhn, G. and Tiedemann, R.: Laminated sediments
in the Bering Sea reveal atmospheric teleconnections to Greenland climate on millennial to decadal timescales during the last 580
deglaciation, Clim. Past, 10(6), 2215–2236, doi:10.5194/cp-10-2215-2014, 2014.
Kurek, J., Cwynar, L. C., Ager, T. A., Abbott, M. B. and Edwards, M. E.: Late Quaternary paleoclimate of western Alaska
inferred from fossil chironomids and its relation to vegetation histories, Quat. Sci. Rev., 28(9-10), 799–811,
doi:10.1016/j.quascirev.2008.12.001, 2009.
Kutzbach, J., Gallimore, R., Harrison, S., Behling, P., Selin, R. and Laarif, F.: Climate and Biome simulations for the past 585
21,000 years, Quat. Sci. Rev., 17(6-7), 473–506, 1998.
Kutzbach, J. E. and Wright, E.: Simulation of the climate of 18 000 years BP: results for the North American / North
Atlantic/ European sector and comparison with the geological record of North America, Quart. Sci. Rev., 4, 147–185, 1985.
Lohmann, G., Pfeiffer, M., Laepple, T., Leduc, G. and Kim, J.-H.: A model-data comparison of the Holocene global sea
surface temperature evolution, Clim. Past, 9, 1807-1839, 2013 590
Lozhkin, A. V. and Anderson, P. M.: A late Quaternary pollen record from Elikchan 4 Lake, northeast Siberia, Geol. Pac.
Ocean, 12, 609–616, 1996.
Clim. Past Discuss., doi:10.5194/cp-2016-21, 2016Manuscript under review for journal Clim. PastPublished: 6 April 2016c© Author(s) 2016. CC-BY 3.0 License.
27
Lozhkin, A. V. Anderson, P. M. Ravako, L. G. Hopkins, D. M. Brubaker, L. B., Colinvaux, P. A. Miller, M. C.: Late Quaternary
Lacustrine Pollen Records from Southwestern Beringia, Quat. Res., 39, 314–324, 1993.
Lozhkin, a. V., Anderson, P. M., Vartanyan, S. L., Brown, T. A., Belaya, B. V. and Kotov, A. N.: Late Quaternary 595
palaeoenvironments and modern pollen data from Wrangel Island (Northern Chukotka), Quat. Sci. Rev., 20(1-3), 217–233,
doi:10.1016/S0277-3791(00)00121-9, 2001.
Lozhkin, a. V., Anderson, P. M., Matrosova, T. V. and Minyuk, P. S.: The pollen record from El’gygytgyn Lake: Implications
for vegetation and climate histories of northern Chukotka since the late middle Pleistocene, J. Paleolimnol., 37(1), 135–153,
doi:10.1007/s10933-006-9018-5, 2007. 600
Maier, E., Méheust, M., Abelmann, A., Gersonde, R., Chapligin, B., Ren, J., Stein, R., Meyer, H. and Tiedemann, R.: Deglacial
subarctic Pacific surface water hydrography and nutrient dynamics and links to North Atlantic climate variability and
atmospheric CO2, Paleoceanography, 30(7), 949–968, doi:10.1002/2014PA002763, 2015.
Manabe, S. and Stouffer, R. J.: Two stable equilibria of a coupled ocean-atmosphere model. J. Climate, 1, 841-861, 1988.
Marsland, S. J., Haak, H., Jungclaus, J. H., Latif, M. and Röske, F.: The Max-Planck-Institute global ocean/sea ice model 605
with orthogonal curvilinear coordinates. Ocean Modell. 5, 91–127, doi:10.1016/S1463-5003(02)00015-X, 2003.
Matthews Jr., J.V. and Telka, A.: Insect fossils from the Yukon. In: Danks, H.V., Downes, J.A. (Eds.), Insects of the Yukon.
Ottawa, Biological Survey of Canada (Terrestrial Arthropods), pp. 911-962, 1997.
Max, L., Riethdorf, J.-R., Tiedemann, R., Smirnova, M., Lembke-Jene, L., Fahl, K., Nürnberg, D., Matul, A. and Mollenhauer,
G.: Sea surface temperature variability and sea-ice extent in the subarctic northwest Pacific during the past 15,000 years, 610
Paleoceanography, 27(3), PA3213, doi:10.1029/2012PA002292, 2012.
Clim. Past Discuss., doi:10.5194/cp-2016-21, 2016Manuscript under review for journal Clim. PastPublished: 6 April 2016c© Author(s) 2016. CC-BY 3.0 License.
28
Meyer, H., Dereviagin, A., Siegert, C., Schirrmeister, L. and Hubberten, H.-W.: Palaeoclimate reconstruction on Big
Lyakhovsky Island, north Siberia - Hydrogen and oxygen isotopes in ice wedges, Permafr. Periglac. Process., 13(2), 91–105,
doi:10.1002/ppp.416, 2002.
Meyer, V. D., Max, L., Hefter, J., Tiedemann, R. and Mollenhauer, G.: Glacial-to-Holocene evolution of sea surface 615
temperature and surface circulation in the subarctic Northwest Pacific and the Western Bering Sea, Paleoceanography
(submitted).
Meyer, H., Schirrmeister, L., Yoshikawa, K., Opel, T., Wetterich, S., Hubberten, H. W. and Brown, J.: Permafrost evidence
for severe winter cooling during the Younger Dryas in northern Alaska, Geophys. Res. Lett., 37(3), 1–5,
doi:10.1029/2009GL041013, 2010. 620
Mikolajewicz, U., Crowley, T. J., Schiller, A. and Voss, R.: Modelling teleconnections between the North Atlantic and North
Pacific during the Younger Dryas, Nature, 387, 384–387, 1997.
Mock, C. J., Mock, C. J., Bartlein, P. J., Bartlein, P. J., Anderson, P. a and Anderson, P. A.: Atmospheric circulation patterns
and spatial climatic variations, Beringia, Int. J. Climatol., 10, 1085–1104, 1998.
Monnin, E., Indermühle, A., Dällenbach, A., Flückiger, J., Stauffer, B., Stocker, T. F., Raynaud, D. and Barnola, J. M.: 625
Atmospheric CO2 concentrations over the last glacial termination, Science, 291(5501), 112–114,
doi:10.1126/science.291.5501.112, 2001.
Nazarova, L., de Hoog, V., Hoff, U., Dirksen, O. and Diekmann, B.: Late Holocene climate and environmental changes in
Kamchatka inferred from the subfossil chironomid record, Quat. Sci. Rev., 67, 81–92, doi:10.1016/j.quascirev.2013.01.018,
2013a. 630
Clim. Past Discuss., doi:10.5194/cp-2016-21, 2016Manuscript under review for journal Clim. PastPublished: 6 April 2016c© Author(s) 2016. CC-BY 3.0 License.
29
Nazarova, L., Lüpfert, H., Subetto, D., Pestryakova, L. and Diekmann, B.: Holocene climate conditions in central Yakutia
(Eastern Siberia) inferred from sediment composition and fossil chironomids of Lake Temje, Quat. Int. 290–291, 264–274,
2013b.
Nolan, M., Liston, G., Prokein, P., Brigham-Grette, J., Sharpton, V. L. and Huntzinger, R.: Analysis of lake ice dynamics and
morphology on Lake El’gygytgyn, NE Siberia, Siberia, using synthetic aperture radar (SAR) and Landsat, J. Geophys. Res., 635
108, 1–12, 2003.
North Greenland Ice Core Project members: High-resolution record of northern hemisphere climate extending into the last
interglacial period, Nature, 431, 147–151, doi:10.1038/nature02805, 2004.
Nowaczyk, N. R., Minyuk, P., Melles, M., Brigham-Grette, J., Glushkova, O., Nolan, M., Lozhkin, A. V., Stetsenko, T. V.,
Anderson, P. M. and Forman, S. L.: Magneto-stratigraphic results from impact crater Lake El’gygytgyn, northeast Siberia: a 640
300 kyr long high-resolution terrestrial palaeoclimatic record from the Arctic, Geophys. J. Int., 150, 109–126, 2002.
Peterse, F., Kim, J.-H., Schouten, S., Kristensen, D. K., Koç, N. and Sinninghe Damsté, J. S.: Constraints on the application
of the MBT/CBT palaeothermometer at high latitude environments (Svalbard, Norway), Org. Geochem., 40(6), 692–699,
doi:10.1016/j.orggeochem.2009.03.004, 2009.
Peterse, F., van der Meer, J., Schouten, S., Weijers, J. W. H., Fierer, N., Jackson, R. B., Kim, J.-H. and Sinninghe Damsté, J. 645
S.: Revised calibration of the MBT–CBT paleotemperature proxy based on branched tetraether membrane lipids in surface
soils, Geochim. Cosmochim. Acta, 96, 215–229, doi:10.1016/j.gapprox.2012.08.011, 2012.
Peterse, F., Vonk, J., Holmes, M., Giosan, L., Zimov, N. and Eglinton, T. I.: Branched glycerol dialkyl glycerol tetraethers in
Arctic lake sediments: Sources and implications for paleothermometry at high latitudes, J. Geophys. Res. Biogeosciences, 119,
1738–1754, doi:10.1002/2014JG002639., 2014. 650
Clim. Past Discuss., doi:10.5194/cp-2016-21, 2016Manuscript under review for journal Clim. PastPublished: 6 April 2016c© Author(s) 2016. CC-BY 3.0 License.

30
Pisaric, M. F. J., MacDonald, G. M., Velichko, A. A. and Cwynar, L. C.: The late-glacial and post-glacial vegetation history
of the northwestern limits of Beringia based on pollen, stomates, and tree stump evidence, Quat. Sci. Rev., 20, 235–245,
2001.
Pitul’ko, V. V., Pavlova, E. Y., Kuz’mina, S. A., Nikol’skii, P. A., Basilyan, A. E., Tumskoi, V. E. and Anisimov, M. A.:
Natural-climatic changes in the Yana-Indigirka lowland during the terminal Kargino time and habitat of late Paleolithic man 655
in northern part of East Siberia, Dokl. Earth Sci., 417(1), 1256–1260, doi:10.1134/S1028334X07080284, 2007.
Praetorius, S. K. and Mix, A. C.: Synchronization of North Pacific and Greenland climates preceded abrupt deglacial
warming, Science, 345(6195), 444–8, doi:10.1126/science.1252000, 2014.
Roeckner, E., Brokopf, R., Esch, M., Giorgetta, M., Hagemann, S. and Kornbueh, L.: Sensitivity of simulated climate to
horizontal and vertical resolution in the ECHAM5 Atmosphere Model, J. Climate, 19, 3771–3791, doi:10.1175/JCLI3824.1, 660
2006.
Rueda, G., Rosell-Melé, A., Escala, M., Gyllencreutz, R. and Backman, J.: Comparison of instrumental and GDGT-based
estimates of sea surface and air temperatures from the Skagerrak, Org. Geochem., 40(2), 287–291,
doi:10.1016/j.orggeochem.2008.10.012, 2009.
Savoskul, O. S.: Holocene glacier advances in the headwaters of Sredniaya Avacha, Kamchatka, Russia. Qual. Res. 52, 14–665
26, 1999.
Schouten, S., Huguet, C., Hopmans, E. C., and Sinninghe Damsté, J. S.: Improved analytical methodology of the TEX86
paleothermometry by high performance liquid chromatography/atmospheric pressure chemical ionization-mass spectrometry,
Anal. Chem., 79, 2940–2944, 2007.
Clim. Past Discuss., doi:10.5194/cp-2016-21, 2016Manuscript under review for journal Clim. PastPublished: 6 April 2016c© Author(s) 2016. CC-BY 3.0 License.
31
Seki, O., Bendle, J. a., Harada, N., Kobayashi, M., Sawada, K., Moossen, H., Inglis, G. N., Nagao, S. and Sakamoto, T.: 670
Assessment and calibration of TEX86 paleothermometry in the Sea of Okhotsk and sub-polar North Pacific region: Implications
for paleoceanography, Prog. Oceanogr., 126, 254–266, doi:10.1016/j.pocean.2014.04.013, 2014.
Seki, O., Kawamura, K., Ikehara, M., Nakatsuka, T. and Oba, T.: Variation of alkenone sea surface temperature in the Sea of
Okhotsk over the last 85 kyrs, Org. Geochem., 35(3), 347–354, doi:10.1016/j.orggeochem.2003.10.011, 2004.
Seki, O., Sakamoto, T., Sakai, S., Schouten, S., Hopmans, E. C., Sinninghe Damste, J. S. and Pancost, R. D.: Large changes 675
in seasonal sea ice distribution and productivity in the Sea of Okhotsk during the deglaciations, Geochemistry, Geophys.
Geosystems, 10(10), Q10007, doi:10.1029/2009GC002613, 2009.
Self, A. E., Klimaschewski, A., Solovieva, N., Jones, V. J., Andrén, E., Andreev, A. A., Hammarlund, D. and Brooks, S. J.:
The relative influences of climate and volcanic activity on Holocene lake development inferred from a mountain lake in
central Kamchatka, Glob. Planet. Change, 134, 67–81, doi:10.1016/j.gloplacha.2015.06.012, 2015. 680
Seppä, H., Bjune, A. E., Telford, R. J., Birks, H. J. B. and Veski, S.: Last nine-thousand years of temperature variability in
Northern Europe, Clim. Past 5, 523–535, 2009.
Shakun, J. D., Clark, P. U., He, F., Marcott, S. A., Mix, A. C., Liu, Z., Otto-Bliesner, B., Schmittner, A. and Bard, E.: Global
warming preceded by increasing carbon dioxide concentrations during the last deglaciation, Nature, 484(7392), 49–54,
doi:10.1038/nature10915, 2012. 685
Shanahan, T. M., Hughen, K. A. and Van Mooy, B. A. S.: Temperature sensitivity of branched and isoprenoid GDGTs in
Arctic lakes, Org. Geochem., 64, 119–128, doi:10.1016/j.orggeochem.2013.09.010, 2013.
Sher, A. V., Kuzmina, S. A., Kuznetsova, T. V. and Sulerzhitsky, L. D.: New insights into the Weichselian environment and
climate of the East Siberian Arctic, derived from fossil insects, plants, and mammals, Quat. Sci. Rev., 24(5-6), 533–569,
doi:10.1016/j.quascirev.2004.09.007, 2005. 690
Clim. Past Discuss., doi:10.5194/cp-2016-21, 2016Manuscript under review for journal Clim. PastPublished: 6 April 2016c© Author(s) 2016. CC-BY 3.0 License.
32
Smirnova, M. A., Kazarina, G. K., Matul, A. G. and Max, L.: Diatom Evidence for Paleoclimate Changes in the Northwestern
Pacific during the Last 20000 Years, Mar. Geol., 55(3), 425–431, doi:10.1134/S0001437015030157, 2015.
Solovieva, N., Klimaschewski, A., Self, A. E., Jones, V. J., Andrén, E., Andreev, A. A., Hammarlund., D., Lepskaya, E. V.
and Nazarova, L.: The Holocene environmental history of a small coastal lake on the north-eastern Kamchatka Peninsula,
Glob. Planet. Change, 134, 55–66, doi:10.1016/j.gloplacha.2015.06.010, 2015. 695
Stabeno, P. J., and Reed, R. K.: Circulation in the Bering Sea basin by satellite tracked drifters. J. Phys. Oceanogr., 24(4),
848-854, 1994.
Stepanek, C., and Lohmann, G.: Modelling mid-Pliocene climate with COSMOS, Geosci. Model Dev., 5, 1221-1243, 2012.
Ternois, Y. T., Awamura, K. K., Hkouchi, N. O. and Eigwin, L. K.: Alkenone sea surface temperature in the Okhotsk Sea for
the last 15 kyr, Geochem. J., 34, 283–293, 2000. 700
Vettoretti, G., Peltier, W. R., and McFarlane, N. A.: Global water balance and atmospheric water vapor transport at last
glacial maximum: climate simulations with the Canadian Climate Center for Modelling and Analysis atmospheric general
circulation model, Can. J. Earth Sci., 37, 695–723, 2000.
Vellinga, M. and R. A. Wood, R. A.: Global climate impacts of a collapse of the Atlantic thermohaline circulation, Clim.
Chang., 54(3), 251-267, doi:10,1023/A:1016168827653, 2002. 705
Waelbroeck, C., Paul, A., Kucera, M., Rosell-Melé, A., Weinelt, M., Schneider, R., Mix, a. C., Abelmann, A., Armand, L.,
Bard, E., Barker, S., Barrows, T. T., Benway, H., Cacho, I., Chen, M.-T., Cortijo, E., Crosta, X., de Vernal, A., Dokken, T.,
Duprat, J., Elderfield, H., Eynaud, F., Gersonde, R., Hayes, A., Henry, M., Hillaire-Marcel, C., Huang, C.-C., Jansen, E.,
Juggins, S., Kallel, N., Kiefer, T., Kienast, M., Labeyrie, L., Leclaire, H., Londeix, L., Mangin, S., Matthiessen, J., Marret,
F., Meland, M., Morey, A. E., Mulitza, S., Pflaumann, U., Pisias, N. G., Radi, T., Rochon, A., Rohling, E. J., Sbaffi, L., 710
Clim. Past Discuss., doi:10.5194/cp-2016-21, 2016Manuscript under review for journal Clim. PastPublished: 6 April 2016c© Author(s) 2016. CC-BY 3.0 License.
33
Schäfer-Neth, C., Solignac, S., Spero, H., Tachikawa, K. and Turon, J.-L.: Constraints on the magnitude and patterns of
ocean cooling at the Last Glacial Maximum, Nat. Geosci., 2, 127–132, doi:10.1038/ngeo411, 2009.
Weber, M. E., Clark, P. U., Kuhn, G., Timmermann, A., Sprenk, D., Gladstone, R., Zhang, X., Lohmann, G., Menviel, L.,
Chikamoto, M. O., Friedrich, T. and Ohlwein, C.: Millennial-scale variability in Antarctic ice-sheet discharge during the last
deglaciation, Nature 510, 134–138, doi:10.1038/nature13397, 2014 715
Wei, W., Lohmann, G. and Dima, M.: Distinct modes of internal variability in the Global Meridional Overturning Circulation
associated to the Southern Hemisphere westerly winds, J. Phys. Oceanogr., 42, 785–801. doi:10.1175/JPO-D-11-038.1, 2012
Wei, W., and Lohmann, G.: Simulated Atlantic Multidecadal Oscillation during the Holocene, J. Climate, 25, 6989–7002.
doi:10.1175/JCLI-D-11-00667.1, 2012
Weijers, J. W. H., Schouten, S., Hopmans, E. C., Geenevasen, J. A. J., David, O. R. P., Coleman, J. M., Pancost, R. D. and 720
Sinninghe Damsté, J. S.: Membrane lipids of mesophilic anaerobic bacteria thriving in peats have typical archaeal traits,
Environ. Microbiol. 8, 648–657, 2006a
Weijers, J. W. H., Schouten, S., Spaargaren, O. C. and Sinninghe Damsté, J. S.: Occurrence and distribution of tetraether
membrane lipids in soils: Implications for the use of the TEX86 proxy and the BIT index, Org. Geochem., 37(12), 1680–1693,
doi:10.1016/j.orggeochem.2006.07.018, 2006b. 725
Weijers, J. W. H., Schouten, S., van den Donker, J. C., Hopmans, E. C. and Sinninghe Damsté, J. S.: Environmental controls
on bacterial tetraether membrane lipid distribution in soils, Geochim. Cosmochim. Acta, 71(3), 703–713,
doi:10.1016/j.gapprox.2006.10.003, 2007.
Yanase, W. and Abe-Ouchi, A.: The LGM surface climate and atmospheric circulation over East Asia and the North Pacific
in the PMIP2 coupled model simulations, Clim. Past Discuss., 3(2), 655–678, doi:10.5194/cpd-3-655-2007, 2007. 730
Clim. Past Discuss., doi:10.5194/cp-2016-21, 2016Manuscript under review for journal Clim. PastPublished: 6 April 2016c© Author(s) 2016. CC-BY 3.0 License.
34
Yanase, W. and Abe-Ouchi, A.: A numerical study on the atmospheric circulation over the midlatitude North Pacific during
the last glacial maximum, J. Clim., 23(1), 135–151, doi:10.1175/2009JCLI3148.1, 2010.
Zell, C., Kim, J.-H., Hollander, D., Lorenzoni, L., Baker, P., Silva, C. G., Nittrouer, C. and Sinninghe Damsté, J. S.: Sources
and distributions of branched and isoprenoid tetraether lipids on the Amazon shelf and fan: Implications for the use of GDGT-
based proxies in marine sediments, Geochim. Cosmochim. Acta, 139, 293–312, doi:10.1016/j.gapprox.2014.04.038, 2014. 735
Zell, C., Kim, J.-H., Moreira-Turcq, P., Abril, G., Hopmans, E. C., Bonnet, M.-P., Lima Sobrinho, R. and Sinninghe Damsté,
J. S.: Disentangling the origins of branched tetraether lipids and crenarchaeol in the lower Amazon River: Implications for
GDGT-based proxies, Limnol. Oceanogr., 58(1), 343–353, doi:10.4319/lo.2013.58.1.0343, 2013.
Zhang, X., Lohmann, G., Knorr, G. and Purcell, C.: Abrupt glacial climate shifts controlled by ice sheet changes. Nature 512,
290–294, DOI: 10.1038/nature13592, 2014. 740
Zhang, X., Lohmann, G., Knorr, G. and Xu, X. Different ocean states and transient characteristics in Last Glacial Maximum
simulations and implications for deglaciation. Clim. Past 9, 2319-2333, doi:10.5194/cp-9-2319-2013, 2013.
Zhu, C., Weijers, J. W. H., Wagner, T., Pan, J.-M., Chen, J.-F. and Pancost, R. D.: Sources and distributions of tetraether
lipids in surface sediments across a large river-dominated continental margin, Org. Geochem., 42(4), 376–386,
doi:10.1016/j.orggeochem.2011.02. 745
Figure captions
Figure 1. (A) Overview of Beringia and the N Pacific. Site SO201-2-12KL is marked by a red star. Circles represent sites
mentioned in the text. Black arrows indicate the surface circulation patterns of the N Pacific (e.g. Stabeno and Reed, 1994).
BLB = Bering Land Bridge, KR = Kankaren Range, R = River, EKC = East Kamchatka Current. P = Peninsula. L= Lake (B)
Map of the Kamchatka Peninsula and its major orographic units. CKD = Central Kamchatka Depression. 750
Figure 2. a) Concentrations of ƩbrGDGT of core 12KL. b) CBT/MBT’ derived MATifs from Kamchatka (this study). Black
pins represent the age control points from core 12KL (based on radiocarbon dating of planktonic foraminifera, Max et al.,
Clim. Past Discuss., doi:10.5194/cp-2016-21, 2016Manuscript under review for journal Clim. PastPublished: 6 April 2016c© Author(s) 2016. CC-BY 3.0 License.
35
2012). c) BIT-index values of core 12KL (Meyer et al., submitted). d) Titanium/Calcium ratios (Ti/Ca, XRF-scan core
12KL, Max et al., 2012). e) Mean July insolation at 65°N (Berger and Loutre, 1991). f) Atmospheric CO2 concentration
(EPICA dome C, Monnin et al., 2001). g) SST development in the marginal NW Pacific (site 12KL, Meyer et al., submitted). 755
h) SST evolution in the western Bering Sea (site 114KL, Meyer et al., submitted). i) NGRIP-δ18O (NGRIP, 2004) represents
climate change in the N Atlantic. j) Pollen-based temperature reconstructions from the CKD (after Dierksen et al., 2013).
Grey-shaded bars mark the HS1 and YD stadials.
Figure 3. Fractional abundances of all nine brGDGT in core 12KL, given in percentage relative to the amount of ƩbrGDGTs. 760
Figure 4. Comparison of proxy- and model-based inferences regarding glacial anomalies in temperature and atmospheric
circulation over the N Pacific and Beringia relative to present. (A) COSMOS-simulation for the SLP-anomaly over Beringia
and the N Pacific during the LGM (21 ka) relative to PI. Arrows represent the wind anomaly. Note that the model predicts a
northerly anomaly over Kamchatka. (B) COSMOS-simulation for the SAT-anomaly together with the wind-anomaly. (C) 765
Compilation of proxy based anomalies of summer air temperature in Beringia and of summer/autumn SST reconstructions in
the N Pacific for the LGM. Sites and corresponding references are given in the appendix, Table A1. Doted arrows sketch the
general summer anticyclone over the N Pacific, the NPH. Based MATifs, the NPH and associated southerly winds over the
subarctic NW Pacific were stronger than at present (represented by solid arrow).
Clim. Past Discuss., doi:10.5194/cp-2016-21, 2016Manuscript under review for journal Clim. PastPublished: 6 April 2016c© Author(s) 2016. CC-BY 3.0 License.
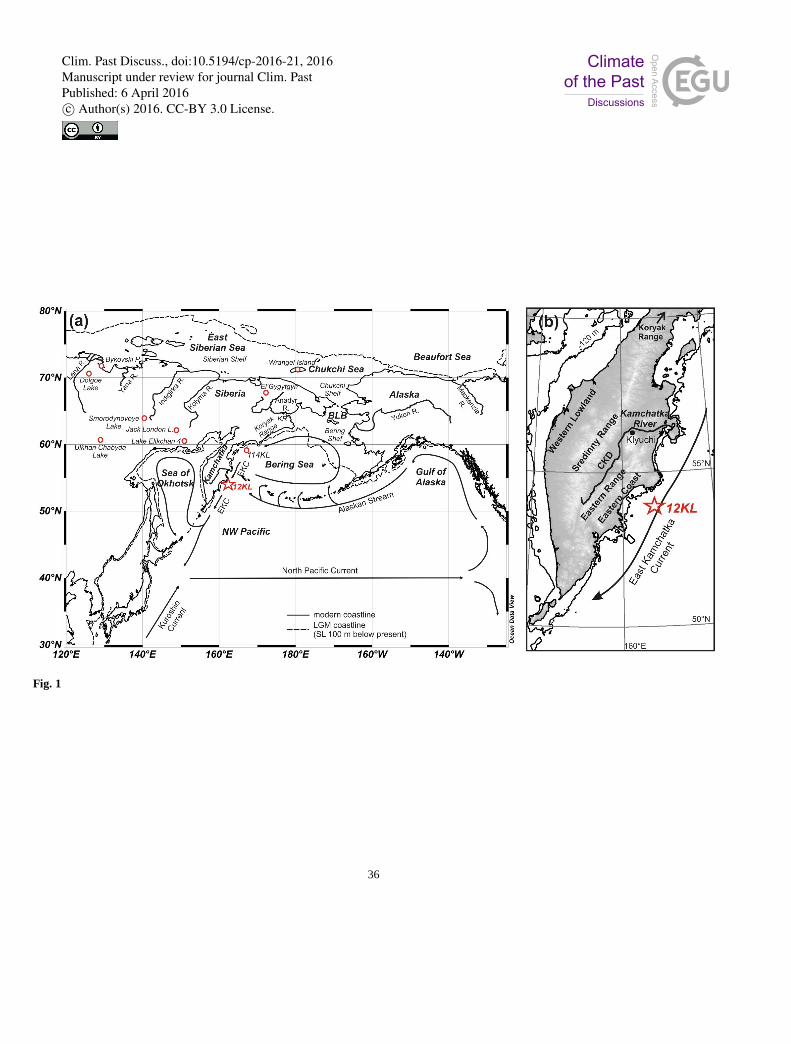
36
Fig. 1
Clim. Past Discuss., doi:10.5194/cp-2016-21, 2016Manuscript under review for journal Clim. PastPublished: 6 April 2016c© Author(s) 2016. CC-BY 3.0 License.
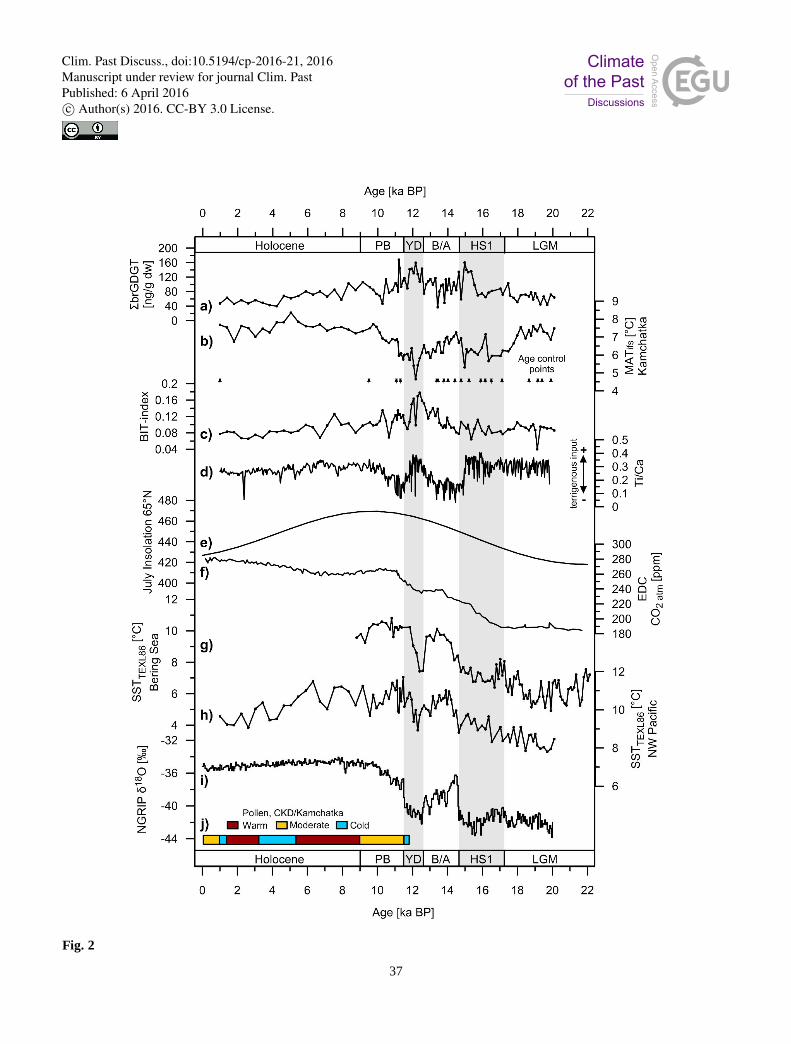
37
Fig. 2
Clim. Past Discuss., doi:10.5194/cp-2016-21, 2016Manuscript under review for journal Clim. PastPublished: 6 April 2016c© Author(s) 2016. CC-BY 3.0 License.
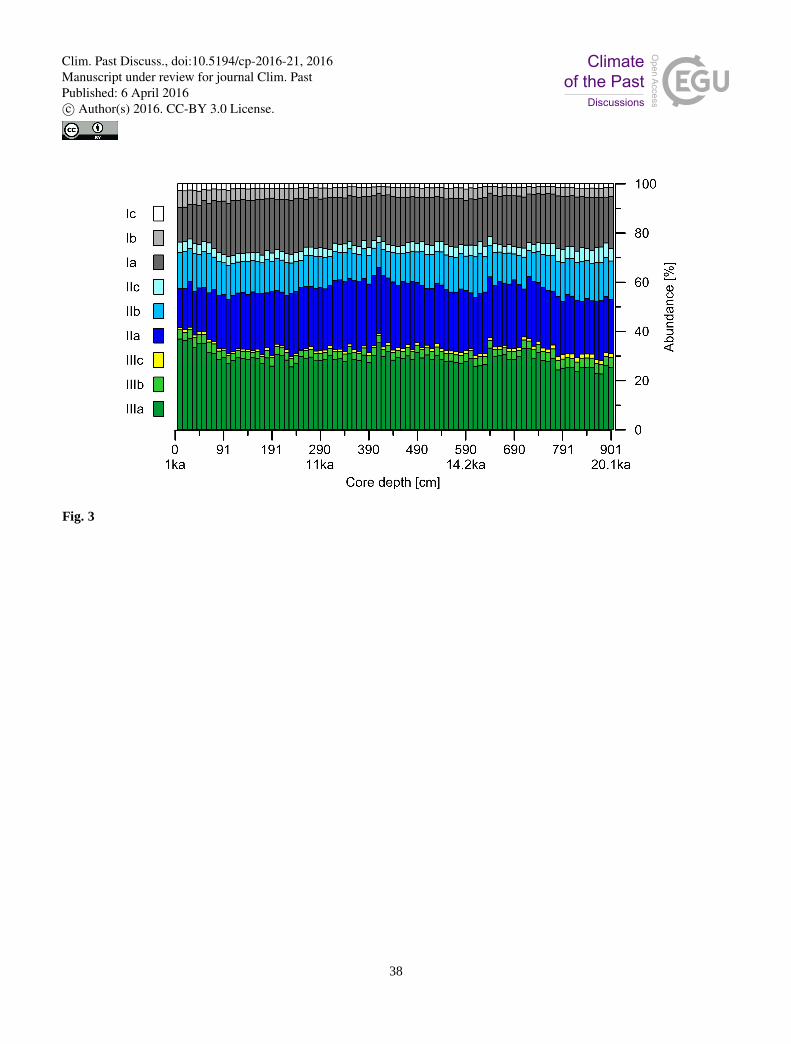
38
Fig. 3
Clim. Past Discuss., doi:10.5194/cp-2016-21, 2016Manuscript under review for journal Clim. PastPublished: 6 April 2016c© Author(s) 2016. CC-BY 3.0 License.
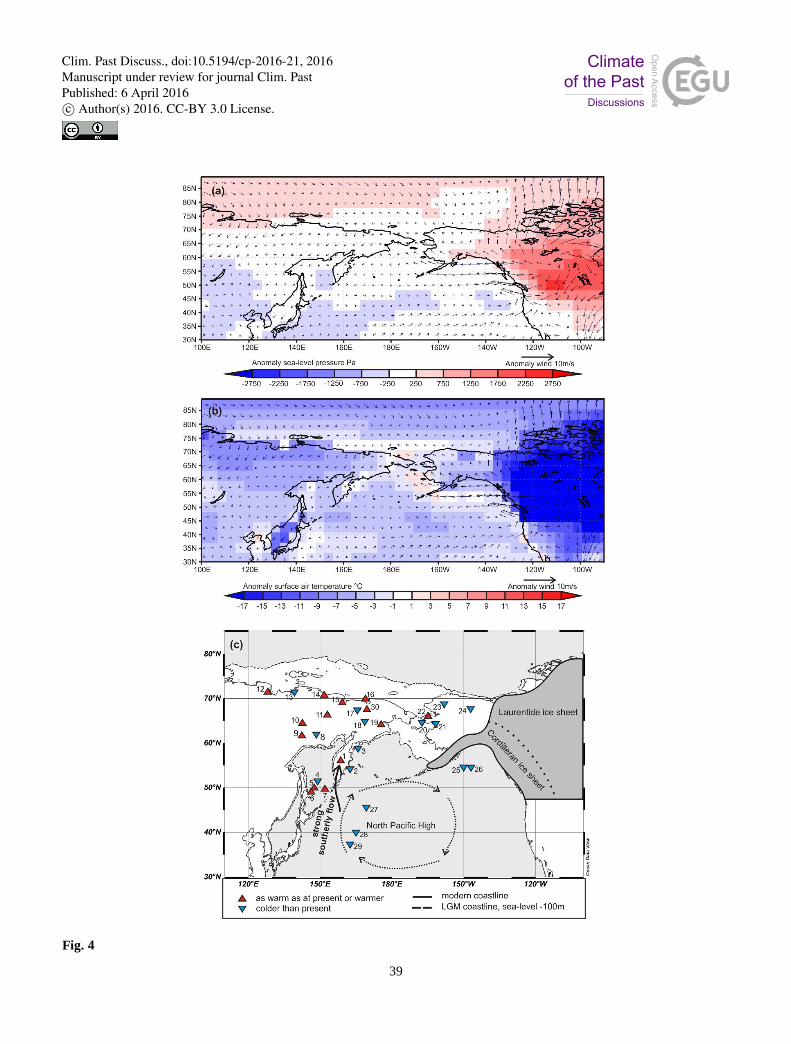
39
Fig. 4
Clim. Past Discuss., doi:10.5194/cp-2016-21, 2016Manuscript under review for journal Clim. PastPublished: 6 April 2016c© Author(s) 2016. CC-BY 3.0 License.
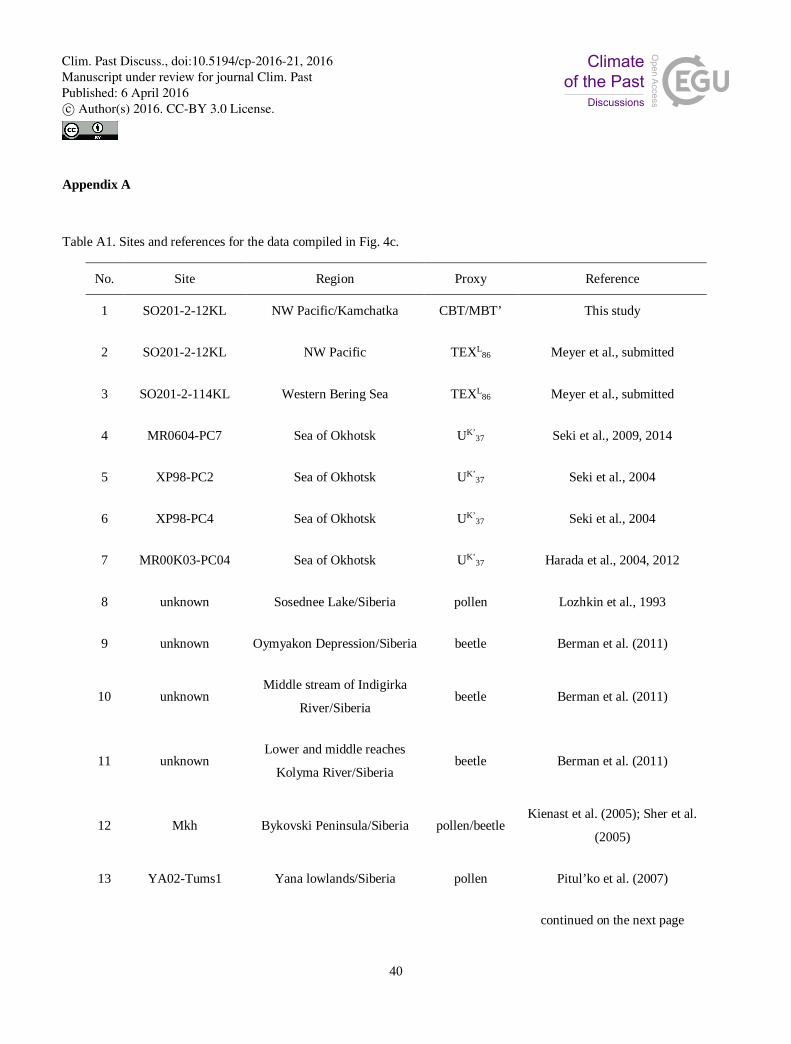
40
Appendix A
Table A1. Sites and references for the data compiled in Fig. 4c.
No. Site Region Proxy Reference
1 SO201-2-12KL NW Pacific/Kamchatka CBT/MBT’ This study
2 SO201-2-12KL NW Pacific TEXL86 Meyer et al., submitted
3 SO201-2-114KL Western Bering Sea TEXL86 Meyer et al., submitted
4 MR0604-PC7 Sea of Okhotsk UK’37 Seki et al., 2009, 2014
5 XP98-PC2 Sea of Okhotsk UK’37 Seki et al., 2004
6 XP98-PC4 Sea of Okhotsk UK’37 Seki et al., 2004
7 MR00K03-PC04 Sea of Okhotsk UK’37 Harada et al., 2004, 2012
8 unknown Sosednee Lake/Siberia pollen Lozhkin et al., 1993
9 unknown Oymyakon Depression/Siberia beetle Berman et al. (2011)
10 unknown Middle stream of Indigirka
River/Siberia beetle Berman et al. (2011)
11 unknown Lower and middle reaches
Kolyma River/Siberia beetle Berman et al. (2011)
12 Mkh Bykovski Peninsula/Siberia pollen/beetle Kienast et al. (2005); Sher et al.
(2005)
13 YA02-Tums1 Yana lowlands/Siberia pollen Pitul’ko et al. (2007)
continued on the next page
Clim. Past Discuss., doi:10.5194/cp-2016-21, 2016Manuscript under review for journal Clim. PastPublished: 6 April 2016c© Author(s) 2016. CC-BY 3.0 License.
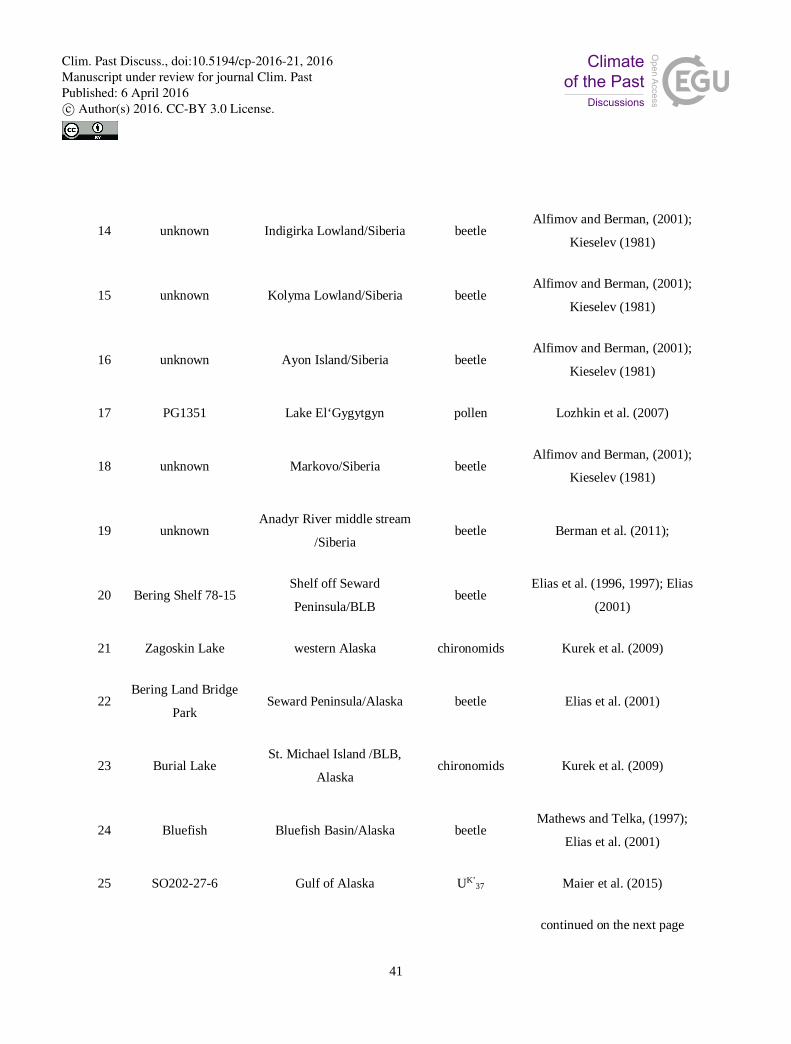
41
14 unknown Indigirka Lowland/Siberia beetle Alfimov and Berman, (2001);
Kieselev (1981)
15 unknown Kolyma Lowland/Siberia beetle Alfimov and Berman, (2001);
Kieselev (1981)
16 unknown Ayon Island/Siberia beetle Alfimov and Berman, (2001);
Kieselev (1981)
17 PG1351 Lake El‘Gygytgyn pollen Lozhkin et al. (2007)
18 unknown Markovo/Siberia beetle Alfimov and Berman, (2001);
Kieselev (1981)
19 unknown Anadyr River middle stream
/Siberia beetle Berman et al. (2011);
20 Bering Shelf 78-15 Shelf off Seward
Peninsula/BLB beetle
Elias et al. (1996, 1997); Elias
(2001)
21 Zagoskin Lake western Alaska chironomids Kurek et al. (2009)
22 Bering Land Bridge
Park Seward Peninsula/Alaska beetle Elias et al. (2001)
23 Burial Lake St. Michael Island /BLB,
Alaska chironomids Kurek et al. (2009)
24 Bluefish Bluefish Basin/Alaska beetle Mathews and Telka, (1997);
Elias et al. (2001)
25 SO202-27-6 Gulf of Alaska UK’37 Maier et al. (2015)
continued on the next page
Clim. Past Discuss., doi:10.5194/cp-2016-21, 2016Manuscript under review for journal Clim. PastPublished: 6 April 2016c© Author(s) 2016. CC-BY 3.0 License.
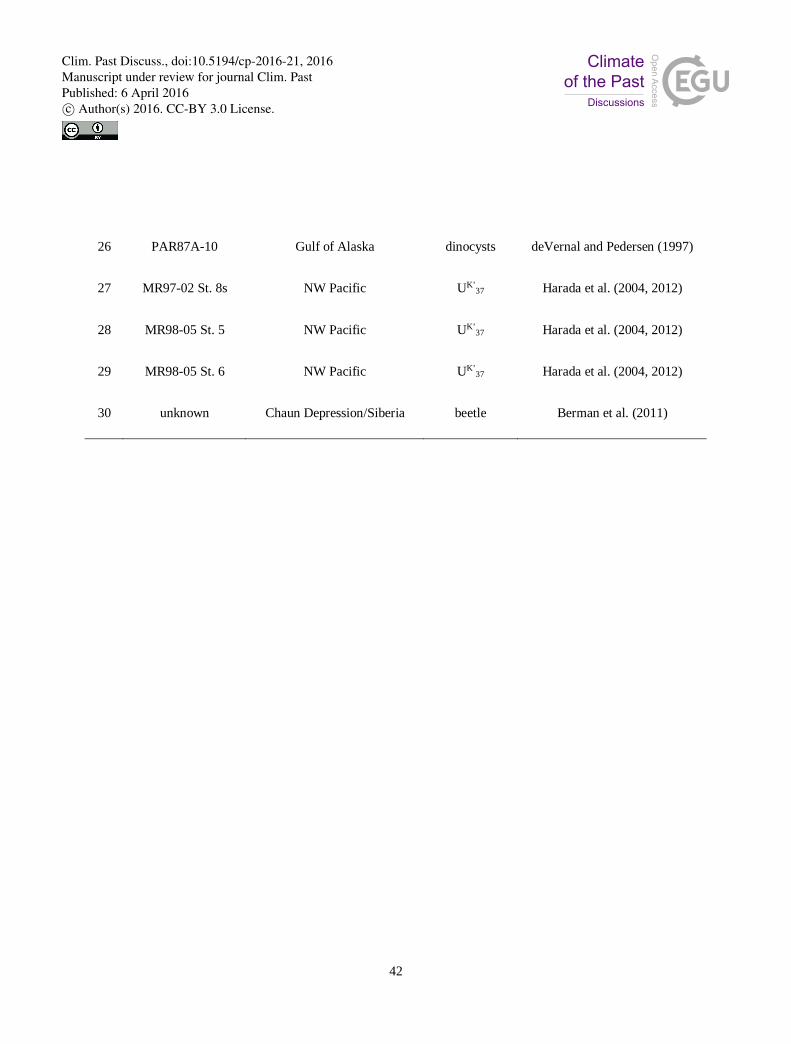
42
26 PAR87A-10 Gulf of Alaska dinocysts deVernal and Pedersen (1997)
27 MR97-02 St. 8s NW Pacific UK’37 Harada et al. (2004, 2012)
28 MR98-05 St. 5 NW Pacific UK’37 Harada et al. (2004, 2012)
29 MR98-05 St. 6 NW Pacific UK’37 Harada et al. (2004, 2012)
30 unknown Chaun Depression/Siberia beetle Berman et al. (2011)
Clim. Past Discuss., doi:10.5194/cp-2016-21, 2016Manuscript under review for journal Clim. PastPublished: 6 April 2016c© Author(s) 2016. CC-BY 3.0 License.