summary integrated business plan 2012-2017 · bridgewater summary integrated business plan...
TRANSCRIPT
Summary IntegratedBusiness Plan2012-2017
Bridgewater Community HealthcareNHS Trust

Comments
If you have any comments on this document or require it in another language or format please contact 01942 482655 or email [email protected].
3
Contents
Chairman and Chief Executive’s Introduction 4
About Us 5
Mission, Vision and Values 6
Key Facts 8
Health Profiles of our Communities 9
Our Services 13
NHS Foundation Trust status 15
Market Assessment 16
Building the Bridgewater Strategy 18
The Bridgewater Offer 20
Service Developments 21
Performance 27
Financial Performance 32
Risk 34
Cost Improvements and Quality of Care 37
Workforce and Leadership 41
Our Board 43
Page
Bridgewater Summary Integrated Business Plan 2012-2017
Bridgewater Summary Integrated Business Plan 2012-20174
Chairman and Chief Executive’sIntroduction
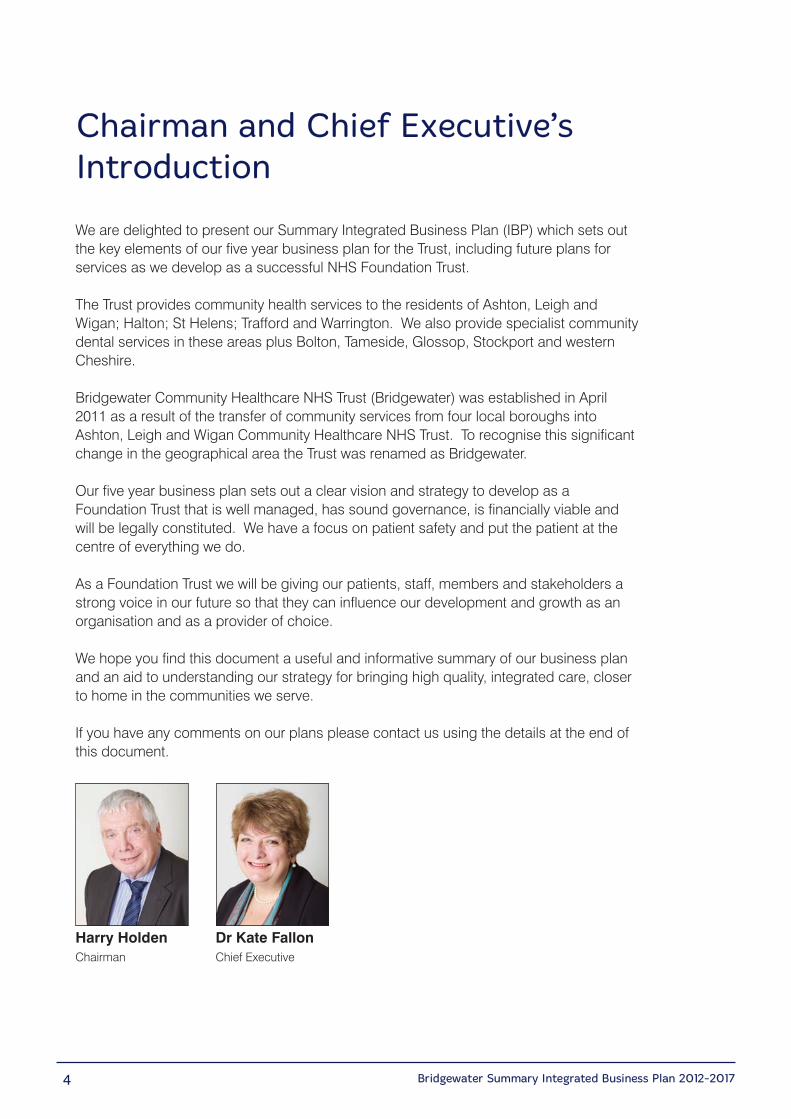
We are delighted to present our Summary Integrated Business Plan (IBP) which sets outthe key elements of our five year business plan for the Trust, including future plans forservices as we develop as a successful NHS Foundation Trust.
The Trust provides community health services to the residents of Ashton, Leigh andWigan; Halton; St Helens; Trafford and Warrington. We also provide specialist communitydental services in these areas plus Bolton, Tameside, Glossop, Stockport and westernCheshire.
Bridgewater Community Healthcare NHS Trust (Bridgewater) was established in April2011 as a result of the transfer of community services from four local boroughs intoAshton, Leigh and Wigan Community Healthcare NHS Trust. To recognise this significantchange in the geographical area the Trust was renamed as Bridgewater.
Our five year business plan sets out a clear vision and strategy to develop as aFoundation Trust that is well managed, has sound governance, is financially viable andwill be legally constituted. We have a focus on patient safety and put the patient at thecentre of everything we do.
As a Foundation Trust we will be giving our patients, staff, members and stakeholders astrong voice in our future so that they can influence our development and growth as anorganisation and as a provider of choice.
We hope you find this document a useful and informative summary of our business planand an aid to understanding our strategy for bringing high quality, integrated care, closerto home in the communities we serve.
If you have any comments on our plans please contact us using the details at the end ofthis document.
Harry Holden Dr Kate FallonChairman Chief Executive

Bridgewater Summary Integrated Business Plan 2012-2017 5
About Us
Bridgewater was developed as a platform for change in the health and social caredelivery system. The majority of our services are delivered in patients’ homes or atlocations close to where they live, such as clinics, health centres, GP practices,community centres and schools. As a provider of both mainstream and specialist care,our role is to focus on providing cost effective NHS care, keeping people out of hospitaland supporting vulnerable people throughout their lives.
As a dedicated provider of community services, our strategy is to bring more care closerto home. This means providing a wider range of services in community settings to keeppeople healthier for longer and developing more specialist services to support people tolive independently at home.
Bridgewater Summary Integrated Business Plan 2012-20176
Our Mission, Vision and ValuesOur mission is:
To improve local health and promote wellbeing in the communities we serve
Our vision is:
To work closely with local people and partners to promote good health and to bea leading provider of excellent community healthcare services in the North West
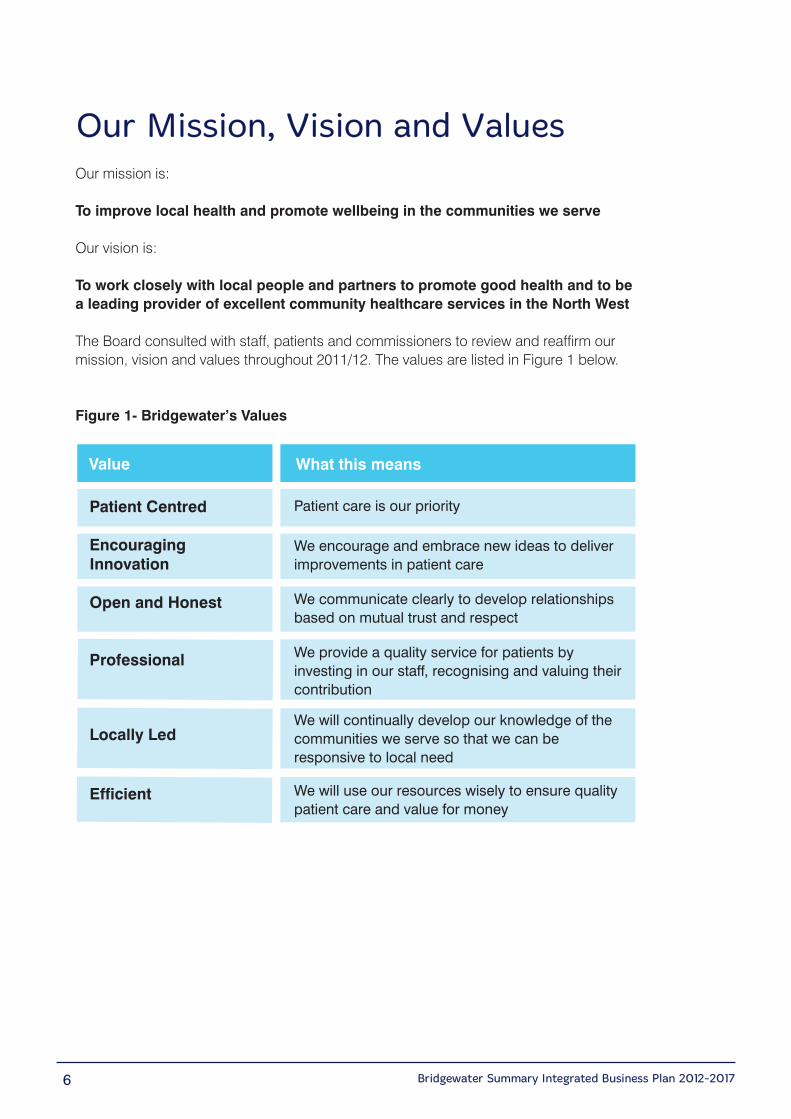
The Board consulted with staff, patients and commissioners to review and reaffirm ourmission, vision and values throughout 2011/12. The values are listed in Figure 1 below.
Figure 1- Bridgewater’s Values
Value
Patient Centred
EncouragingInnovation
Open and Honest
Professional
Locally Led
Efficient
What this means
Patient care is our priority
We encourage and embrace new ideas to deliverimprovements in patient care
We communicate clearly to develop relationshipsbased on mutual trust and respect
We provide a quality service for patients by investing in our staff, recognising and valuing theircontribution
We will continually develop our knowledge of thecommunities we serve so that we can be responsive to local need
We will use our resources wisely to ensure qualitypatient care and value for money
Bridgewater Summary Integrated Business Plan 2012-2017 7
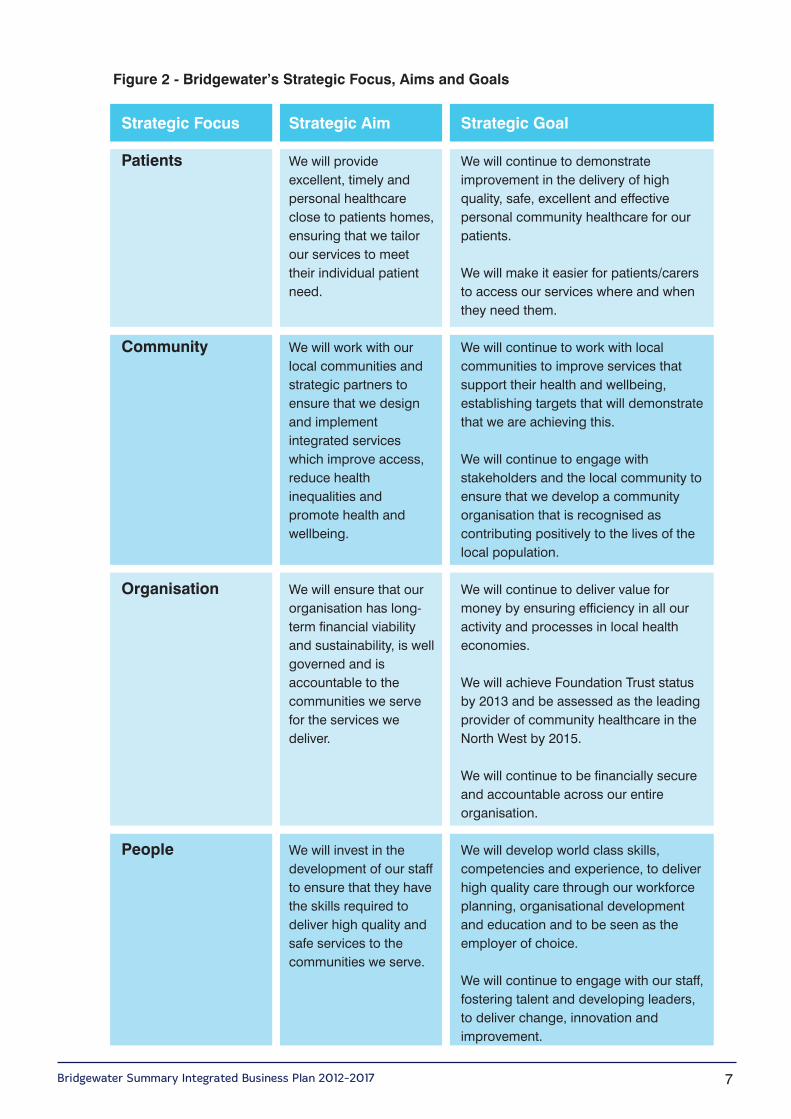
Figure 2 - Bridgewater’s Strategic Focus, Aims and Goals
Strategic Focus
Patients
Community
Organisation
People
Strategic Aim
We will provideexcellent, timely andpersonal healthcareclose to patients homes,ensuring that we tailorour services to meettheir individual patientneed.
We will work with ourlocal communities andstrategic partners toensure that we designand implementintegrated serviceswhich improve access,reduce healthinequalities andpromote health andwellbeing.
We will ensure that ourorganisation has long-term financial viabilityand sustainability, is wellgoverned and isaccountable to thecommunities we servefor the services wedeliver.
We will invest in thedevelopment of our staffto ensure that they havethe skills required todeliver high quality andsafe services to thecommunities we serve.
Strategic Goal
We will continue to demonstrateimprovement in the delivery of highquality, safe, excellent and effectivepersonal community healthcare for ourpatients.
We will make it easier for patients/carersto access our services where and whenthey need them.
We will continue to work with localcommunities to improve services thatsupport their health and wellbeing,establishing targets that will demonstratethat we are achieving this.
We will continue to engage withstakeholders and the local community toensure that we develop a communityorganisation that is recognised ascontributing positively to the lives of thelocal population.
We will continue to deliver value formoney by ensuring efficiency in all ouractivity and processes in local healtheconomies.
We will achieve Foundation Trust statusby 2013 and be assessed as the leadingprovider of community healthcare in theNorth West by 2015.
We will continue to be financially secureand accountable across our entireorganisation.
We will develop world class skills,competencies and experience, to deliverhigh quality care through our workforceplanning, organisational developmentand education and to be seen as theemployer of choice.
We will continue to engage with our staff,fostering talent and developing leaders,to deliver change, innovation andimprovement.
Bridgewater Summary Integrated Business Plan 2012-20178
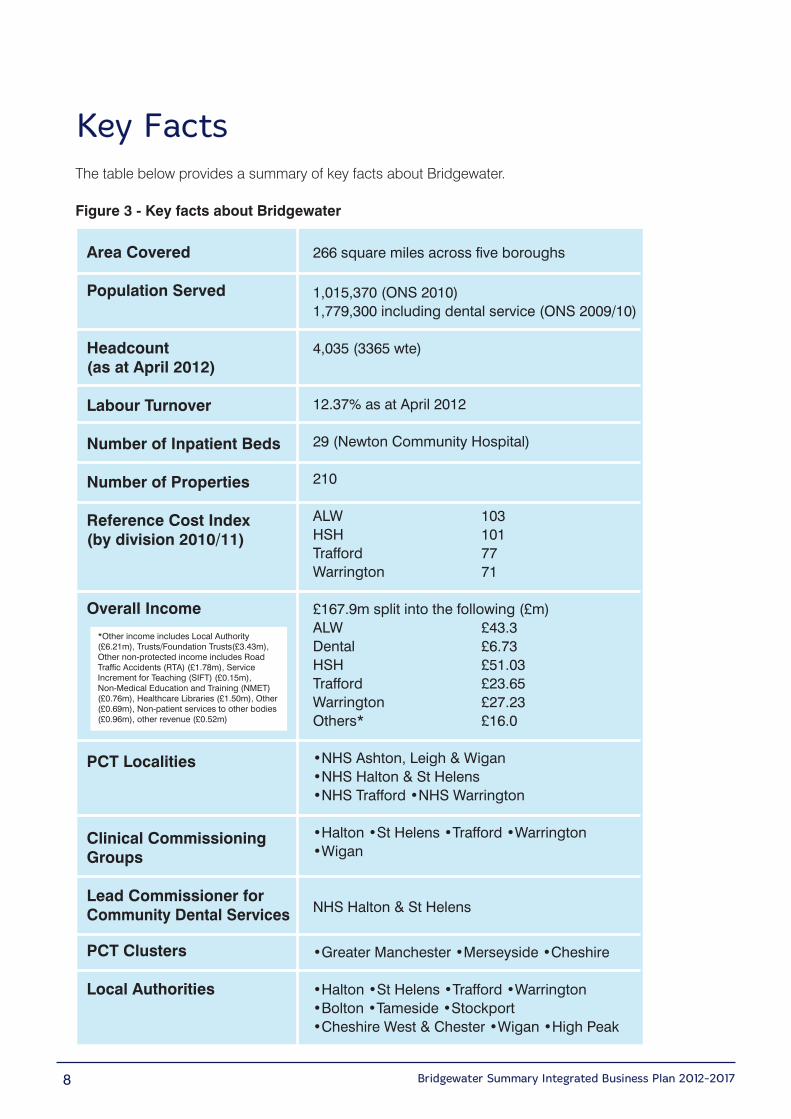
Key FactsThe table below provides a summary of key facts about Bridgewater.
Figure 3 - Key facts about Bridgewater
Area Covered
Population Served
Headcount(as at April 2012)
Labour Turnover
Number of Inpatient Beds
Number of Properties
Reference Cost Index(by division 2010/11)
Overall Income
PCT Localities
Clinical CommissioningGroups
Lead Commissioner forCommunity Dental Services
PCT Clusters
Local Authorities
266 square miles across five boroughs
1,015,370 (ONS 2010) 1,779,300 including dental service (ONS 2009/10)
4,035 (3365 wte)
12.37% as at April 2012
29 (Newton Community Hospital)
210
ALW 103HSH 101Trafford 77Warrington 71
£167.9m split into the following (£m)ALW £43.3Dental £6.73HSH £51.03Trafford £23.65Warrington £27.23Others* £16.0
•NHS Ashton, Leigh & Wigan•NHS Halton & St Helens•NHS Trafford •NHS Warrington
•Halton •St Helens •Trafford •Warrington•Wigan
NHS Halton & St Helens
•Greater Manchester •Merseyside •Cheshire
•Halton •St Helens •Trafford •Warrington•Bolton •Tameside •Stockport •Cheshire West & Chester •Wigan •High Peak
*Other income includes Local Authority(£6.21m), Trusts/Foundation Trusts(£3.43m),Other non-protected income includes RoadTraffic Accidents (RTA) (£1.78m), ServiceIncrement for Teaching (SIFT) (£0.15m), Non-Medical Education and Training (NMET)(£0.76m), Healthcare Libraries (£1.50m), Other(£0.69m), Non-patient services to other bodies(£0.96m), other revenue (£0.52m)
Bridgewater Summary Integrated Business Plan 2012-2017
Health Profiles of our Communities
The Trust operates across a large, complex, health and social care footprint, addressingthe needs of populations. The geography of Bridgewater includes some of the mostdeprived communities in England with the associated health and lifestyle challenges.This means there are significant variations in morbidity and mortality between the mostaffluent and deprived communities served by the Trust.
The population is ageing, so demand on our services will continue to grow during aperiod of unprecedented financial pressures. Across our local health economies, thisnecessitates a new model for the delivery of more care out of hospital, in partnership withGeneral Practitioner (GP) colleagues and other stakeholders, to ensure patients receive aseamless service.
The health profiles of each of our boroughs are summarised as follows: -
Wigan Health Profile
• The health of the people in the borough of Wigan is generally worse than the England average. Deprivation is higher than average and about 12,100 children live inpoverty. Life expectancy for both men and women is lower than the England average.
• Life expectancy is 11.1 years lower for men and 8.0 years lower for women in the most deprived areas of Wigan than in the least deprived areas.
• Over the last 10 years, all-cause mortality rates have fallen. Early death rates from heart disease and stroke have fallen, but remain worse than the England average.
• 19.3% of Year Six children are classified as obese. Levels of teenage pregnancy, breast feeding initiation and smoking in pregnancy are worse than the Englandaverage.
• Estimated levels of adult “healthy eating”, smoking and obesity are worse than the England average. Rates of hip fractures, smoking-related deaths and hospital staysfor alcohol-related harm are higher than average. Rates of sexually transmittedinfections and road injuries and deaths are better than the national average.
• Priorities in the borough include reducing avoidable premature deaths from cardiovascular disease (CVD) and cancer and reducing teenage pregnancyrates.
9
Halton Health Profile
• The health of people in Halton is generally worse than the England average. Deprivation is higher than average and about 7,000 children live in poverty. Life expectancy for both men and women is lower than the England average.
• Life expectancy is 11.1 years lower for men and 10.8 years lower for women in the most deprived areas of Halton than in the least deprived areas.
• Over the last 10 years, all-cause mortality rates have fallen. The early death rates from heart disease and stroke have fallen, but remain worse than the England average.
• 23.8% of Year 6 children are classified as obese, higher than the average for England. Levels of teenage pregnancy, breast feeding initiation and smoking in pregnancy areworse than the England average.
• Estimated levels of adult “healthy eating” and smoking are worse than the England average. Rates of sexually transmitted infections, smoking related deaths and hospitalstays for alcohol related harm are worse than the England average. The rate ofstatutory homelessness is lower than average.
• Priorities for Halton include smoking, alcohol, mental health, obesity and breastfeeding.
St Helens Health Profile
• The health of the people in St Helens is generally worse than the England average. Deprivation is higher than average and about 8,600 children live in poverty. Life expectancy for both men and women is lower than the England average.
• Life expectancy is 11.5 years lower for men and 8.4 years lower for women in the mostdeprived areas of St Helens than in the least deprived areas.
• Over the last 10 years, all-cause mortality rates have fallen. Early death rates from cancer and from heart disease and stroke have fallen, but remain worse than theEngland average.
• 21.9% of Year Six children are classified as obese, higher than the average for England. Levels of teenage pregnancy, General Certificate of Secondary Education(GCSE) attainment, alcohol-specific hospital stays among those under 18, breastfeeding initiation and smoking in pregnancy are worse than the England average.
• The estimated levels of adult “healthy eating” and smoking are worse than the England average. Rates of sexually transmitted infections, smoking related deaths and hospitalstays for alcohol related harm are worse than the England average. The rate of violentcrime is lower than average.
• Priorities for St Helens include smoking, alcohol and mental health, obesity and breastfeeding.
10 Bridgewater Summary Integrated Business Plan 2012-2017
2Trafford Health Profile
• The health of the people in Trafford is generally better than the England average. Deprivation is lower than average, however about 6,900 children live in poverty. Life expectancy for women is higher than the England average.
• Life expectancy is 10.6 years lower for men and 5.7 years lower for women in the most deprived areas of Trafford than in the least deprived areas.
• Over the last 10 years, all-cause mortality rates have fallen. Early death rates from cancer and from heart disease and stroke have fallen and are similar to the Englandaverage.
• 16.4% of Year Six children are classified as obese, lower than the England average. Level of teenage pregnancy, GCSE attainment, breast feeding initiation and smokingin pregnancy are better than the England average.
• The estimated level of adult obesity is better than the England average. The rate of hospital stays for alcohol related harm is worse than the England average. Rates of hipfracture, sexually transmitted infections and road injuries and deaths are better thanthe England average.
• Priorities for Trafford include tobacco and smoking, alcohol, obesity and activelifestyle.
11Bridgewater Summary Integrated Business Plan 2012-2017
Bridgewater Summary Integrated Business Plan 2012-201712
Warrington Health Profile
• The health of the people in Warrington is mixed compared to the England average. Deprivation is lower than average, however about 5,700 children live in poverty. Lifeexpectancy for both men and women is lower than the England average.
• Life expectancy is 9.7 years lower for men and 7.0 years lower for women in the most deprived areas of Warrington compared to the least deprived areas.
• Over the last 10 years, all-cause mortality rates have fallen. Early death rates from cancer and from heart disease and stroke have fallen, but the latter remains worsethan the England average.
• 17.5% of Year Six children are classified as obese. Levels of alcohol-specific hospital stays among those under 18 and breast feeding initiation are worse than the Englandaverage. The level of GCSE attainment is better than the England average.
• An estimated 19.0% of adults smoke and 22.9% are obese. Rates of road injuries and deaths, smoking-related deaths and hospital stays for alcohol-related harm are worsethan the England average. The rate of sexually transmitted infections is better than theEngland average.
• Priorities in Warrington include tackling health inequalities, reducing levels of CVD and reducing harm caused by alcohol.
It is clear from the information above that the major health issues associated withdeprivation, unhealthy behaviours and lifestyle choices are prevalent within each of ourboroughs. The impact of these problems is different in each locality, each neighbourhoodor each household. As a provider whose staff are in contact with people within their owncommunities on a day-to-day basis, our services must understand the local issues andrespond to these health needs at each level.
Bridgewater Summary Integrated Business Plan 2012-2017 13
2
Our Services
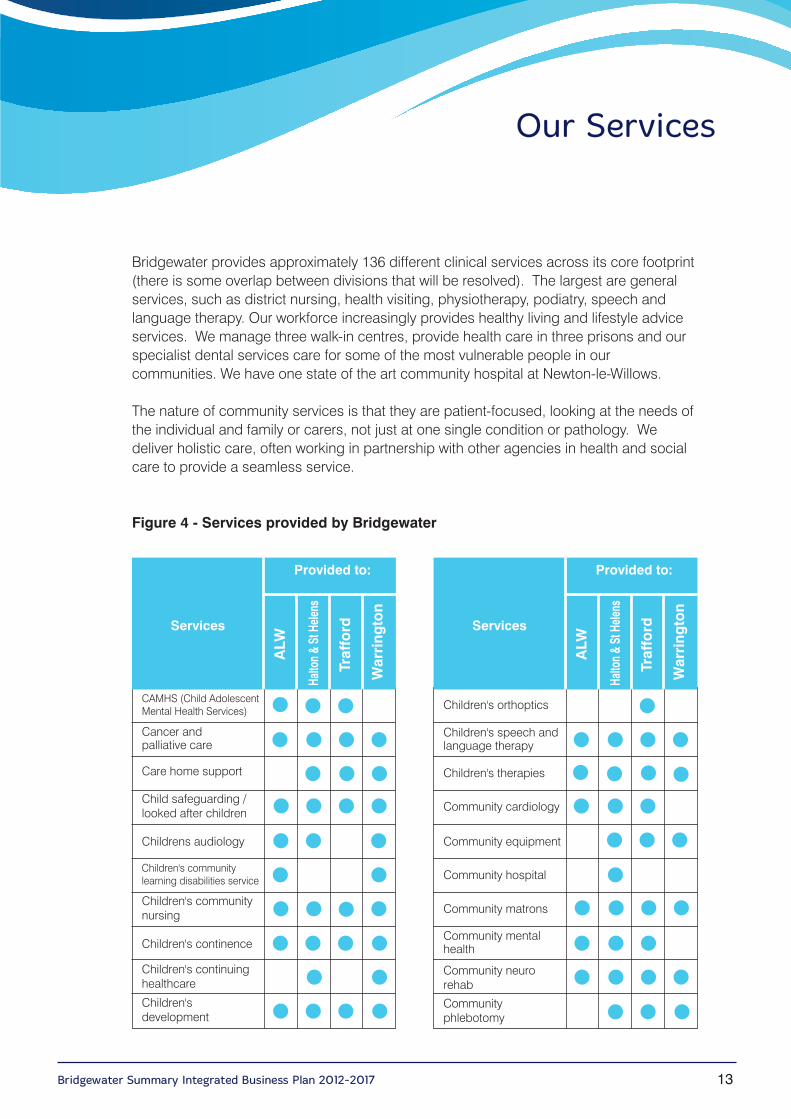
Bridgewater provides approximately 136 different clinical services across its core footprint(there is some overlap between divisions that will be resolved). The largest are generalservices, such as district nursing, health visiting, physiotherapy, podiatry, speech andlanguage therapy. Our workforce increasingly provides healthy living and lifestyle adviceservices. We manage three walk-in centres, provide health care in three prisons and ourspecialist dental services care for some of the most vulnerable people in ourcommunities. We have one state of the art community hospital at Newton-le-Willows.
The nature of community services is that they are patient-focused, looking at the needs ofthe individual and family or carers, not just at one single condition or pathology. Wedeliver holistic care, often working in partnership with other agencies in health and socialcare to provide a seamless service.
Figure 4 - Services provided by Bridgewater
Provided to:
Services
ALW
Halto
n & St Helen
s
Trafford
Warring
ton
CAMHS (Child AdolescentMental Health Services)
Cancer and palliative care
Care home support
Child safeguarding /looked after children
Childrens audiology
Children's communitylearning disabilities service
Children's communitynursing
Children's continence
Children's continuinghealthcare
Children'sdevelopment
Provided to:
Services
ALW
Halto
n & St Helen
s
Trafford
Warring
ton
Children's orthoptics
Children's speech andlanguage therapy
Children's therapies
Community cardiology
Community equipment
Community hospital
Community matrons
Community mentalhealth
Community neurorehab
Communityphlebotomy
Bridgewater Summary Integrated Business Plan 2012-201714
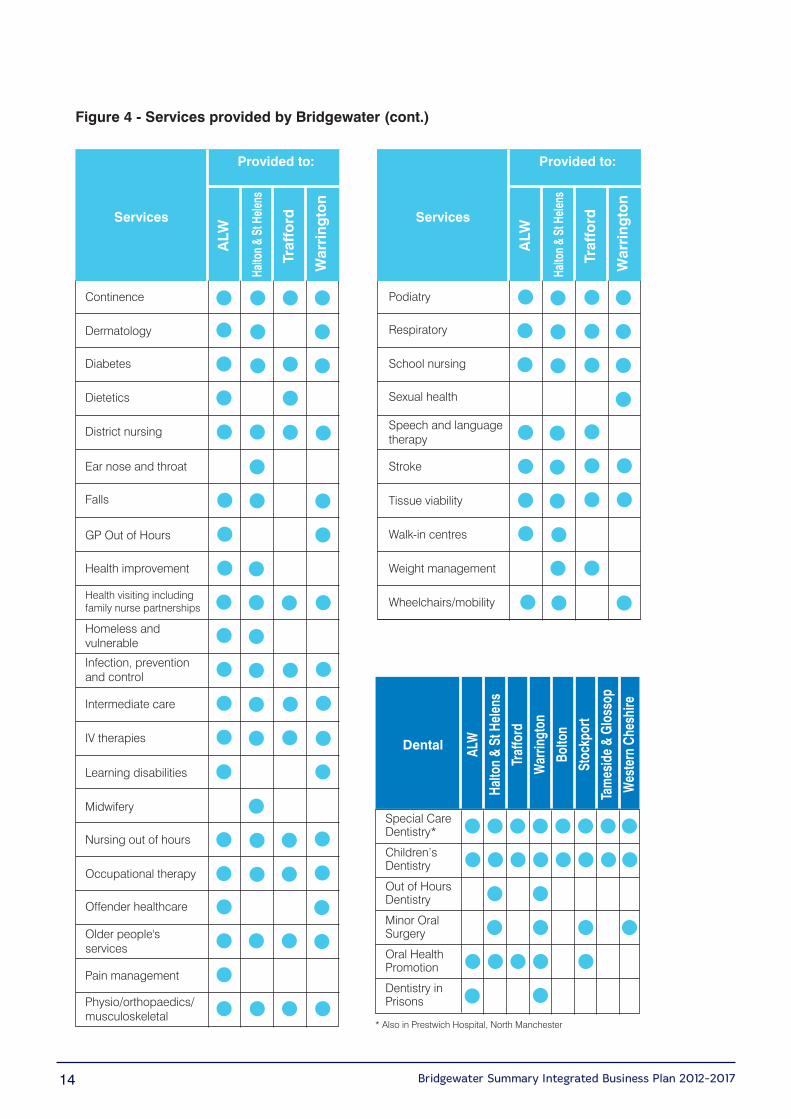
Figure 4 - Services provided by Bridgewater (cont.)
Provided to:
ServicesALW
Halto
n & St Helen
s
Trafford
Warring
ton
Continence
Dermatology
Diabetes
Dietetics
District nursing
Ear nose and throat
Falls
GP Out of Hours
Health improvement
Health visiting includingfamily nurse partnerships
Homeless andvulnerable
Infection, preventionand control
Intermediate care
IV therapies
Learning disabilities
Midwifery
Nursing out of hours
Occupational therapy
Offender healthcare
Older people'sservices
Pain management
Physio/orthopaedics/musculoskeletal
Provided to:
Services
ALW
Halto
n & St Helen
s
Trafford
Warring
ton
Podiatry
Respiratory
School nursing
Sexual health
Speech and languagetherapy
Stroke
Tissue viability
Walk-in centres
Weight management
Wheelchairs/mobility
Dental ALW
Halto
n & St Helen
s
Trafford
Warrin
gton
Bolto
n
Stoc
kport
Tames
ide & Glossop
Wes
tern Che
shire
Special CareDentistry*
Children’sDentistry
Out of HoursDentistry
Minor OralSurgery
Oral HealthPromotion
Dentistry inPrisons
* Also in Prestwich Hospital, North Manchester
Bridgewater Summary Integrated Business Plan 2012-2017 15
Clinical Networks
In order to support service development and delivery, we have established ClinicalNetworks to allow healthcare professionals working in the same discipline but in differentlocalities to work together for mutual patient and professional benefit. The focus of thesegroups is developing clinical leadership, service improvements and pathway redesignwhich ensures the skills and experiences available across the Trust are maximised. Thesix clinical networks that have been established are: Urgent Care, Children’s Services,Specialist Services, Offender Health, Long Term Conditions and Health and Wellbeing(including dental).
NHS Foundation Trust StatusBridgewater aims to become a Foundation Trust during 2013 and our ambitions areunderpinned by a commitment to engage and involve patients, staff and partners in ourplans for the future.
As part of our application to become a Foundation Trust we carried out a full publicconsultation in early 2012. The results of this confirmed support for our Foundation Trustplans.
The Foundation Trust model, with a wide local membership and a Council of Governors,provides an obvious strategic fit with the culture of a community trust.
Achieving Foundation Trust status will provide the following benefits: -
• Local decision making as opposed to decisions dictated by central government.
• We will have members (patients, local people and staff) who will be informed about developments within the Trust and have the opportunity to influence decisions aboutservices and the direction of the Trust.
• Public and staff members will elect fellow members to serve on the Council of Governors, who will represent their views at a senior level within the Trust.
• The Council of Governors will consist of 33 governors – 17 governors elected by public members (patients and local people); nine governors elected by staff and sevenpartner appointed governors.
• The Council of Governors will hold the Board of Directors to account on behalf of the community that the Trust serves and is responsible for the appointment of theChairman and Non-Executive Directors. In addition, the Council of Governorsapproves the appointment of the Chief Executive.
Bridgewater Summary Integrated Business Plan 2012-201716
• Through our Foundation Trust members and governors, we will ensure that we are more accountable to our local communities and our staff. We will engage ourmembers and governors in service redesign, performance reviews and on-goingservice development and challenge sessions.
• As a Foundation Trust we will ensure that we reinvest surpluses in the design and implementation of new and innovative services which ensure that patients are caredfor in a safe way in a community setting.
• We will be independently regulated by Monitor.
Achievement of Foundation Trust status will enhance our status within our localcommunity and we will use this to recruit and retain high quality staff. We will use ourfinancial freedoms to ensure that we reinvest in service development, organisational andstaff development.
We will ensure that we use our brand as an NHS Foundation Trust to develop strategicservice delivery partnerships locally. We will build upon our brand to support ourcommercial strategy of organic service growth as a premier provider of local communityservices.
The rigour of the Monitor compliance framework is welcomed by the Board and staff whoare keen to demonstrate the improved health outcomes and service experience ourpatients receive, as well as the efficiency and value for money we provide forcommissioners.
Market AssessmentBridgewater operates in a complex health and social care market where many of ourpartners are also our competitors. This is equally applicable across secondary care,primary care, mental health services and some elements of social care provision.
The commissioner landscape is changing rapidly, with the relationship between the rolesof the Clinical Commissioning Groups (CCGs), National Commissioning Board and localauthority commissioning arrangements still to be fully established. Working as we doacross five local Boroughs (plus the additional five areas covered by the dental network),our assessment of the market takes into account the intentions and plans of five mainCCGs, three primary care trust (PCT) clusters and five local authorities, each of which isfunctioning in the context of its own Joint Strategic Needs Assessment (JSNA).
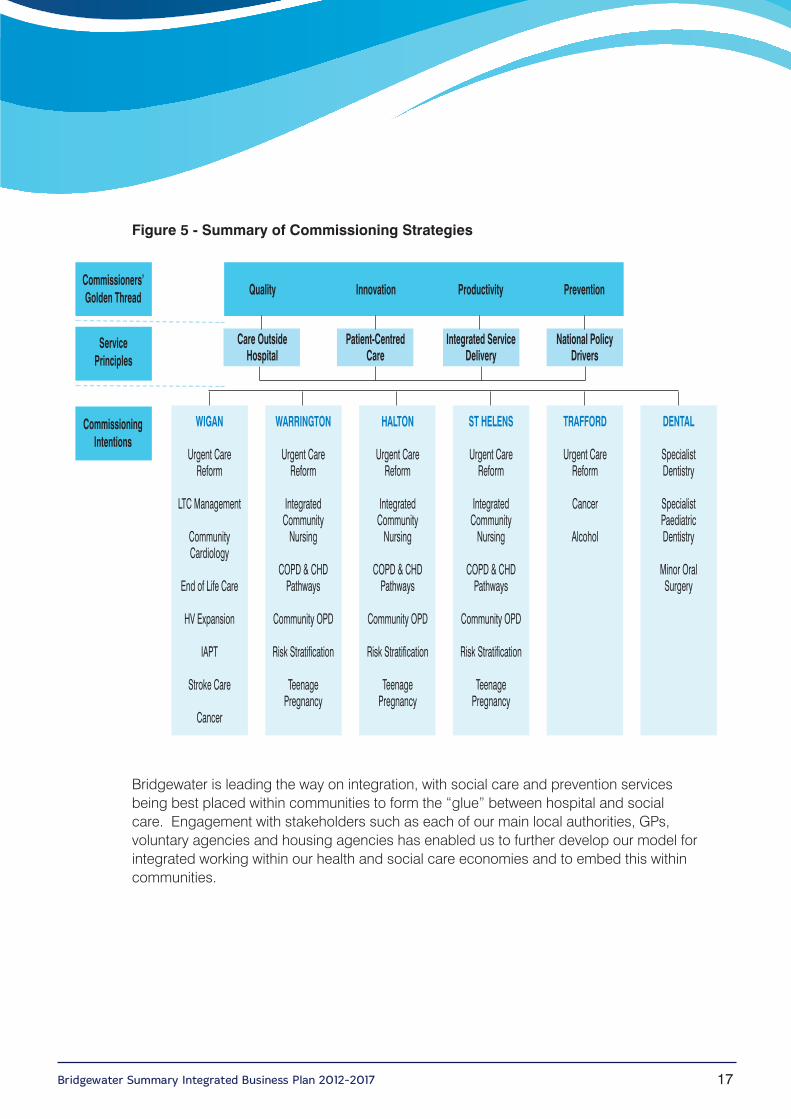
Our commissioners’ intentions are summarised in the diagram opposite:-
Bridgewater Summary Integrated Business Plan 2012-2017 17
2
Bridgewater is leading the way on integration, with social care and prevention servicesbeing best placed within communities to form the “glue” between hospital and socialcare. Engagement with stakeholders such as each of our main local authorities, GPs,voluntary agencies and housing agencies has enabled us to further develop our model forintegrated working within our health and social care economies and to embed this withincommunities.
Figure 5 - Summary of Commissioning Strategies
Commissioners’Golden Thread Quality Innovation Productivity Prevention
Service Principles
Care OutsideHospital
Patient-CentredCare
Integrated ServiceDelivery
National PolicyDrivers
CommissioningIntentions
WIGAN
Urgent CareReform
LTC Management
CommunityCardiology
End of Life Care
HV Expansion
IAPT
Stroke Care
Cancer
WARRINGTON
Urgent CareReform
IntegratedCommunityNursing
COPD & CHDPathways
Community OPD
Risk Stratification
TeenagePregnancy
HALTON
Urgent CareReform
IntegratedCommunityNursing
COPD & CHDPathways
Community OPD
Risk Stratification
TeenagePregnancy
ST HELENS
Urgent CareReform
IntegratedCommunityNursing
COPD & CHDPathways
Community OPD
Risk Stratification
TeenagePregnancy
TRAFFORD
Urgent CareReform
Cancer
Alcohol
DENTAL
SpecialistDentistry
SpecialistPaediatricDentistry
Minor OralSurgery
Bridgewater Summary Integrated Business Plan 2012-201718
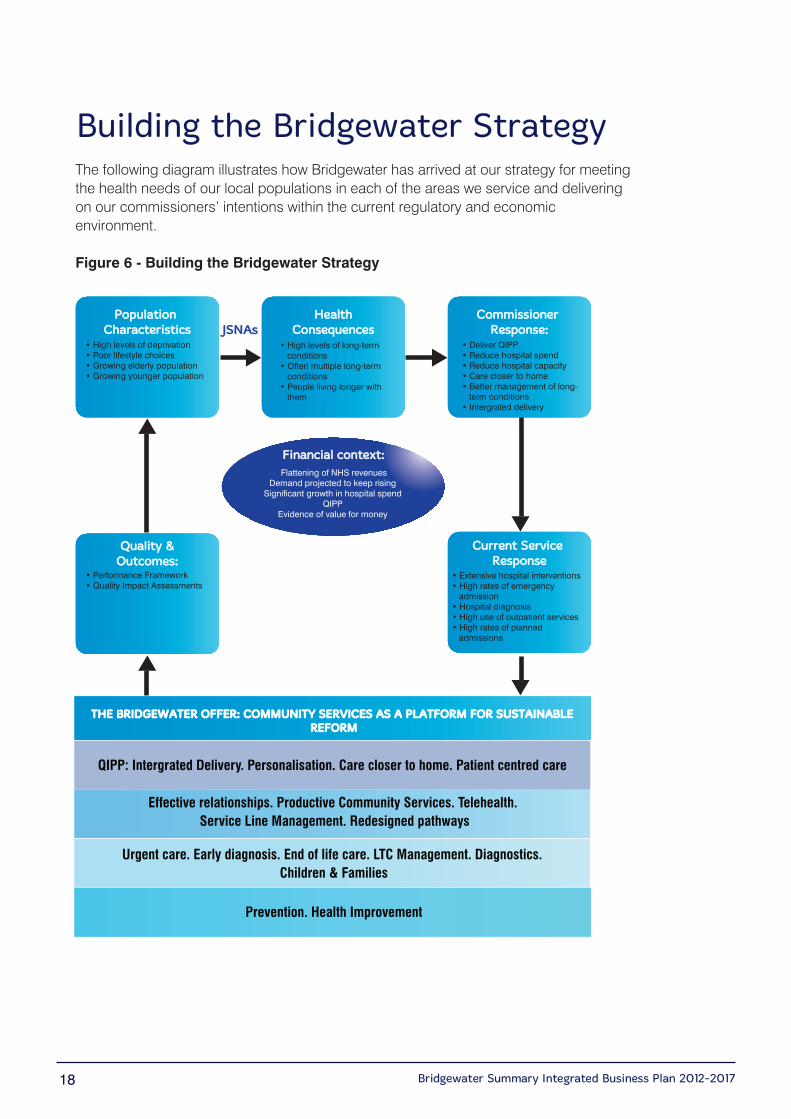
Building the Bridgewater StrategyThe following diagram illustrates how Bridgewater has arrived at our strategy for meetingthe health needs of our local populations in each of the areas we service and deliveringon our commissioners’ intentions within the current regulatory and economicenvironment.
Figure 6 - Building the Bridgewater Strategy
Population Population CharacteristicsCharacteristics
• High levels of deprivation• Poor lifestyle choices• Growing elderly population• Growing younger population
Quality &Quality &Outcomes:Outcomes:
• Performance Framework• Quality Impact Assessments
HealthHealthConsequencesConsequencesJSNAsJSNAs
• High levels of long-term conditions• Often multiple long-term conditions• People living longer with them
Commissioner Commissioner Response:Response:
• Deliver QIPP• Reduce hospital spend• Reduce hospital capacity• Care closer to home• Better management of long- term conditions• Intergrated delivery
Current Service Current Service ResponseResponse
• Extensive hospital interventions• High rates of emergency admission• Hospital diagnosis• High use of outpatient services• High rates of planned admissions
Financial context:Financial context: Flattening of NHS revenues
Demand projected to keep risingSignificant growth in hospital spend
QIPPEvidence of value for money
THE BRIDGEWATER OFFER: COMMUNITY SERVICES AS A PLATFORM FOR SUSTAINABLE THE BRIDGEWATER OFFER: COMMUNITY SERVICES AS A PLATFORM FOR SUSTAINABLE REFORMREFORM
QIPP: Intergrated Delivery. Personalisation. Care closer to home. Patient centred care
Effective relationships. Productive Community Services. Telehealth. Service Line Management. Redesigned pathways
Urgent care. Early diagnosis. End of life care. LTC Management. Diagnostics. Children & Families
Prevention. Health Improvement
Bridgewater Summary Integrated Business Plan 2012-2017 19
2To ensure that our key stakeholders are informed, involved and engaged with ourdevelopment and direction, we have developed and implemented an engagementframework. As part of this, all key stakeholders have been involved in discussions aboutthe development of the IBP, the development of our organisation and our future plans tomeet the needs of our local communities. These discussions have been supportive of ourplans but have also led to amendments to the IBP following stakeholder feedback.
In addition to the changing commissioner relationships at a local level, the nationalimperatives of the Health and Social Care Act (2012) open up the NHS provider marketfor community services. The ‘Any Qualified Provider’ (AQP) initiative is both an imminentchallenge and an opportunity. It requires a step change in our approach to servicedelivery and to our ability to accurately assess our cost base and understand our currentmodels of provision. Understanding the impact of AQP initiatives on whole services iscritical in order to determine service viability where AQP initiatives remove key pathwaysteps which in turn may compromise profitability of the pathway.
Bridgewater Summary Integrated Business Plan 2012-201720
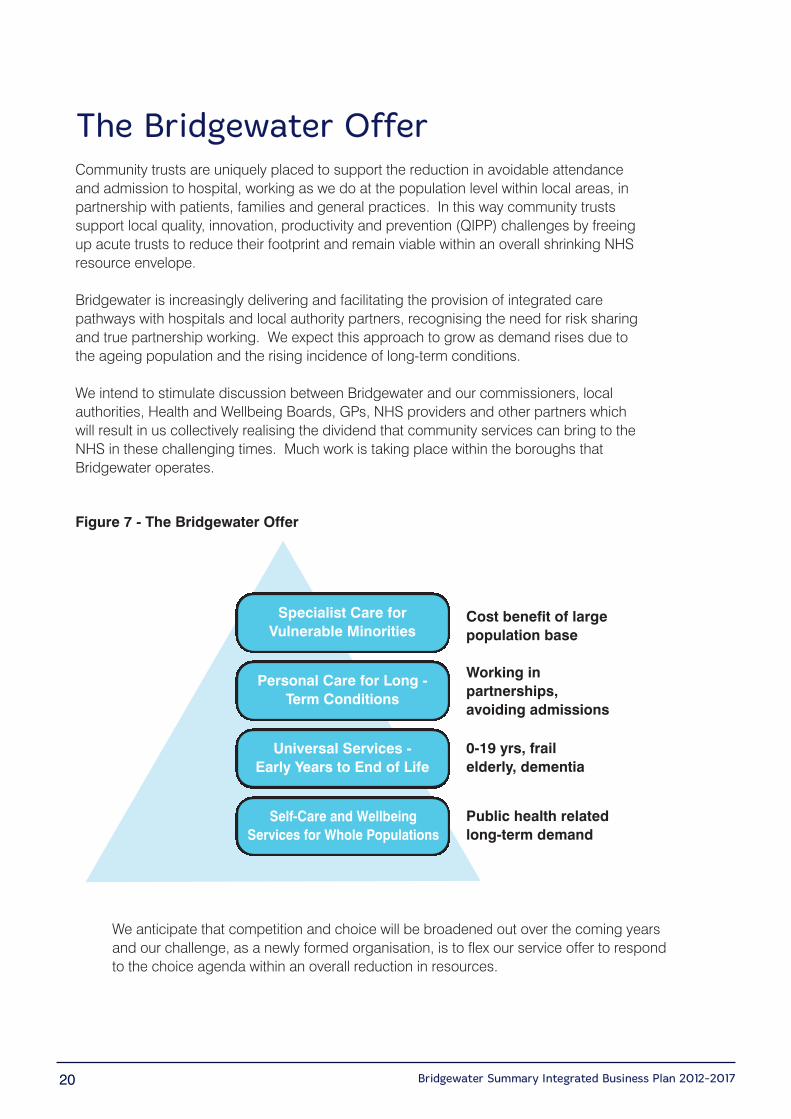
Figure 7 - The Bridgewater Offer
Specialist Care forVulnerable Minorities
Personal Care for Long -Term Conditions
Universal Services - Early Years to End of Life
Self-Care and WellbeingServices for Whole Populations
Cost benefit of largepopulation base
Working inpartnerships,avoiding admissions
0-19 yrs, frailelderly, dementia
Public health relatedlong-term demand
We anticipate that competition and choice will be broadened out over the coming yearsand our challenge, as a newly formed organisation, is to flex our service offer to respondto the choice agenda within an overall reduction in resources.
The Bridgewater OfferCommunity trusts are uniquely placed to support the reduction in avoidable attendanceand admission to hospital, working as we do at the population level within local areas, inpartnership with patients, families and general practices. In this way community trustssupport local quality, innovation, productivity and prevention (QIPP) challenges by freeingup acute trusts to reduce their footprint and remain viable within an overall shrinking NHSresource envelope.
Bridgewater is increasingly delivering and facilitating the provision of integrated carepathways with hospitals and local authority partners, recognising the need for risk sharingand true partnership working. We expect this approach to grow as demand rises due tothe ageing population and the rising incidence of long-term conditions.
We intend to stimulate discussion between Bridgewater and our commissioners, localauthorities, Health and Wellbeing Boards, GPs, NHS providers and other partners whichwill result in us collectively realising the dividend that community services can bring to theNHS in these challenging times. Much work is taking place within the boroughs thatBridgewater operates.
Bridgewater Summary Integrated Business Plan 2012-2017 21
2
Service Developments
Bridgewater’s service developments link directly with its strategic objectives and thecommissioning intentions of our local CCGs, local councils and Health & WellbeingBoards. They are developed with a view of the market and economic situation in whichwe operate and are refined in consultation with partners.
The key strands of the service development plans in Bridgewater are around the followingareas:
• Building on the strong foundations of services that we already provide, we will shape the local agenda, delivering holistic, innovative and integrated models of care byworking in partnership with patients, carers and their families.
• Working in partnership to deliver a platform of integrated care with partner organisations to meet the growing health needs of our communities.
• Improving the delivery of care in community settings, bringing care out of hospital and developing services closer to people’s homes.
• Improving access to services: educating, informing and empowering people, to maximise their ability to use them. Removing barriers that prevent access by minoritygroups.
• Improving people’s health, aiming to help them stay healthier for longer and using all our staff to focus on ill health prevention.
• Educating and enabling citizens to manage their own long-term conditions, as well as their wellbeing and quality of life, promoting self-care and maximising their potentialwherever possible.
• Providing universal services, that fully meet the health and social care needs of individuals within whole populations, from birth to death.
• Utilising innovative and cost effective approaches, including technology, to deliver community healthcare and provide more immediate communication and monitoring,with easier access for patients.
The Trust is developing business cases to generate new or changed services that supportimproved service efficiency and improved quality and effectiveness to support the deliveryof long-term financial viability of the organisation.
Bringing Bridgewater together has created opportunities for development and re-organisation of services. The following developments do not require investment fromcommissioners and are largely within our gift to make happen.
Bridgewater Summary Integrated Business Plan 2012-201722
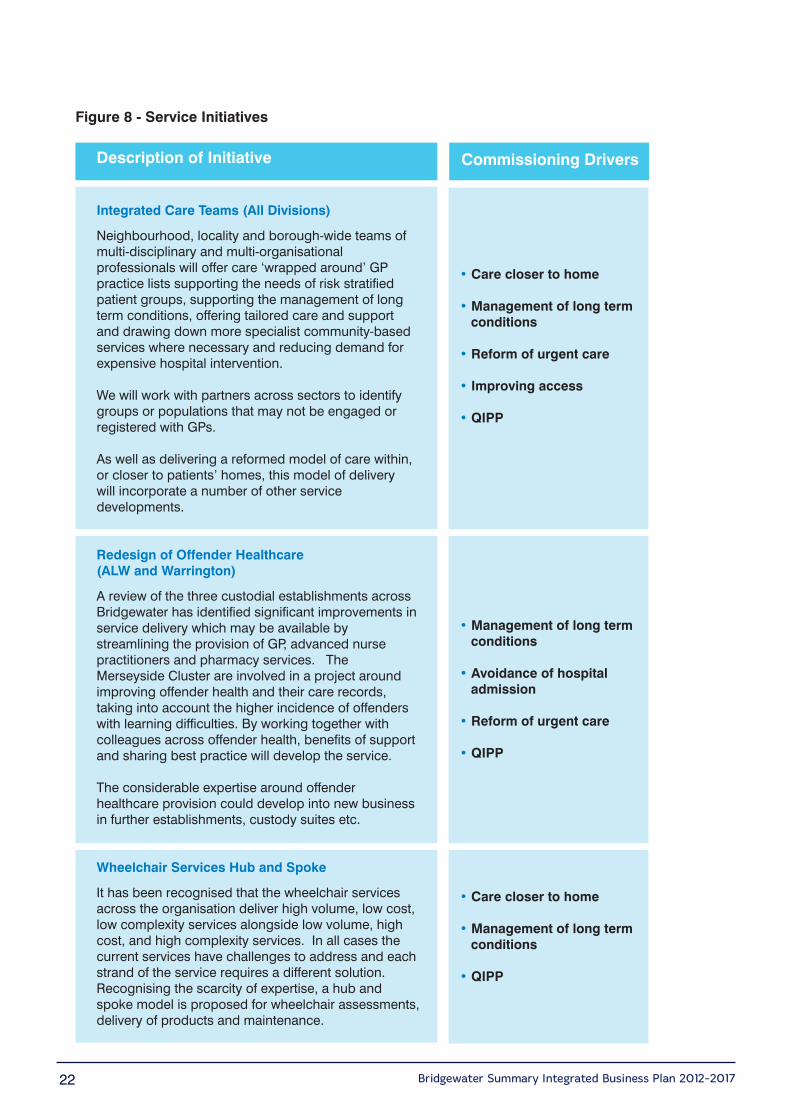
Figure 8 - Service Initiatives
Description of Initiative
Integrated Care Teams (All Divisions)
Neighbourhood, locality and borough-wide teams ofmulti-disciplinary and multi-organisationalprofessionals will offer care ‘wrapped around’ GPpractice lists supporting the needs of risk stratifiedpatient groups, supporting the management of longterm conditions, offering tailored care and supportand drawing down more specialist community-basedservices where necessary and reducing demand forexpensive hospital intervention.
We will work with partners across sectors to identifygroups or populations that may not be engaged orregistered with GPs.
As well as delivering a reformed model of care within,or closer to patients’ homes, this model of delivery will incorporate a number of other servicedevelopments.
Redesign of Offender Healthcare (ALW and Warrington)
A review of the three custodial establishments acrossBridgewater has identified significant improvements inservice delivery which may be available bystreamlining the provision of GP, advanced nursepractitioners and pharmacy services. TheMerseyside Cluster are involved in a project aroundimproving offender health and their care records,taking into account the higher incidence of offenderswith learning difficulties. By working together withcolleagues across offender health, benefits of supportand sharing best practice will develop the service.
The considerable expertise around offenderhealthcare provision could develop into new businessin further establishments, custody suites etc.
Wheelchair Services Hub and Spoke
It has been recognised that the wheelchair servicesacross the organisation deliver high volume, low cost,low complexity services alongside low volume, highcost, and high complexity services. In all cases thecurrent services have challenges to address and eachstrand of the service requires a different solution.Recognising the scarcity of expertise, a hub andspoke model is proposed for wheelchair assessments,delivery of products and maintenance.
• Care closer to home
• Management of long term conditions
• Reform of urgent care
• Improving access
• QIPP
• Management of long term conditions
• Avoidance of hospital admission
• Reform of urgent care
• QIPP
• Care closer to home
• Management of long term conditions
• QIPP
Commissioning Drivers
Bridgewater Summary Integrated Business Plan 2012-2017 23
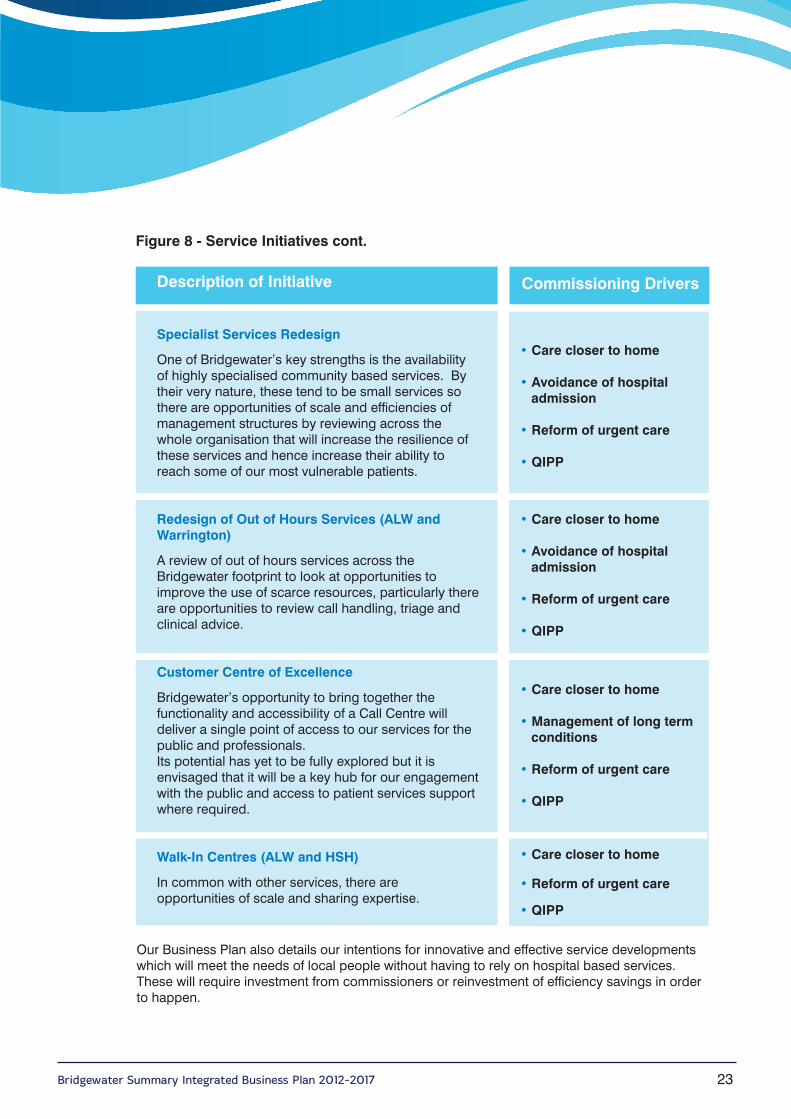
Figure 8 - Service Initiatives cont.
Description of Initiative
Specialist Services Redesign
One of Bridgewater’s key strengths is the availabilityof highly specialised community based services. Bytheir very nature, these tend to be small services sothere are opportunities of scale and efficiencies ofmanagement structures by reviewing across thewhole organisation that will increase the resilience ofthese services and hence increase their ability toreach some of our most vulnerable patients.
Redesign of Out of Hours Services (ALW andWarrington)
A review of out of hours services across theBridgewater footprint to look at opportunities toimprove the use of scarce resources, particularly thereare opportunities to review call handling, triage andclinical advice.
Customer Centre of Excellence
Bridgewater’s opportunity to bring together thefunctionality and accessibility of a Call Centre willdeliver a single point of access to our services for thepublic and professionals.Its potential has yet to be fully explored but it isenvisaged that it will be a key hub for our engagementwith the public and access to patient services supportwhere required.
Walk-In Centres (ALW and HSH)
In common with other services, there areopportunities of scale and sharing expertise.
• Care closer to home
• Avoidance of hospital admission
• Reform of urgent care
• QIPP
• Care closer to home
• Avoidance of hospital admission
• Reform of urgent care
• QIPP
• Care closer to home
• Management of long term conditions
• Reform of urgent care
• QIPP
• Care closer to home
• Reform of urgent care
• QIPP
Commissioning Drivers
Our Business Plan also details our intentions for innovative and effective service developmentswhich will meet the needs of local people without having to rely on hospital based services.These will require investment from commissioners or reinvestment of efficiency savings in orderto happen.
Bridgewater Summary Integrated Business Plan 2012-201724
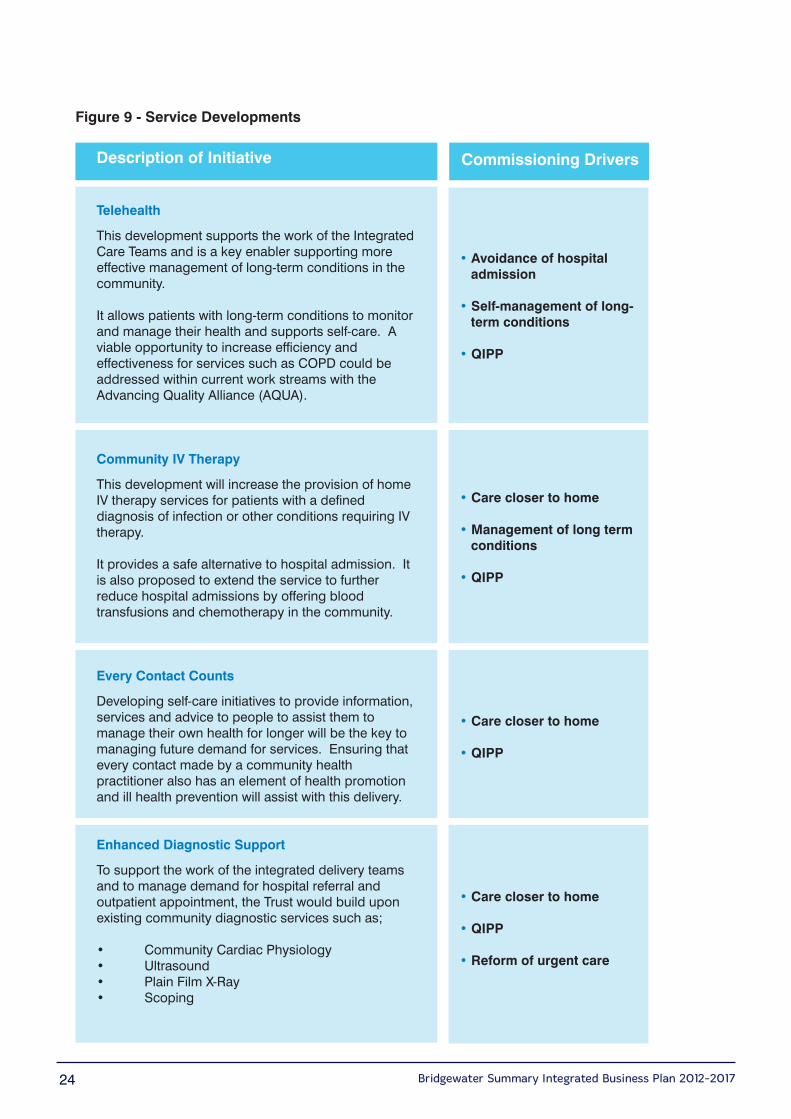
Figure 9 - Service Developments
Description of Initiative
Telehealth
This development supports the work of the IntegratedCare Teams and is a key enabler supporting moreeffective management of long-term conditions in thecommunity.
It allows patients with long-term conditions to monitorand manage their health and supports self-care. Aviable opportunity to increase efficiency andeffectiveness for services such as COPD could beaddressed within current work streams with theAdvancing Quality Alliance (AQUA).
Community IV Therapy
This development will increase the provision of homeIV therapy services for patients with a defineddiagnosis of infection or other conditions requiring IVtherapy.
It provides a safe alternative to hospital admission. Itis also proposed to extend the service to furtherreduce hospital admissions by offering bloodtransfusions and chemotherapy in the community.
Every Contact Counts
Developing self-care initiatives to provide information,services and advice to people to assist them tomanage their own health for longer will be the key tomanaging future demand for services. Ensuring thatevery contact made by a community healthpractitioner also has an element of health promotionand ill health prevention will assist with this delivery.
Enhanced Diagnostic Support
To support the work of the integrated delivery teamsand to manage demand for hospital referral andoutpatient appointment, the Trust would build uponexisting community diagnostic services such as;
• Community Cardiac Physiology• Ultrasound• Plain Film X-Ray• Scoping
Commissioning Drivers
• Avoidance of hospital admission
• Self-management of long-term conditions
• QIPP
• Care closer to home
• Management of long term conditions
• QIPP
• Care closer to home
• QIPP
• Care closer to home
• QIPP
• Reform of urgent care
Bridgewater Summary Integrated Business Plan 2012-2017 25
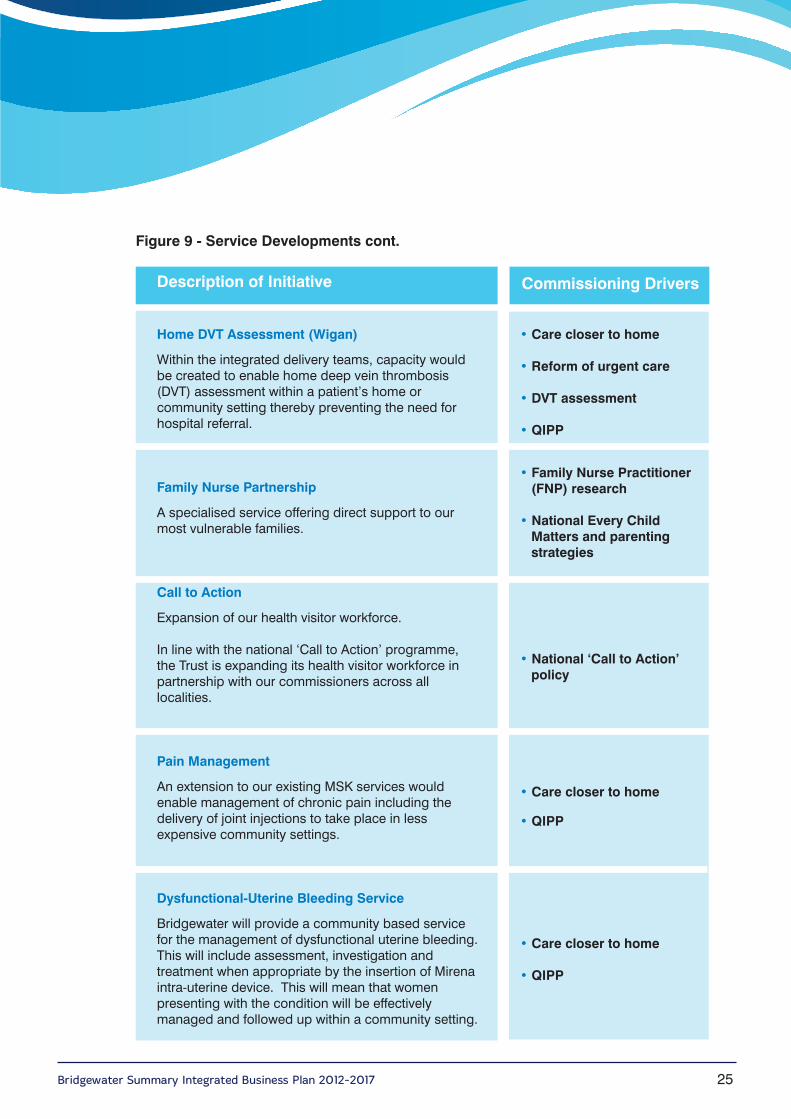
Figure 9 - Service Developments cont.
Description of Initiative
Home DVT Assessment (Wigan)
Within the integrated delivery teams, capacity wouldbe created to enable home deep vein thrombosis(DVT) assessment within a patient’s home orcommunity setting thereby preventing the need forhospital referral.
Family Nurse Partnership
A specialised service offering direct support to ourmost vulnerable families.
Call to Action
Expansion of our health visitor workforce.
In line with the national ‘Call to Action’ programme,the Trust is expanding its health visitor workforce inpartnership with our commissioners across alllocalities.
Pain Management
An extension to our existing MSK services wouldenable management of chronic pain including thedelivery of joint injections to take place in lessexpensive community settings.
Dysfunctional-Uterine Bleeding Service
Bridgewater will provide a community based servicefor the management of dysfunctional uterine bleeding.This will include assessment, investigation andtreatment when appropriate by the insertion of Mirenaintra-uterine device. This will mean that womenpresenting with the condition will be effectivelymanaged and followed up within a community setting.
Commissioning Drivers
• Care closer to home
• Reform of urgent care
• DVT assessment
• QIPP
• Family Nurse Practitioner (FNP) research
• National Every Child Matters and parentingstrategies
• National ‘Call to Action’ policy
• Care closer to home
• QIPP
• Care closer to home
• QIPP
Bridgewater Summary Integrated Business Plan 2012-201726
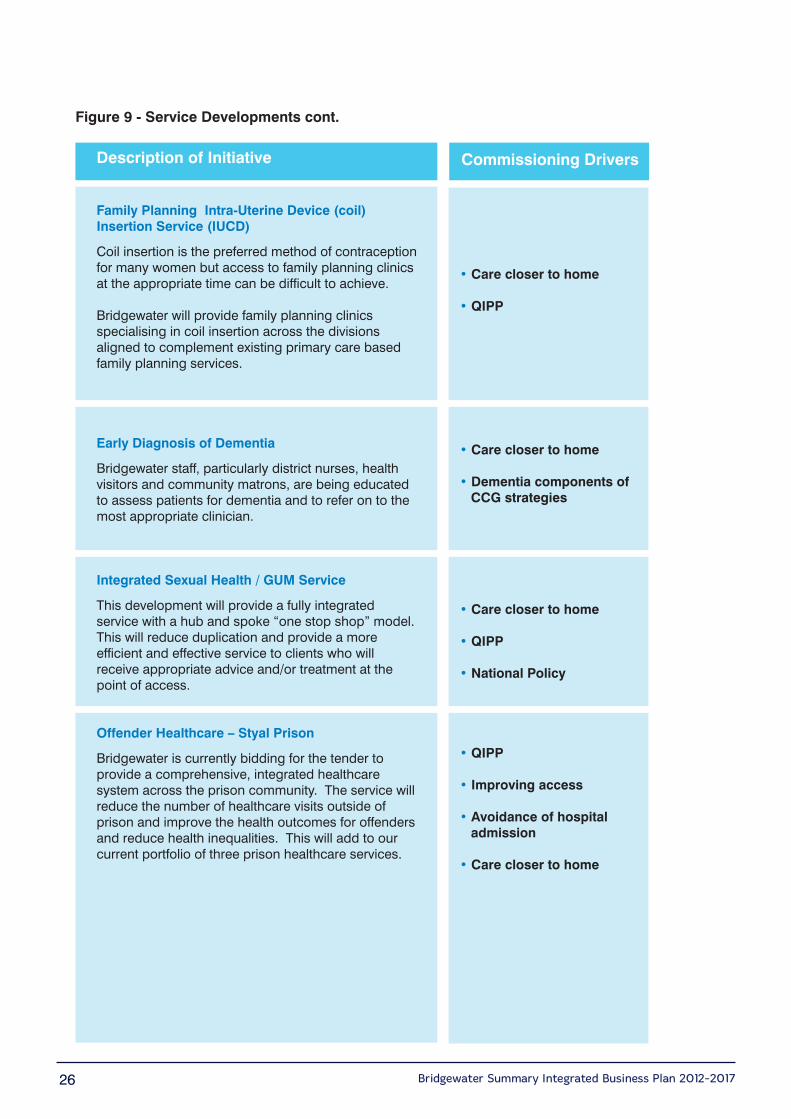
Figure 9 - Service Developments cont.
Description of Initiative
Family Planning Intra-Uterine Device (coil)Insertion Service (IUCD)
Coil insertion is the preferred method of contraceptionfor many women but access to family planning clinicsat the appropriate time can be difficult to achieve.
Bridgewater will provide family planning clinicsspecialising in coil insertion across the divisionsaligned to complement existing primary care basedfamily planning services.
Early Diagnosis of Dementia
Bridgewater staff, particularly district nurses, healthvisitors and community matrons, are being educatedto assess patients for dementia and to refer on to themost appropriate clinician.
Integrated Sexual Health / GUM Service
This development will provide a fully integratedservice with a hub and spoke “one stop shop” model.This will reduce duplication and provide a moreefficient and effective service to clients who willreceive appropriate advice and/or treatment at thepoint of access.
Offender Healthcare – Styal Prison
Bridgewater is currently bidding for the tender toprovide a comprehensive, integrated healthcaresystem across the prison community. The service willreduce the number of healthcare visits outside ofprison and improve the health outcomes for offendersand reduce health inequalities. This will add to ourcurrent portfolio of three prison healthcare services.
Commissioning Drivers
• Care closer to home
• QIPP
• Care closer to home
• Dementia components of CCG strategies
• Care closer to home
• QIPP
• National Policy
• QIPP
• Improving access
• Avoidance of hospital admission
• Care closer to home
Bridgewater Summary Integrated Business Plan 2012-2017 27
2
Performance
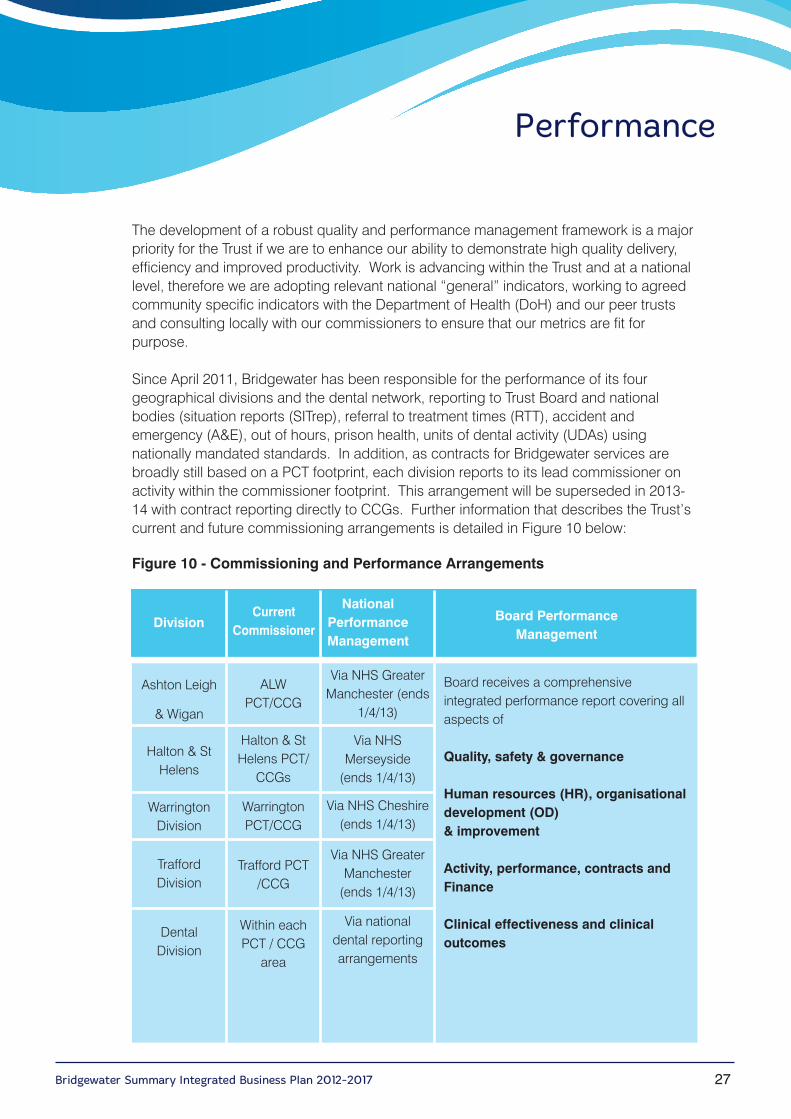
The development of a robust quality and performance management framework is a majorpriority for the Trust if we are to enhance our ability to demonstrate high quality delivery,efficiency and improved productivity. Work is advancing within the Trust and at a nationallevel, therefore we are adopting relevant national “general” indicators, working to agreedcommunity specific indicators with the Department of Health (DoH) and our peer trustsand consulting locally with our commissioners to ensure that our metrics are fit forpurpose.
Since April 2011, Bridgewater has been responsible for the performance of its fourgeographical divisions and the dental network, reporting to Trust Board and nationalbodies (situation reports (SITrep), referral to treatment times (RTT), accident andemergency (A&E), out of hours, prison health, units of dental activity (UDAs) usingnationally mandated standards. In addition, as contracts for Bridgewater services arebroadly still based on a PCT footprint, each division reports to its lead commissioner onactivity within the commissioner footprint. This arrangement will be superseded in 2013-14 with contract reporting directly to CCGs. Further information that describes the Trust’scurrent and future commissioning arrangements is detailed in Figure 10 below:
Figure 10 - Commissioning and Performance Arrangements
DivisionCurrent
Commissioner
NationalPerformanceManagement
Board Performance Management
Ashton Leigh
& Wigan
Halton & StHelens
WarringtonDivision
TraffordDivision
DentalDivision
ALWPCT/CCG
Halton & StHelens PCT/
CCGs
WarringtonPCT/CCG
Trafford PCT/CCG
Within eachPCT / CCG
area
Via NHS GreaterManchester (ends
1/4/13)
Via NHSMerseyside
(ends 1/4/13)
Via NHS Cheshire(ends 1/4/13)
Via NHS GreaterManchester
(ends 1/4/13)
Via nationaldental reportingarrangements
Board receives a comprehensiveintegrated performance report covering allaspects of
Quality, safety & governance
Human resources (HR), organisationaldevelopment (OD) & improvement
Activity, performance, contracts andFinance
Clinical effectiveness and clinicaloutcomes
Bridgewater Summary Integrated Business Plan 2012-201728
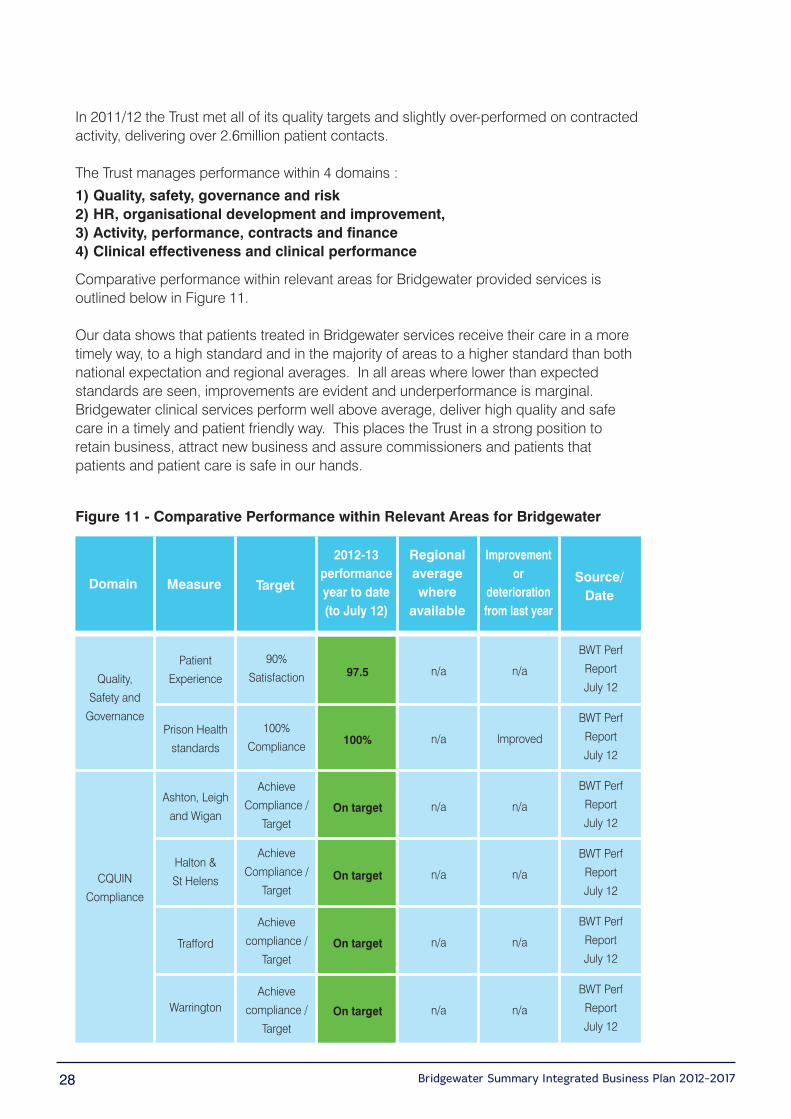
Figure 11 - Comparative Performance within Relevant Areas for Bridgewater
In 2011/12 the Trust met all of its quality targets and slightly over-performed on contractedactivity, delivering over 2.6million patient contacts.
The Trust manages performance within 4 domains :
1) Quality, safety, governance and risk2) HR, organisational development and improvement, 3) Activity, performance, contracts and finance4) Clinical effectiveness and clinical performance
Comparative performance within relevant areas for Bridgewater provided services isoutlined below in Figure 11.
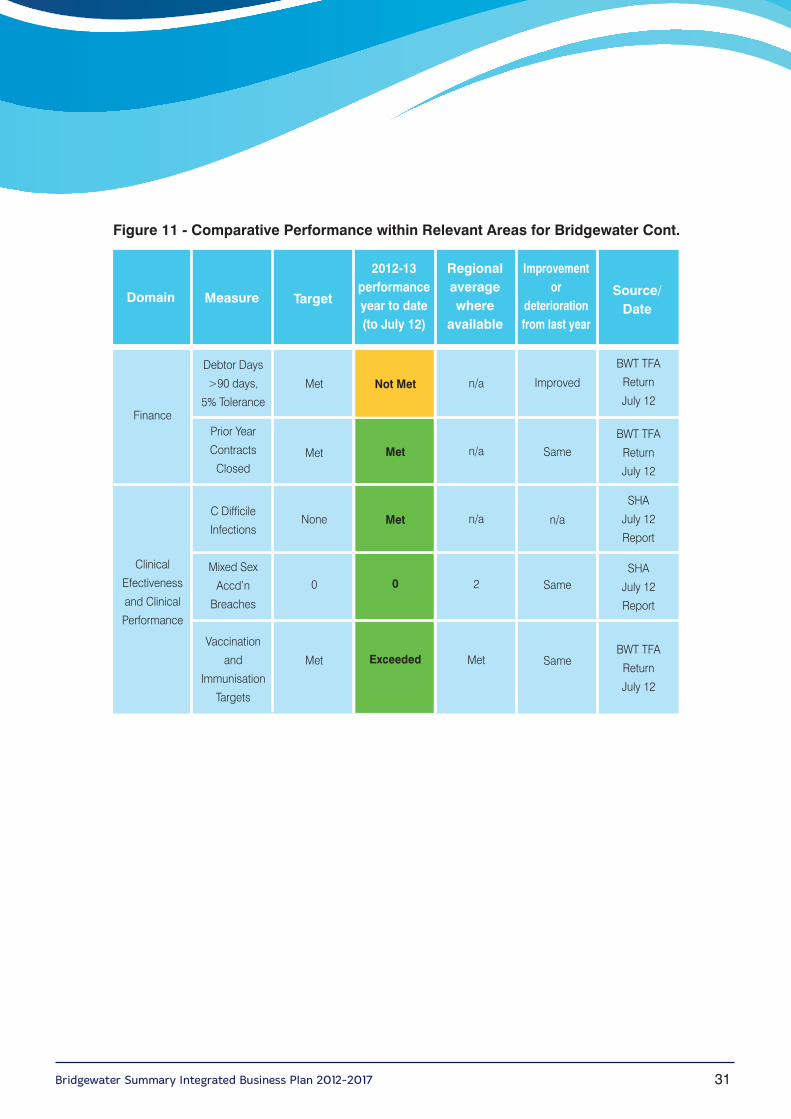
Our data shows that patients treated in Bridgewater services receive their care in a moretimely way, to a high standard and in the majority of areas to a higher standard than bothnational expectation and regional averages. In all areas where lower than expectedstandards are seen, improvements are evident and underperformance is marginal.Bridgewater clinical services perform well above average, deliver high quality and safecare in a timely and patient friendly way. This places the Trust in a strong position toretain business, attract new business and assure commissioners and patients thatpatients and patient care is safe in our hands.
Domain Measure Target
2012-13performanceyear to date(to July 12)
Regionalaveragewhere
available
Improvementor
deteriorationfrom last year
Source/Date
Patient
Experience
Prison Health
standards
Ashton, Leigh
and Wigan
Halton &
St Helens
Trafford
Warrington
Quality,
Safety and
Governance
CQUIN
Compliance
90%
Satisfaction
100%
Compliance
Achieve
Compliance /
Target
Achieve
Compliance /
Target
Achieve
compliance /
Target
Achieve
compliance /
Target
n/a
n/a
n/a
n/a
n/a
n/a
n/a
Improved
n/a
n/a
n/a
n/a
BWT Perf
Report
July 12
BWT Perf
Report
July 12
BWT Perf
Report
July 12
BWT Perf
Report
July 12
BWT Perf
Report
July 12
BWT Perf
Report
July 12
97.5
100%
On target
On target
On target
On target
Bridgewater Summary Integrated Business Plan 2012-2017 29
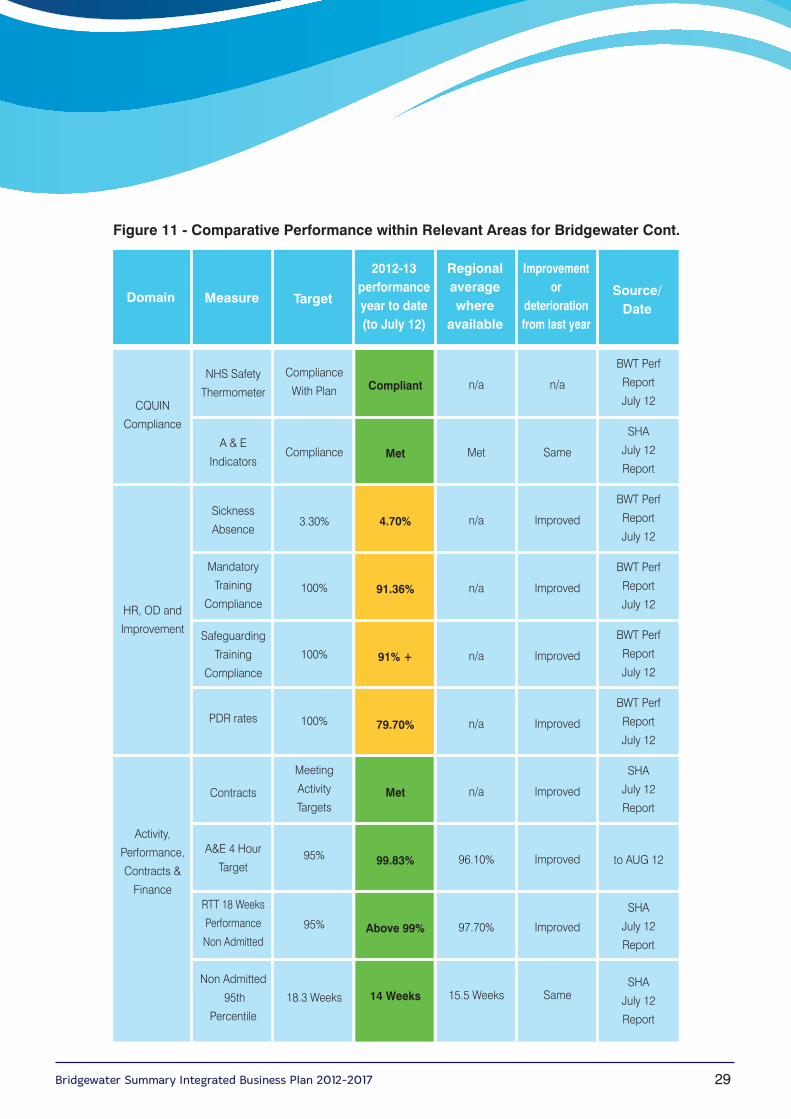
Figure 11 - Comparative Performance within Relevant Areas for Bridgewater Cont.
Domain Measure Target
2012-13performanceyear to date(to July 12)
Regionalaveragewhere
available
Improvementor
deteriorationfrom last year
Source/Date
NHS Safety
Thermometer
A & E
Indicators
Sickness
Absence
Mandatory
Training
Compliance
Safeguarding
Training
Compliance
PDR rates
Contracts
A&E 4 Hour
Target
RTT 18 Weeks
Performance
Non Admitted
Non Admitted
95th
Percentile
CQUIN
Compliance
HR, OD and
Improvement
Activity,
Performance,
Contracts &
Finance
Compliance
With Plan
Compliance
3.30%
100%
100%
100%
Meeting
Activity
Targets
95%
95%
18.3 Weeks
n/a
Met
n/a
n/a
n/a
n/a
n/a
96.10%
97.70%
15.5 Weeks
n/a
Same
Improved
Improved
Improved
Improved
Improved
Improved
Improved
Same
BWT Perf
Report
July 12
SHA
July 12
Report
BWT Perf
Report
July 12
BWT Perf
Report
July 12
BWT Perf
Report
July 12
BWT Perf
Report
July 12
SHA
July 12
Report
to AUG 12
SHA
July 12
Report
SHA
July 12
Report
Compliant
Met
4.70%
91.36%
91% +
79.70%
Met
99.83%
Above 99%
14 Weeks
Bridgewater Summary Integrated Business Plan 2012-201730
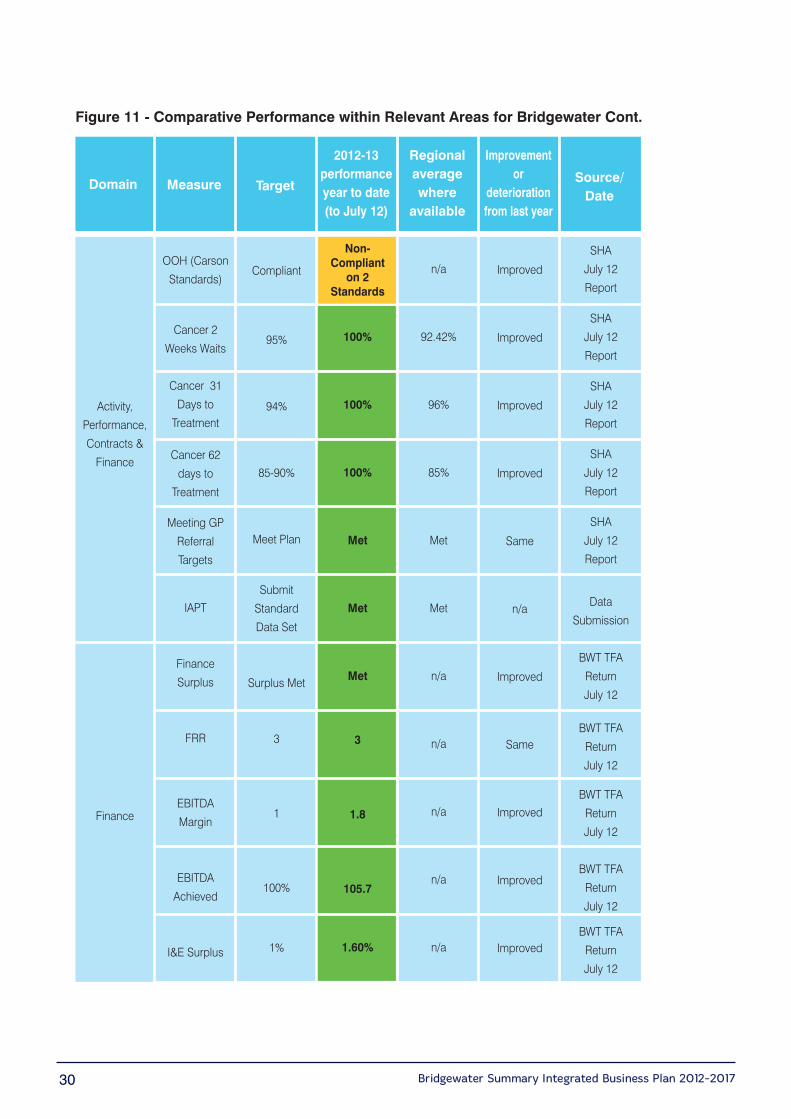
Figure 11 - Comparative Performance within Relevant Areas for Bridgewater Cont.
Domain Measure Target
2012-13performanceyear to date(to July 12)
Regionalaveragewhere
available
Improvementor
deteriorationfrom last year
Source/Date
OOH (Carson
Standards)
Cancer 2
Weeks Waits
Cancer 31
Days to
Treatment
Cancer 62
days to
Treatment
Meeting GP
Referral
Targets
IAPT
Finance
Surplus
FRR
EBITDA
Margin
EBITDA
Achieved
I&E Surplus
Activity,
Performance,
Contracts &
Finance
Finance
Compliant
95%
94%
85-90%
Meet Plan
Submit
Standard
Data Set
Surplus Met
3
1
100%
1%
n/a
92.42%
96%
85%
Met
Met
n/a
n/a
n/a
n/a
n/a
Improved
Improved
Improved
Improved
Same
n/a
Improved
Same
Improved
Improved
Improved
SHA
July 12
Report
SHA
July 12
Report
SHA
July 12
Report
SHA
July 12
Report
SHA
July 12
Report
Data
Submission
BWT TFA
Return
July 12
BWT TFA
Return
July 12
BWT TFA
Return
July 12
BWT TFA
Return
July 12
BWT TFA
Return
July 12
Non-Compliant
on 2Standards
100%
100%
100%
Met
Met
Met
3
1.8
105.7
1.60%
Bridgewater Summary Integrated Business Plan 2012-2017 31
Figure 11 - Comparative Performance within Relevant Areas for Bridgewater Cont.
Domain Measure Target
2012-13performanceyear to date(to July 12)
Regionalaveragewhere
available
Improvementor
deteriorationfrom last year
Source/Date
Debtor Days
>90 days,
5% Tolerance
Prior Year
Contracts
Closed
C Difficile
Infections
Mixed Sex
Accd’n
Breaches
Vaccination
and
Immunisation
Targets
Finance
Clinical
Efectiveness
and Clinical
Performance
Met
Met
None
0
Met
n/a
n/a
n/a
2
Met
Improved
Same
n/a
Same
Same
BWT TFA
Return
July 12
BWT TFA
Return
July 12
SHA
July 12
Report
SHA
July 12
Report
BWT TFA
Return
July 12
Not Met
Met
Met
0
Exceeded
Bridgewater Summary Integrated Business Plan 2012-201732
Financial PerformanceOur financial plans
What are we trying to achieve?
• Delivering surpluses to allow for a significant capital investment to improve the quality of our I.T. systems and buildings to support service modernisation.
• Delivering increased efficiencies whilst maintaining and improving the quality of our services.
• Managing changes in service delivery and care pathways in partnership with our stakeholders.
• Ensuring workforce changes are managed effectively.
• Delivering short, medium and long-term financial viability whilst contributing to the overall financial sustainability of the health economies in which we operate.
What are we going to deliver?
Our financial plans are to:
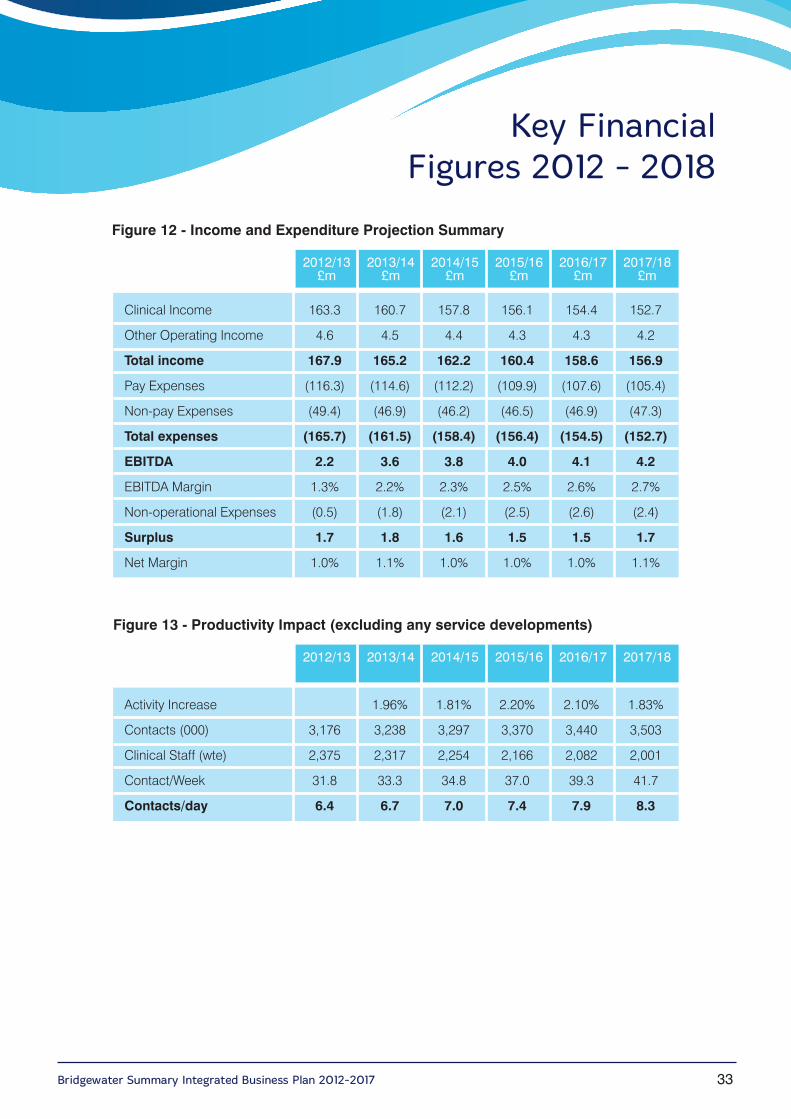
• Put aside on average £1.6m (approximately 1% of turnover) each year in order to make the planned improvements to our staff training and development, I.T. systems andbuildings and to create a small financial cushion to help us to manage future risks.
• Over the next five years, spend £11.8m on IM & T, estates and medical equipment to improve the quality of our services provided to patients.
• Over the next five years, deliver £46.3m of savings by being more efficient, innovative and productive.
• Get the balance right so that we achieve financial stability whilst at the same time improving the quality of our services.
Bridgewater Summary Integrated Business Plan 2012-2017 33
Key Financial Figures 2012 - 2018
Figure 12 - Income and Expenditure Projection Summary
Domain
2017/18£m
2016/17£m
2015/16£m
2014/15£m
2013/14£m
2012/13£m
Clinical Income
Other Operating Income
Total income
Pay Expenses
Non-pay Expenses
Total expenses
EBITDA
EBITDA Margin
Non-operational Expenses
Surplus
Net Margin
163.3
4.6
167.9
(116.3)
(49.4)
(165.7)
2.2
1.3%
(0.5)
1.7
1.0%
160.7
4.5
165.2
(114.6)
(46.9)
(161.5)
3.6
2.2%
(1.8)
1.8
1.1%
157.8
4.4
162.2
(112.2)
(46.2)
(158.4)
3.8
2.3%
(2.1)
1.6
1.0%
156.1
4.3
160.4
(109.9)
(46.5)
(156.4)
4.0
2.5%
(2.5)
1.5
1.0%
154.4
4.3
158.6
(107.6)
(46.9)
(154.5)
4.1
2.6%
(2.6)
1.5
1.0%
152.7
4.2
156.9
(105.4)
(47.3)
(152.7)
4.2
2.7%
(2.4)
1.7
1.1%
Figure 13 - Productivity Impact (excluding any service developments)
Domain
2017/182016/172015/162014/152013/142012/13
Activity Increase
Contacts (000)
Clinical Staff (wte)
Contact/Week
Contacts/day
3,176
2,375
31.8
6.4
1.96%
3,238
2,317
33.3
6.7
1.81%
3,297
2,254
34.8
7.0
2.20%
3,370
2,166
37.0
7.4
2.10%
3,440
2,082
39.3
7.9
1.83%
3,503
2,001
41.7
8.3
Bridgewater Summary Integrated Business Plan 2012-201734
RiskBridgewater has established a robust governance assurance process in order to assessthe viability of the Trust’s CIP both from a financial stand point and a quality impactperspective.
The governance arrangements that the Trust has adopted have benefited from therecommendations within the joint Monitor and Audit Commission good practice guideentitled ‘Delivering Sustainable Cost Improvement Programmes’.
Bridgewater has a strong track record in delivering a significant level of CIPs and theforward targets are felt to be realistic and achievable.
Detailed plans exist for 2013/14 and 2014/15 with outline themes and high level plans forthe remaining three years of the planning period. The staffing impact in respect ofestimated headcount reductions and impact on productivity has been estimated for allfive years.
Key RisksThe major risks facing the organisation with the financial impact have been identified asfollows:
• CIP Shortfall – Where our CIP performance falls short by 15% in year one then 10% in each year thereafter and resolved in the subsequent year.
• Financial Pressure – Monitor routinely imposes an additional 0.5% cost pressure (per year) to applicant’s base cases. This could represent regulatory changes, pricecompetition, inflationary increases, etc.
• Activity Growth – It is assumed that there is activity growth of 1.2% per year with no income growth. Associated costs (clinical staff costs, drugs, clinical supplies) riseproportionately.
• AQP – The assumption is that in year two, the Trust loses approximately 4% income, but is only able to lose 50% of the associated costs.
• Price Competition (whether through local QIPP targets or other) – this causes a fall in income of 1% each year in years three to five.
Although the Board has identified mitigation for each of these risks, these sensitivitieshave been combined to form a downside, and the table overleaf summarises the financialimpact of the downside as follows:
Bridgewater Summary Integrated Business Plan 2012-2017 35
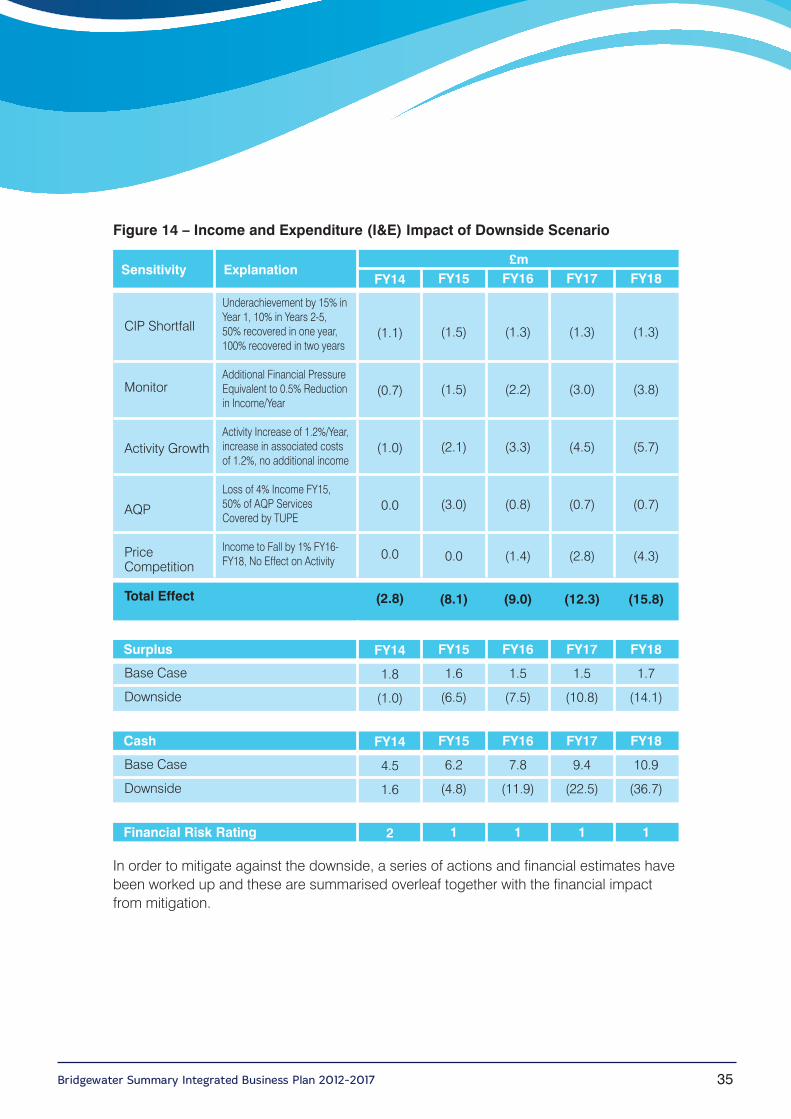
Figure 14 – Income and Expenditure (I&E) Impact of Downside Scenario
Domain
£mSensitivity Explanation
CIP Shortfall
Monitor
Activity Growth
AQP
Price Competition
Total Effect
Underachievement by 15% inYear 1, 10% in Years 2-5,50% recovered in one year,100% recovered in two years
Additional Financial PressureEquivalent to 0.5% Reduction in Income/Year
Activity Increase of 1.2%/Year,increase in associated costsof 1.2%, no additional income
Loss of 4% Income FY15,50% of AQP ServicesCovered by TUPE
Income to Fall by 1% FY16-FY18, No Effect on Activity
FY14
(1.1)
(0.7)
(1.0)
0.0
0.0
(2.8)
FY15
(1.5)
(1.5)
(2.1)
(3.0)
0.0
(8.1)
FY16
(1.3)
(2.2)
(3.3)
(0.8)
(1.4)
(9.0)
FY17
(1.3)
(3.0)
(4.5)
(0.7)
(2.8)
(12.3)
FY18
(1.3)
(3.8)
(5.7)
(0.7)
(4.3)
(15.8)
DomainSurplus
Base Case
Downside
FY14
1.8
(1.0)
FY15
1.6
(6.5)
FY16
1.5
(7.5)
FY17
1.5
(10.8)
FY18
1.7
(14.1)
DomainCash
Base Case
Downside
FY14
4.5
1.6
FY15
6.2
(4.8)
FY16
7.8
(11.9)
FY17
9.4
(22.5)
FY18
10.9
(36.7)
DomainFinancial Risk Rating 2 1 1 1 1
In order to mitigate against the downside, a series of actions and financial estimates havebeen worked up and these are summarised overleaf together with the financial impactfrom mitigation.
Bridgewater Summary Integrated Business Plan 2012-201736
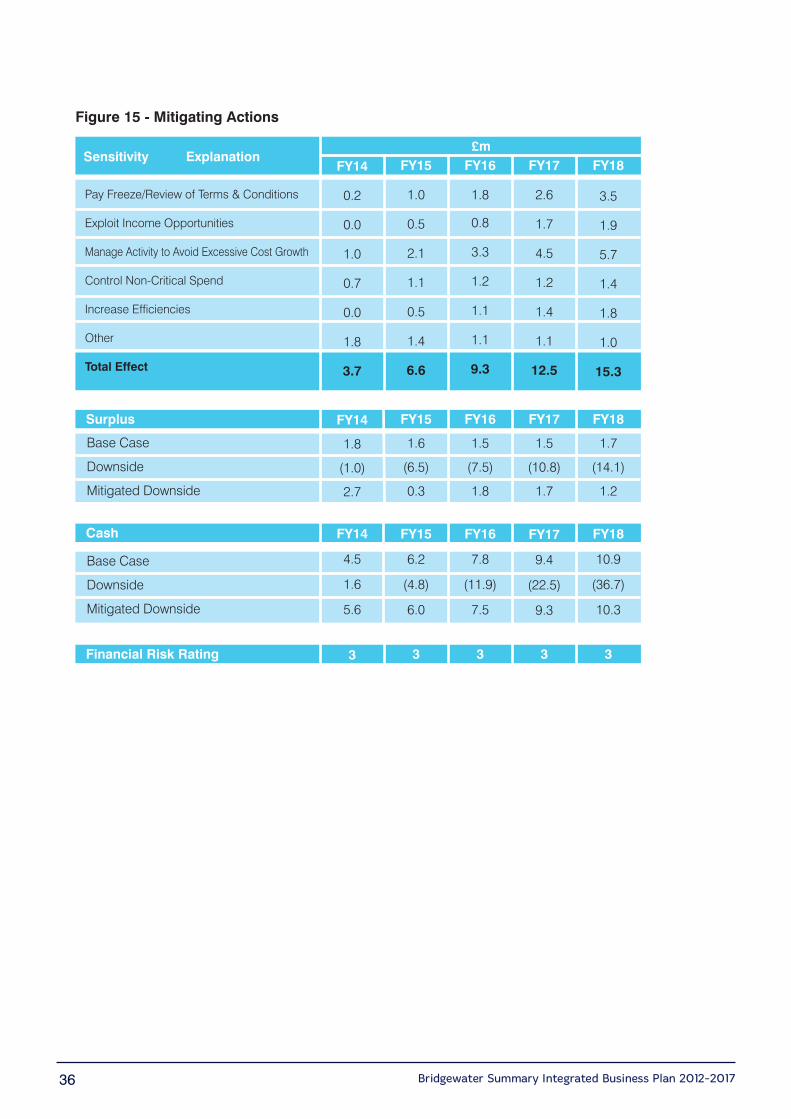
Figure 15 - Mitigating Actions
Domain
£mSensitivity Explanation
Pay Freeze/Review of Terms & Conditions
Exploit Income Opportunities
Manage Activity to Avoid Excessive Cost Growth
Control Non-Critical Spend
Increase Efficiencies
Other
Total Effect
FY14
0.2
0.0
1.0
0.7
0.0
1.8
3.7
FY15
1.0
0.5
2.1
1.1
0.5
1.4
6.6
FY16
1.8
0.8
3.3
1.2
1.1
1.1
9.3
FY17
2.6
1.7
4.5
1.2
1.4
1.1
12.5
FY18
3.5
1.9
5.7
1.4
1.8
1.0
15.3
DomainSurplus
Base Case
Downside
Mitigated Downside
FY14
1.8
(1.0)
2.7
FY15
1.6
(6.5)
0.3
FY16
1.5
(7.5)
1.8
FY17
1.5
(10.8)
1.7
FY18
1.7
(14.1)
1.2
Cash
DomainBase Case
Downside
Mitigated Downside
FY14
4.5
1.6
5.6
FY15
6.2
(4.8)
6.0
FY16
7.8
(11.9)
7.5
FY17
9.4
(22.5)
9.3
FY18
10.9
(36.7)
10.3
DomainFinancial Risk Rating 3 3 3 3 3
Bridgewater Summary Integrated Business Plan 2012-2017 37
Cost Improvements and Quality of Care
Given the need to make significant savings through recurrent productivity and redesignprogrammes, the Board ensures that quality impact assessments are undertaken by theMedical Director and the Executive Nurse on all CIP proposals, since safety andeffectiveness must not be compromised in any circumstances.
Where appropriate, we are rolling out the uptake of new technologies to deliver patientcare in innovative ways to improve the patient experience.
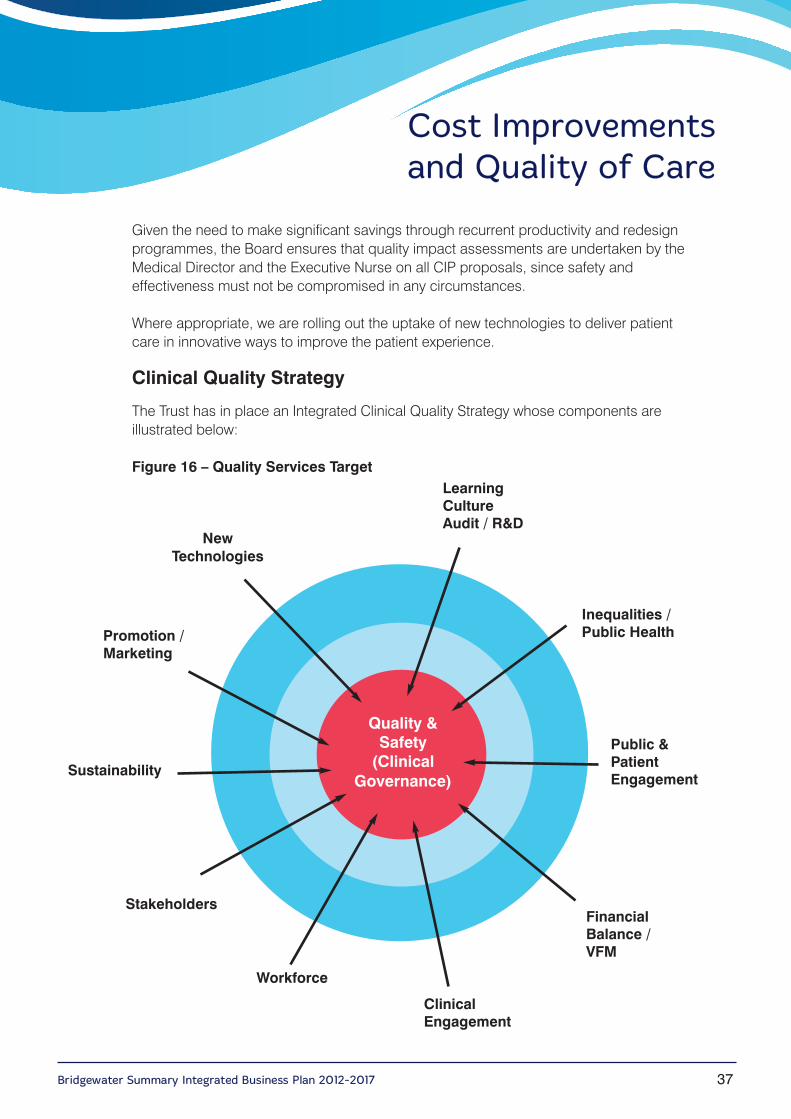
Clinical Quality Strategy
The Trust has in place an Integrated Clinical Quality Strategy whose components areillustrated below:
Figure 16 – Quality Services Target
Quality &Safety (Clinical
Governance)
NewTechnologies
Promotion /Marketing
Sustainability
Stakeholders
Workforce
ClinicalEngagement
FinancialBalance /VFM
Public &PatientEngagement
Inequalities /Public Health
LearningCultureAudit / R&D
Bridgewater Summary Integrated Business Plan 2012-201738
The Trust has developed and is embedding a “Quality Dashboard” that allows services,divisions and the Trust Board to monitor, review and target key quality indicators. TheTrust has agreed with commissioners, and is leading nationally, on a programme toimplement an outcomes framework in the next contracting round. This will ensure thatservices are commissioned and provided based on clinical value, patient and populationoutcomes and quality of service.
The Quality Strategy underpins our commitment to excellence by setting up four keydomains;
1. Patient experience and involvement2. Clinical effectiveness3. Patient safety 4. Governance
Each of these domains has clear objectives, well defined targets and trajectories andclear monitoring and success criteria so that the Board can track our progress and drivethe quality agenda forward within Bridgewater.
Patient Experience and Involvement
• Develop a Bridgewater patient charter.
• Ascertain patient’s views regarding the quality of our services on a regular basis ensuring that patients.
� Are treated with respect and dignity� Are provided with appropriate information or advice� Have confidence and trust in health professional(s)� Receive the care that mattered to me
• Conduct staff Surveys within Bridgewater on a regular basis, in addition to the National Staff Survey, to ensure staff are: -
� Listened to and involved in shaping our decisions and strategic approaches � Motivated to provide the best patient experience
• Ensure lessons learnt from complaints/PALS are identified, acted upon and shared across the organisation.
• The Trust will continue the implementation of the “Important Choice‟ agenda (End of Life Care Pathway) supporting patients to be cared for in the place of their choice.
• The Trust will implement the new model for health visiting –“A Call to Action Health Visitor Implementation Plan‟.
Bridgewater Summary Integrated Business Plan 2012-2017 39
2All Divisions will develop alternative methods of seeking service feedback including forexample:
� SMS texting � Family Echo � Care Cards
• The Trust will engage Members and Governors in ensuring the Board receives timely patient experience feedback via:
� Council of Governors� Regular Involvement Activities� Annual Member Survey
Ascertain Members and Governors views regarding the quality of our services and areasfor quality improvement.
Clinical Effectiveness
• Clinical Network forum to drive forward continuous improvement of services for patients, and their carers/families through clinical engagement.
• To focus on the development of care pathways (map of medicine) specifically for end of life, dementia, cancer, and early diagnosis, and other long term conditionsmanaged through Urgent Care and Specialist Services networks.
• To maximise the potential for an integrated approach to providing effective and efficient care patient care across the health and social care economy.
• Bridgewater will put in place a communication technology (telehealth/telecare) and resource programme to support self-care and increase health literacy within its patientand carer population. Whilst delivering efficiency gains by supporting patients tomanage their care and live more independently.
• Review Bridgewater offender health provision to reduce inappropriate variation and maximise quality of services provided.
• To improve life chances for children aged 0-5 by improving the level of access and support to families with children from 0-5 in line with the DoH Health Child Programme(2009).
• Development of a range of clinical effectiveness and performance indicators.

Bridgewater Summary Integrated Business Plan 2012-201740
Patient Safety
• Increase patient safety incident reporting and reducing actual harm levels.
• Reduce or contribute to the reduction of: -
� Community developed or deteriorating pressure ulcers� Residential home and acute trust developed or deteriorating pressure ulcers � Catheter acquired infections in the community � Falls in inpatient and intermediate care facilities
• Maintain adherence to the requirements of Hygiene Code of Practice.
• Establish a culture of “no avoidable infections.
• Implement a comprehensive, consistent, and patient centred approach to risk management across the Trust.
• Establish and maintain safe and clean community premises which are fit for purpose.
Governance
• Reconfigure a governance structure that reflects the needs of the new organisation.
• Ensure effective monitoring of Clinical Quality Strategy to ensure key aims and objectives are realised.
• Ensure compliance with the Monitor Quality Governance Framework (July 2010.)
• Ensure Bridgewater learns the lessons from all relevant national reports and enquiries.
• Implement an integrated business intelligence reporting framework (SLR/SLM) across all service lines to ensure heads of service, divisional directors can monitor and reporton their performance from service line to board.
• Implement a programme of ‘walk-rounds’ to monitor the environmental standards within clinics, led by Executive and Non-Executive Directors.
• Ensure Bridgewater quality impact assessment tool (QIAT) is completed for all cost improvement plans (CIPS) and service redesigns.
• Maintain CQC registration without conditions for all regulated activities.
Bridgewater Summary Integrated Business Plan 2012-2017 41
22
Our Five Year Workforce Plan
It is recognised that our workforce is our most valuable resource and that the staff areambassadors for our mission and vision and also for creating our reputation of a highlyperforming and responsive organisation.
Our workforce’s support of our development and growth is matched by a commitmentfrom the organisation to their future learning and development needs, which supportstheir personal ambitions for the future, an improved patient experience and theorganisation’s need to be flexible to meet the future demands of the evolving NHS.
We know that having access to high quality training and development is vital to ourprofessional staff and is a key factor in recruiting and retaining a high quality team. Ourpatients tell us that knowing our staff have the right skills to meet their needs is veryimportant to them.
We identify specific clinical learning needs to respond to short and long term serviceneeds ensuring staff are provided with ongoing skills development to support serviceimprovement and redesign.
In order to ensure the high quality leadership and people management that are crucial ifwe are to meet the new agenda and the expectations of people who use our services, wehave developed a leadership model to support the continued development of leaders atall levels of the organisation.
To continue to deliver the scale of change required and to respond to the challenges,Bridgewater will continue to work to ensure we have a robust, integrated workforce plan.
The following assumptions have been made in planning for our future workforce:
• Funded vacancies will need to be included in our staffing baseline.
• Where posts have been offset against a CIP these posts will be removed from the funded establishment figure/baseline.
• Our health visitor staffing levels will increase year on year in line with our trajectory, with a commitment to training and supporting students on the widening accessprogramme.
• Administrative and clerical staffing levels will not increase, but staff will be deployed to effectively support clinicians.
• Our Health Improvement team staffing levels will remain static as discussion on public health provision is concluded with our local authority colleagues.
Workforce & Leadership
• There will be a rationalisation of ‘back office’ functions.
• Consultant medical input will not decrease; however, effective partnerships with specialist providers will be explored.
• Sickness levels will decrease.
• There will be a reduction in the use of bank and agency staff.
• There will be a more agile workforce, working in different ways, utilising technological advancements that will impact on our estate requirements.
• The support worker roles will be developed.
• There will be a need to reduce or remove some roles within the Trust via voluntary or compulsive redundancy or mutually agreed resignation terms.
Senior Leadership of the Trust
To realise the ambitions of the IBP, we demonstrate strong and effective leadership atevery level of the organisation and engender a shared commitment to the realisation ofour objectives.
The Board consists of five Executive Directors from within the organisation plus aChairman and seven Non Executive Directors.
The Executive Directors are: the Chief Executive Officer (CEO); the Director of Finance;the Director of Operations; the Executive Nurse / Director of Governance; who isresponsible for quality, safety and standards; and the Medical Director.The Director of Human Resources and Organisational Development attends Board but isa non-voting member.
The Senior Management Team also includes a Director of Clinical Performance whoseremit is to develop our corporate performance framework and service line managementsystems. This Director is not a Board Member, but is directly accountable to the CEO.Similarly, there is a Director of Corporate Development who reports to the CEO and isresponsible for communication, strategic relationship management and newdevelopments.
Board members have a broad range of skills and experience. We have initiated a BoardDevelopment Programme and are committed to its full implementation.
The Board has in place an extensive Assurance Framework which is reviewed on aquarterly basis, with the implementation of the framework being carried out and monitoredby the Senior Management Team. The Board pays particular attention to quality andsafety, inviting patients to tell their stories and undertaking “quality walkabouts”.
Bridgewater Summary Integrated Business Plan 2012-201742

Our Board
Harry HoldenChairman
Dr Kate FallonChief Executive
Karen BlissNon-Executive Directorand Chair of AuditCommittee
Steve CashNon-Executive Director
Baron FrankalNon-Executive Director
Sue MussonNon-Executive Director/ DesignateSenior IndependentDirector
Bob SaundersNon-Executive Directorand Chair of Qualityand Safety Committee
Colin ScalesExecutive Director ofOperations
Bridgewater Integrated Business Plan 2012-2017 43Bridgewater Summary Integrated Business Plan 2012-2017

Mike TreharneExecutive Director ofFinance, Informationand Performance /Deputy Chief Executive
Dr Steve WardExecutive MedicalDirector
Dorothy WhitakerVice Chair and Non-Executive Director
Dorian WilliamsExecutiveNurse/Director ofGovernance
Sally YeomanNon-Executive Director
Christine SamosaDirector of HumanResources andOrganisationalDevelopment
44 Bridgewater Summary Integrated Business Plan 2012-2017

Bridgewater Summary Integrated Business Plan 2012-2017 45
22
Notes

Bridgewater Summary Integrated Business Plan 2012-201746
Notes

ContactsMembership
Anyone aged 14 years or over who lives in England is eligible to become a public member. Find out more about membership at www.bridgewater.nhs.uk or email [email protected]
or call 01942 482672.
Comments
If you have any comments on this document or require it in another language or format please contact 01942 482655 or email [email protected].
Headquarters
Bevan House, 17 Beecham Court, Smithy Brook Road, Wigan, WN3 6PRTelephone: 01942 482630 Email: [email protected]
For more information on our Trust visit our website: www.bridgewater.nhs.uk
Bridgewater Community HealthcareNHS Trust