sug572 - c04 - lecture - digitize
TRANSCRIPT
8/3/2019 Sug572 - c04 - Lecture - Digitize
http://slidepdf.com/reader/full/sug572-c04-lecture-digitize 1/15
UNIVERSITI TEKNOLOGI MARAAUTOMATION IN SURVEYING – SUG572 – MAMW – 100410 – LECTURE Date :
NAME: ………………………………………………….. UiTM. No. ………………………………………………
JABATAN SAINS UKUR & GEOMATIK
CHAPTER 04
DIGITIZING
At the end of this class, you should be able to
1. identify errors in digitizing2. analyze quality of a map for digitization3. select software for digitizing
4.1 INTRODUCTION
Map digitization is an important source of spatial data, and its process of production is complicated.The error generated by each step will influence the outcome of data quality.
4.2 DATA STRUCTURES
Raster and vector are the two basic data structures for storing and manipulating images and graphicsdata on a computer. All of the major GIS (Geographic Information Systems) and CAD (ComputerAided Design) software packages available today are primarily based on one of the two structures,
either raster based or vector based, while they have some extended functions to support other datastructures.
4.2.1 Raster Data
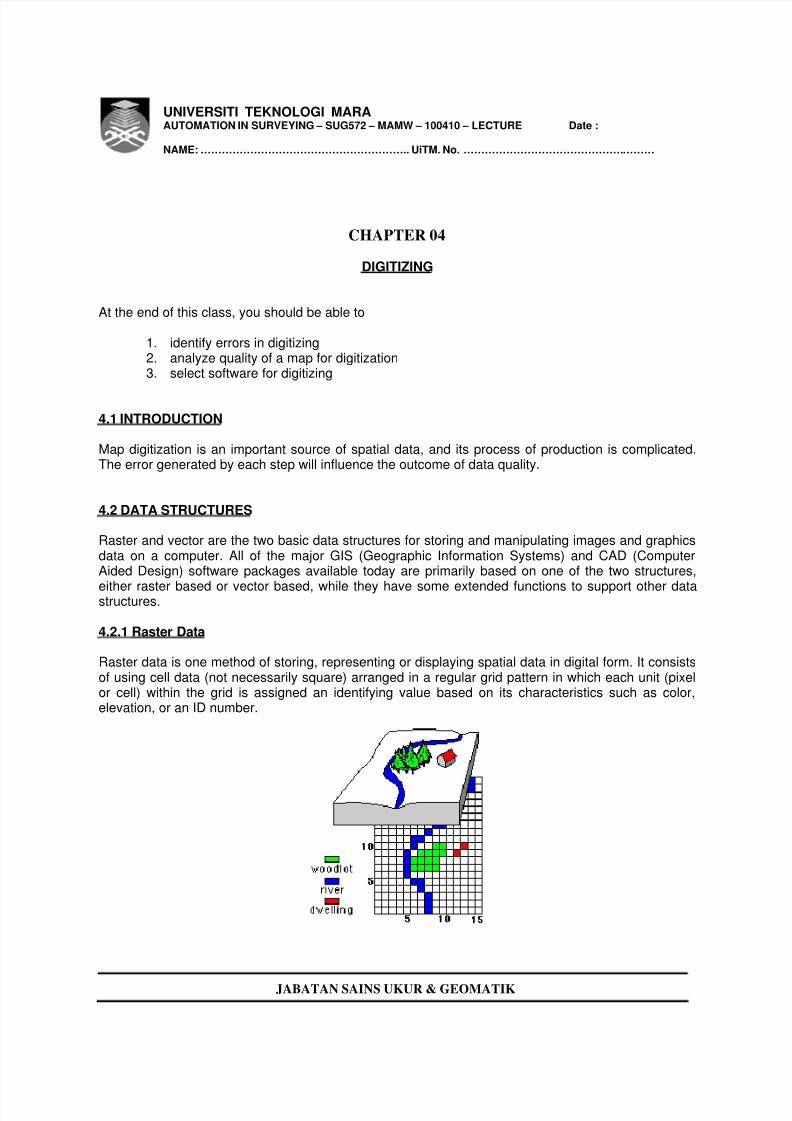
Raster data is one method of storing, representing or displaying spatial data in digital form. It consistsof using cell data (not necessarily square) arranged in a regular grid pattern in which each unit (pixelor cell) within the grid is assigned an identifying value based on its characteristics such as color,elevation, or an ID number.
8/3/2019 Sug572 - c04 - Lecture - Digitize
http://slidepdf.com/reader/full/sug572-c04-lecture-digitize 2/15
UNIVERSITI TEKNOLOGI MARAAUTOMATION IN SURVEYING – SUG572 – MAMW – 100410 – LECTURE Date :
NAME: ………………………………………………….. UiTM. No. ………………………………………………
JABATAN SAINS UKUR & GEOMATIK
Raster image is normally acquired by optical scanner, digital CCD camera and other raster imaging
devices. Its spatial resolution is determined by the resolution of the acquisition device and the qualityof the original data source. Because a raster image has to have pixels for all spatial locations, it isstrictly limited by how big a spatial area it can represent. When increasing the spatial resolution by 2times, the total size of a two-dimensional raster image will increase by 4 times because the number ofpixels is doubled in both X and Y dimensions. Same is true when a larger area is to be covered whenusing same spatial resolution.
Aerial photos are one commonly used form of raster data, with only one purpose, to display a detailedimage on a map or for the purposes of digitization. Other raster data sets will contain informationregarding elevation, a DEM, or reflectance of a particular wavelength of light, LANDSAT.
4.2.2 Vector Data
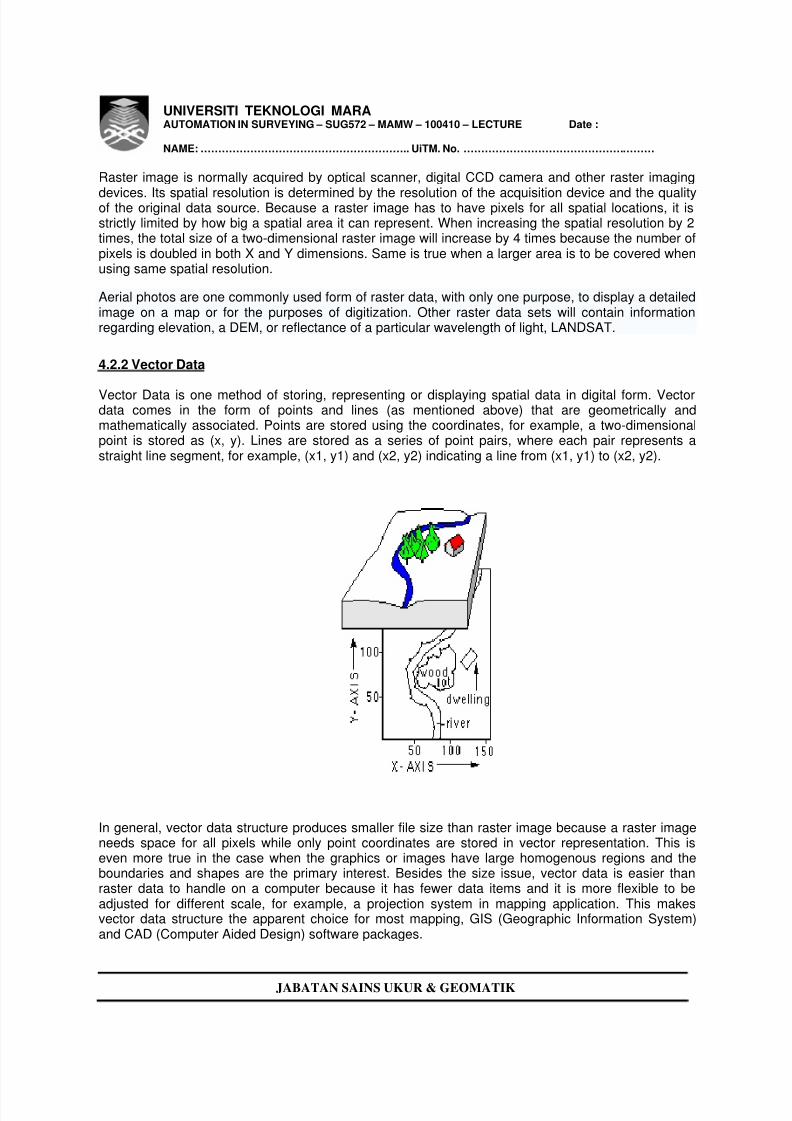
Vector Data is one method of storing, representing or displaying spatial data in digital form. Vectordata comes in the form of points and lines (as mentioned above) that are geometrically andmathematically associated. Points are stored using the coordinates, for example, a two-dimensionalpoint is stored as (x, y). Lines are stored as a series of point pairs, where each pair represents astraight line segment, for example, (x1, y1) and (x2, y2) indicating a line from (x1, y1) to (x2, y2).
In general, vector data structure produces smaller file size than raster image because a raster imageneeds space for all pixels while only point coordinates are stored in vector representation. This iseven more true in the case when the graphics or images have large homogenous regions and theboundaries and shapes are the primary interest. Besides the size issue, vector data is easier thanraster data to handle on a computer because it has fewer data items and it is more flexible to beadjusted for different scale, for example, a projection system in mapping application. This makesvector data structure the apparent choice for most mapping, GIS (Geographic Information System)and CAD (Computer Aided Design) software packages.
8/3/2019 Sug572 - c04 - Lecture - Digitize
http://slidepdf.com/reader/full/sug572-c04-lecture-digitize 3/15
UNIVERSITI TEKNOLOGI MARAAUTOMATION IN SURVEYING – SUG572 – MAMW – 100410 – LECTURE Date :
NAME: ………………………………………………….. UiTM. No. ………………………………………………
JABATAN SAINS UKUR & GEOMATIK
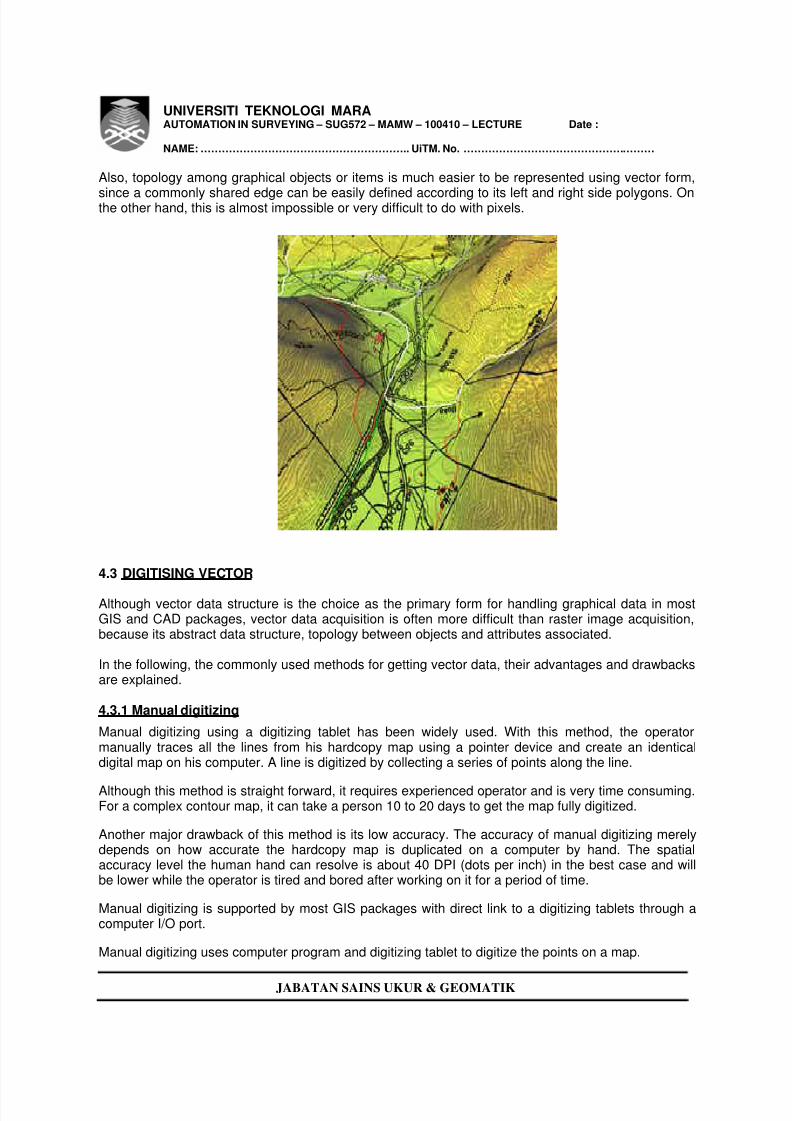
Also, topology among graphical objects or items is much easier to be represented using vector form,
since a commonly shared edge can be easily defined according to its left and right side polygons. Onthe other hand, this is almost impossible or very difficult to do with pixels.
4.3 DIGITISING VECTOR
Although vector data structure is the choice as the primary form for handling graphical data in mostGIS and CAD packages, vector data acquisition is often more difficult than raster image acquisition,because its abstract data structure, topology between objects and attributes associated.
In the following, the commonly used methods for getting vector data, their advantages and drawbacksare explained.
4.3.1 Manual digitizing
Manual digitizing using a digitizing tablet has been widely used. With this method, the operatormanually traces all the lines from his hardcopy map using a pointer device and create an identicaldigital map on his computer. A line is digitized by collecting a series of points along the line.
Although this method is straight forward, it requires experienced operator and is very time consuming.For a complex contour map, it can take a person 10 to 20 days to get the map fully digitized.
Another major drawback of this method is its low accuracy. The accuracy of manual digitizing merelydepends on how accurate the hardcopy map is duplicated on a computer by hand. The spatialaccuracy level the human hand can resolve is about 40 DPI (dots per inch) in the best case and willbe lower while the operator is tired and bored after working on it for a period of time.
Manual digitizing is supported by most GIS packages with direct link to a digitizing tablets through acomputer I/O port.
Manual digitizing uses computer program and digitizing tablet to digitize the points on a map.
8/3/2019 Sug572 - c04 - Lecture - Digitize
http://slidepdf.com/reader/full/sug572-c04-lecture-digitize 4/15
UNIVERSITI TEKNOLOGI MARAAUTOMATION IN SURVEYING – SUG572 – MAMW – 100410 – LECTURE Date :
NAME: ………………………………………………….. UiTM. No. ………………………………………………
JABATAN SAINS UKUR & GEOMATIK
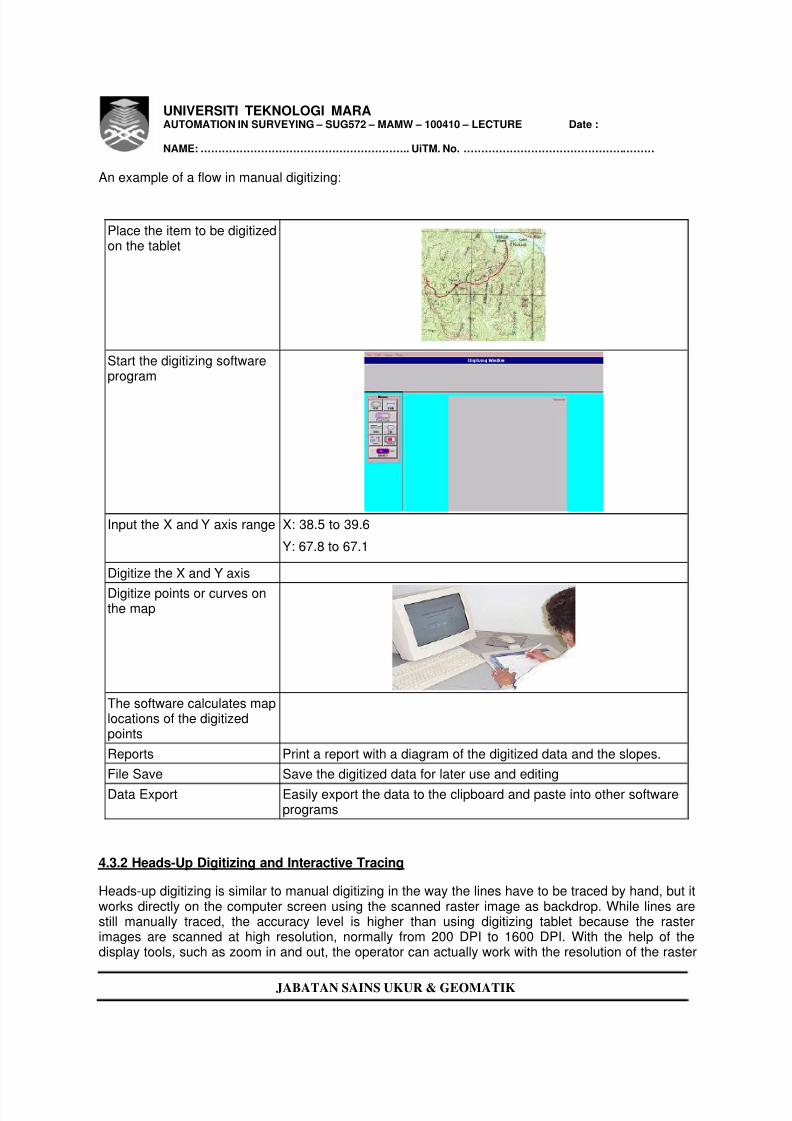
An example of a flow in manual digitizing:
Place the item to be digitizedon the tablet
Start the digitizing softwareprogram
Input the X and Y axis range X: 38.5 to 39.6
Y: 67.8 to 67.1
Digitize the X and Y axis
Digitize points or curves onthe map
The software calculates maplocations of the digitizedpoints
Reports Print a report with a diagram of the digitized data and the slopes.
File Save Save the digitized data for later use and editing
Data Export Easily export the data to the clipboard and paste into other softwareprograms
4.3.2 Heads-Up Digitizing and Interactive Tracing
Heads-up digitizing is similar to manual digitizing in the way the lines have to be traced by hand, but itworks directly on the computer screen using the scanned raster image as backdrop. While lines arestill manually traced, the accuracy level is higher than using digitizing tablet because the rasterimages are scanned at high resolution, normally from 200 DPI to 1600 DPI. With the help of thedisplay tools, such as zoom in and out, the operator can actually work with the resolution of the raster
8/3/2019 Sug572 - c04 - Lecture - Digitize
http://slidepdf.com/reader/full/sug572-c04-lecture-digitize 5/15
UNIVERSITI TEKNOLOGI MARAAUTOMATION IN SURVEYING – SUG572 – MAMW – 100410 – LECTURE Date :
NAME: ………………………………………………….. UiTM. No. ………………………………………………
JABATAN SAINS UKUR & GEOMATIK
data therefore digitize at a higher accuracy level. However, the accuracy level is still not guaranteed
because it is highly dependent on the operator and how he digitizes. This method is also time-consuming and takes about same amount of time as the manual digitizing method.
The interactive tracing method automates individual line tracing process by tracing one line at a timeunder the guidance of the operator. This is a significant improvement over manual heads-up digitizingin terms of digitizing accuracy and speed, especially when fully automatic raster to vector conversioncan not be applied in cases such as low image quality and complex layers. The main advantage ofusing interactive tracing is the flexibility of tracing lines selectively and better operator control.
4.3.3 Automatic Raster to Vector Conversion
Automatic digitizing or so called automated raster to vector conversion, traces lines automatically fromthe scanned raster image using image processing and pattern recognition techniques. The ideabehind automated raster to vector conversion algorithm is to let the computer do the actual line tracingand eliminate tedious manual tracing the human operator has to do.
Because of the importance to automate raster to vector conversion process and the difficultiesinvolved, it has been a major research focus during the past two decades. Only in recent years,automated raster to vector conversion software on PCs and small computers become practical andcommercially available for data acquisition applications.
4.3.4 Advantages and disadvantages
i. There are advantages and disadvantages to using a raster or vector data model to representreality.
ii. Raster datasets record a value for all points in the area covered which may require more
storage space than representing data in a vector format that can store data only where needed.
iii. Raster data also allows easy implementation of overlay operations, which are more difficultwith vector data. Vector data can be displayed as vector graphics used on traditional maps, whereasraster data will appear as an image that, depending on the resolution of the raster file, may have ablocky appearance for object boundaries.
iv. Vector data can be easier to register, scale, and re-project. This can simplify combining vectorlayers from different sources.
v. Vector data is more compatible with relational database environments. They can be part of arelational table as a normal column and processed using a multitude of operators.
vi. The file size for vector data is usually much smaller for storage and sharing than raster data.Image or raster data can be 10 to 100 times larger than vector data depending on the resolution.
vii. Another advantage of vector data is that it is easy to update and maintain. For example, anew highway is added. The raster image will have to be completely reproduced, but the vector data,"roads," can be easily updated by adding the missing road segment.
viii. In addition, vector data allows much more analysis capability, especially for "networks" suchas roads, power, rail, telecommunications, etc. For example, with vector data attributed with thecharacteristics of roads, ports, and airfields, allows the analyst to query for the best route or method oftransportation. In the vector data, the analyst can query the data for the largest port with an airfield
8/3/2019 Sug572 - c04 - Lecture - Digitize
http://slidepdf.com/reader/full/sug572-c04-lecture-digitize 6/15
UNIVERSITI TEKNOLOGI MARAAUTOMATION IN SURVEYING – SUG572 – MAMW – 100410 – LECTURE Date :
NAME: ………………………………………………….. UiTM. No. ………………………………………………
JABATAN SAINS UKUR & GEOMATIK
within 60 miles and a connecting road that is at least two lane highway. Raster data will not have all
the characteristics of the features it displays.
4.4 ERRORS in MAP SCANNIG DIGITIZATION
Errors in map scanning digitization are mainly caused by the data source, digital hardware, digitalsoftware, and operator factors .
4.4.1 Data Source
i. Uncertainty of Map Inherent Error
Map inherent error refers to error of original map itself for the digitization, map inherent error can notbe controlled in the process of digital map, which directly impacts on mapping precision. Main causes
of inherent errors is caused by map projection error, measurement error, control point plotting error,map compilation errors. Map inherent error are clearly printed on the provision in the correspondingcartography and manufacturing specifications, but it is difficult to determine the relationship on errors,therefore, it is difficult to make an accurate assessment on data quality caused by map inherent error.
ii. Uncertainty of Map Deformation:
Because of the long-term storage, map will produce distortion and ambiguous surface or surfacecontamination with changes in temperature and humidity. Drawing materials for digitization aregenerally polyester film, its deformation is generally less than 0. 2 ‰. Deformation of drawing isrelatively large with changes in temperature and humidity, the paper size may change 1.6% under thesame temperature when humidity change from 0% to 25%. Because the paper's expansion andcontraction rate is not the same, even if the moisture is back to the original size, the drawing can not
restore the original size. And a standard of measure is within the scope of error, the range itself isuncertain, so drawing deformation errors can not be ignored on the accuracy of the results.
iii. Uncertainty of Measurement and Description about Map Elements:
There is a fixed sign for point feature that only signifies its geographic location and attribute, and thatcan not signify actual size; linear feature drawn in no scale can only express its length and can notexpress its width; for area feature, its border is drawn in accordance with the provisions rather thanthe actual feature on the width of border, so it is uncertainty.
4.4.2 Digitization Hardware
Uncertainty of map digitization hardware mainly dues to the scanning equipment. Map scanning error
is an important error source of scanning digitization. The quality of scanner directly affects quality ofmap scanning image; scanner quality is good or bad due to the technical parameters of the scanneritself. The resolution and accuracy of scanner is essential to quality of the results of the scanningdigitization. Scholars have studied relationship of the size of map scanning resolution and dataprecision of the results, and deduce the formula between the scanning resolution and the accuracy ofcorresponding results. But an error can be caused by several reasons, and there is no clearcorrespondence, so it is uncertainty, and the scanning error will accumulate to the next process andaffect the quality of image processing.
8/3/2019 Sug572 - c04 - Lecture - Digitize
http://slidepdf.com/reader/full/sug572-c04-lecture-digitize 7/15
UNIVERSITI TEKNOLOGI MARAAUTOMATION IN SURVEYING – SUG572 – MAMW – 100410 – LECTURE Date :
NAME: ………………………………………………….. UiTM. No. ………………………………………………
JABATAN SAINS UKUR & GEOMATIK
4.4.3 Digital Processing
i. Uncertainty of Digital Processing
Software plays an important role in the process of digitization map. Digitization map generally usessoftware with the scanner itself or common processing software, processing software is only relativelysuitable for digital processing, because processing power of various software is different, and theparameters setted are different, so the results are different in dealing with the same problem.Uncertainty of software error affects quality of image processing and map orientation accuracy.
ii. The Uncertainty of the Operator:
Digital processing is inseparable from human action, it is uncertain on the human visual error andoperational levels, so that processing results will be different by different operators on the same
image, uncertainty of operators will affect the final image quality , but no specific amount of this impactis measured.
iii. The Uncertainty of Geometric Correction:
Geometric correction is to correct drawing deformation errors and scanning errors. During geometriccorrection process, correction model is created by using multiple control points, because of a numberof control points chosen randomly and the correction model similarly, it is uncertain of effect on thequality of the results caused by these factors.
4.5 MAP DATA QUALITY
Based on the characteristics of map digitization, the data quality model of map digitization is definedas follows:
First grade quality element is divided into position accuracy, attribute accuracy, logical consistency,completeness and correctness. Among them, the position accuracy is divided into plane positionaccuracy and height accuracy; attribute accuracy is divided into property values and attributes edgeaccuracy; logical consistency is divided into the data format consistency and time consistency;completeness and correctness include mathematics, graphics, property, time, complete and accuratemetadata. Data quality model may help data producers to control quality well targeted in theproduction process to ensure data quality of results; quality evaluation based on quality model mayhelp data users to choose their own spatial data according to spatial data quality report.
4.6 QUALITY CONTROL OF MAP DIGITIZATION
Quality control of map digitization is mainly process control and outcome control, process controlincludes quality control of the preprocessing before digital mapping and map digitization process;quality control of results is the timely inspection and evaluation of data error and precision and takescorresponding measures to reduce the impact of errors on the results. Data quality control runsthrough the digital process
4.6.1 Data Quality Control of Map
i. Quality Control of Original MapIt is one of the key factors for quality of scanning original map to ensure the quality of the outcome.Therefore, the data source error is controlled within the quality requirements. According to user’s
8/3/2019 Sug572 - c04 - Lecture - Digitize
http://slidepdf.com/reader/full/sug572-c04-lecture-digitize 8/15
UNIVERSITI TEKNOLOGI MARAAUTOMATION IN SURVEYING – SUG572 – MAMW – 100410 – LECTURE Date :
NAME: ………………………………………………….. UiTM. No. ………………………………………………
JABATAN SAINS UKUR & GEOMATIK
needs and the application purpose for outcome data, user selects data sources to meet the
requirements ,which is a key role for data quality in the outcome.
It is required strong updating, smooth and no folding, surface cleaning, elements clear and no localdeformation for original map provided ,so it is necessary to try to collect the latest maps; then, it isnecessary to analyze and evaluate the original map and put forward feasible options and solvemethods of existing problems. Enhancing pretreatment examination for topographic map andcontroling elevation error of added the point. Edge elements of adjacent maps are required by one toensure the identical location and property. It can not only reduce digitization errors but also improvethe efficiency of digitization through the pretreatment for data source of low quality .If the original mapis too much deformed, then it is necessary to scan sub-domain; map is scanned with color scanningto obtain color raster maps for surface elements complex and convenient interpretation of themap forthe operator.
The errors of the original map have a corresponding requirement on GB. For example, according toGB/T17106 - 1997 “1:500,1:1000,1:2000 topographic map digitization specification”,a part of providesare as follows:
a) Original Quality Requirement : Original materials should be polyester film, thedeformation should be equal orless than 0. 2‰.
b) Accuracy: Position error of figure profile is equal or less than 0. 15mm, side error of mapprofile is equal or less than 0. 2mm, diagonal error of chart Profile is equal or less than 0.3mm. plane displacement error of point features is equal or less than ± 0. 25cm, planedisplacement error of linear and flat elements is equal or less than± 0. 3mm.
c) It should be expressed clearly and correctly to the surface features, topography, water,
vegetation, residential areas and other factors on original map
4.6.2 Quality Control of Hardware
Scanner with high precision and high resolution can improve the image quality, but the amount of datawill increase exponentially to result in data processing problems. Therefore, it is important to choosethe appropriate scanning accuracy and resolution. Digital scanning resolution is no less than 300DPIby analyzing sampling theory and elements of line width of topographic map and taking into accountthe scanning errors and image processing error.
4.6.3 Quality Control of Geometric Correction
Electing the appropriate correction model and gray resampling methods and using automatic
centering algorithm to improve point coordinate measurement precision, arranging operator to correctunifiedly, making the local geometric correction according to grid to reduce geometric correction error.After that, figure profile and public network lines are generated by the figure theory coordinates, andchecking the accuracy of geometric correction and controlling geometric correction accuracy in lessthan 10mm.
4.6.4 Quality Control of Map Orientation
Selecting the appropriate orientation model according to design requirements. Selecting a sufficientnumber oforientation points according to model selected, figure points are as orientation points, and increasingorientation points according to requirement. Oriented by a number of known points; improving
8/3/2019 Sug572 - c04 - Lecture - Digitize
http://slidepdf.com/reader/full/sug572-c04-lecture-digitize 9/15
UNIVERSITI TEKNOLOGI MARAAUTOMATION IN SURVEYING – SUG572 – MAMW – 100410 – LECTURE Date :
NAME: ………………………………………………….. UiTM. No. ………………………………………………
JABATAN SAINS UKUR & GEOMATIK
measurement precision of directional point coordinate; using directional point coordinates to assess
directional accuracy, and editing the control points to improve directional precision.
The directional accuracy of the map is discussed by adopting a similar transformation and affinetransformation, we assume that the maximum of directional errors affecting accuracy of outcome doesnot exceed the map 0. 15mm, then, directed by 4 points, the orient accuracy should not exceed themap 0.10mm; directed by nine points, the orient accuracy should not exceed the map 0. 15mm.
4.6.5 Quality Control of Screen Digitization
Digital program is uniformly laid down ,including layering, property definition of layer, covering classesof each floor, terrain display color, width of lines, which provides for the operator to directly call;operator must grasp a skilled digital technology and rich experience.
Selecting software that is easy to operate, reliable and the higher cost-effective, usually using semi-automated manner for human-computer interoperability, making human intervention in thedisconnection and noise to control data quality in real time.
In the amplification conditions, the vector element is nested on the raster image to ensure the errornested less than 1 pixel; the maximum of quality control indicators is as follows:
sampling point density (0.2mm) , bonding distance (0.02mm),hanging distance (0.007mm), refining distance (0.007mm) andthe texture distance (0.01mm)[12].
4.6.2 Quality Control of Spatial Data
1) Quality Control of Metadata
The situation and change about data quality can beunderstanded by tracking metadata. Metadataquality controlincludes:
• Data integrity checking, such as integrity checking ofattribute items and the integritychecking of elements.
• Time accuracy checking, including the publication time checking of data sources, dataupdated time checking and data collection time checking.
• Data description and documentation checking, including metadata checking and a variety ofdata for inspection.
2) Quality Control of Geometric Data
Some problems may arise in the map digitization, for example, space points are lost or repeated, theline is too long or too short, regional identification points are missed. For this, it is used that visualinspection, logic testing and graphical inspection to check and process. Including:
Coordinates in edge nodes are in consistent for node matching; endpoint should beaccurately coincide in the edge when line endpoints connect to the middle of other side ;
Each segment endpoint of map edge should overlap in the edge of the map. Nodes may bedisplayed in different colors according to the different number of arc connected with nodes, the dataquality is checked and corrected by human-computer interaction through the study of different colornodes.
8/3/2019 Sug572 - c04 - Lecture - Digitize
http://slidepdf.com/reader/full/sug572-c04-lecture-digitize 10/15
UNIVERSITI TEKNOLOGI MARAAUTOMATION IN SURVEYING – SUG572 – MAMW – 100410 – LECTURE Date :
NAME: ………………………………………………….. UiTM. No. ………………………………………………
JABATAN SAINS UKUR & GEOMATIK
3) Quality Control of Topology Relationship
Topology rules are topology constraints of user-specified spatial data and data met, such as theadjacent relationship between the elements , connecting relationship, covering the relationship andthe intersection relations. If a layer of data exists in editing problems, topological relations need bereestablished in accordance with the provisions.
4) Quality Control of Data Edge
For location edge accuracy, moving any element according to original image when the distancebetween corresponding elements of adjacent maps is less than 0.3mm; each element respectively ismoved half according to the original image when the distance between corresponding elements ofadjacent maps is between the 0.3mm and 0.6mm; edging according to a general mapping principleswhen the distance between corresponding elements of adjacent maps is greater than 0.6mm.
4.7 CHALLENGES IN DOING RASTER TO VECTOR CONVERSION
While vector data structure provides a simpler and more abstract data representation than rasterimage, it is not easy to do an automatic conversion from raster to vector, or so called vectorizationprocess, although the opposite direction (from vector to raster) is quite trivial. There have beenextensive research efforts focused on the issued involved in raster to vector conversion during thepast decades.
A complete raster to vector conversion process includes image acquisition, pre-processing, linetracing, text extraction (OCR), shape recognition, topology creation and attribute assignment.
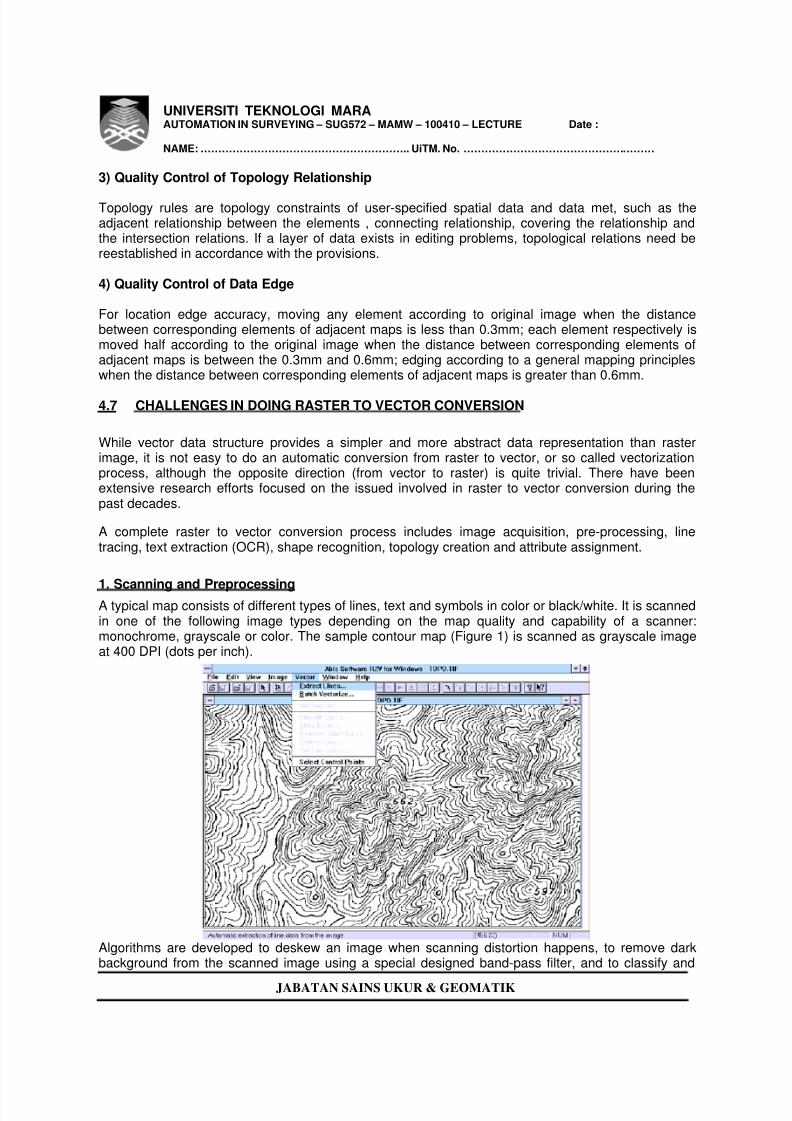
1. Scanning and PreprocessingA typical map consists of different types of lines, text and symbols in color or black/white. It is scannedin one of the following image types depending on the map quality and capability of a scanner:monochrome, grayscale or color. The sample contour map (Figure 1) is scanned as grayscale imageat 400 DPI (dots per inch).
Algorithms are developed to deskew an image when scanning distortion happens, to remove darkbackground from the scanned image using a special designed band-pass filter, and to classify and
8/3/2019 Sug572 - c04 - Lecture - Digitize
http://slidepdf.com/reader/full/sug572-c04-lecture-digitize 11/15
UNIVERSITI TEKNOLOGI MARAAUTOMATION IN SURVEYING – SUG572 – MAMW – 100410 – LECTURE Date :
NAME: ………………………………………………….. UiTM. No. ………………………………………………
JABATAN SAINS UKUR & GEOMATIK
separate colors using a clustering based unsupervised classification method when a color map is
scanned and vectorized. A raster image can also be registered another image with the image warpingfunction. This is often done to correct map distortion and increase the accuracy of later geo-referencing.
2. Automatic VectorizationAn optimal thresholding algorithm is developed to convert a grayscale image to binary form forvectorization. All lines, text and symbols are automatically vectorized and recorded in a vector form,i.e., line segments are represented by the center X and Y coordinates along the line. The accuracylevel is maintained at the original scanning resolution (in our example, 400DPI) as the center pixel isalways traced and recorded. Text are first vectorized as lines and then recognized using R2V's
trainable OCR (optical character recognition) engine.
3. Vector Editing and Cleaning
Broken lines are connected using the line snapping algorithm, which uses a user specified gap threshold value to
connect lines that match the snapping criteria. Line smoothing uses a polyline generalization technique to
remove rough points caused by local noise and artifacts caused raster image scanning.
A line editor is implemented to provide on-screen editing of vector data. It includes adding new lines manually
or semi-automatically using line tracing algorithm, line merging and spliting, node editing, and line labeling
functions.
4. Text Detection and Recognition (OCR)Text symbols in a map often come in different orientations and fonts. Detecting and recognizing texton a map has been a challenge because of the complexity and mixture of text objects and vector linesand polygons. Our text recognition involves following steps:
1) Text are vectorized as lines in the vectorization process and marked and grouped using a textblock detection algorithm. The grouping indicates the letters belong to a group to form a word or anumber. Editing functions are implemented to add or remove misdetected text blocks.2) A OCR signature set is created from the training function. The signature set can be used to othermaps with text of similar style and font.3) Apply text recognition. The text recognition (OCR) engine uses the trained signature set tocompare against the text symbols detected and make a decision based on the maximum probabilitycalculated.Text attributes can be automatically converted to text string with OCR functions in R2V. The textstrings can be used directly to label polygons or lines. It is often used in tax map digitizing andlabeling.
5. Automatic Polygon Layer Creation
For maps with polygons, such as parcel or tax maps, polygons are closed with a polygon generatingalgorithm to create polygon topology and remove redundant lines. The polygon generating algorithmuses a user specified gap threshold to check if a line belongs to a closed polygon. At eachintersection, the algorithm uses the search angle to determine the next line segment for the smallestclosed polygon.
6. Automatic or Interactive Vector LabelingFor polygons and lines, a numerical ID value is attached using the interactive line labeling function orthe automatic labeling function if ID values exist in the map and are converted using the OCRfunction. The ID values are maintained when the vector data is exported to ArcInfo or ArcView systemand used together with their attribute database.

8/3/2019 Sug572 - c04 - Lecture - Digitize
http://slidepdf.com/reader/full/sug572-c04-lecture-digitize 12/15
UNIVERSITI TEKNOLOGI MARAAUTOMATION IN SURVEYING – SUG572 – MAMW – 100410 – LECTURE Date :
NAME: ………………………………………………….. UiTM. No. ………………………………………………
JABATAN SAINS UKUR & GEOMATIK
When vectorizing a parcel map, the parcel ID for each parcel is assigned automatically if they are
successfully recognized by the text recognition function and available in numeric form. In the case ofdigitizing a contour map, elevation values are assigned automatically by going from a lower elevationcontour line to a higher elevation contour with a given starting and increment elevation values.
7. Geo-referencingGeo-referencing is a crucial part of data capture for GIS and mapping applications. Two types ofgeometric transformation methods, least square bi-linear and Delaunay Triangulation methods can becreated. The least square method is suitable for geo-referencing maps when a small number ofcontrol points are available and global geometric correction is needed. The Delaunay Triangulation ismore effective when large number of control points are available. With Delaunay Triangulationmethod, control point locations are maintained as specified after the transformation and localgeometric distortion are corrected more efficient.
The bi-linear method when geo-referencing both raster image and vector data will be used by ArcInfoor ArcView, which use similar method for geometric transformation.
8. Save to ArcInfo Generate or ArcView ShapefileThe final digitized map with lines and points labeled is then saved to ArcInfo generate or ArcViewShapefile formats for use in a GIS or mapping application. A digitized contour map with all theirelevation values labeled can be directly used as a sparse DEM. Figure 2 shows the digitized contourmap using R2V's automatic vectorization function.
8/3/2019 Sug572 - c04 - Lecture - Digitize
http://slidepdf.com/reader/full/sug572-c04-lecture-digitize 13/15
UNIVERSITI TEKNOLOGI MARAAUTOMATION IN SURVEYING – SUG572 – MAMW – 100410 – LECTURE Date :
NAME: ………………………………………………….. UiTM. No. ………………………………………………
JABATAN SAINS UKUR & GEOMATIK
The image acquisition process generates the initial raster image at a certain spatial resolution. The
quality and resolution of the raster image are key factors for the quality and accuracy of the vectorizeddata. It is always recommended to start with clean and sharp originals and scan at reasonableresolution. The scanning resolution should match the resolution at which the original image sourcewas created. If scanning resolution is set too high than the original image source, it not only usesunnecessary amount of system resource to process, but also noise and artifact are scanned.
For most good quality black and white maps and engineering drawing, such as color map separates,can be scanned as 1-bit monochrome. For maps with dirty and smearing background, they can bescanned as 8-bit greyscale and enhanced using imaging software to remove background and noise.
Although color scanners have come a long way, large format and high resolution scanning is still quiteexpensive. Color classification and color separation are very sensitive to the color quality of thescanned image. Other color images, such as satellite and aerial photos, have been used directly to
create vector data, such as region boundaries, street and road lines. Because of more bits (normally24-bit) are used, color image files are normally bigger and requires more system resource to storeand process.
Recent developments in automated raster to vector conversion technology have made it possible totake a hardcopy image, scan it and convert it into vector format in a matter of minutes or evenseconds. With manual method using a digitizing tablet, this process can take days or weeks tocomplete because all lines have to be traced by hand.
4.8 CHOOSING THE RIGHT CONVERION TOOL
There are quite a few commercial packages available for raster to vector conversion. Below are fewquestions one should ask when selecting the right tool for the task:
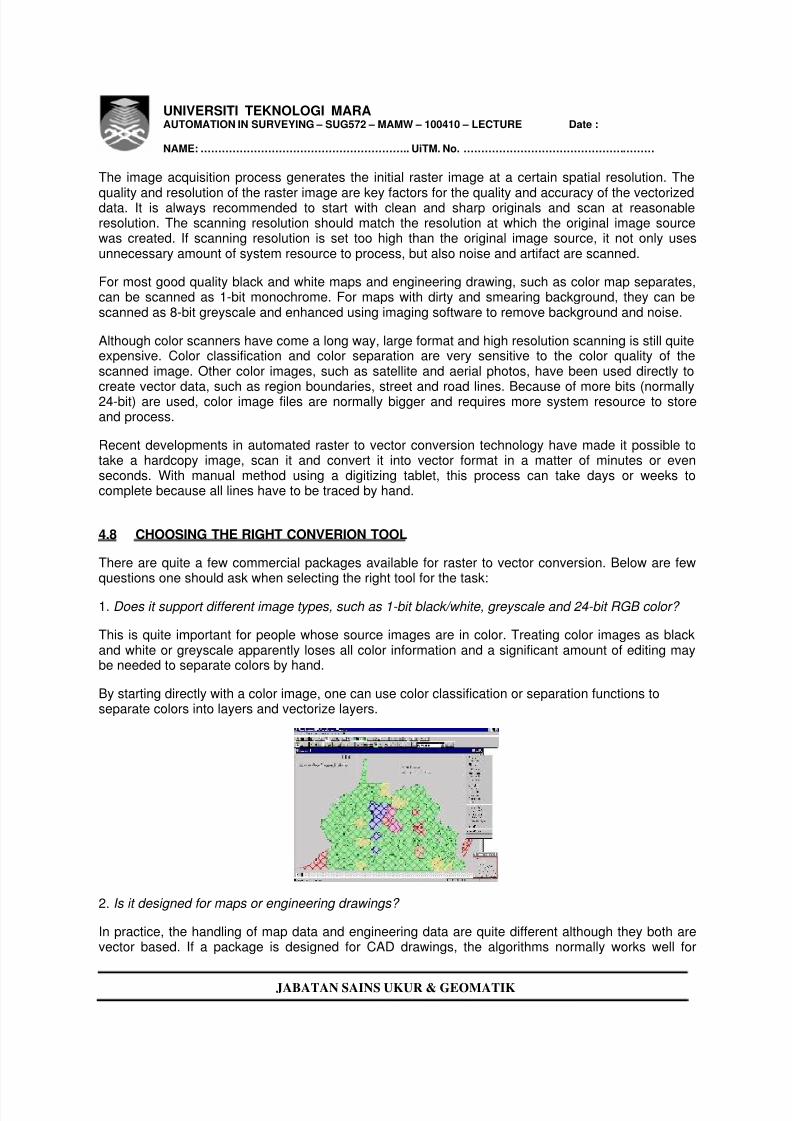
1. Does it support different image types, such as 1-bit black/white, greyscale and 24-bit RGB color?
This is quite important for people whose source images are in color. Treating color images as blackand white or greyscale apparently loses all color information and a significant amount of editing maybe needed to separate colors by hand.
By starting directly with a color image, one can use color classification or separation functions toseparate colors into layers and vectorize layers.
2. Is it designed for maps or engineering drawings?
In practice, the handling of map data and engineering data are quite different although they both arevector based. If a package is designed for CAD drawings, the algorithms normally works well for
8/3/2019 Sug572 - c04 - Lecture - Digitize
http://slidepdf.com/reader/full/sug572-c04-lecture-digitize 14/15
UNIVERSITI TEKNOLOGI MARAAUTOMATION IN SURVEYING – SUG572 – MAMW – 100410 – LECTURE Date :
NAME: ………………………………………………….. UiTM. No. ………………………………………………
JABATAN SAINS UKUR & GEOMATIK
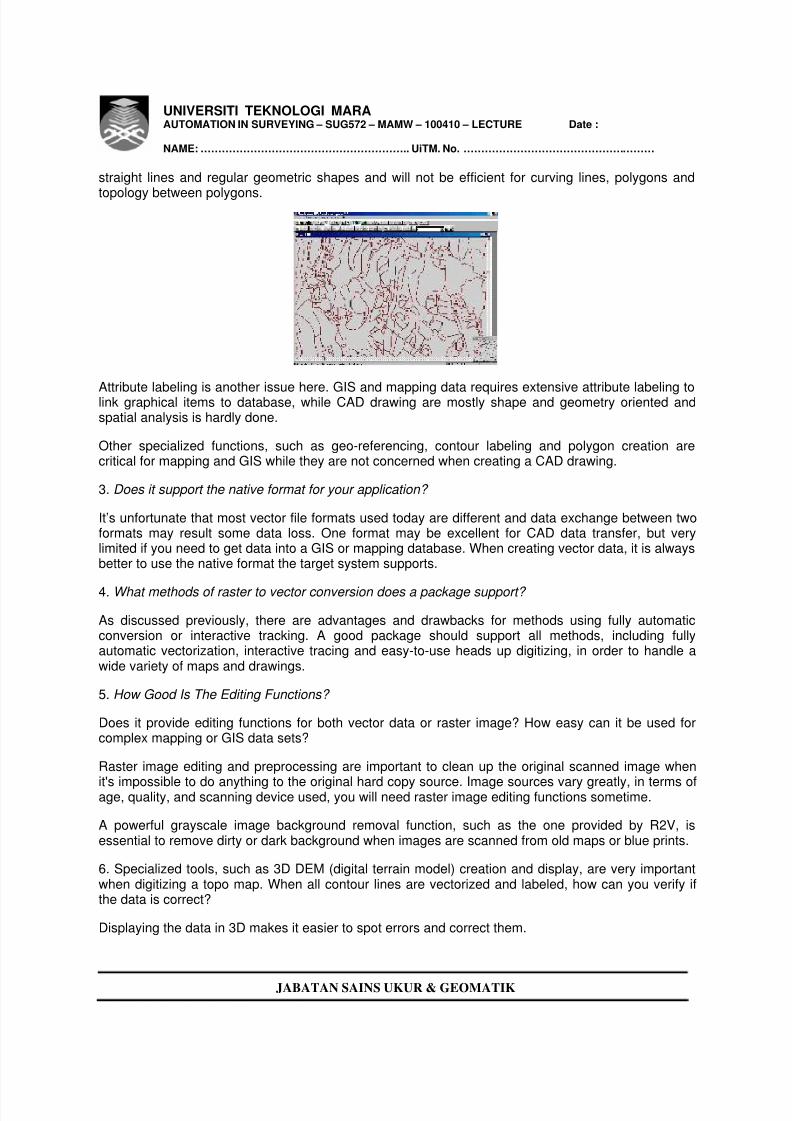
straight lines and regular geometric shapes and will not be efficient for curving lines, polygons and
topology between polygons.
Attribute labeling is another issue here. GIS and mapping data requires extensive attribute labeling tolink graphical items to database, while CAD drawing are mostly shape and geometry oriented andspatial analysis is hardly done.
Other specialized functions, such as geo-referencing, contour labeling and polygon creation arecritical for mapping and GIS while they are not concerned when creating a CAD drawing.
3. Does it support the native format for your application?
It’s unfortunate that most vector file formats used today are different and data exchange between twoformats may result some data loss. One format may be excellent for CAD data transfer, but verylimited if you need to get data into a GIS or mapping database. When creating vector data, it is alwaysbetter to use the native format the target system supports.
4. What methods of raster to vector conversion does a package support?
As discussed previously, there are advantages and drawbacks for methods using fully automaticconversion or interactive tracking. A good package should support all methods, including fullyautomatic vectorization, interactive tracing and easy-to-use heads up digitizing, in order to handle awide variety of maps and drawings.
5. How Good Is The Editing Functions?
Does it provide editing functions for both vector data or raster image? How easy can it be used forcomplex mapping or GIS data sets?
Raster image editing and preprocessing are important to clean up the original scanned image when
it's impossible to do anything to the original hard copy source. Image sources vary greatly, in terms ofage, quality, and scanning device used, you will need raster image editing functions sometime.
A powerful grayscale image background removal function, such as the one provided by R2V, isessential to remove dirty or dark background when images are scanned from old maps or blue prints.
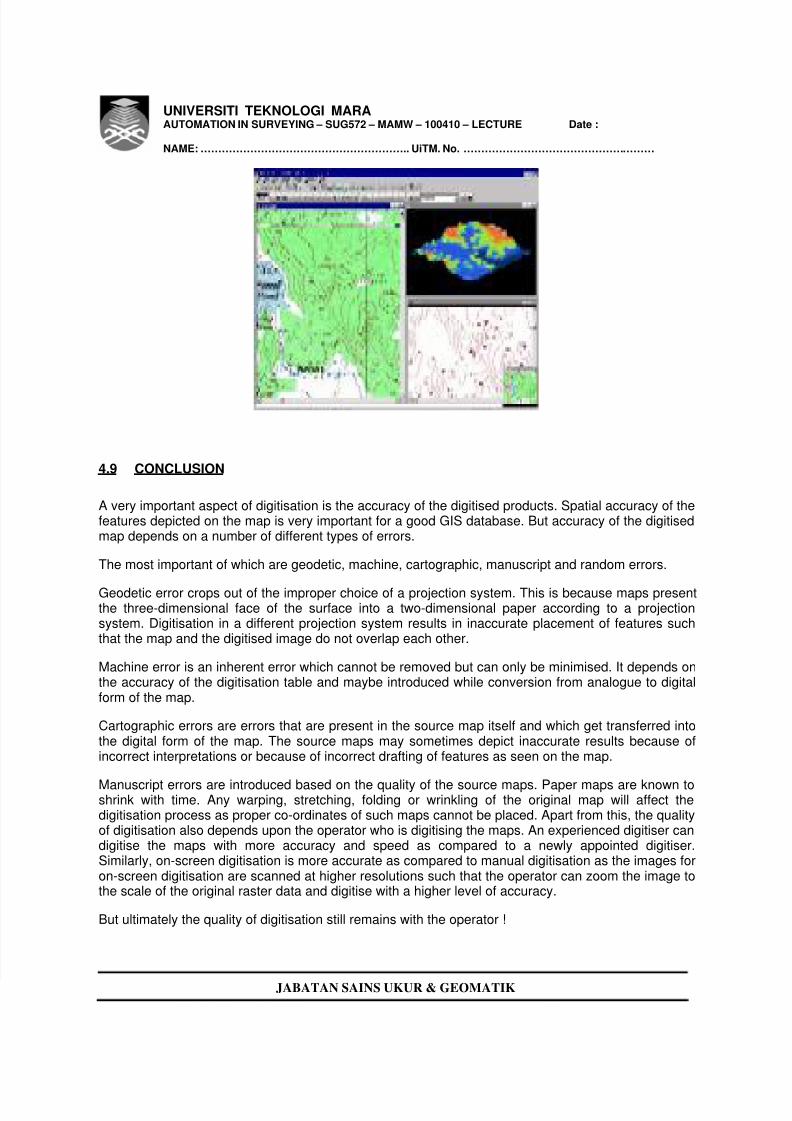
6. Specialized tools, such as 3D DEM (digital terrain model) creation and display, are very importantwhen digitizing a topo map. When all contour lines are vectorized and labeled, how can you verify ifthe data is correct?
Displaying the data in 3D makes it easier to spot errors and correct them.
8/3/2019 Sug572 - c04 - Lecture - Digitize
http://slidepdf.com/reader/full/sug572-c04-lecture-digitize 15/15
UNIVERSITI TEKNOLOGI MARAAUTOMATION IN SURVEYING – SUG572 – MAMW – 100410 – LECTURE Date :
NAME: ………………………………………………….. UiTM. No. ………………………………………………
JABATAN SAINS UKUR & GEOMATIK
4.9 CONCLUSION
A very important aspect of digitisation is the accuracy of the digitised products. Spatial accuracy of thefeatures depicted on the map is very important for a good GIS database. But accuracy of the digitisedmap depends on a number of different types of errors.
The most important of which are geodetic, machine, cartographic, manuscript and random errors.
Geodetic error crops out of the improper choice of a projection system. This is because maps presentthe three-dimensional face of the surface into a two-dimensional paper according to a projectionsystem. Digitisation in a different projection system results in inaccurate placement of features suchthat the map and the digitised image do not overlap each other.
Machine error is an inherent error which cannot be removed but can only be minimised. It depends onthe accuracy of the digitisation table and maybe introduced while conversion from analogue to digitalform of the map.
Cartographic errors are errors that are present in the source map itself and which get transferred intothe digital form of the map. The source maps may sometimes depict inaccurate results because ofincorrect interpretations or because of incorrect drafting of features as seen on the map.
Manuscript errors are introduced based on the quality of the source maps. Paper maps are known toshrink with time. Any warping, stretching, folding or wrinkling of the original map will affect thedigitisation process as proper co-ordinates of such maps cannot be placed. Apart from this, the qualityof digitisation also depends upon the operator who is digitising the maps. An experienced digitiser candigitise the maps with more accuracy and speed as compared to a newly appointed digitiser.Similarly, on-screen digitisation is more accurate as compared to manual digitisation as the images foron-screen digitisation are scanned at higher resolutions such that the operator can zoom the image tothe scale of the original raster data and digitise with a higher level of accuracy.
But ultimately the quality of digitisation still remains with the operator !