sudoku: bagging a di–culty metric building up puzzlesmorrow/mcm/team2280.pdf · sudoku: bagging a...
TRANSCRIPT
Sudoku:
Bagging a Difficulty Metric
&
Building Up Puzzles
February 18, 2008
Abstract
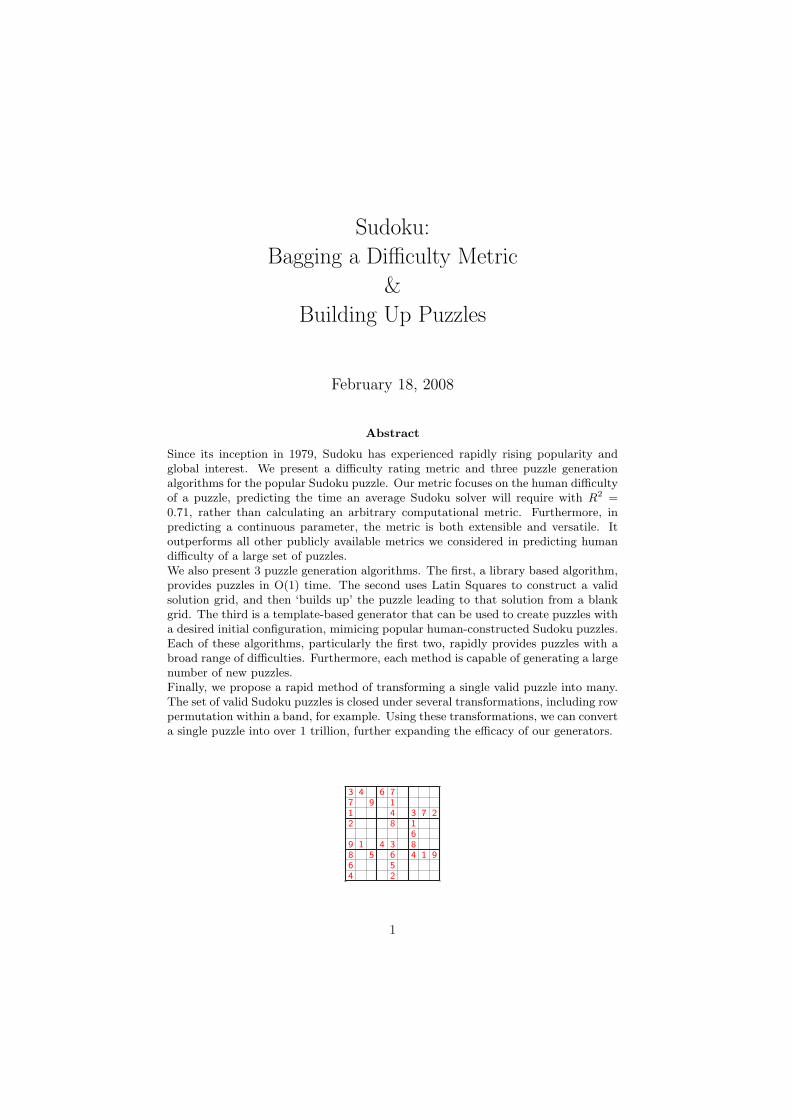
Since its inception in 1979, Sudoku has experienced rapidly rising popularity andglobal interest. We present a difficulty rating metric and three puzzle generationalgorithms for the popular Sudoku puzzle. Our metric focuses on the human difficultyof a puzzle, predicting the time an average Sudoku solver will require with R2 =0.71, rather than calculating an arbitrary computational metric. Furthermore, inpredicting a continuous parameter, the metric is both extensible and versatile. Itoutperforms all other publicly available metrics we considered in predicting humandifficulty of a large set of puzzles.We also present 3 puzzle generation algorithms. The first, a library based algorithm,provides puzzles in O(1) time. The second uses Latin Squares to construct a validsolution grid, and then ‘builds up’ the puzzle leading to that solution from a blankgrid. The third is a template-based generator that can be used to create puzzles witha desired initial configuration, mimicing popular human-constructed Sudoku puzzles.Each of these algorithms, particularly the first two, rapidly provides puzzles with abroad range of difficulties. Furthermore, each method is capable of generating a largenumber of new puzzles.Finally, we propose a rapid method of transforming a single valid puzzle into many.The set of valid Sudoku puzzles is closed under several transformations, including rowpermutation within a band, for example. Using these transformations, we can converta single puzzle into over 1 trillion, further expanding the efficacy of our generators.
3 4 6 77 9 11 4 3 7 22 8 1
69 1 4 3 88 5 6 4 1 96 54 2
1
Team 2280 Page 2 of 22
Contents
1 Introduction 41.1 History . . . . . . . . . . . . . . . . . . . . . . . . . . . . . . . . . . . . . . 41.2 Popularity . . . . . . . . . . . . . . . . . . . . . . . . . . . . . . . . . . . . . 4
2 Definition of Sudoku 4
3 Prior Work 5
4 Goals and Motivation 64.1 Difficulty Metric . . . . . . . . . . . . . . . . . . . . . . . . . . . . . . . . . 64.2 Puzzle Generation . . . . . . . . . . . . . . . . . . . . . . . . . . . . . . . . 6
5 Data 6
6 Our Difficulty Metric - Predicted Solve Time 76.1 Preliminary Model and Complexity . . . . . . . . . . . . . . . . . . . . . . . 76.2 Analysis via Bootstrapping . . . . . . . . . . . . . . . . . . . . . . . . . . . 86.3 Meta-Model via Pseudo-Bagging . . . . . . . . . . . . . . . . . . . . . . . . 96.4 Analysis of Meta-Model . . . . . . . . . . . . . . . . . . . . . . . . . . . . . 10
7 Practical Analysis of our metric 107.1 Applicability . . . . . . . . . . . . . . . . . . . . . . . . . . . . . . . . . . . 107.2 Comparison to Other Difficulty Metrics . . . . . . . . . . . . . . . . . . . . 11
8 Our Puzzle Generation Algorithms 128.1 Puzzle Transformation . . . . . . . . . . . . . . . . . . . . . . . . . . . . . . 128.2 Generator A: Library-based Generator . . . . . . . . . . . . . . . . . . . . . 13
8.2.1 Algorithm . . . . . . . . . . . . . . . . . . . . . . . . . . . . . . . . . 138.2.2 Applicability . . . . . . . . . . . . . . . . . . . . . . . . . . . . . . . 148.2.3 Complexity . . . . . . . . . . . . . . . . . . . . . . . . . . . . . . . . 158.2.4 Sample Puzzles . . . . . . . . . . . . . . . . . . . . . . . . . . . . . . 15
8.3 Generator B: Build-up from Solution . . . . . . . . . . . . . . . . . . . . . . 168.3.1 Latin Squares for Solution Generation . . . . . . . . . . . . . . . . . 168.3.2 Intelligent Brute Force Solver . . . . . . . . . . . . . . . . . . . . . . 168.3.3 Algorithm . . . . . . . . . . . . . . . . . . . . . . . . . . . . . . . . . 178.3.4 Complexity . . . . . . . . . . . . . . . . . . . . . . . . . . . . . . . . 178.3.5 Sample Puzzles . . . . . . . . . . . . . . . . . . . . . . . . . . . . . . 18
8.4 Generator C: Template Generation . . . . . . . . . . . . . . . . . . . . . . . 198.4.1 Algorithm . . . . . . . . . . . . . . . . . . . . . . . . . . . . . . . . . 198.4.2 Complexity . . . . . . . . . . . . . . . . . . . . . . . . . . . . . . . . 198.4.3 Sample Puzzles . . . . . . . . . . . . . . . . . . . . . . . . . . . . . . 19
9 Conclusion 21
Team 2280 Page 3 of 22
List of Figures
1 Sudoku Puzzle and Solution . . . . . . . . . . . . . . . . . . . . . . . . . . . 52 Box plots of Distribution of Difficulty Measures for Puzzles of 4 Difficulties.
Average Solve Time better differentiates between puzzle difficulties . . . . . 73 Relationship between Actual Solve Time and Predicted Solve Time, in min-
utes. Solve time is our difficulty metric . . . . . . . . . . . . . . . . . . . . . 84 Bootstrapping Results: Performance of Model on Test Set . . . . . . . . . . 95 Bootstrapping Results: Performance of Meta-Model on Test Set . . . . . . . 106 Valid 9x9 Sudoku Permutations . . . . . . . . . . . . . . . . . . . . . . . . . 137 Transformation of a Generated Puzzle . . . . . . . . . . . . . . . . . . . . . 148 Library Generator - Difficulty Distribution . . . . . . . . . . . . . . . . . . . 149 Library Generator - Sample Puzzles of 4 Different Difficulties . . . . . . . . 1510 Producing a Sudoku Solution from Latin Squares . . . . . . . . . . . . . . . 1611 Flow Chart of Bottom Up Generator . . . . . . . . . . . . . . . . . . . . . . 1712 Build up Generator - Sample Puzzles of 4 Different Difficulties . . . . . . . 1813 Build Up Generator - Difficulty Distribution . . . . . . . . . . . . . . . . . . 1814 Template Generator - Sample ‘MCM’ Puzzles of 4 Different Difficulties . . . 2015 Template Generator - Difficulty Distribution for ‘MCM’ puzzles . . . . . . . 20
Team 2280 Page 4 of 22
1 Introduction
Since its inception in 1979, Sudoku has experienced rapidly rising popularity and globalinterest. Sudoku puzzles are simple to understand, simple to try, though often not simpleto solve.
1.1 History
Sudoku puzzles are related to number puzzles throughout history. The set of valid 9x9Sudoku solutions are a subset of the 9x9 Latin Squares (invented in 1983 by Euler) andsimilar to the set of 9x9 Magic Squares, a puzzle invented prior to the 10th century AD.
The modern puzzle was first seen in 1979 in Dell Magazines called Number Place.Invented by the American architect Howard Garns, the puzzles soon became popular inJapan after being published by Nikoli, the first Japanese puzzle magazine [9].
Sudoku is short for “Su-ji wa dokushin ni kagiru” in Japanese, meaning “the numbersmust be single.”
1.2 Popularity
Sudoku has become a pop culture phenomenon dubbed the “fasting growing puzzle in theworld” in 2005 by the world media [11]. Hundreds, if not thousands, of web sites existto provide puzzle-addicts with their daily fix; nearly every modern newspaper includespuzzles on a daily or weekly basis.
As a result, the need for efficient and plentiful generation of puzzles has become aparticularly profitable venture - CNN Money reports that one firm received “well over $1million” in revenue in less than a year from a puzzle generating program! [8]
2 Definition of Sudoku
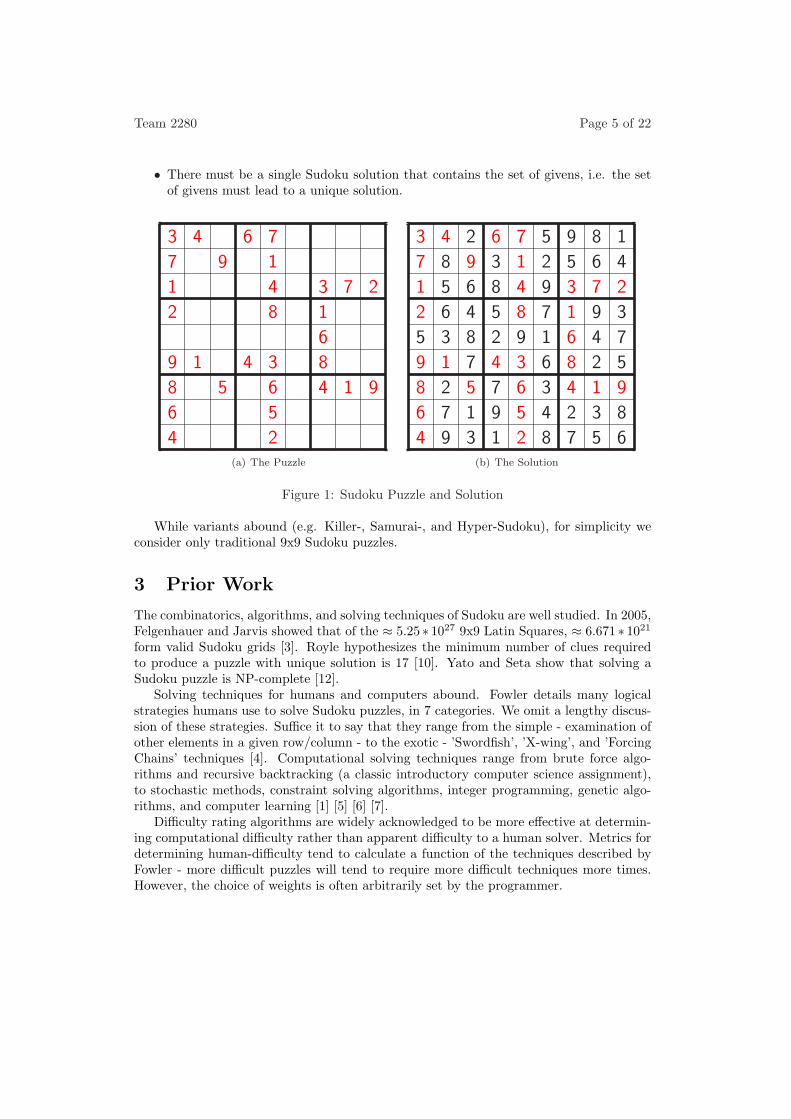
A traditional Sudoku puzzle (see Fig 1(a)) consists of a 9x9 grid of cells divided into 93x3 subsections called blocks.
A Sudoku solution (see Fig 1(b)) is such a grid with each cell containing a singlenumber, meeting the follwoing conditions:
• Every cell contains a single number between 1 and 9
• Every row contains each of the numbers 1-9 exactly once
• Every column contains each of the numbers 1-9 exactly once
• Every box contains each of the numbers 1-9 exactly once
A Sudoku puzzle is a Sudoku grid with some of the numbers filled in, called givens.The givens in a valid Sudoku puzzle must satisfy the following conditions:
• The givens do not violate any of the above rules of Sudoku
Team 2280 Page 5 of 22
• There must be a single Sudoku solution that contains the set of givens, i.e. the setof givens must lead to a unique solution.
3 4 6 7
7 9 1
1 4 3 7 2
2 8 1
6
9 1 4 3 8
8 5 6 4 1 9
6 5
4 2(a) The Puzzle
3 4 2 6 7 5 9 8 1
7 8 9 3 1 2 5 6 4
1 5 6 8 4 9 3 7 2
2 6 4 5 8 7 1 9 3
5 3 8 2 9 1 6 4 7
9 1 7 4 3 6 8 2 5
8 2 5 7 6 3 4 1 9
6 7 1 9 5 4 2 3 8
4 9 3 1 2 8 7 5 6(b) The Solution
Figure 1: Sudoku Puzzle and Solution
While variants abound (e.g. Killer-, Samurai-, and Hyper-Sudoku), for simplicity weconsider only traditional 9x9 Sudoku puzzles.
3 Prior Work
The combinatorics, algorithms, and solving techniques of Sudoku are well studied. In 2005,Felgenhauer and Jarvis showed that of the ≈ 5.25 ∗ 1027 9x9 Latin Squares, ≈ 6.671 ∗ 1021
form valid Sudoku grids [3]. Royle hypothesizes the minimum number of clues requiredto produce a puzzle with unique solution is 17 [10]. Yato and Seta show that solving aSudoku puzzle is NP-complete [12].
Solving techniques for humans and computers abound. Fowler details many logicalstrategies humans use to solve Sudoku puzzles, in 7 categories. We omit a lengthy discus-sion of these strategies. Suffice it to say that they range from the simple - examination ofother elements in a given row/column - to the exotic - ’Swordfish’, ’X-wing’, and ’ForcingChains’ techniques [4]. Computational solving techniques range from brute force algo-rithms and recursive backtracking (a classic introductory computer science assignment),to stochastic methods, constraint solving algorithms, integer programming, genetic algo-rithms, and computer learning [1] [5] [6] [7].
Difficulty rating algorithms are widely acknowledged to be more effective at determin-ing computational difficulty rather than apparent difficulty to a human solver. Metrics fordetermining human-difficulty tend to calculate a function of the techniques described byFowler - more difficult puzzles will tend to require more difficult techniques more times.However, the choice of weights is often arbitrarily set by the programmer.
Team 2280 Page 6 of 22
Publicly available generating algorithms vary in their approaches. The grand majority,however, use a randomized approach to generation. They repeatedly place a randomnumber in a random position and then check the solvability of the puzzle until the puzzlehas a unique solution.
According to Fowler, solving a Sudoku puzzle is easier than generating one, and gen-erating a puzzle is easier than evaluating its difficulty [4]. This is confirmed by Sudokuaficionados’ online forums.
4 Goals and Motivation
Goal - to provide a difficulty metric and puzzle generation algorithm that are human-applicable rather than arbitrary and esoteric.
4.1 Difficulty Metric
We seek to provide a difficultly metric that is:
• accurate - well-correlated to human difficulty data
• versatile - widely distributes Sudoku puzzles into difficulty levels
• extensible - the number and ‘difficulty’ of the levels can be changed. This can beachieved by making the metric continuous rather than discrete, and using thresh-olding to group into discrete levels
4.2 Puzzle Generation
We seek to provide a puzzle generation algorithm that is:
• efficient - provides puzzles quickly
• customizable - the user should be able to specify difficulty and receive a puzzle ofthat difficulty in response
• versatile - offers a range of difficulty levels
• scalable - can provide a few or many puzzles of a given difficulty
5 Data
Actual data derived from many individuals solving many puzzles is necessary to effectivelyevaluate the human-difficulty of a puzzle. Fortunately, the popularity of Sudoku puzzlesmakes this data easily available online.
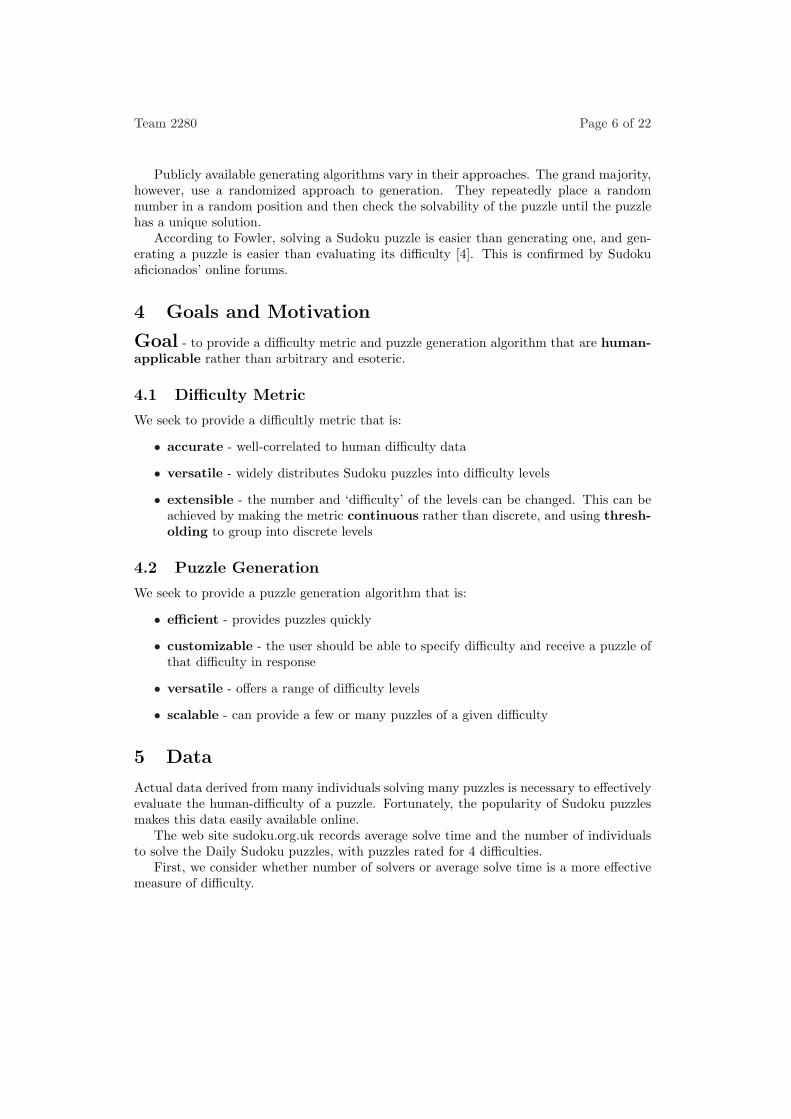
The web site sudoku.org.uk records average solve time and the number of individualsto solve the Daily Sudoku puzzles, with puzzles rated for 4 difficulties.
First, we consider whether number of solvers or average solve time is a more effectivemeasure of difficulty.
Team 2280 Page 7 of 22
(a) Number of Solvers (b) Average Solve Time
Figure 2: Box plots of Distribution of Difficulty Measures for Puzzles of 4 Difficulties.Average Solve Time better differentiates between puzzle difficulties
As seen in Fig 2, the time taken to solve a puzzle better differentiates between puzzledifficulties. Time to solve also provides a more widely distributed ‘true’ difficulty.
Intuitively, solve time is a reasonable, accurate measure. Puzzle solvers often to con-sider a puzzle’s difficulty to be the amount of time they spend working on it.
6 Our Difficulty Metric - Predicted Solve Time
We provide an predictor of Average Solve Time as a measure of difficulty, using a multipleregression model considering the number and type of solving logical strategies used tosolve a puzzle. The program ’serate’ (Sudoku Explainer) by Nicolas Juillerat is used toprovide a list of strategies used.
6.1 Preliminary Model and Complexity
Our algorithm is as follows:
• Generation of the Model
– Use ’serate’ to generate a list of the usage of 31 logical strategies for each of915 puzzles from sudoku.org.uk
– Use linear multiple regression to calculate model coefficients
• Application of the Model on a Puzzle P
– Use ’serate’ to generate a list of the usage of 31 logical strategies required tosolve P
Team 2280 Page 8 of 22
– Apply the linear model to P
The algorithm is efficient in that it precomputes the 32 model coefficients. Calculationof the predictor given the strategies used is O(1). Computation of the metric is dominatedby the determination of the logical strategies used to solve it, computed by ’serate’. Ser-ate considers each possible logical strategy at each stage of solving the puzzle, hence iscomputationally intensive. On a modern computer, 15 puzzles are processed in 1 second.
6.2 Analysis via Bootstrapping
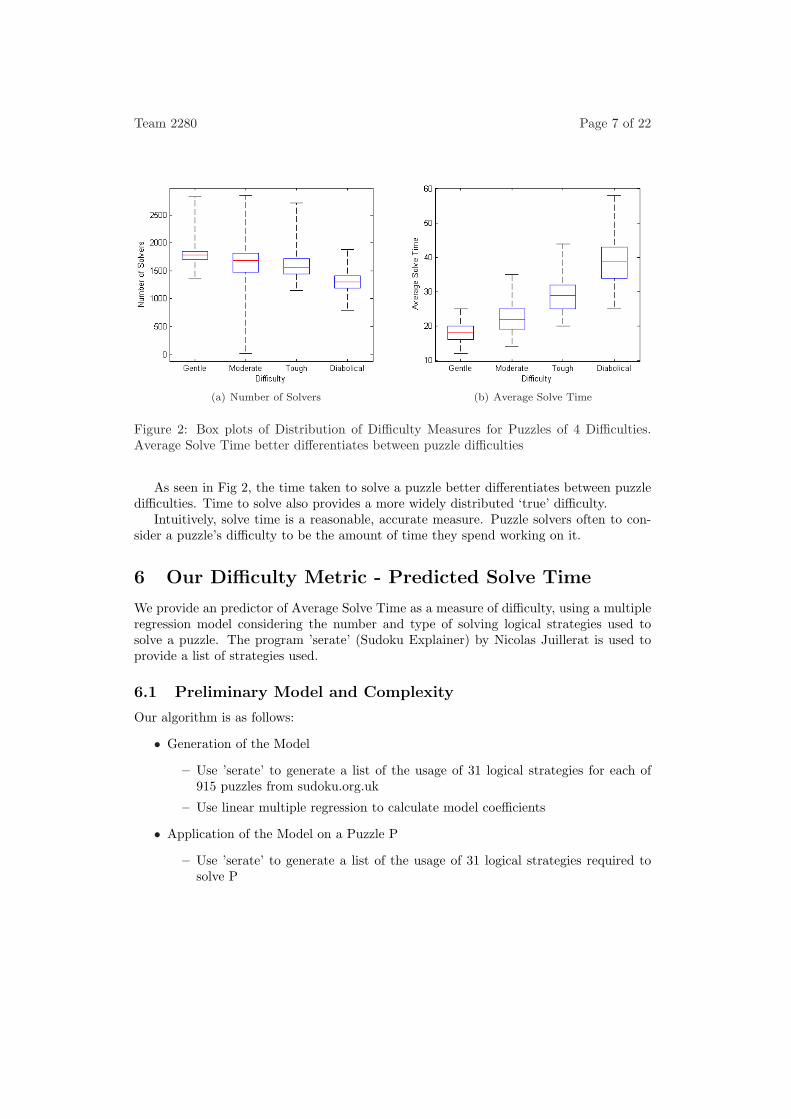
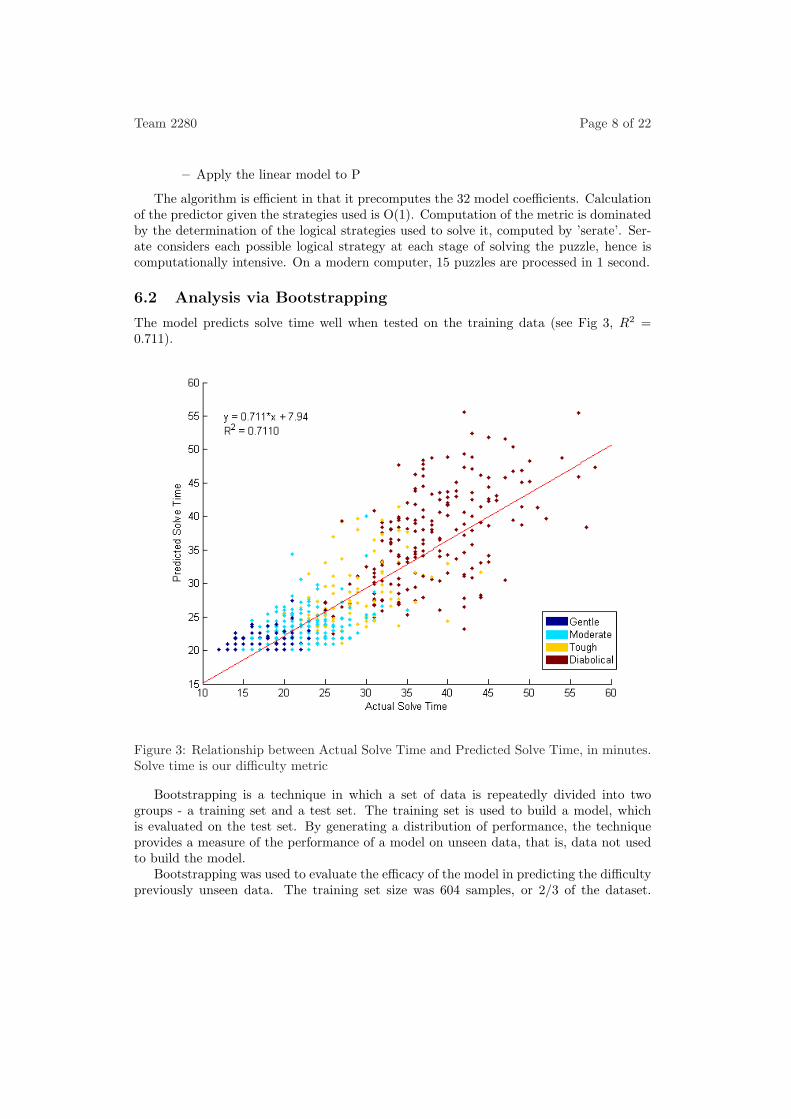
The model predicts solve time well when tested on the training data (see Fig 3, R2 =0.711).
Figure 3: Relationship between Actual Solve Time and Predicted Solve Time, in minutes.Solve time is our difficulty metric
Bootstrapping is a technique in which a set of data is repeatedly divided into twogroups - a training set and a test set. The training set is used to build a model, whichis evaluated on the test set. By generating a distribution of performance, the techniqueprovides a measure of the performance of a model on unseen data, that is, data not usedto build the model.
Bootstrapping was used to evaluate the efficacy of the model in predicting the difficultypreviously unseen data. The training set size was 604 samples, or 2/3 of the dataset.
Team 2280 Page 9 of 22
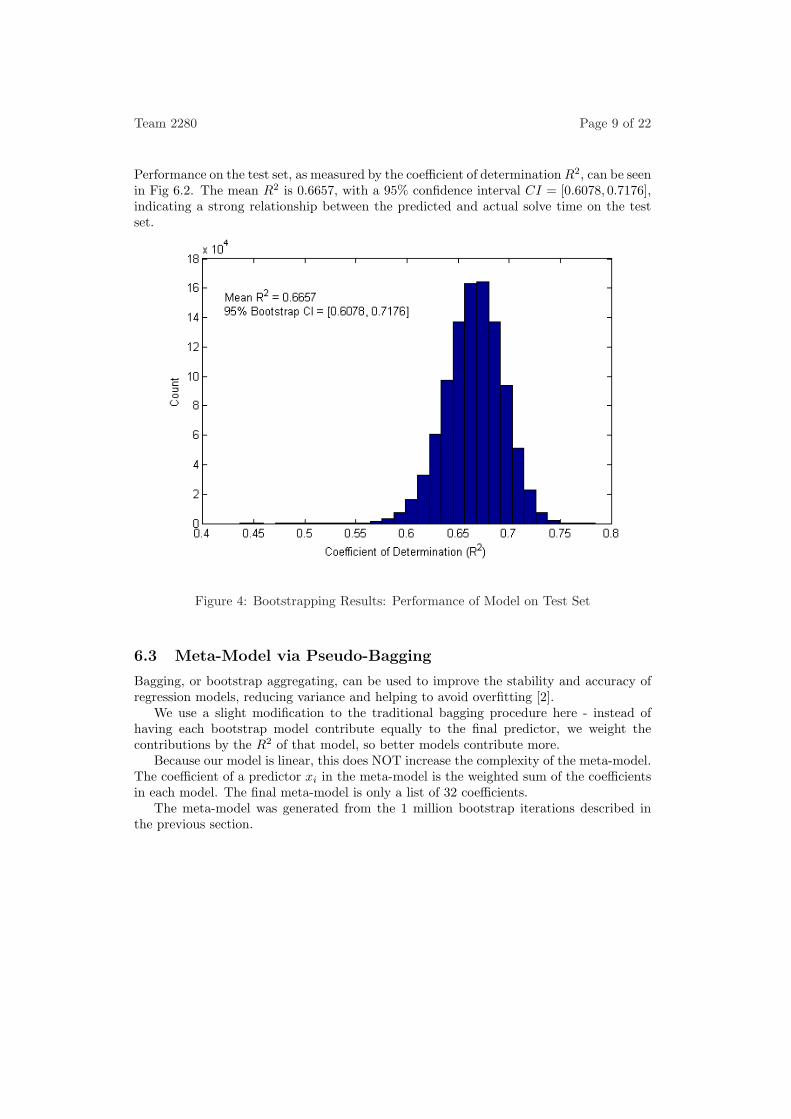
Performance on the test set, as measured by the coefficient of determination R2, can be seenin Fig 6.2. The mean R2 is 0.6657, with a 95% confidence interval CI = [0.6078, 0.7176],indicating a strong relationship between the predicted and actual solve time on the testset.
Figure 4: Bootstrapping Results: Performance of Model on Test Set
6.3 Meta-Model via Pseudo-Bagging
Bagging, or bootstrap aggregating, can be used to improve the stability and accuracy ofregression models, reducing variance and helping to avoid overfitting [2].
We use a slight modification to the traditional bagging procedure here - instead ofhaving each bootstrap model contribute equally to the final predictor, we weight thecontributions by the R2 of that model, so better models contribute more.
Because our model is linear, this does NOT increase the complexity of the meta-model.The coefficient of a predictor xi in the meta-model is the weighted sum of the coefficientsin each model. The final meta-model is only a list of 32 coefficients.
The meta-model was generated from the 1 million bootstrap iterations described inthe previous section.
Team 2280 Page 10 of 22
6.4 Analysis of Meta-Model
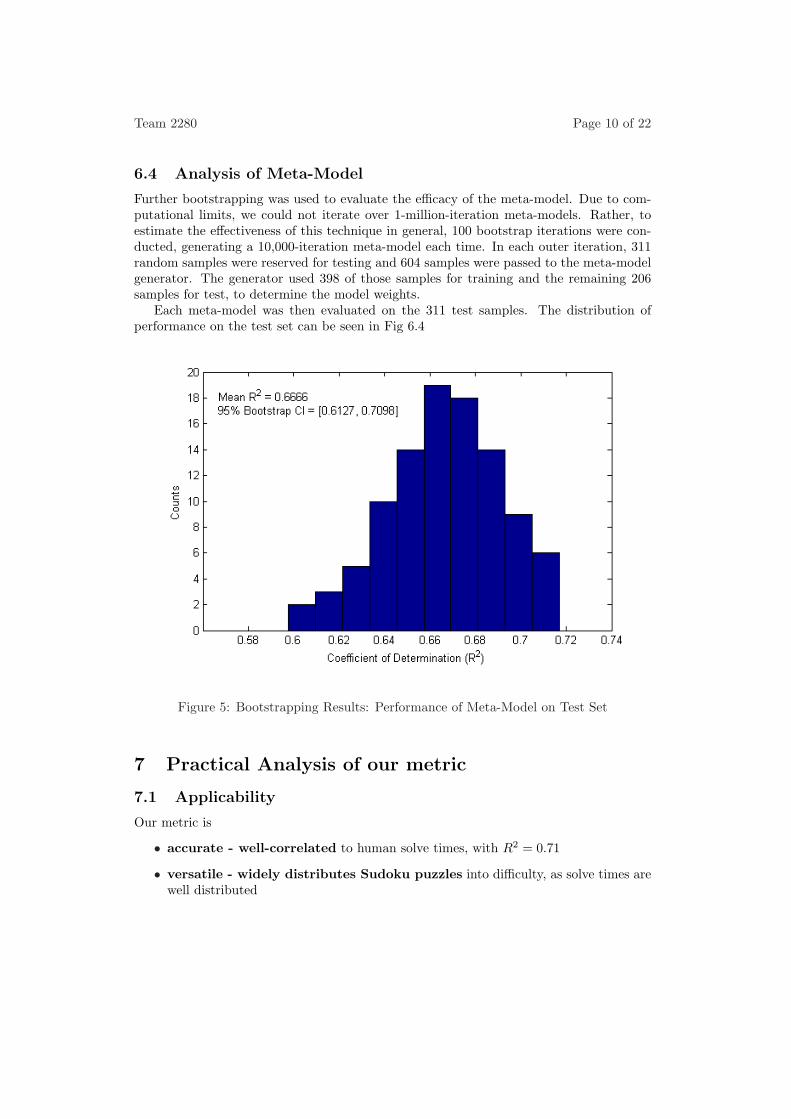
Further bootstrapping was used to evaluate the efficacy of the meta-model. Due to com-putational limits, we could not iterate over 1-million-iteration meta-models. Rather, toestimate the effectiveness of this technique in general, 100 bootstrap iterations were con-ducted, generating a 10,000-iteration meta-model each time. In each outer iteration, 311random samples were reserved for testing and 604 samples were passed to the meta-modelgenerator. The generator used 398 of those samples for training and the remaining 206samples for test, to determine the model weights.
Each meta-model was then evaluated on the 311 test samples. The distribution ofperformance on the test set can be seen in Fig 6.4
Figure 5: Bootstrapping Results: Performance of Meta-Model on Test Set
7 Practical Analysis of our metric
7.1 Applicability
Our metric is
• accurate - well-correlated to human solve times, with R2 = 0.71
• versatile - widely distributes Sudoku puzzles into difficulty, as solve times arewell distributed
Team 2280 Page 11 of 22
• extensible - by computing a continuous parameter, allowing specification of diffi-cult bounds
7.2 Comparison to Other Difficulty Metrics
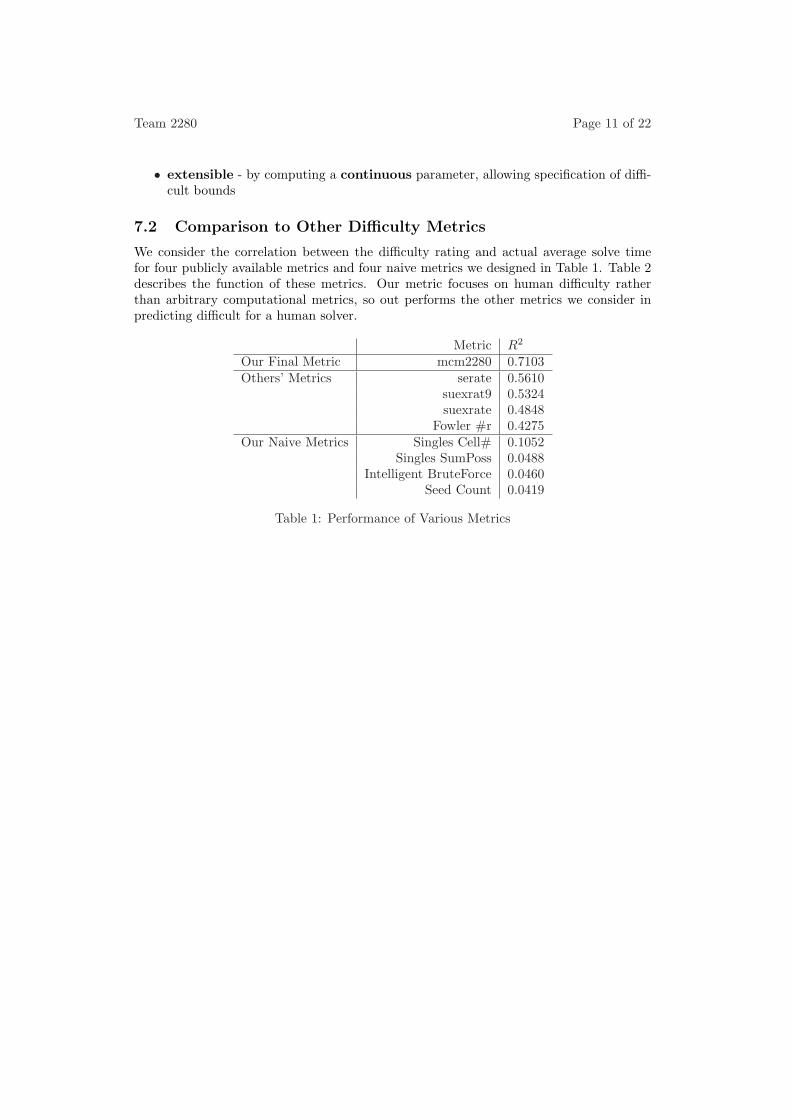
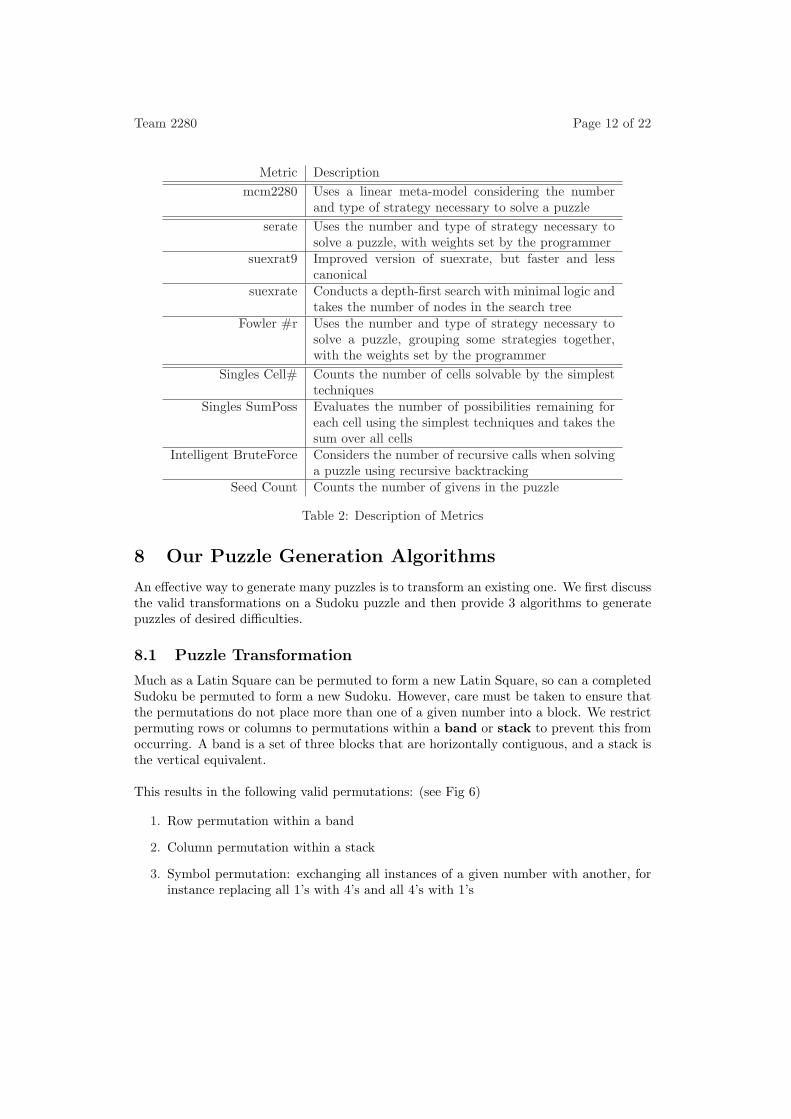
We consider the correlation between the difficulty rating and actual average solve timefor four publicly available metrics and four naive metrics we designed in Table 1. Table 2describes the function of these metrics. Our metric focuses on human difficulty ratherthan arbitrary computational metrics, so out performs the other metrics we consider inpredicting difficult for a human solver.
Metric R2
Our Final Metric mcm2280 0.7103Others’ Metrics serate 0.5610
suexrat9 0.5324suexrate 0.4848
Fowler #r 0.4275Our Naive Metrics Singles Cell# 0.1052
Singles SumPoss 0.0488Intelligent BruteForce 0.0460
Seed Count 0.0419
Table 1: Performance of Various Metrics
Team 2280 Page 12 of 22
Metric Descriptionmcm2280 Uses a linear meta-model considering the number
and type of strategy necessary to solve a puzzleserate Uses the number and type of strategy necessary to
solve a puzzle, with weights set by the programmersuexrat9 Improved version of suexrate, but faster and less
canonicalsuexrate Conducts a depth-first search with minimal logic and
takes the number of nodes in the search treeFowler #r Uses the number and type of strategy necessary to
solve a puzzle, grouping some strategies together,with the weights set by the programmer
Singles Cell# Counts the number of cells solvable by the simplesttechniques
Singles SumPoss Evaluates the number of possibilities remaining foreach cell using the simplest techniques and takes thesum over all cells
Intelligent BruteForce Considers the number of recursive calls when solvinga puzzle using recursive backtracking
Seed Count Counts the number of givens in the puzzle
Table 2: Description of Metrics
8 Our Puzzle Generation Algorithms
An effective way to generate many puzzles is to transform an existing one. We first discussthe valid transformations on a Sudoku puzzle and then provide 3 algorithms to generatepuzzles of desired difficulties.
8.1 Puzzle Transformation
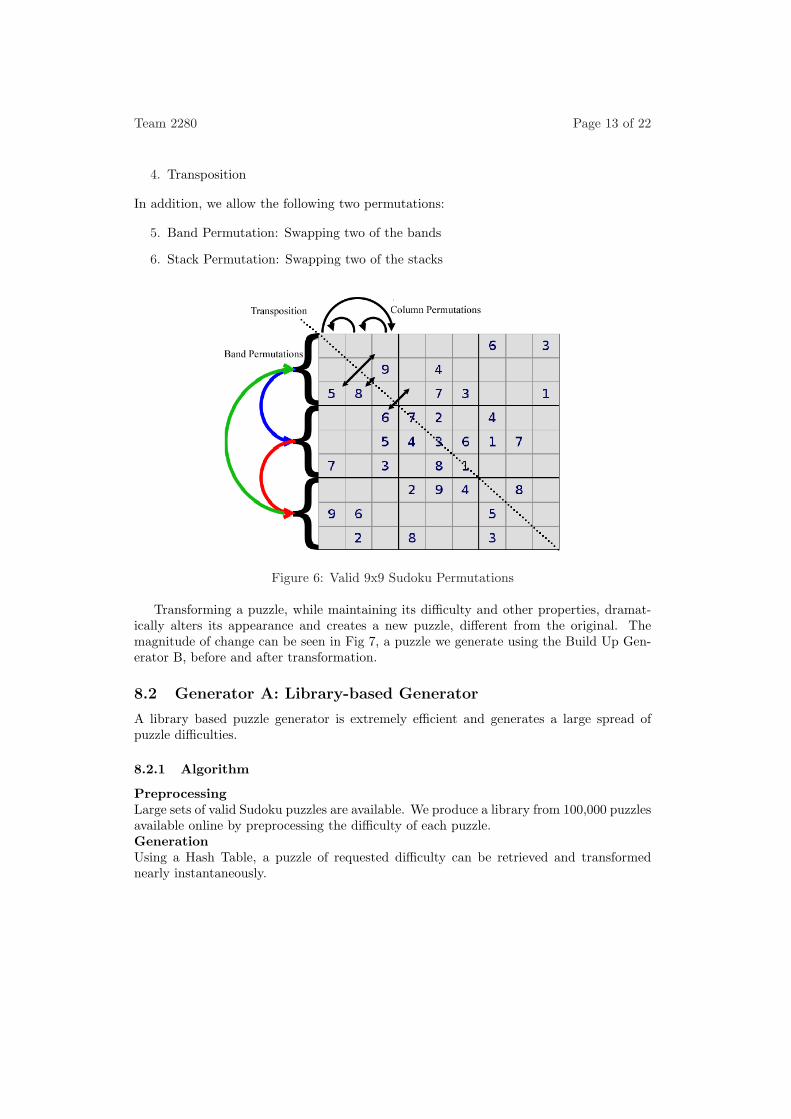
Much as a Latin Square can be permuted to form a new Latin Square, so can a completedSudoku be permuted to form a new Sudoku. However, care must be taken to ensure thatthe permutations do not place more than one of a given number into a block. We restrictpermuting rows or columns to permutations within a band or stack to prevent this fromoccurring. A band is a set of three blocks that are horizontally contiguous, and a stack isthe vertical equivalent.
This results in the following valid permutations: (see Fig 6)
1. Row permutation within a band
2. Column permutation within a stack
3. Symbol permutation: exchanging all instances of a given number with another, forinstance replacing all 1’s with 4’s and all 4’s with 1’s
Team 2280 Page 13 of 22
4. Transposition
In addition, we allow the following two permutations:
5. Band Permutation: Swapping two of the bands
6. Stack Permutation: Swapping two of the stacks
Figure 6: Valid 9x9 Sudoku Permutations
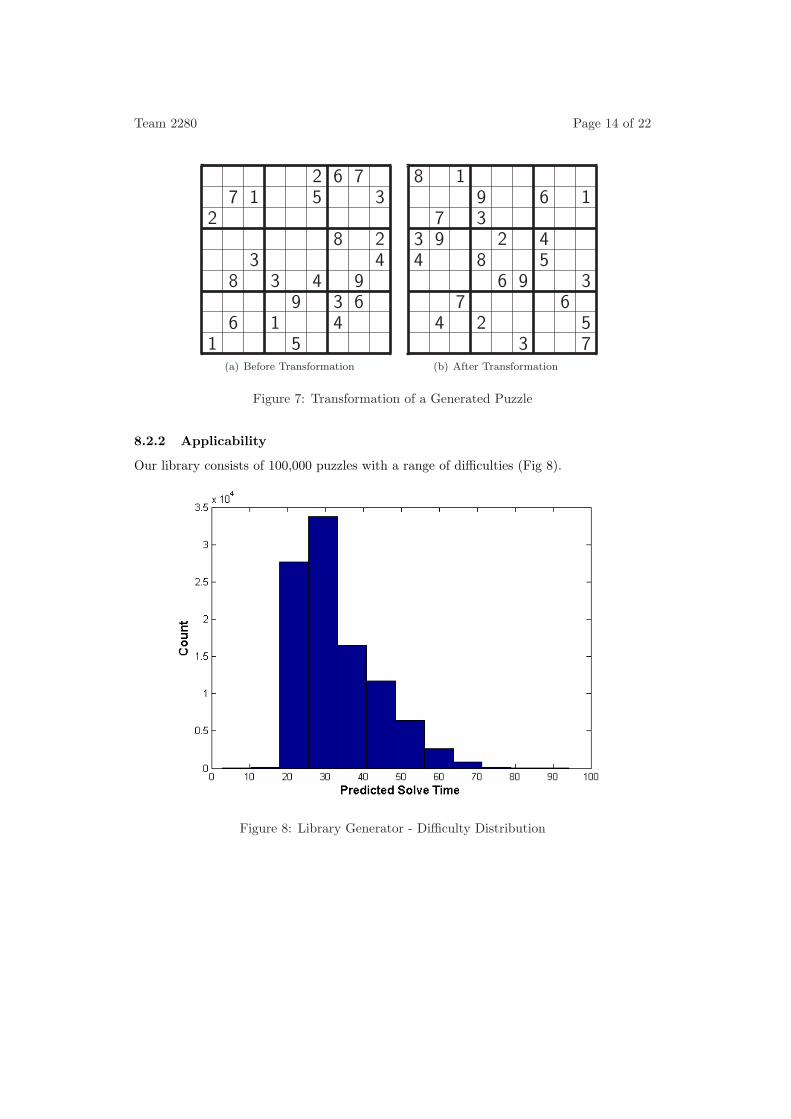
Transforming a puzzle, while maintaining its difficulty and other properties, dramat-ically alters its appearance and creates a new puzzle, different from the original. Themagnitude of change can be seen in Fig 7, a puzzle we generate using the Build Up Gen-erator B, before and after transformation.
8.2 Generator A: Library-based Generator
A library based puzzle generator is extremely efficient and generates a large spread ofpuzzle difficulties.
8.2.1 Algorithm
PreprocessingLarge sets of valid Sudoku puzzles are available. We produce a library from 100,000 puzzlesavailable online by preprocessing the difficulty of each puzzle.GenerationUsing a Hash Table, a puzzle of requested difficulty can be retrieved and transformednearly instantaneously.
Team 2280 Page 14 of 22
2 6 77 1 5 3
28 2
3 48 3 4 9
9 3 66 1 4
1 5(a) Before Transformation
8 19 6 1
7 33 9 2 44 8 5
6 9 37 6
4 2 53 7
(b) After Transformation
Figure 7: Transformation of a Generated Puzzle
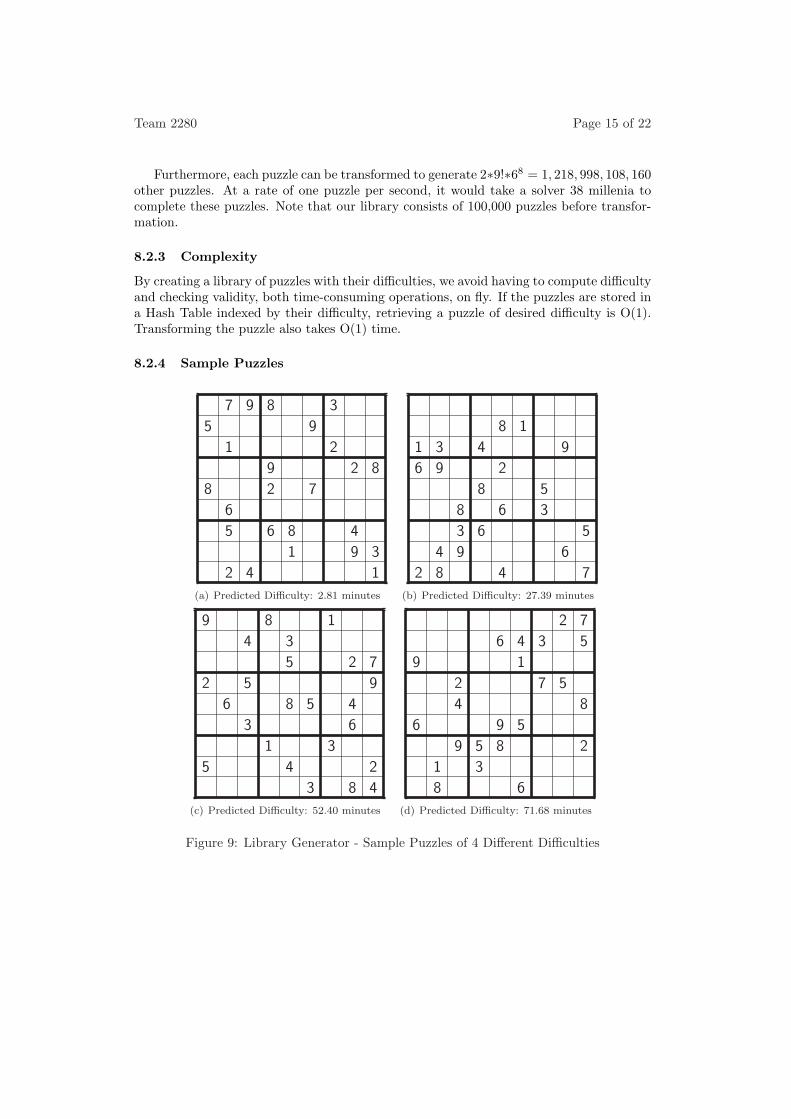
8.2.2 Applicability
Our library consists of 100,000 puzzles with a range of difficulties (Fig 8).
Figure 8: Library Generator - Difficulty Distribution
Team 2280 Page 15 of 22
Furthermore, each puzzle can be transformed to generate 2∗9!∗68 = 1, 218, 998, 108, 160other puzzles. At a rate of one puzzle per second, it would take a solver 38 millenia tocomplete these puzzles. Note that our library consists of 100,000 puzzles before transfor-mation.
8.2.3 Complexity
By creating a library of puzzles with their difficulties, we avoid having to compute difficultyand checking validity, both time-consuming operations, on fly. If the puzzles are stored ina Hash Table indexed by their difficulty, retrieving a puzzle of desired difficulty is O(1).Transforming the puzzle also takes O(1) time.
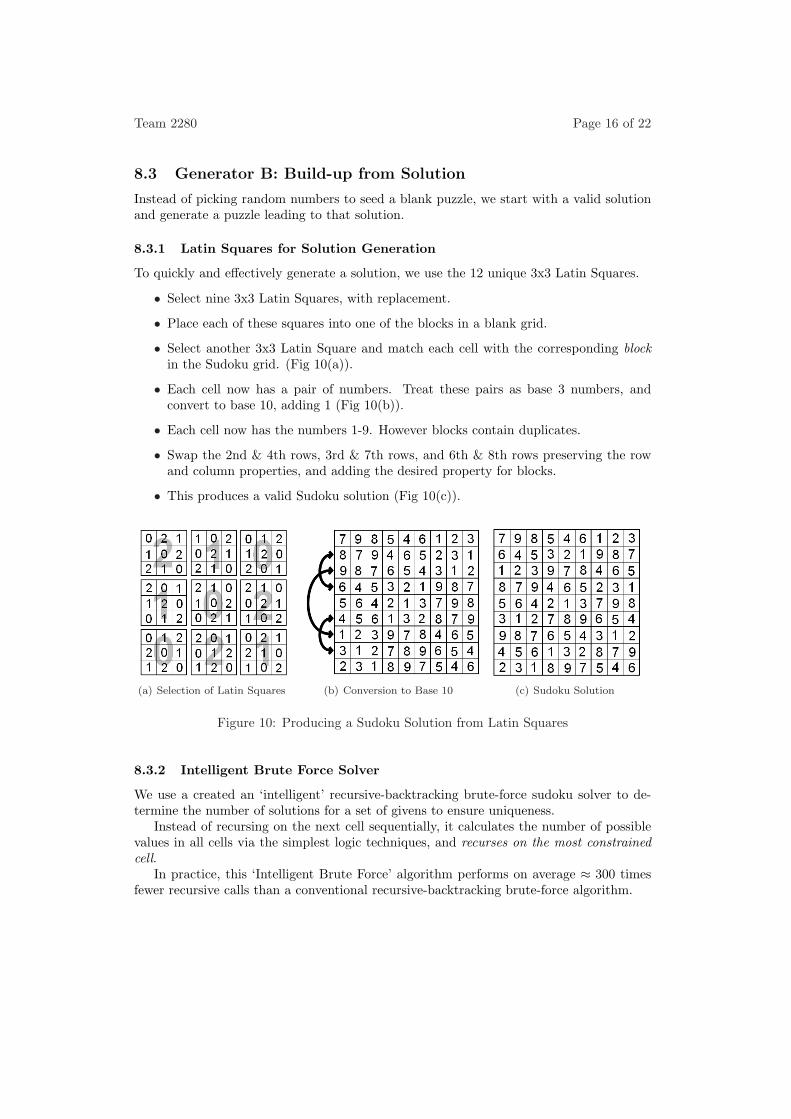
8.2.4 Sample Puzzles
7 9 8 3
5 9
1 2
9 2 8
8 2 7
6
5 6 8 4
1 9 3
2 4 1
(a) Predicted Difficulty: 2.81 minutes
8 1
1 3 4 9
6 9 2
8 5
8 6 3
3 6 5
4 9 6
2 8 4 7
(b) Predicted Difficulty: 27.39 minutes
9 8 1
4 3
5 2 7
2 5 9
6 8 5 4
3 6
1 3
5 4 2
3 8 4
(c) Predicted Difficulty: 52.40 minutes
2 7
6 4 3 5
9 1
2 7 5
4 8
6 9 5
9 5 8 2
1 3
8 6
(d) Predicted Difficulty: 71.68 minutes
Figure 9: Library Generator - Sample Puzzles of 4 Different Difficulties
Team 2280 Page 16 of 22
8.3 Generator B: Build-up from Solution
Instead of picking random numbers to seed a blank puzzle, we start with a valid solutionand generate a puzzle leading to that solution.
8.3.1 Latin Squares for Solution Generation
To quickly and effectively generate a solution, we use the 12 unique 3x3 Latin Squares.
• Select nine 3x3 Latin Squares, with replacement.
• Place each of these squares into one of the blocks in a blank grid.
• Select another 3x3 Latin Square and match each cell with the corresponding blockin the Sudoku grid. (Fig 10(a)).
• Each cell now has a pair of numbers. Treat these pairs as base 3 numbers, andconvert to base 10, adding 1 (Fig 10(b)).
• Each cell now has the numbers 1-9. However blocks contain duplicates.
• Swap the 2nd & 4th rows, 3rd & 7th rows, and 6th & 8th rows preserving the rowand column properties, and adding the desired property for blocks.
• This produces a valid Sudoku solution (Fig 10(c)).
(a) Selection of Latin Squares (b) Conversion to Base 10 (c) Sudoku Solution
Figure 10: Producing a Sudoku Solution from Latin Squares
8.3.2 Intelligent Brute Force Solver
We use a created an ‘intelligent’ recursive-backtracking brute-force sudoku solver to de-termine the number of solutions for a set of givens to ensure uniqueness.
Instead of recursing on the next cell sequentially, it calculates the number of possiblevalues in all cells via the simplest logic techniques, and recurses on the most constrainedcell.
In practice, this ‘Intelligent Brute Force’ algorithm performs on average ≈ 300 timesfewer recursive calls than a conventional recursive-backtracking brute-force algorithm.
Team 2280 Page 17 of 22
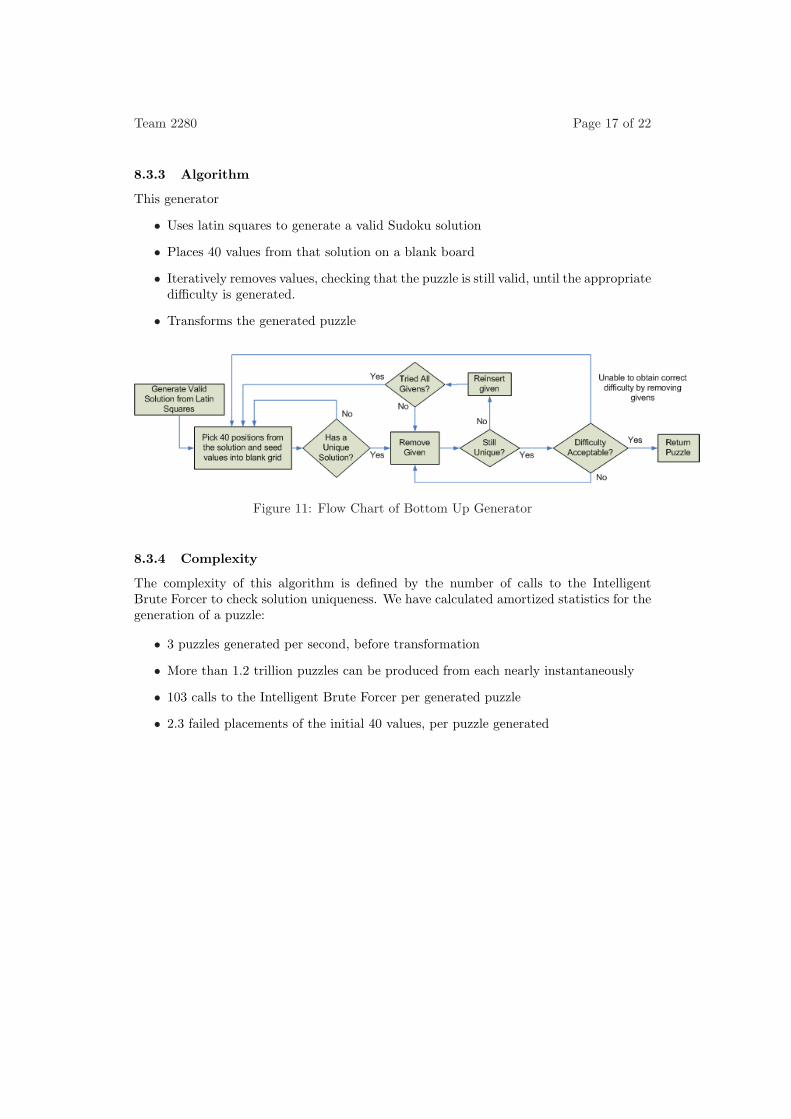
8.3.3 Algorithm
This generator
• Uses latin squares to generate a valid Sudoku solution
• Places 40 values from that solution on a blank board
• Iteratively removes values, checking that the puzzle is still valid, until the appropriatedifficulty is generated.
• Transforms the generated puzzle
Figure 11: Flow Chart of Bottom Up Generator
8.3.4 Complexity
The complexity of this algorithm is defined by the number of calls to the IntelligentBrute Forcer to check solution uniqueness. We have calculated amortized statistics for thegeneration of a puzzle:
• 3 puzzles generated per second, before transformation
• More than 1.2 trillion puzzles can be produced from each nearly instantaneously
• 103 calls to the Intelligent Brute Forcer per generated puzzle
• 2.3 failed placements of the initial 40 values, per puzzle generated
Team 2280 Page 18 of 22
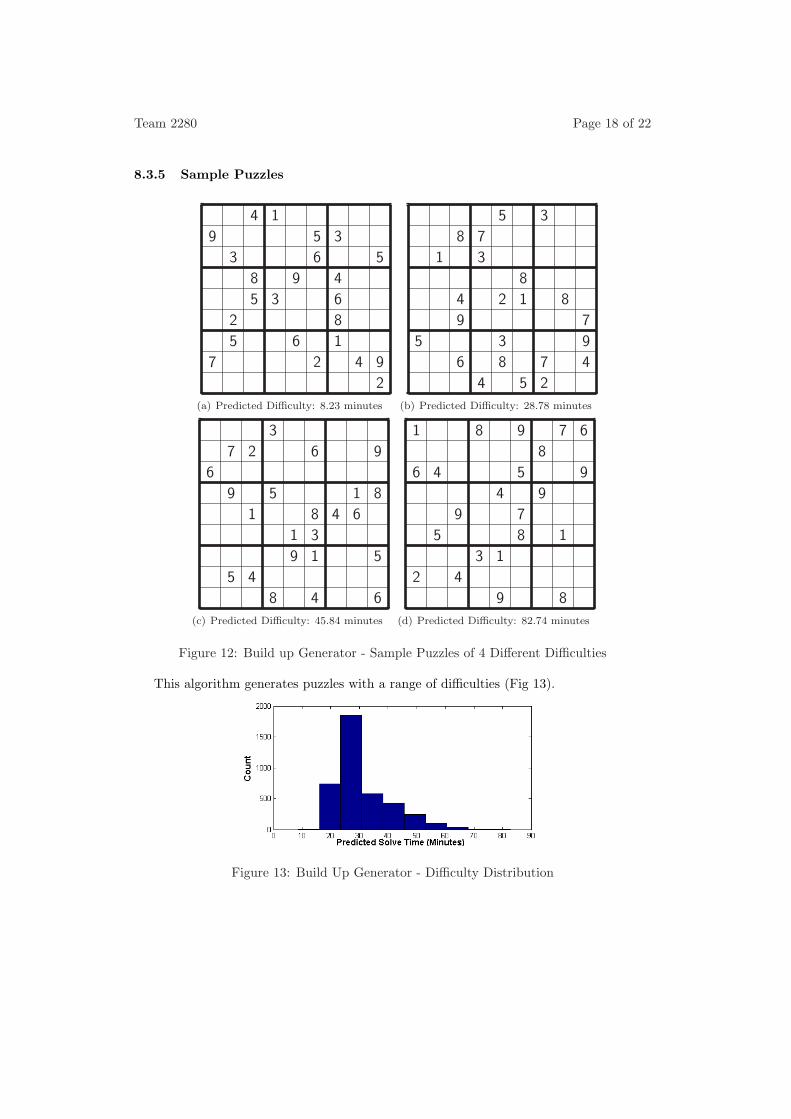
8.3.5 Sample Puzzles
4 1
9 5 3
3 6 5
8 9 4
5 3 6
2 8
5 6 1
7 2 4 9
2
(a) Predicted Difficulty: 8.23 minutes
5 3
8 7
1 3
8
4 2 1 8
9 7
5 3 9
6 8 7 4
4 5 2
(b) Predicted Difficulty: 28.78 minutes
3
7 2 6 9
6
9 5 1 8
1 8 4 6
1 3
9 1 5
5 4
8 4 6
(c) Predicted Difficulty: 45.84 minutes
1 8 9 7 6
8
6 4 5 9
4 9
9 7
5 8 1
3 1
2 4
9 8
(d) Predicted Difficulty: 82.74 minutes
Figure 12: Build up Generator - Sample Puzzles of 4 Different Difficulties
This algorithm generates puzzles with a range of difficulties (Fig 13).
Figure 13: Build Up Generator - Difficulty Distribution
Team 2280 Page 19 of 22
8.4 Generator C: Template Generation
Puzzles provided by the puzzle magazine Nikoli are prefered by some Sudoku enthusiastsbecause they are all human-generated. This is often reflected in their symmetry or theirconformation to a specific pattern of locations of givens.
We provide an algorithm with this functionality.
8.4.1 Algorithm
• Read a template from the user
• Iterate:
– Generate a valid solution using Latin Squares
– Place the appropriate values in the template locations
– Return if the puzzle has a unique solution
• Tranform the puzzle ONLY with symbol permutation
8.4.2 Complexity
The performance of this algorithm varies substantially with the template provided. In theworst case, if there are no valid puzzles with that pattern, it will run in O(9n) time, wheren is the number of locations in the template.
If sufficiently many cells are given in the template, however, it is efficient. The ’MCM’puzzle on the first page and those below were generated via this algorithm. It producedapproximately 1 puzzle per minute, before transformation. Each puzzle could be symbolpermuted to 9! = 362, 880 other valid puzzles.
We note that we generate puzzles from one class of solution grids, namely those gener-ated by Latin Squares. It is possible that there exists a valid puzzle of another class thatour algorithm will not find.
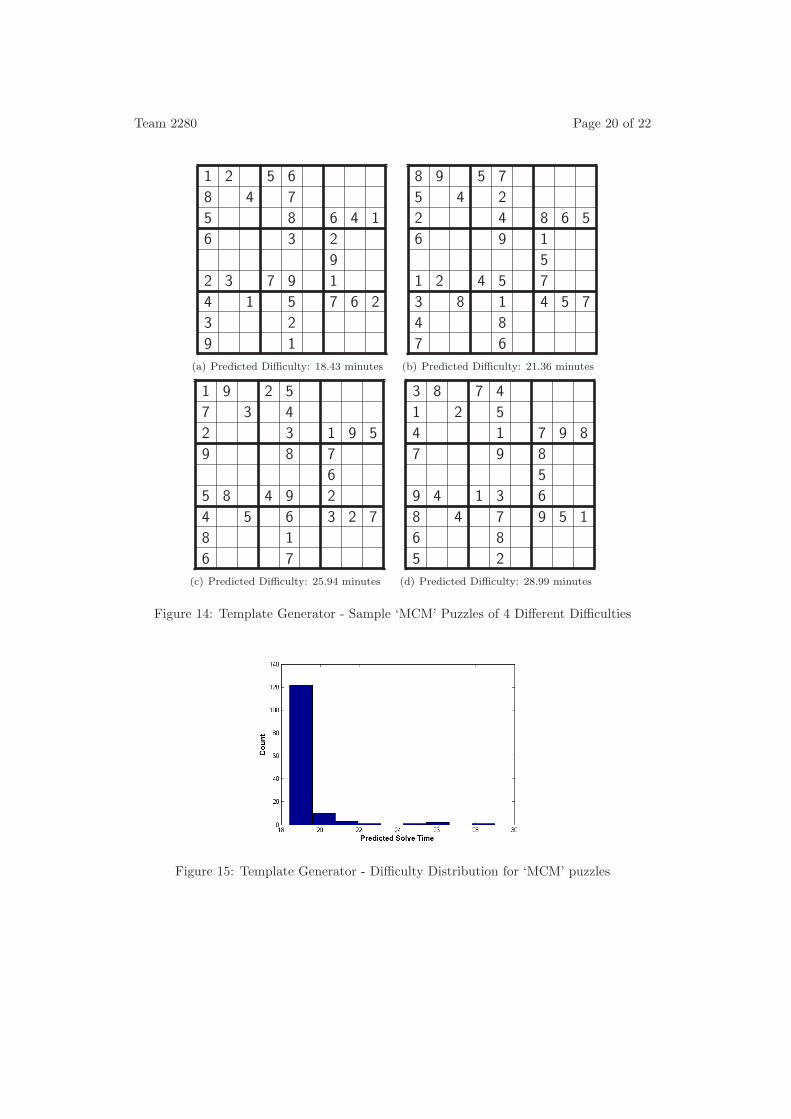
8.4.3 Sample Puzzles
Because these puzzles are more constrained, this algorithm generates puzzles with a smallerrange of difficulties.
Team 2280 Page 20 of 22
1 2 5 6
8 4 7
5 8 6 4 1
6 3 2
9
2 3 7 9 1
4 1 5 7 6 2
3 2
9 1
(a) Predicted Difficulty: 18.43 minutes
8 9 5 7
5 4 2
2 4 8 6 5
6 9 1
5
1 2 4 5 7
3 8 1 4 5 7
4 8
7 6
(b) Predicted Difficulty: 21.36 minutes
1 9 2 5
7 3 4
2 3 1 9 5
9 8 7
6
5 8 4 9 2
4 5 6 3 2 7
8 1
6 7
(c) Predicted Difficulty: 25.94 minutes
3 8 7 4
1 2 5
4 1 7 9 8
7 9 8
5
9 4 1 3 6
8 4 7 9 5 1
6 8
5 2
(d) Predicted Difficulty: 28.99 minutes
Figure 14: Template Generator - Sample ‘MCM’ Puzzles of 4 Different Difficulties
Figure 15: Template Generator - Difficulty Distribution for ‘MCM’ puzzles
Team 2280 Page 21 of 22
9 Conclusion
Sudoku puzzle rating and generation algorithms abound. Our model differs in that we focuson the human-applicability of our rating and generation algorithms. Rather than definingparameters used to rate difficulty by hand, we use multiple regression and bootstrapaggregation to better model the predicted time an average solver will require to completea puzzle.
We present difficulty rating metric that outperforms all other metrics we consider inpredicting the average solve time for a set of 915 puzzles. Furthermore, we demonstratethat this metric is extensible and versatile. We also provide a suite of puzzle generationalgorithms. We provide a library based algorithm that provides many puzzles in O(1)time; a generator that uses a solution to ’build up’ a puzzle; and a template-based gen-erator that can be used to mimic popular human-constructed Sudoku puzzles. Each ofthese algorithms, particularly the first two, rapidly provide puzzles with a broad rangeof difficulties. Furthermore, each method is capable of generating a large number of newpuzzles.
Further work could explore a more direct puzzle generation algorithm that makes use ofthe unique nature of our difficulty metric. By applying the logical strategies we consider inreverse to selectively remove givens from a completed grid, a puzzle that requires certainstrategies to solve could be constructed, effectively tailoring the puzzle to conform toa desired difficulty. This could potentially generate puzzles of a desired difficulty moreefficiently.
Team 2280 Page 22 of 22
References
[1] C. Agerbeck and M. O. Hansen. A multi-agent approach to solving NP-complete prob-lems. Master’s thesis, Informatics and Mathematical Modelling, Technical Universityof Denmark, DTU, Richard Petersens Plads, Building 321, DK-2800 Kgs. Lyngby,2008. Supervised by Assoc. Prof. Thomas Bolander, IMM, DTU.
[2] Leo Breiman. Bagging predictors. Machine Learning, 24(2):123–140, 1996.
[3] B. Felgenhauer and F. Jarvis. Enumerating possible sudoku grids. 2005.
[4] G. Fowler. A 9x9 sudoku solver and generator, Jan. 2008.
[5] Martin Henz and Hoang-Minh Tuong. Sudokusat—a tool for analyzing difficult su-doku puzzles. In Proceedings of the First International Workshop on Applicationswith Artificial Intelligence, Studies in Computational Intelligence, Patras, Greece,2007. Springer-Verlag, Berlin. to appear.
[6] Ines Lynce Ist and Joel Ouaknine. Sudoku as a sat problem.
[7] Timo Mantere and Janne Koljonen. Solving and rating sudoku puzzles with geneticalgorithms. In Proceedings of the 12th Finnish Artificial Intelligence Conference STeP,pages 86–92, 2006.
[8] P. La Monica. Much ado about sudoku. CNNMoney.com, Sept. 2005.
[9] Ltd Nikoli Co. web nikoli - enjoy pencil puzzles!, Feb. 2008.
[10] G. Royle. Minimum sudoku.
[11] sud0ku.com. Sudoku - popularity in the media, Feb. 2008.
[12] T. Yato and T. Seta. Complexity and completeness of finding another solution andits application to puzzles.