successful adoption of software process improvement models ... · successful adoption of software...
TRANSCRIPT
Successful Adoption of Software Process Improvement Models: A Cultural-Methodological
Proposal
Jorge R. Aguilar Cisneros Universidad Popular Autónoma del Estado de Puebla / Department of Engineering, Puebla, Pue., México
Email: [email protected]
Ricardo Valerdi University of Arizona/ Department of Systems and Industrial Engineering, Tucson, AZ, USA
Email: [email protected]
Abstract— Adoption of a Software Process Improvement Model (SPIM) is a problematic activity that occurs in almost all software development companies. This problem has different causes. One of these causes has relation with cultural aspects that are present in: a) The Company’s organizational culture, b) The SPIM’s documents embedded culture. Whether these cultural aspects are not treated properly there will be a problem that generates millions in economic losses to companies around the world. To reduce these economic losses and increase successful rates of SPIM adoptions, we developed a cultural-methodological proposal. This has four steps: a) Identify the Company’s organizational culture, b) identify the SPIM’s documents embedded culture and, c) Identify and quantify cultural aspects of organizational culture and embedded culture and, d) explain differences between them. The purpose is to generate information that can be used to develop plans and strategies for adoption and institutionalization of SPIM. Our proposal is illustrated using the Mexican Norm: NMX-I-059/NYCE-2005 as an example of a SPIM and 8 Mexican Software development companies as an example of organizational culture. Index Terms— Culture embedded, Software Process Improvement Model, Organizational Culture, MoProSoft.
I. INTRODUCTION
Companies trying to adopt SPIM face organizational culture challenges. The failure to adopt such models results in millions of dollars of economic losses [1].
To address this problem, some works have been developed: Siakas developed the CODES model [2] and, Hazzan developed a model to analyze the connections between a national culture and the culture inspired by software development methods (SDMS) [3]. However, more research is needed to find out how approach the cultural aspects in SPIMs adoptions.
In this research, our main outcome was: 1. Organizational culture Identification of eight
Mexican software development companies.
2. Differences identification between Mexican companies’ organizational culture vs Mexican Norm’s embedded culture.
3. Differences qualitative and quantitative interpretation
II. PROBLEM
The main tension, that rises when a company tries to adopt a SPIM, is between culture embedded of process improvement models which they are attempting to adopt and the culture of their organization. The failure to adopt such models results in economic losses, decreased productivity, and slipped delivery schedules. This problem has been analyzed and documented in several areas, including: a) Up to 70% of failure to adopt the CMMI model is due to cultural problems [1], b) ERP implementation projects failures have negative economic impacts on the organizations that implemented the systems, Nielsen [4] mentions that only 15% of ERP implementations are seen as successful. Now, whether we considered that in 2003 the ERP market, in the United States, reached sales of $ 66.6 billion of dollars [5] we can see that to adopt an ERP system generate important economic losses and, these failure cases are not always about technological problems, often are cultural problems [6].
III. THEORETICAL FRAMEWORK
In this section we show the elements, which are important in our research.
A. Technology Adoption In 1988, Kedia and Bhagat in their work: "Cultural
Constraints on Transfer of Technology across Nations: Implications for research in international and comparative management", proposed a technology adoption model. This model took into account the technology’s cultural aspects and, it was based on Hofstede’s four cultural dimensions [8]. Other authors [9] analyzed three groups of factors affecting technology
© 2013 ACADEMY PUBLISHER 2367
© 2013 ACADEMY PUBLISHERdoi:10.4304/jsw.8.9.2367-2378
adoption: a) Nature of Technology: It includes communication, type of government and inter-organizational structure. b) Previous international experience: It is argued that experience facilitates adoption, and c) Cultural differences between technology suppliers and recipients: It explores how cultural differences between the technology's developers and the technology's recipients represent the biggest barrier in the process of technology adoption.
Williams and Gibson [10] suggest that the technology adoption should be conceptualized as a communication process where cultural differences between technology's developers and technology's recipients affect the communication efficiency.
Nicolet [11] argues that in any technology adoption process should understand the cultural aspects of the two cultures involved. The acceptance or rejection of the technology will depend on their cultural differences.
B. Organizational Culture Culture is a phenomenon that surrounds us all the time,
emerges from interaction with others and can be viewed as a set of structures, routines, rules and standards that guide and constrain behavior [12]. Can be defined as "the collective programming of the mind which distinguishes the members of one group or category of people from another" [8], their study goes back to early 80's [13], [14], [15], [16].
Through their study has shown that culture has a major impact on organizational performance [17], [18], [19]. This generated the organizational culture concept.
Organizational culture has been defined as "the collective programming of the mind which distinguishes the members of one organization from another" [20]. To detect the characteristics of each organizational culture, several proposals have been developed.
The proposals developed to detect organizational culture have been mainly in the last 20 years, in them, authors have suggested a variety of dimensions and attributes to organizational culture measure. Some authors [21], [12], [22], argue that consistency and culture strength are the main cultural dimensions. Other authors Arnold and Capella [23] proposed a matrix of cultures based on a strong-weak dimension and an internal-external focus dimension. Other author, Ernst, argued for people orientation, participative vs non-participative, and response to the environment, reactive vs proactive, as the key cultural dimensions. An Author, Gordon, identified eleven dimensions of culture: clarity and direction, organizational reach, integration, top management contact, individual initiative encouragement, conflict resolution, performance clarity, performance emphasis, action orientation, compensation, and human resource development. Hofstede [8] focused on power distance, uncertainty avoidance, individualism, and masculinity. Martin [24] proposed cultural integration and consensus, differentiation and conflict, and fragmentation and ambiguity.
One reason so many dimensions have been proposed is that organizational culture is extremely broad and inclusive in scope. It comprises a complex, interrelated,
comprehensive, and ambiguous set of factors. Consequently, it is impossible to ever include every relevant factor in diagnosing and assessing organizational culture [7].
To determine the most important dimensions on which to focus, therefore, it is important to use an underlying framework, a theoretical foundation that can narrow and focus the search for key cultural dimensions. The most appropriate framework should be based on empirical evidence, should be valid, and should be able to integrate and organize most of the dimensions being proposed [7]. This is the reason why, in this work, we use Competing Values Framework (CVF). With CVF we have identified organizational culture and embedded culture of technology.
C. Competing Values Framework The CVF framework was developed from an empirical
way and includes many of the dimensions proposed as necessary to identify organizational culture [7].
The advantages of CVF are six: 1. Practical. It captures key dimensions of culture. 2. Timely. The process of diagnosing can be
accomplished in a reasonable amount of time. 3. Involving. The steps in the process can include
every member of the organization. 4. Quantitative and Qualitative. The process relies
on quantitative measurement of key cultural dimensions as well as qualitative methods including stories, incidents, and symbols that represent the organization immeasurable ambience.
5. Manageable. The diagnosis process can be undertaken and implemented by a team within the organization.
6. Valid. The framework on which the process is built no only makes sense to people as they consider their own organization but is also supported by an extensive empirical literature and underlying dimensions that have a verified scholarly foundation.
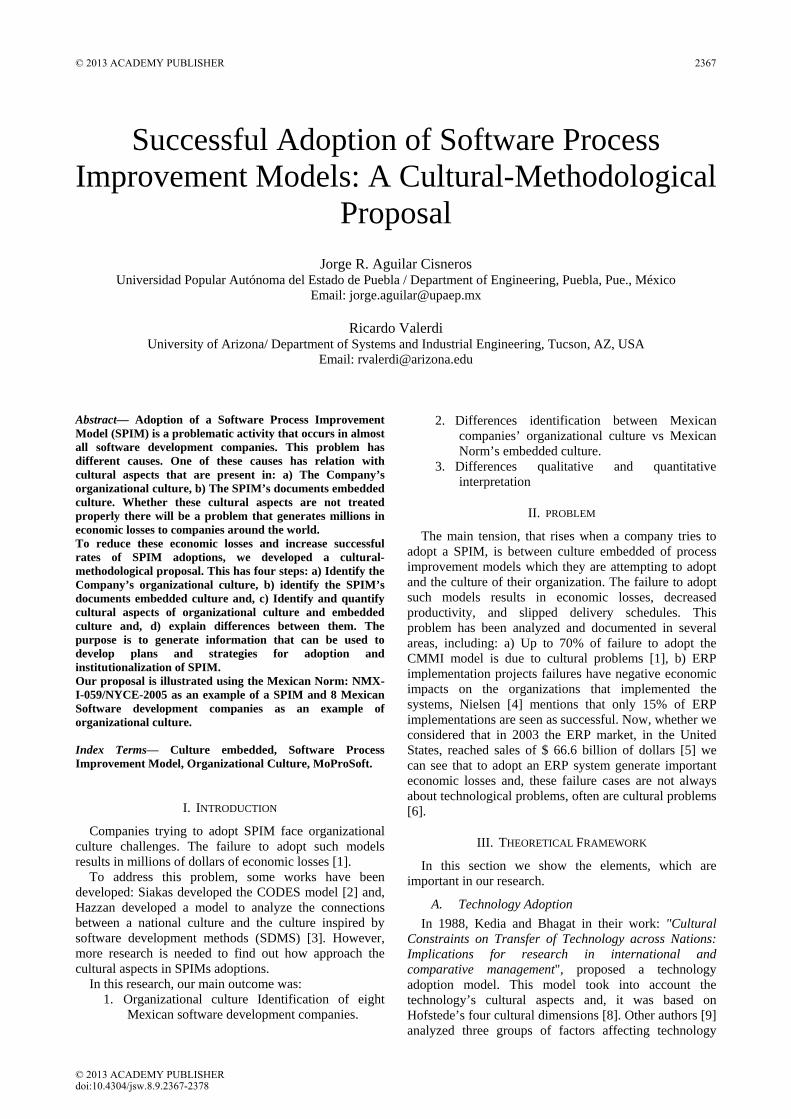
The CVF defines four organizational culture types: Clan, Hierarchy, Adhocracy and Market. See Fig. 1.
Figure 1. Organizational culture types.
In this paper we identify the organizational culture of software development companies in order to identify differences and similarities between it and the technology’s embedded culture. Organizational culture characterization is important in technology adoption
2368 © 2013 ACADEMY PUBLISHER
© 2013 ACADEMY PUBLISHER
process. It has been analyzed in previous works [25], [26], [27], [28], [29].
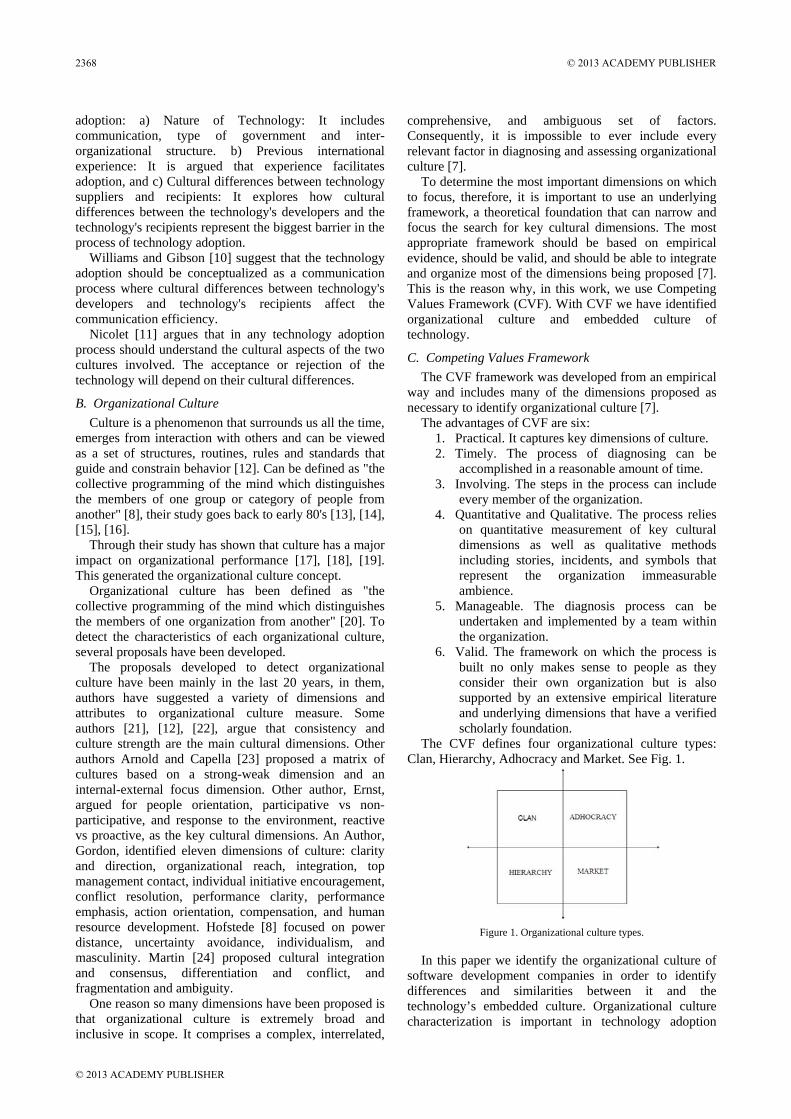
D. Technology’s Embedded Culture Technology can mean many things; can be a process, a
method, a technique, a tool, a procedure or a paradigm [30]. It can be defined as: “the application of scientific knowledge for practical purposes, especially in industry”. Although the term technology can be perfectly well defined, is not the case when trying to define embedded cultural aspects of it. Then, the following question arises: Is the technology, culturally neutral? , if we consider only the construction and operation of it, the answer may be YES. But, if we consider human activities around it, the answer is clearly NO [31]. See Fig. 2.
Figure 2. Technology and Culture [23]
There are authors who have said: Technology has cultural aspects and these are similar to person's cultural aspects that developed this technology [32], [33], [34]. The culture is present in the design, development and quality of many products and in providing many services.
An interesting example is the difference in two companies’ passenger jets design, Airbus (European, France-Germany) and Boeing (American, EU). Pilots familiar with both models, said: "Airbus is designed to fly on their own, and Boeing requires more interaction from pilot". The explanation can be found in the following analysis: while Airbus is developed in a culture that avoids uncertainty, Boeing is developed in a culture with a low power distance index [8].
Technology not only involves machines, techniques and knowledge. It also involves values and organization characteristic patterns [31].
Arnold Pacey identified 3 technology practice aspects: cultural, technical and organizational aspects.
According to this author there are 2 points of view to define technology: 1st. from a narrow view and 2nd. from a general point of view.
The narrow point of view focuses only technical aspects, the general point of view cover cultural, technical and organizational aspects.
Pacey said: "We can see the Technology's culture in the practices which take place around their use". Other authors [1] identify the embedded culture of technology based on a content analysis [35], [36].
In this paper, we identify the technology’s embedded culture through an analysis of their descriptive documents and we define a Software Process Improvement Model like a technology.
Finally, it would be a big mistake to think that a SPIM does not have culture.
E. Mexican Norm: NMX-I-059/NYCE-2005 The technology analyzed was MoProsoft. It is a
Mexican Process Model to micro and small software development enterprises. It has founded in ISO 9000:2000, CMMI v1.1, ISO/IEC TR 15504-2:1998, PMBOK and SWEBOK[55]. Moprosoft is the reference model of the Mexican Norm called NMX-I-059/NYCE-2005, it has four description books: Book 1: Definition of concepts and products. Book 2: Process requirements. Book 3: Guidelines for processes implementation. Book 4: Guidelines for processes assessment.
MoProSoft’s Purpose is to support standardization of operations into software development companies. To accomplish this purpose, MoProSoft define 9 processes: Business Management, Process Management, Project Management, Resource Management, Human Resources and Work Environment, Goods Services and Infrastructure, Organization’s Knowledge, Specific Projects Management and Software Development and Maintenance. These processes are grouping in 3 categories: Top Management, Management and Operations. In this work we use MoProsoft and NMX-I-59/NYCE-2005 (Mexican Norm) like synonyms.
IV. CO-OCURRENCE METHOD
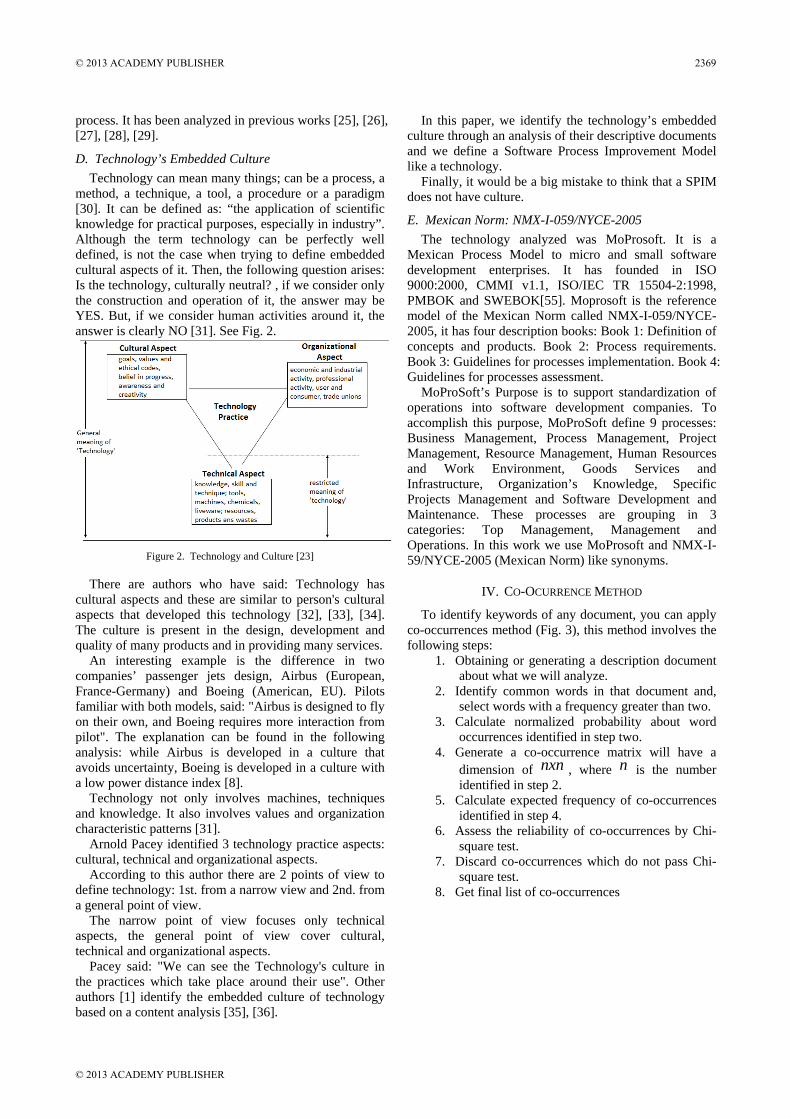
To identify keywords of any document, you can apply co-occurrences method (Fig. 3), this method involves the following steps:
1. Obtaining or generating a description document about what we will analyze.
2. Identify common words in that document and, select words with a frequency greater than two.
3. Calculate normalized probability about word occurrences identified in step two.
4. Generate a co-occurrence matrix will have a dimension of nxn , where n is the number identified in step 2.
5. Calculate expected frequency of co-occurrences identified in step 4.
6. Assess the reliability of co-occurrences by Chi-square test.
7. Discard co-occurrences which do not pass Chi-square test.
8. Get final list of co-occurrences
© 2013 ACADEMY PUBLISHER 2369
© 2013 ACADEMY PUBLISHER
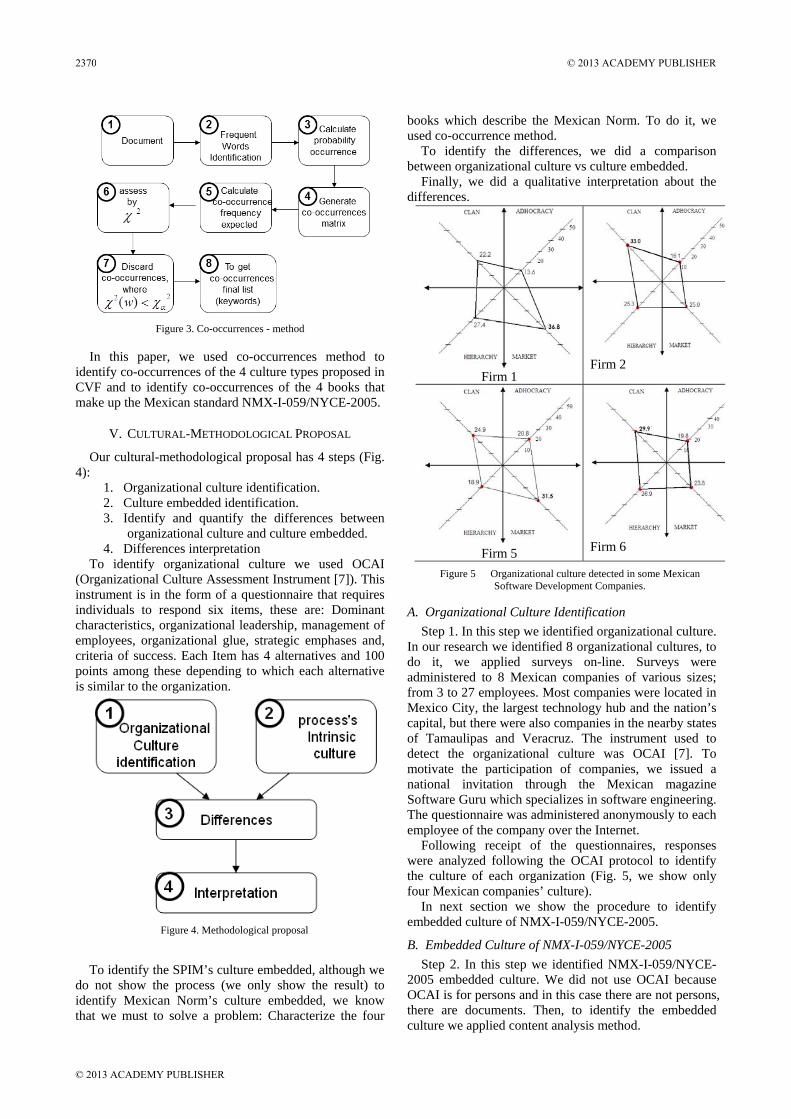
Figure 3. Co-occurrences - method
In this paper, we used co-occurrences method to identify co-occurrences of the 4 culture types proposed in CVF and to identify co-occurrences of the 4 books that make up the Mexican standard NMX-I-059/NYCE-2005.
V. CULTURAL-METHODOLOGICAL PROPOSAL
Our cultural-methodological proposal has 4 steps (Fig. 4):
1. Organizational culture identification. 2. Culture embedded identification. 3. Identify and quantify the differences between
organizational culture and culture embedded. 4. Differences interpretation
To identify organizational culture we used OCAI (Organizational Culture Assessment Instrument [7]). This instrument is in the form of a questionnaire that requires individuals to respond six items, these are: Dominant characteristics, organizational leadership, management of employees, organizational glue, strategic emphases and, criteria of success. Each Item has 4 alternatives and 100 points among these depending to which each alternative is similar to the organization.
To identify the SPIM’s culture embedded, although we
do not show the process (we only show the result) to identify Mexican Norm’s culture embedded, we know that we must to solve a problem: Characterize the four
books which describe the Mexican Norm. To do it, we used co-occurrence method.
To identify the differences, we did a comparison between organizational culture vs culture embedded.
Finally, we did a qualitative interpretation about the differences.
A. Organizational Culture Identification
Step 1. In this step we identified organizational culture. In our research we identified 8 organizational cultures, to do it, we applied surveys on-line. Surveys were administered to 8 Mexican companies of various sizes; from 3 to 27 employees. Most companies were located in Mexico City, the largest technology hub and the nation’s capital, but there were also companies in the nearby states of Tamaulipas and Veracruz. The instrument used to detect the organizational culture was OCAI [7]. To motivate the participation of companies, we issued a national invitation through the Mexican magazine Software Guru which specializes in software engineering. The questionnaire was administered anonymously to each employee of the company over the Internet.
Following receipt of the questionnaires, responses were analyzed following the OCAI protocol to identify the culture of each organization (Fig. 5, we show only four Mexican companies’ culture).
In next section we show the procedure to identify embedded culture of NMX-I-059/NYCE-2005.
B. Embedded Culture of NMX-I-059/NYCE-2005 Step 2. In this step we identified NMX-I-059/NYCE-
2005 embedded culture. We did not use OCAI because OCAI is for persons and in this case there are not persons, there are documents. Then, to identify the embedded culture we applied content analysis method.
Firm 1 Firm 2
Firm 5 Firm 6
Figure 5 Organizational culture detected in some Mexican Software Development Companies.
Figure 4. Methodological proposal
2370 © 2013 ACADEMY PUBLISHER
© 2013 ACADEMY PUBLISHER
To apply Content Analysis, we solved two problems. First: Characterize the documents which describe the four culture types. Second: Characterize the documents which describe the Mexican Norm (NMX-I-059/NYCE-2005). These problems were resolved with co-occurrence method. With these results, we could identify the embedded culture of the Mexican Norm.
C. CVF’s Cultures Characterization First Problem, CVF’s cultures characterization. This
problem arose in the step 2 of our methodology. We could solve this problem with co-occurrences method (Fig. 3). We analyzed a document with description of four culture types (Hierarchy, Clan, Market and Adhocracy). These cultures were showed by Cameron and Quinn [7] in their book about organizational cultures.
Next sub-section present details of each step co-occurrences method. We present, solely, Hierarchy Culture characterization details and, we present characterization outcomes of the other cultures (Clan, Market and Adhocracy).
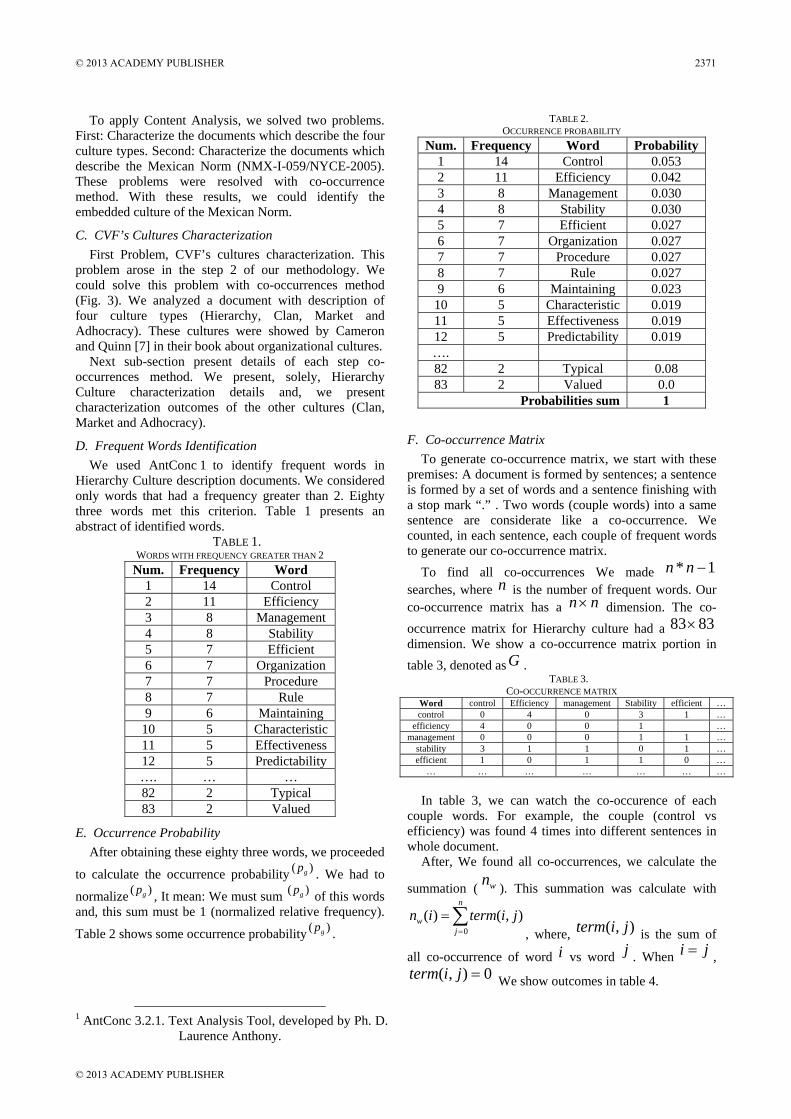
D. Frequent Words Identification We used AntConc 1 to identify frequent words in
Hierarchy Culture description documents. We considered only words that had a frequency greater than 2. Eighty three words met this criterion. Table 1 presents an abstract of identified words.
TABLE 1. WORDS WITH FREQUENCY GREATER THAN 2
Num. Frequency Word 1 14 Control 2 11 Efficiency 3 8 Management 4 8 Stability 5 7 Efficient 6 7 Organization 7 7 Procedure 8 7 Rule 9 6 Maintaining
10 5 Characteristic11 5 Effectiveness 12 5 Predictability …. … … 82 2 Typical 83 2 Valued
E. Occurrence Probability After obtaining these eighty three words, we proceeded
to calculate the occurrence probability )( gp . We had to
normalize )( gp , It mean: We must sum )( gp of this words and, this sum must be 1 (normalized relative frequency).
Table 2 shows some occurrence probability )( gp .
1 AntConc 3.2.1. Text Analysis Tool, developed by Ph. D.
Laurence Anthony.
TABLE 2. OCCURRENCE PROBABILITY
Num. Frequency Word Probability1 14 Control 0.053 2 11 Efficiency 0.042 3 8 Management 0.030 4 8 Stability 0.030 5 7 Efficient 0.027 6 7 Organization 0.027 7 7 Procedure 0.027 8 7 Rule 0.027 9 6 Maintaining 0.023
10 5 Characteristic 0.019 11 5 Effectiveness 0.019 12 5 Predictability 0.019 …. 82 2 Typical 0.08 83 2 Valued 0.0
Probabilities sum 1
F. Co-occurrence Matrix To generate co-occurrence matrix, we start with these
premises: A document is formed by sentences; a sentence is formed by a set of words and a sentence finishing with a stop mark “.” . Two words (couple words) into a same sentence are considerate like a co-occurrence. We counted, in each sentence, each couple of frequent words to generate our co-occurrence matrix.
To find all co-occurrences We made 1* −nn searches, where n is the number of frequent words. Our co-occurrence matrix has a nn× dimension. The co-occurrence matrix for Hierarchy culture had a 8383× dimension. We show a co-occurrence matrix portion in table 3, denoted asG .
TABLE 3. CO-OCCURRENCE MATRIX
Word control Efficiency management Stability efficient …control 0 4 0 3 1 …
efficiency 4 0 0 1 …management 0 0 0 1 1 …
stability 3 1 1 0 1 …efficient 1 0 1 1 0 …
… … … … … … … In table 3, we can watch the co-occurence of each
couple words. For example, the couple (control vs efficiency) was found 4 times into different sentences in whole document.
After, We found all co-occurrences, we calculate the
summation ( wn ). This summation was calculate with
∑=
=n
jw jitermin
0),()(
, where, ),( jiterm is the sum of
all co-occurrence of word i vs word j . When ji = , 0),( =jiterm We show outcomes in table 4.
© 2013 ACADEMY PUBLISHER 2371
© 2013 ACADEMY PUBLISHER
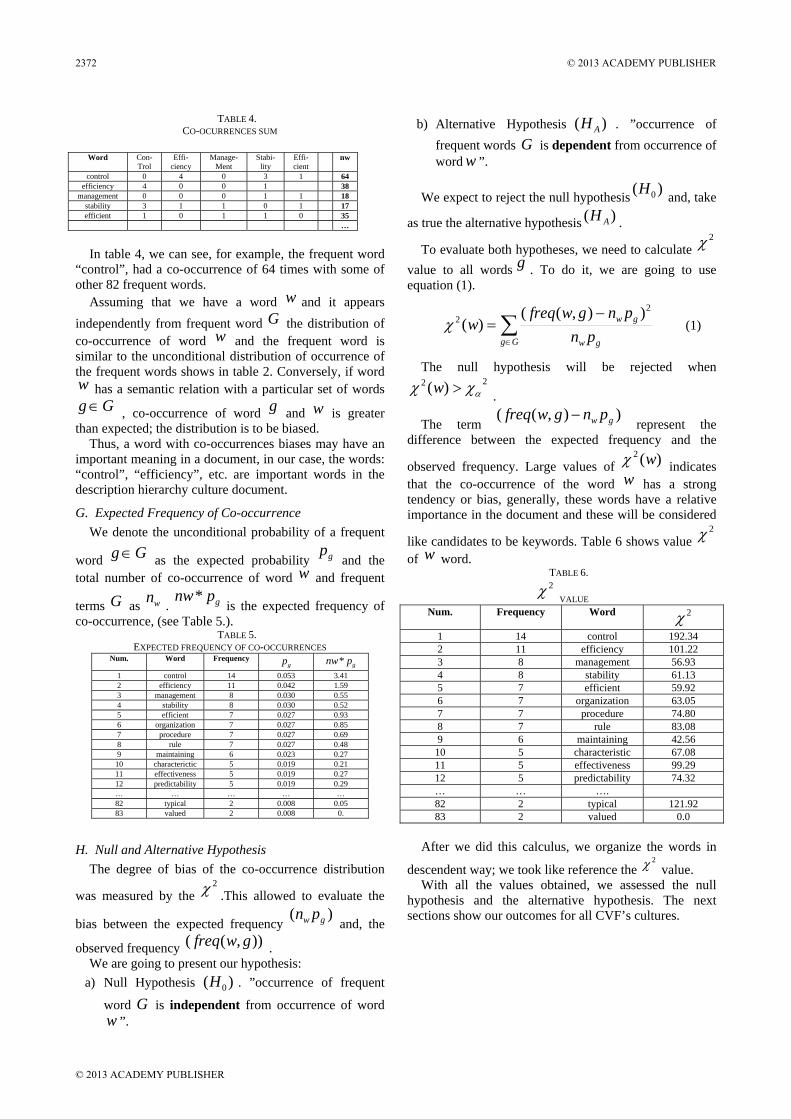
TABLE 4. CO-OCURRENCES SUM
Word Con-
Trol Effi-
ciency Manage-
Ment Stabi-
lity Effi- cient
nw
control 0 4 0 3 1 64 efficiency 4 0 0 1 38
management 0 0 0 1 1 18 stability 3 1 1 0 1 17 efficient 1 0 1 1 0 35
…
In table 4, we can see, for example, the frequent word
“control”, had a co-occurrence of 64 times with some of other 82 frequent words.
Assuming that we have a word w and it appears independently from frequent word G the distribution of co-occurrence of word w and the frequent word is similar to the unconditional distribution of occurrence of the frequent words shows in table 2. Conversely, if word w has a semantic relation with a particular set of words
Gg∈ , co-occurrence of word g and w is greater than expected; the distribution is to be biased.
Thus, a word with co-occurrences biases may have an important meaning in a document, in our case, the words: “control”, “efficiency”, etc. are important words in the description hierarchy culture document.
G. Expected Frequency of Co-occurrence We denote the unconditional probability of a frequent
word Gg∈ as the expected probability gp and the
total number of co-occurrence of word w and frequent
terms G as wn . gpnw* is the expected frequency of
co-occurrence, (see Table 5.). TABLE 5.
EXPECTED FREQUENCY OF CO-OCCURRENCES Num. Word Frequency
gp gpnw*
1 control 14 0.053 3.41 2 efficiency 11 0.042 1.59 3 management 8 0.030 0.55 4 stability 8 0.030 0.52 5 efficient 7 0.027 0.93 6 organization 7 0.027 0.85 7 procedure 7 0.027 0.69 8 rule 7 0.027 0.48 9 maintaining 6 0.023 0.27 10 characterictic 5 0.019 0.21 11 effectiveness 5 0.019 0.27 12 predictability 5 0.019 0.29 … … … … … 82 typical 2 0.008 0.05 83 valued 2 0.008 0.
H. Null and Alternative Hypothesis The degree of bias of the co-occurrence distribution
was measured by the 2χ .This allowed to evaluate the
bias between the expected frequency )( gw pn
and, the
observed frequency )),(( gwfreq . We are going to present our hypothesis:
a) Null Hypothesis )( 0H . ”occurrence of frequent
word G is independent from occurrence of word w ”.
b) Alternative Hypothesis )( AH . ”occurrence of frequent words G is dependent from occurrence of word w ”.
We expect to reject the null hypothesis )( 0H and, take
as true the alternative hypothesis )( AH .
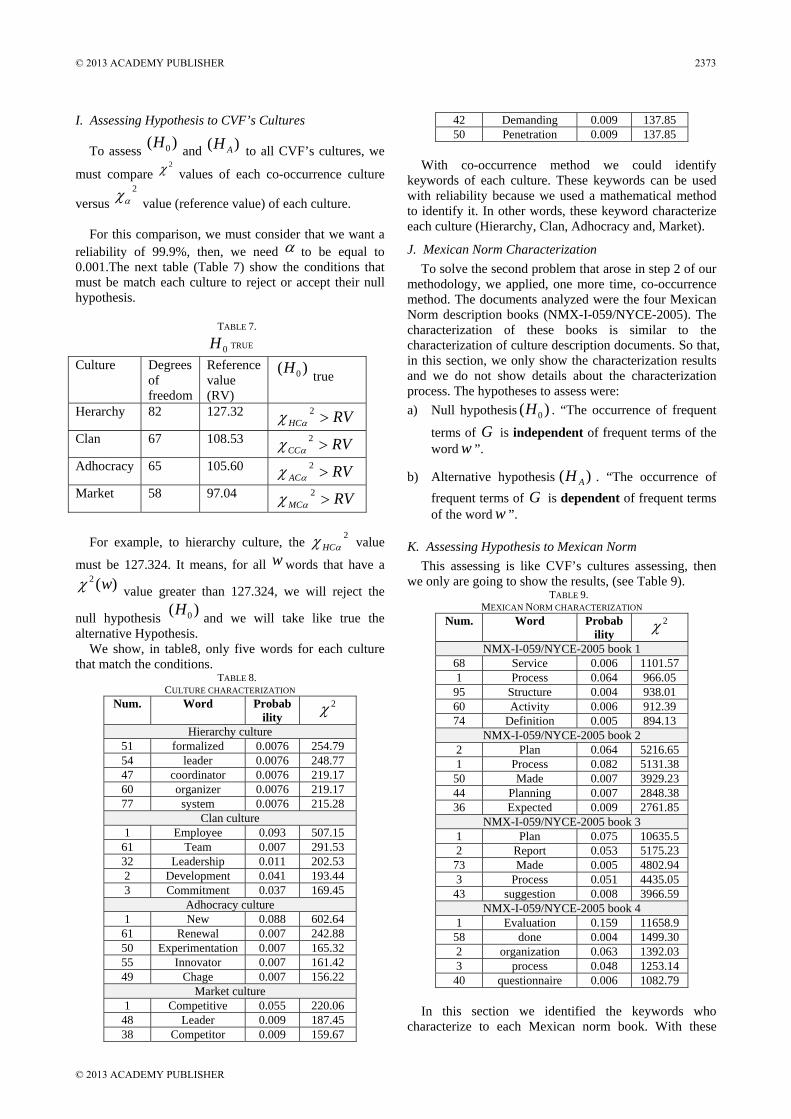
To evaluate both hypotheses, we need to calculate 2χ
value to all words g . To do it, we are going to use equation (1).
∑∈
−=
Gg gw
gw
pnpngwfreq
w2
2 )),(()(χ (1)
The null hypothesis will be rejected when 22 )( αχχ >w .
The term )),(( gw pngwfreq −
represent the difference between the expected frequency and the
observed frequency. Large values of )(2 wχ indicates that the co-occurrence of the word w has a strong tendency or bias, generally, these words have a relative importance in the document and these will be considered
like candidates to be keywords. Table 6 shows value 2χ
of w word. TABLE 6. 2χ VALUE
Num. Frequency Word 2χ 1 14 control 192.34 2 11 efficiency 101.22 3 8 management 56.93 4 8 stability 61.13 5 7 efficient 59.92 6 7 organization 63.05 7 7 procedure 74.80 8 7 rule 83.08 9 6 maintaining 42.56 10 5 characteristic 67.08 11 5 effectiveness 99.29 12 5 predictability 74.32 … … …. 82 2 typical 121.92 83 2 valued 0.0
After we did this calculus, we organize the words in
descendent way; we took like reference the 2χ value.
With all the values obtained, we assessed the null hypothesis and the alternative hypothesis. The next sections show our outcomes for all CVF’s cultures.
2372 © 2013 ACADEMY PUBLISHER
© 2013 ACADEMY PUBLISHER
I. Assessing Hypothesis to CVF’s Cultures
To assess )( 0H and )( AH to all CVF’s cultures, we
must compare 2χ values of each co-occurrence culture
versus 2
αχ value (reference value) of each culture. For this comparison, we must consider that we want a
reliability of 99.9%, then, we need α to be equal to 0.001.The next table (Table 7) show the conditions that must be match each culture to reject or accept their null hypothesis.
TABLE 7.
0H TRUE
Culture Degrees of freedom
Reference value (RV)
)( 0H true
Herarchy 82 127.32 RVHC >2αχ
Clan 67 108.53 RVCC >2αχ
Adhocracy 65 105.60 RVAC >2αχ
Market 58 97.04 RVMC >2αχ
For example, to hierarchy culture, the 2
αχHC value
must be 127.324. It means, for all w words that have a )(2 wχ value greater than 127.324, we will reject the
null hypothesis )( 0H and we will take like true the alternative Hypothesis.
We show, in table8, only five words for each culture that match the conditions.
TABLE 8. CULTURE CHARACTERIZATION
Num. Word Probability
2χ
Hierarchy culture 51 formalized 0.0076 254.7954 leader 0.0076 248.7747 coordinator 0.0076 219.1760 organizer 0.0076 219.1777 system 0.0076 215.28
Clan culture 1 Employee 0.093 507.1561 Team 0.007 291.5332 Leadership 0.011 202.532 Development 0.041 193.443 Commitment 0.037 169.45
Adhocracy culture 1 New 0.088 602.6461 Renewal 0.007 242.8850 Experimentation 0.007 165.3255 Innovator 0.007 161.4249 Chage 0.007 156.22
Market culture 1 Competitive 0.055 220.0648 Leader 0.009 187.4538 Competitor 0.009 159.67
42 Demanding 0.009 137.8550 Penetration 0.009 137.85
With co-occurrence method we could identify
keywords of each culture. These keywords can be used with reliability because we used a mathematical method to identify it. In other words, these keyword characterize each culture (Hierarchy, Clan, Adhocracy and, Market).
J. Mexican Norm Characterization To solve the second problem that arose in step 2 of our
methodology, we applied, one more time, co-occurrence method. The documents analyzed were the four Mexican Norm description books (NMX-I-059/NYCE-2005). The characterization of these books is similar to the characterization of culture description documents. So that, in this section, we only show the characterization results and we do not show details about the characterization process. The hypotheses to assess were: a) Null hypothesis )( 0H . “The occurrence of frequent
terms of G is independent of frequent terms of the word w ”.
b) Alternative hypothesis )( AH . “The occurrence of frequent terms of G is dependent of frequent terms of the word w ”.
K. Assessing Hypothesis to Mexican Norm This assessing is like CVF’s cultures assessing, then
we only are going to show the results, (see Table 9). TABLE 9.
MEXICAN NORM CHARACTERIZATION Num. Word Probab
ility 2χ
NMX-I-059/NYCE-2005 book 1 68 Service 0.006 1101.571 Process 0.064 966.0595 Structure 0.004 938.0160 Activity 0.006 912.3974 Definition 0.005 894.13
NMX-I-059/NYCE-2005 book 2 2 Plan 0.064 5216.651 Process 0.082 5131.3850 Made 0.007 3929.2344 Planning 0.007 2848.3836 Expected 0.009 2761.85
NMX-I-059/NYCE-2005 book 3 1 Plan 0.075 10635.52 Report 0.053 5175.2373 Made 0.005 4802.943 Process 0.051 4435.0543 suggestion 0.008 3966.59
NMX-I-059/NYCE-2005 book 4 1 Evaluation 0.159 11658.958 done 0.004 1499.302 organization 0.063 1392.033 process 0.048 1253.1440 questionnaire 0.006 1082.79
In this section we identified the keywords who
characterize to each Mexican norm book. With these
© 2013 ACADEMY PUBLISHER 2373
© 2013 ACADEMY PUBLISHER
results, in the next section we are going to show details to identify the embedded culture of Mexican norm NMX-I-59/NYCE-2005.
L. Identifying NMX-I-059/NYCE-2005 Embedded Culture
To identify NMX-I-59/NYCE-2005 Mexican Norm’s embedded culture, we used an algorithm.
Algorithm inputs are the keywords identified in section I and section J. Iteratively, all keywords of each book (Mexican Norm books) were compared with all keywords of each culture description document (Hierarchy, Market, Clan, Adhocracy). For example, when we compared the book 1 (NMX-I-59/01-NYCE-2005) vs. the Hierarchy culture description document, we found the keyword SYSTEM in the book 1 and into the Hierarchy culture description document; therefore, this coincidence was accounted.
To carry out quantification and identification of dominant culture, we normalized the number of co-occurrences of each type of culture (Hierarchy, Clan, Market, Adhocracy) and the number of co-occurrences of each Mexican Norm book. Thus, all co-occurrences have same weight and same influence at the moment of identification and quantification of embedded dominant culture.
This algorithm was applied to all books and all culture description documents.
TABLE 10. DOMINANT CULTURE OF MEXICAN NORM
Books Culture Hierarchy Market Clan Adhocracy
NMX-I-59/01-NYCE-2005
34.52 26.80 19.69 18.99
NMX-I-59/02-NYCE-2005
26.63 27.57 8.68 37.11
NMX-I-59/03-NYCE-2005
37.77 35.30 15.39 11.54
NMX-I-59/04-NYCE-2005
27.42 27.60 19.86 25.13
Sum 126.34 117.28 63.61 92.77 Normalized percentage
31.59 29.32 15.90 23.19
The dominant embedded culture of Mexican Norm,
NMX-I-059/NYCE-2005 is the Hierarchy culture with 31.59 points. This result was obtained when we added and normalized the results, (see Table 10).
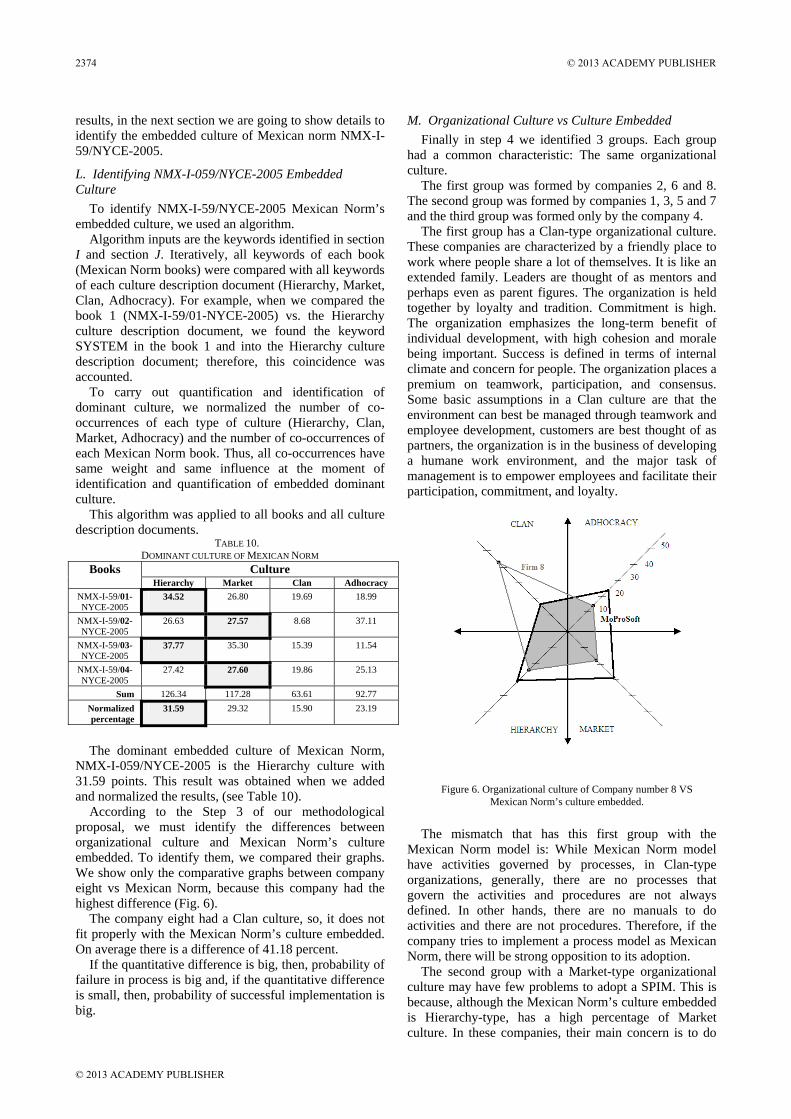
According to the Step 3 of our methodological proposal, we must identify the differences between organizational culture and Mexican Norm’s culture embedded. To identify them, we compared their graphs. We show only the comparative graphs between company eight vs Mexican Norm, because this company had the highest difference (Fig. 6).
The company eight had a Clan culture, so, it does not fit properly with the Mexican Norm’s culture embedded. On average there is a difference of 41.18 percent.
If the quantitative difference is big, then, probability of failure in process is big and, if the quantitative difference is small, then, probability of successful implementation is big.
M. Organizational Culture vs Culture Embedded Finally in step 4 we identified 3 groups. Each group
had a common characteristic: The same organizational culture.
The first group was formed by companies 2, 6 and 8. The second group was formed by companies 1, 3, 5 and 7 and the third group was formed only by the company 4.
The first group has a Clan-type organizational culture. These companies are characterized by a friendly place to work where people share a lot of themselves. It is like an extended family. Leaders are thought of as mentors and perhaps even as parent figures. The organization is held together by loyalty and tradition. Commitment is high. The organization emphasizes the long-term benefit of individual development, with high cohesion and morale being important. Success is defined in terms of internal climate and concern for people. The organization places a premium on teamwork, participation, and consensus. Some basic assumptions in a Clan culture are that the environment can best be managed through teamwork and employee development, customers are best thought of as partners, the organization is in the business of developing a humane work environment, and the major task of management is to empower employees and facilitate their participation, commitment, and loyalty.
The mismatch that has this first group with the
Mexican Norm model is: While Mexican Norm model have activities governed by processes, in Clan-type organizations, generally, there are no processes that govern the activities and procedures are not always defined. In other hands, there are no manuals to do activities and there are not procedures. Therefore, if the company tries to implement a process model as Mexican Norm, there will be strong opposition to its adoption.
The second group with a Market-type organizational culture may have few problems to adopt a SPIM. This is because, although the Mexican Norm’s culture embedded is Hierarchy-type, has a high percentage of Market culture. In these companies, their main concern is to do
Figure 6. Organizational culture of Company number 8 VS Mexican Norm’s culture embedded.
2374 © 2013 ACADEMY PUBLISHER
© 2013 ACADEMY PUBLISHER
quality work. People are competitive and result-oriented. Managers are also very competitive. The organization is based on the emphasis on winning. There are everyday concerns: reputation and success. Success is defined in terms of market share and positioning. In this kind of organizations, employees are in an environment in which there is control of the work. These companies focus on external environment rather than internal affairs. In other words, focus on transactions with elements external to the organization such as suppliers, customers, contracts, licenses, bonds and regulations. Internal control is based in the external environment. In other hands, internal control is depending on market movements. Companies with Market-type organizational culture, worry about creating and maintaining a competitive advantage, being on lookout for cost-benefit results. Its primary goal is customer satisfaction and safety, so the company tries to increase its competitive position and management's main task is to steer the organization towards productivity, which results in great benefits for the company.
Companies with Market culture are 1,3,5 and 7, only have to worry about making a slight cultural shift toward Hierarchy culture. They must keep their current organizational culture.
The third group has a dominant organizational culture type Adhocracy. This means that employees view the organization as a dynamic place to work with an entrepreneurial and creative environment. Therefore, employees tend to be creative and determination to face the risks identified. Meanwhile, leaders also are considered innovators and risk takers. The organization is joined because they are experimenting with new products or services. They are constantly growing and acquiring new resources. The organizational success means having substantial profits from sales of new products or services. They are always looking for market leadership. These organizations encourage individual initiative and freedom of thought, besides foster adaptability, flexibility and creativity in situations where uncertainty, ambiguity and information overload is typical.
This type of companies must change their organizational culture toward Hierarchy culture, where, without losing its innovative spirit, it must be framed in the use of processes and procedures to allow greater discipline in building activities and innovation.
Finally, it must be stated that each company has four types of cultures with different percentages. The culture with the highest percentage is called the dominant culture. Thus, when designing a process improvement strategy should consider the four types of process culture embedded and, the four types of organizational culture
Clan and Market Cultures were the dominant organizational culture detected in the most Mexican companies. This means (hypothesis) that in Mexico is still dominated by companies that are formed by friends or acquaintances.
VI. OUTCOMES
The main outcomes are:
1. Identification of the dominant organizational culture of eight Mexican software development companies.
a. Three companies showed a Clan dominant culture.
b. Four companies showed a Market dominant culture.
c. One company showed a Adhocracy dominant culture.
Additionally, it was observed that: i) Mexican software development companies arise primarily as an association of friends, relatives or acquaintances. ii) Most of these companies there are no processes. iii) Most of these companies do not consider important to understand their organizational culture. These observations cannot be generalized to all Mexican software development companies, since the number of companies surveyed are not representative sample of all businesses that exist in Mexico, however, give us an indication of the nature of Mexican software industry.
2. Identification of the dominant embedded culture of Mexican Norm NMX-I-059/NYCE-2005. The Mexican Norm has a Hierarchy culture. This culture has a 31.58% into the Norm descriptive books; however, The Market culture has a percentage very close to dominant culture.
3. Characterization of the four cultures. These cultures are described in the CVF. The quantity co-occurrences were :
a. Hierarchy culture: 44 co-occurrences. b. Clan culture: 27 co-occurrences. c. Market culture: 17 co-occurrences. d. Adhocracy culture: 24 co-occurrences.
4. Characterization of the four Mexican Norm books. The quantity of co-occurrences that characterized each book were:
a. NMX-I-059/01-NYCE-2005 (book 1): 87 co-occurrences.
b. NMX-I-059/02-NYCE-2005 (book 2): 96 co-occurrences.
c. NMX-I-059/03-NYCE-2005 (book 3): 99 co-occurrences.
d. NMX-I-059/04-NYCE-2005 (book 4): 99 co-occurrences.
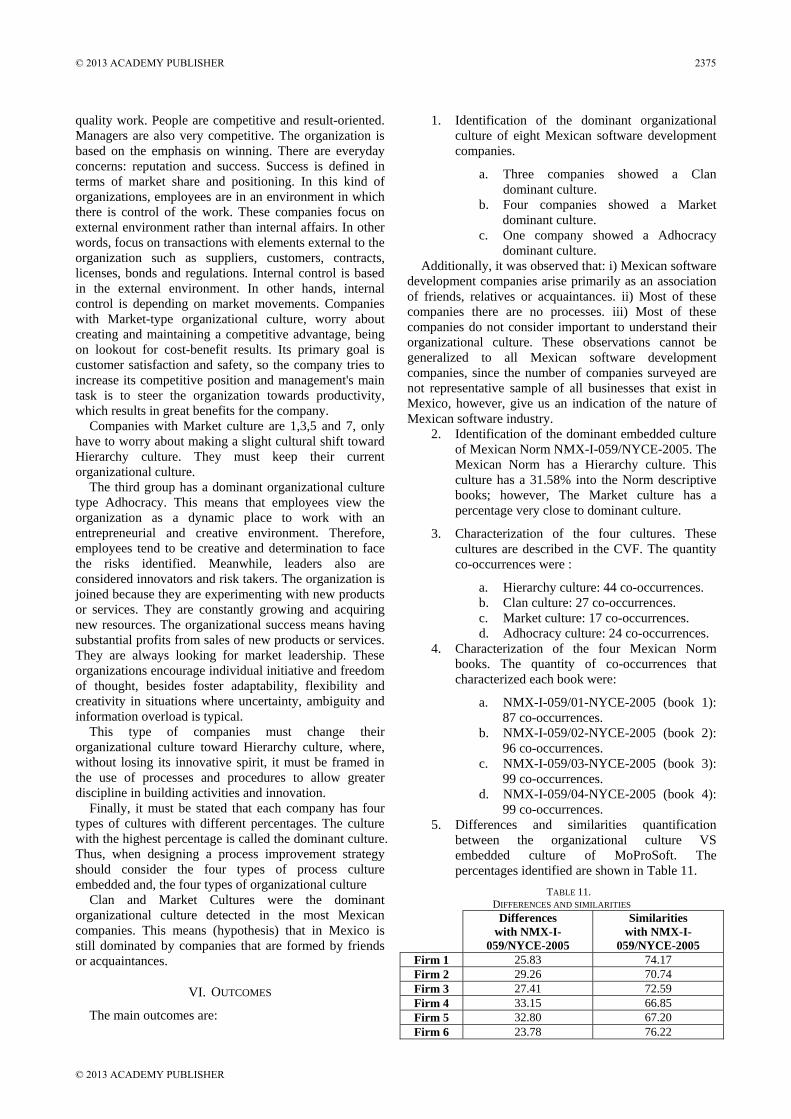
5. Differences and similarities quantification between the organizational culture VS embedded culture of MoProSoft. The percentages identified are shown in Table 11.
TABLE 11. DIFFERENCES AND SIMILARITIES
Differences with NMX-I-
059/NYCE-2005
Similarities with NMX-I-
059/NYCE-2005 Firm 1 25.83 74.17 Firm 2 29.26 70.74 Firm 3 27.41 72.59 Firm 4 33.15 66.85 Firm 5 32.80 67.20 Firm 6 23.78 76.22
© 2013 ACADEMY PUBLISHER 2375
© 2013 ACADEMY PUBLISHER
Firm 7 23.29 76.71 Firm 8 41.18 58.82
6. Qualitative interpretation about quantitative differences. In Section 5.5 we show this interpretation.
VII. RELATED WORK
There are some researchers working in this area, for example: Siakas, [2], developed the CODES assessment model, which assesses the cultural fit between national culture and organizational culture. The CODES model includes two sub-models, namely the C.HI.D.D.I typology, this tries to identify the national culture and, the Top-down, Bottom-up model tries to identify the organizational culture and structure. This model can be used by organizations developing software in any country to do a successful adoption and implementation of a Software Quality Management System. Moreover, Hazzan [3], researched the connections between a national culture and the culture inspired by software development methods (SDMS). He proposed a model that can help predict whether a specific SDM fits a specific national culture. His model firs define the terms “tightness of an SDM” and “tightness of a national culture”. Then, He can detected the degree to which a given SDM will be accepted by a specific national culture in general, and by a specific team that is part of the culture, in particular.
Whoever, the difference with our proposal is: we do an identification of the technology's culture embedded and we do a comparison between this and the company's organizational culture.
VIII. CONCLUSIONS
An important factor to adopt SPIMs is undoubtedly the organizational culture of companies and the culture embedded of the SPIMs. Their identification and consideration should not be treated as an afterthought.
The SPIM has an embedded culture. This corresponds to person’s culture or institution that developed it. The SPIM’s culture embedded can be identified and quantified. This will facilitate its adoption and institutionalization.
With our methodology proposal, we can identify and quantify cultural differences that exist between a company’s organizational culture and a SPIM’s culture embedded. The results will allow:
1. Reduce adoption SPIM effort. 2. Reduce economic loss on adoption activities. 3. Reduce risk of failure in adoption activities. 4. Increase chances of success in adoption.
The information generated by our methodology will be useful to employers because they could create plans and strategies for adoption, institutionalization of a SPIM within their company, even they may assess appropriateness of adopting or rejecting certain SPIM depending on the percentage identified of matches and
cultural differences. A greater percentage of differences mean greater economic investment for the adoption.
Before companies start with adoption activities, it would be good practice to begin with an analysis of their organizational culture and SPIM selected. Understand this analysis, would give them a competitive advantage. Through this analysis they would identify and quantify their organizational culture, the SPIM‘s culture embedded and the differences and similarities between them. This information would be used in their plans and strategies adoption.
Finally, we must say something about our outcomes of this research: they must be taken with caution and cannot be generalized to all companies. However, companies could take them like a guide for adoption process activities. We think that is possible to apply this cultural-methodological proposal in different technologies areas and, with different process models; for instance, we are applying our method to identify SCRUM [37] embedded culture because we need to determine matches and mismatches between SCRUM’s culture versus organizational culture of Mexican software development companies, although, there are some drawbacks like: a) We can’t generalize our outcomes because all the time the situations can be different because we are working with persons and they are unpredictable, b) Organizational cultures are dynamic and change over time.
IX. FUTURE WORK
There is still much work to do in this research. In future work we have identified, include the following:
1. Automation of the algorithm which identify matches. Currently this is a part of our methodology that it is performed in a non-automatic way.
2. Develop a document with recommendations about actions to must be carried out to align the organizational culture of the company to embedded culture of MoProSoft.
3. Applying our methodology to other technology, to analyze its performance in other contexts.
4. Identify and quantify the embedded culture of MoProSoft using a different methodology to our methodology. In order to observe the differences and similarities between outcomes.
5. Conduct an investigation that allows us to determine the degree of correlation between companies with a dominant organizational culture type Hierarchy vs MoProSoft successful adoptions. To do this, we need to work with software development companies that are in initial adoption activities. The expected result would be that there is a strong correlation between these two factors.
6. Identify correlation degree between companies with different dominant organizational culture to
2376 © 2013 ACADEMY PUBLISHER
© 2013 ACADEMY PUBLISHER
Hierarchy culture vs unsuccessful MoProSoft implementations. The expected result is that there also exists a strong correlation between these two factors.
7. Analyze cultural factors present in software companies that successfully implemented Moprosoft but not use it. To investigate whether there was an appropriate cultural fit between the organizational culture of the company and embedded culture of MoProSoft, if not, it may be that only fulfilled requirement to pass the official assessment applied by NYCE, but not carried out a proper process of institutionalizing the process within the company.
These are some researches should be carried out in order to continue our work.
REFERENCES
[1] O. Ngwenyama, and P.A. Nielsen, “Competing values in software process improvement: an assumption analysis of CMM from an organizational culture perspective,” IEEE Trans. on Engineering Management, vol.50 (1), pp. 100-112, February 2003.
[2] K. V. Siakas, “What has culture to do with SPI?,” in Proceedings of 28th Euromicro Conference, Dortmund, Germany, 2002, pp. 376-381.
[3] O. Hazzan and Y. Dubinsky, “Clashes between culture and software development methods: the case of the Israeli Hi-Tech industry and extreme programming,” in Proceedings of Agile Conference, Denver CO, 2005, pp. 59-69.
[4] J. L. Nielsen, Critical success factors for implementing an ERP system in a university environment: a case study from the Australian HES, Bachelor thesis, Faculty of Engineering and Information Technology, Griffith University, 2002.
[5] X.T. Thavapragasam, “Cultural influences on ERP implementation success,” in Proceedings of The first Australian Undergraduate Students’ Computing Conference, Australia, 2003, pp. 93-99.
[6] W. Skok, and H. Döringer, “Potential impact of cultural differences on enterprise resource planning (ERP) projects”. The Electronic Journal on Information Systems in Developing Countries, vol. 7, pp. 1-8. 2002.
[7] K.S. Cameron and R.E. Quinn, Diagnosing and changing organizational culture based on the competing values framework, 1st ed., Jossey-Bass, San Francisco, CA. 2006.
[8] G. Hofstede, Culture’s Consequences: Comparing Values, Behaviors, Institutions and Organizations across Nations, Sage, Thousand Oaks, CA, 2001.
[9] B. Lin, and D. Berg, “Effects of cultural differences on technology transfer projects: an empirical study of Taiwanese manufacturing companies,” International Journal of Project Management, vol. 19, pp. 287-293, 2001.
[10] F. Williams, and D. V. Gibson, Technology transfer: a communication perspective. SAGE Publications, London, 1990.
[11] J. L. Nicolet, “Technology transfer or the clash of two cultures,” in Proceedings of Human Factors and Power Plants, 1992, pp. 195-199.
[12] E. H. Schein, Organizational culture and leadership, Jossey-Bass, San Francisco, CA. 2004.
[13] W. G. Ouchi, Theory Z: How American business can meet the japanese Challenge, Addison-Wesley, Boston, 1981.
[14] R. Pascale, and A. Athos, The Art of Japanese Management. Simon & Schuter, New York, 1981.
[15] T. J. Peters, and R. H. Waterman, In search of excellence, HarperCollings, New York, 1982.
[16] T. E. Deal, and A. A. Kennedy, Corporate cultures: the rights and rituals of corporate life, Addison-Wesley, Boston, 1982.
[17] K. S. Cameron, and R. D. Ettington, The conceptual foundations of organizational culture, John C. Smart: Higher Education: Handbook of Theory and Research, Vol. 4, Norwell, Mass.: Kluwer. 1988
[18] R. D. Denison, Corporate culture and organizational effectiveness, Wiley, Hoboken, N.J. 1990.
[19] H. Trice, and J. Beyer, The cultures of work organizations, Upper Saddle River, Prentice Hall N.J. 1993.
[20] G. Hofstede, and G. J. Hofstede, Cultures and organizations software of the mind, McGrawn Hill, New York, 2005.
[21] V. Sathe, “Implications of Corporate Culture: A Manager’s Guide to Action”, Organizational Dynamics, Vol. 12, Elsevier Inc, 1983, pp. 4-23.
[22] J.P. Kotter, and J. L. Heskett, Corporate culture and performance, Free Press, New York, 1992.
[23] D. R. Arnold, and L.M. Capella, “Corporate Culture and the Marketing Concept: A Diagnostic Instrument for Utilities”, Public Utilities Fortnightly, pp. 32-38, 1985.
[24] J. Martin, Cultures in Organizations. Oxford University Press, New York, 1992.
[25] J. R. Detert, R. G. Schroeder, and J.J. Mauriel, “A framework for linking culture and improvement initiatives in organizations”, The Academy of Management Review, pp. 850-863, 2000.
[26] C. M. McDermott, and G.N. Stock, “Organizational culture and advanced manufacturing technology implementation”. Journal of Operations Management, Vol. 17, pp. 521-533, 1999.
[27] Y. Weber, and N. Pliskin, “The effects of information systems integration and organizational culture on a firm’s effectiveness”, Information and Management, Vol. 30, pp. 81-90, 1996.
[28] E. F. Cabrera, and J. Bonache, “An expert HR system for aligning organizational culture and strategy”. Human Resource Planning, Vol.22, pp. 51-60, 1999.
[29] R. Harris, and R. Davison, “Anxiety and involvement: Cultural dimensions of attitudes toward computers in developing countries”; Journal of Global Information Management, Vol. 7, pp. 26-38, 1999.
[30] S. L. Pfleeger, and W. Menezes, “Marketing Technology to Software Practitioners”, IEEE Software, Vol. 17. pp 27-33, 2000. doi: 10.1109/52.819965
[31] A. Pacey, The culture of technology, MIT Press, Cambridge, 1983.
[32] T. Chintakovid, “Cultural differences and end-user computing”, in Proceedings of VLHCC´05, pp. 325-326, 2005. doi: 10.1109/VLHCC.2005.29
[33] J. L. Nicolet, “Technology Transfer or the clash of two cultures”, in Proceedings of Human Factors and Power Plants, pp. 195-199, 1992.
[34] A. Reddy, La culture: clef du development, UNESCO, Paris, Francia, 1983.
[35] H. K. Klein, and D. P. Truex, “Discourse analysis an approach to investigating organizational Emergence”, In Sign of Work, Walter de Gruyter, New York, pp. 227-268 1996.
© 2013 ACADEMY PUBLISHER 2377
© 2013 ACADEMY PUBLISHER
[36] P. Manning, and B. Cullum-Swan, Narrative, content and semiotic analysis, Handbook of Qualitative Research, Sage, Newbury Park, CA, 1994.
[37] K. Schwaber, and M. Beedle, Agile software development with SCRUM, Prentice Hall, 2001.
Jorge R. Aguilar Cisneros received his PhD degree in Software Engineering from UPAEP (Universidad Popular Autónoma del Estado de Puebla), Puebla, México, 2009. He is a professor in the UPAEP since 2006. He is certified like SCRUM Master and PSP Developer. His research interests include Software Process Improvement and Short-Software projects.
Dr. Aguilar is member of the IEEE and the International Council on Systems Engineering (INCOSE).
Ricardo Valerdi received his PhD degree from University of Southern California. 2005. His research interest includes cost estimation of complex systems, test & evaluation, human systems integration, enterprise transformation, and performance measurement. His research has been funded by Army Test & Evaluation, Navy Acquisition Research Program, Air Force
Office of the Surgeon General, Air Force Acquisition Chief Process Office, BAE Systems, Lockheed Martin, and the IBM Center for the Business of Government. Dr. Valerdi is a two-time recipient of the Best Thesis Advisor Award in the MIT Technology & Policy Program, the Best Article of the Year Award in the Systems Engineering Journal, Dr. Valerdi is the co-Editor-in-Chief of the Journal of Enterprise Transformation, served on the Board of Directors of the International Council on Systems Engineering, and is a Senior Member of IEEE.
2378 © 2013 ACADEMY PUBLISHER
© 2013 ACADEMY PUBLISHER