substation monitoring system - siemens · the transducers can be mounted directly to the gis...
TRANSCRIPT
Siemens Transmission and Distribution Ltd PO BOX 98 Tel: +44 (0)191 401 5510 North Farm Road Fax: +44 (0)191 401 5580 Hebburn Tyne & Wear
NE31 1LX A Siemens Company. Registered Number 631825 Registered Office: Siemens House, Oldbury, Bracknell, Berkshire RG12 8FZ, England
Substation Monitoring System
SF6 Gas Density Monitoring
Siemens Transmission and Distribution Ltd PO BOX 98 Tel: +44 (0)191 401 5510 North Farm Road Fax: +44 (0)191 401 5580 Hebburn Tyne & Wear
NE31 1LX A Siemens Company. Registered Number 631825 Registered Office: Siemens House, Oldbury, Bracknell, Berkshire RG12 8FZ, England
System Description Introduction
As a result of recent European legislation on the control of greenhouse gasses, utilities and manufacturers alike are now being forced to reduce SF6 emissions to minimal levels, namely, 0.5% per annum. In order to achieve this, and also to prove to the regulatory bodies that this is being achieved, a more accurate inventory system for the SF6 gas in use on substations is required. Siemens have been developing an SF6 Gas Density Monitoring System for a number of years with the aim of having a suitable system in place to meet this requirement. The Siemens SF6 Gas Density Monitoring (GDM) System has been designed to allow the user a greater degree of flexibility for measurements and alarms than that currently provided by gauges with contacts. The system uses SF6 Density transducers which operate with a 4 to 20mA current loop technology for high noise immunity. The transducers can be mounted directly to the GIS chamber via an industry standard gas “top-up” connection or retrofitted to gas monitoring boxes housing SF6 gas pressure gauges where ease of access is a requirement. The transducers are connected via twisted pair, shielded cable to GDM Node Units, installed within the GIS Hall. Up to 45 Density transducers can be connected to each GDM Node Unit which houses the data acquisition and storage facilities. The Node Units are connected via fibre optic communications cable to a central GDM control cubicle where an HMI is available to provide access to the data and where alarm data is automatically generated. Multiple Node Units can be connected to the central GDM Control Cubicle to provide adequate coverage for every size of GIS substation.
Siemens Transmission and Distribution Ltd PO BOX 98 Tel: +44 (0)191 401 5510 North Farm Road Fax: +44 (0)191 401 5580 Hebburn Tyne & Wear
NE31 1LX A Siemens Company. Registered Number 631825 Registered Office: Siemens House, Oldbury, Bracknell, Berkshire RG12 8FZ, England
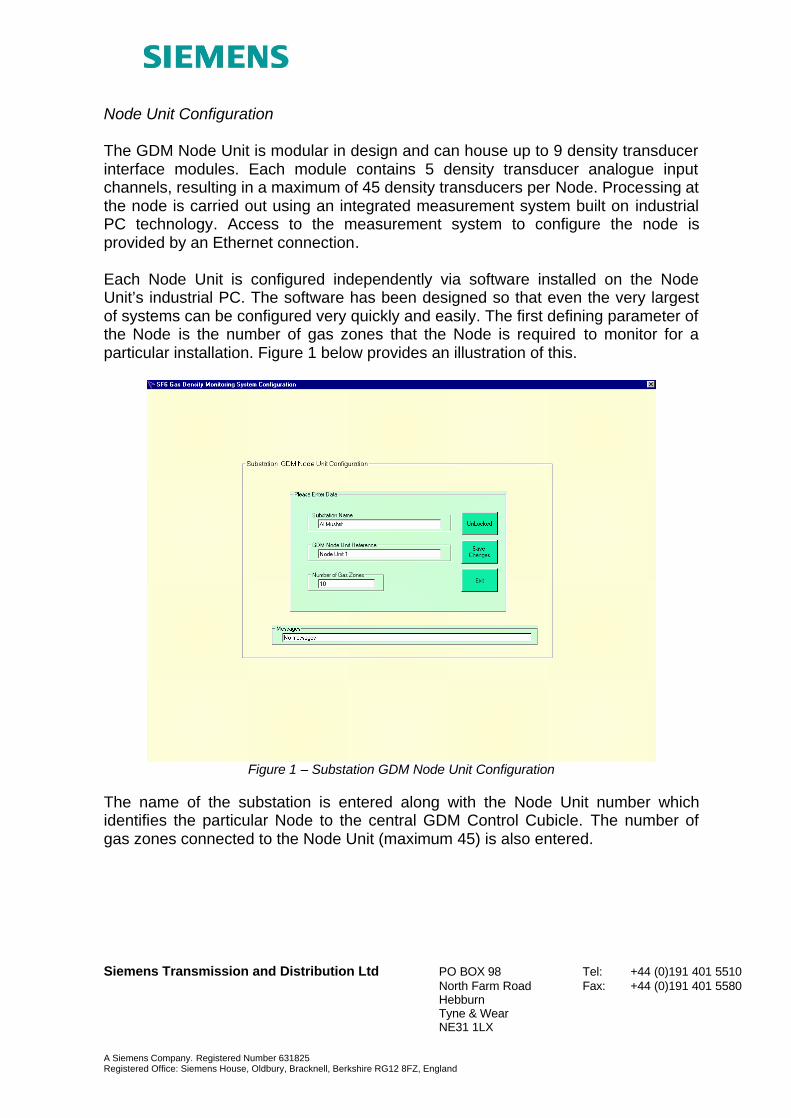
Node Unit Configuration The GDM Node Unit is modular in design and can house up to 9 density transducer interface modules. Each module contains 5 density transducer analogue input channels, resulting in a maximum of 45 density transducers per Node. Processing at the node is carried out using an integrated measurement system built on industrial PC technology. Access to the measurement system to configure the node is provided by an Ethernet connection. Each Node Unit is configured independently via software installed on the Node Unit’s industrial PC. The software has been designed so that even the very largest of systems can be configured very quickly and easily. The first defining parameter of the Node is the number of gas zones that the Node is required to monitor for a particular installation. Figure 1 below provides an illustration of this.
Figure 1 – Substation GDM Node Unit Configuration
The name of the substation is entered along with the Node Unit number which identifies the particular Node to the central GDM Control Cubicle. The number of gas zones connected to the Node Unit (maximum 45) is also entered.
Siemens Transmission and Distribution Ltd PO BOX 98 Tel: +44 (0)191 401 5510 North Farm Road Fax: +44 (0)191 401 5580 Hebburn Tyne & Wear
NE31 1LX A Siemens Company. Registered Number 631825 Registered Office: Siemens House, Oldbury, Bracknell, Berkshire RG12 8FZ, England
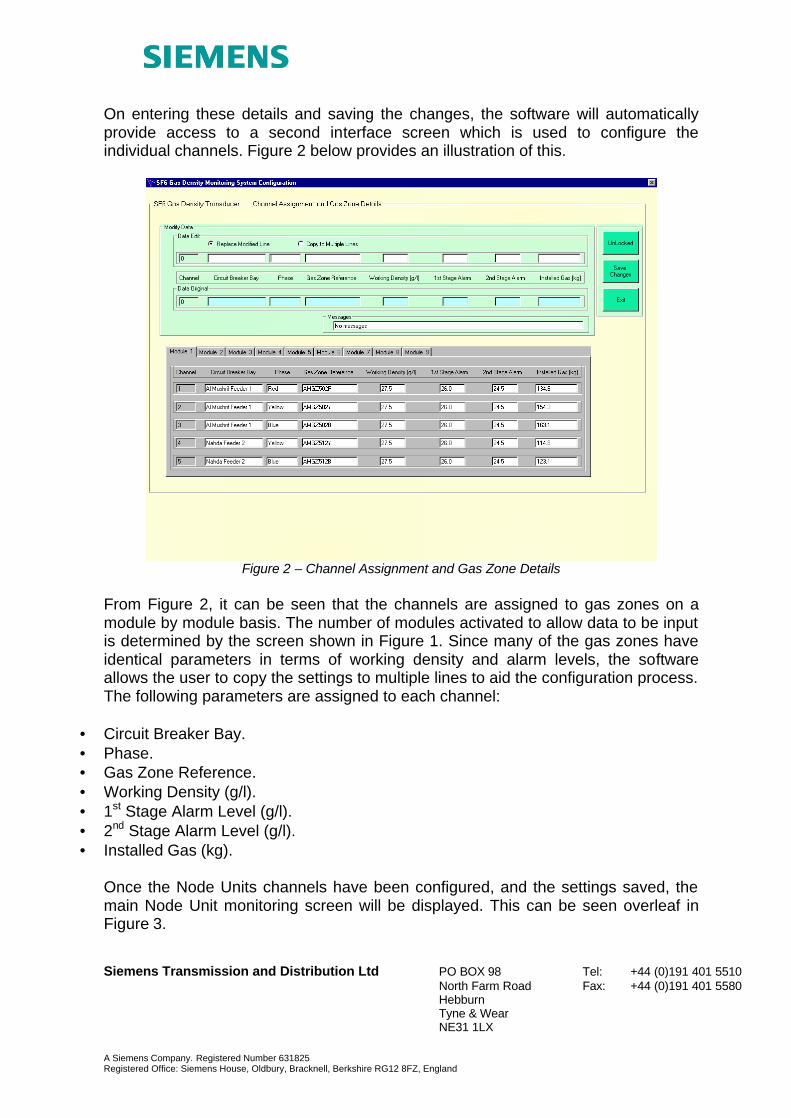
On entering these details and saving the changes, the software will automatically provide access to a second interface screen which is used to configure the individual channels. Figure 2 below provides an illustration of this.
Figure 2 – Channel Assignment and Gas Zone Details
From Figure 2, it can be seen that the channels are assigned to gas zones on a module by module basis. The number of modules activated to allow data to be input is determined by the screen shown in Figure 1. Since many of the gas zones have identical parameters in terms of working density and alarm levels, the software allows the user to copy the settings to multiple lines to aid the configuration process. The following parameters are assigned to each channel:
• Circuit Breaker Bay. • Phase. • Gas Zone Reference. • Working Density (g/l). • 1st Stage Alarm Level (g/l). • 2nd Stage Alarm Level (g/l). • Installed Gas (kg).
Once the Node Units channels have been configured, and the settings saved, the main Node Unit monitoring screen will be displayed. This can be seen overleaf in Figure 3.
Siemens Transmission and Distribution Ltd PO BOX 98 Tel: +44 (0)191 401 5510 North Farm Road Fax: +44 (0)191 401 5580 Hebburn Tyne & Wear
NE31 1LX A Siemens Company. Registered Number 631825 Registered Office: Siemens House, Oldbury, Bracknell, Berkshire RG12 8FZ, England
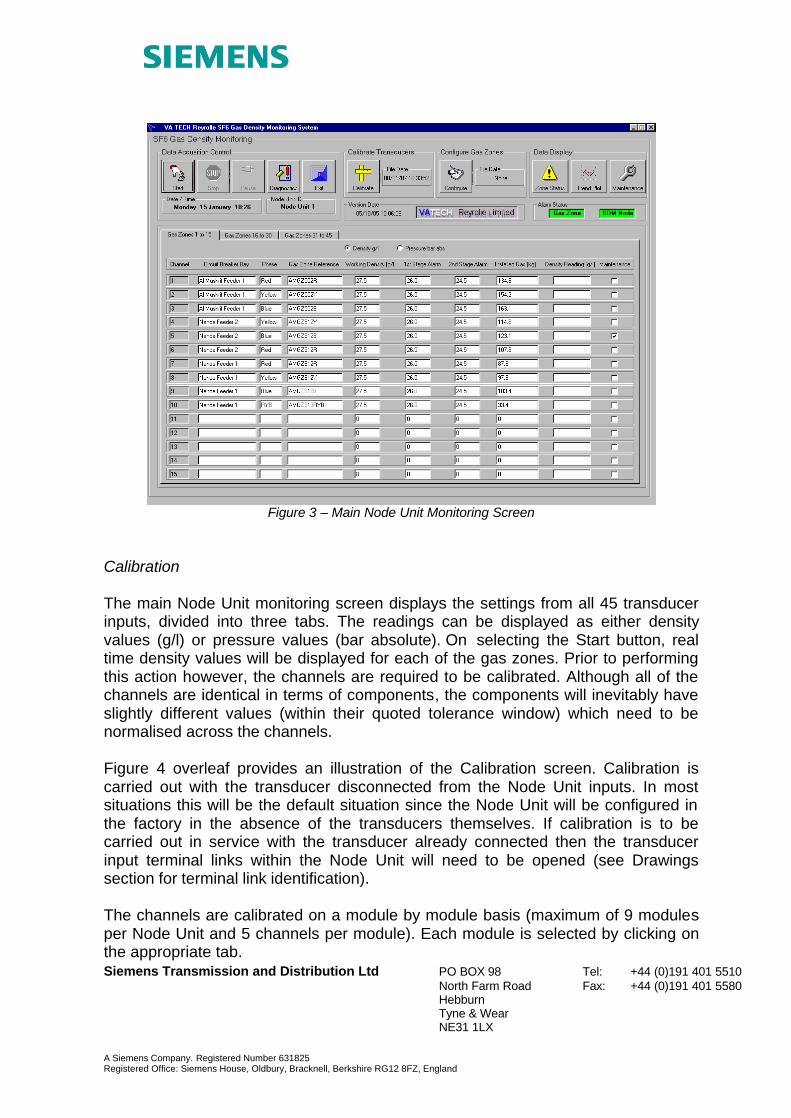
Figure 3 – Main Node Unit Monitoring Screen
Calibration The main Node Unit monitoring screen displays the settings from all 45 transducer inputs, divided into three tabs. The readings can be displayed as either density values (g/l) or pressure values (bar absolute). On selecting the Start button, real time density values will be displayed for each of the gas zones. Prior to performing this action however, the channels are required to be calibrated. Although all of the channels are identical in terms of components, the components will inevitably have slightly different values (within their quoted tolerance window) which need to be normalised across the channels. Figure 4 overleaf provides an illustration of the Calibration screen. Calibration is carried out with the transducer disconnected from the Node Unit inputs. In most situations this will be the default situation since the Node Unit will be configured in the factory in the absence of the transducers themselves. If calibration is to be carried out in service with the transducer already connected then the transducer input terminal links within the Node Unit will need to be opened (see Drawings section for terminal link identification). The channels are calibrated on a module by module basis (maximum of 9 modules per Node Unit and 5 channels per module). Each module is selected by clicking on the appropriate tab.
Siemens Transmission and Distribution Ltd PO BOX 98 Tel: +44 (0)191 401 5510 North Farm Road Fax: +44 (0)191 401 5580 Hebburn Tyne & Wear
NE31 1LX A Siemens Company. Registered Number 631825 Registered Office: Siemens House, Oldbury, Bracknell, Berkshire RG12 8FZ, England
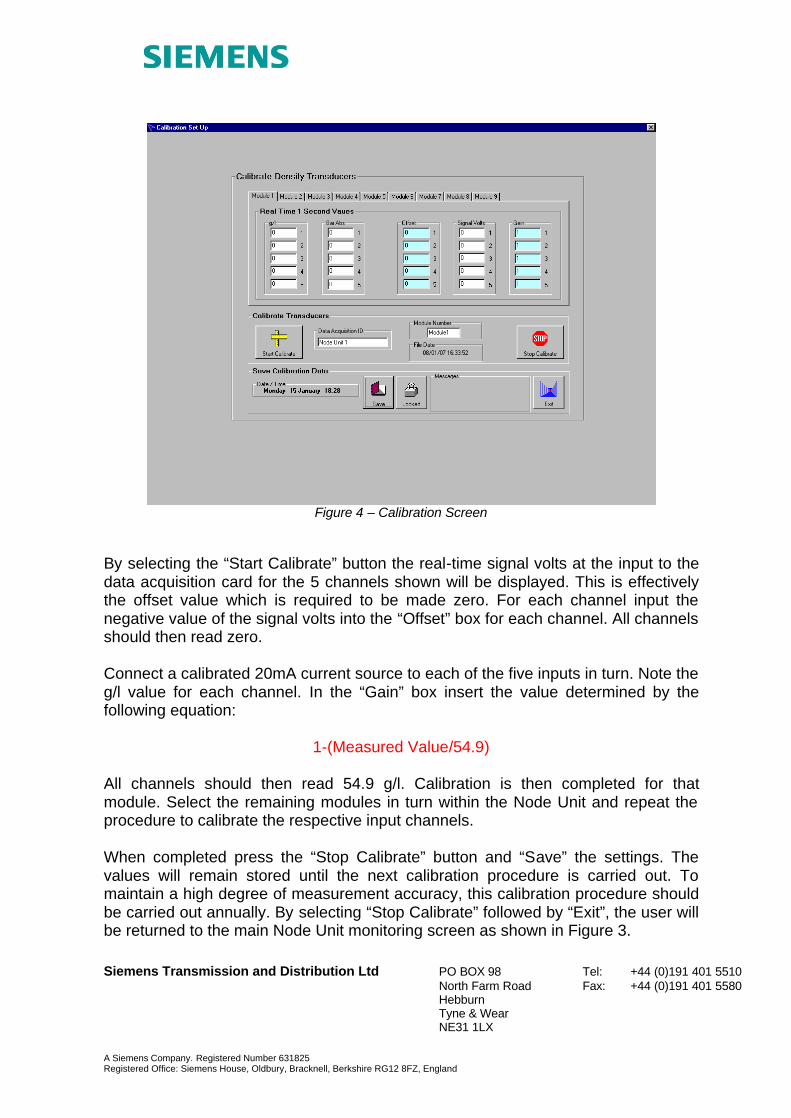
Figure 4 – Calibration Screen
By selecting the “Start Calibrate” button the real-time signal volts at the input to the data acquisition card for the 5 channels shown will be displayed. This is effectively the offset value which is required to be made zero. For each channel input the negative value of the signal volts into the “Offset” box for each channel. All channels should then read zero. Connect a calibrated 20mA current source to each of the five inputs in turn. Note the g/l value for each channel. In the “Gain” box insert the value determined by the following equation:
1-(Measured Value/54.9)
All channels should then read 54.9 g/l. Calibration is then completed for that module. Select the remaining modules in turn within the Node Unit and repeat the procedure to calibrate the respective input channels. When completed press the “Stop Calibrate” button and “Save” the settings. The values will remain stored until the next calibration procedure is carried out. To maintain a high degree of measurement accuracy, this calibration procedure should be carried out annually. By selecting “Stop Calibrate” followed by “Exit”, the user will be returned to the main Node Unit monitoring screen as shown in Figure 3.
Siemens Transmission and Distribution Ltd PO BOX 98 Tel: +44 (0)191 401 5510 North Farm Road Fax: +44 (0)191 401 5580 Hebburn Tyne & Wear
NE31 1LX A Siemens Company. Registered Number 631825 Registered Office: Siemens House, Oldbury, Bracknell, Berkshire RG12 8FZ, England
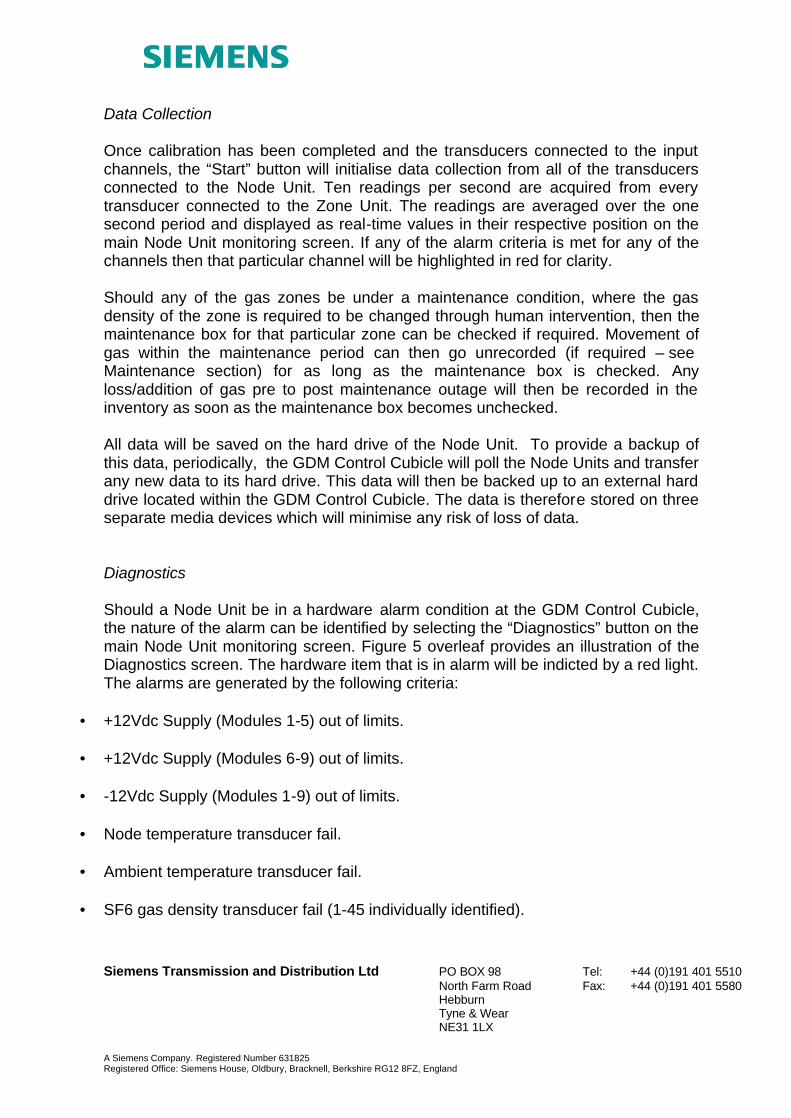
Data Collection Once calibration has been completed and the transducers connected to the input channels, the “Start” button will initialise data collection from all of the transducers connected to the Node Unit. Ten readings per second are acquired from every transducer connected to the Zone Unit. The readings are averaged over the one second period and displayed as real-time values in their respective position on the main Node Unit monitoring screen. If any of the alarm criteria is met for any of the channels then that particular channel will be highlighted in red for clarity. Should any of the gas zones be under a maintenance condition, where the gas density of the zone is required to be changed through human intervention, then the maintenance box for that particular zone can be checked if required. Movement of gas within the maintenance period can then go unrecorded (if required – see Maintenance section) for as long as the maintenance box is checked. Any loss/addition of gas pre to post maintenance outage will then be recorded in the inventory as soon as the maintenance box becomes unchecked. All data will be saved on the hard drive of the Node Unit. To provide a backup of this data, periodically, the GDM Control Cubicle will poll the Node Units and transfer any new data to its hard drive. This data will then be backed up to an external hard drive located within the GDM Control Cubicle. The data is therefore stored on three separate media devices which will minimise any risk of loss of data. Diagnostics Should a Node Unit be in a hardware alarm condition at the GDM Control Cubicle, the nature of the alarm can be identified by selecting the “Diagnostics” button on the main Node Unit monitoring screen. Figure 5 overleaf provides an illustration of the Diagnostics screen. The hardware item that is in alarm will be indicted by a red light. The alarms are generated by the following criteria:
• +12Vdc Supply (Modules 1-5) out of limits.
• +12Vdc Supply (Modules 6-9) out of limits.
• -12Vdc Supply (Modules 1-9) out of limits.
• Node temperature transducer fail.
• Ambient temperature transducer fail.
• SF6 gas density transducer fail (1-45 individually identified).
Siemens Transmission and Distribution Ltd PO BOX 98 Tel: +44 (0)191 401 5510 North Farm Road Fax: +44 (0)191 401 5580 Hebburn Tyne & Wear
NE31 1LX A Siemens Company. Registered Number 631825 Registered Office: Siemens House, Oldbury, Bracknell, Berkshire RG12 8FZ, England
Figure 5 – Diagnostics Screen
Failure of one of the power supplies to the input modules will produce an alarm condition for both the relevant power supply and all of the SF6 density transducer inputs connected to the affected modules since they will be inactive and unable to gather data. All alarms are recorded in the Alarm log which can be viewed from this screen. The alarms are listed in chronological order. Bt selecting “Close Diagnostics” the user will be returned to the main Node Unit monitoring screen. Predictive Alarms and SF6 Gas Inventory One of the main advantages of the GDM system as opposed to the conventional method of monitoring gas within GIS substations is the fact that the system can readily identify leaks at a very early stage and predict when alarm criteria will be met. By selecting “Zone Status” from the main Node Unit monitoring screen the current predictions for each gas zone can be viewed. Figure 6 overleaf provides an illustration of the Zone Status screen.
Siemens Transmission and Distribution Ltd PO BOX 98 Tel: +44 (0)191 401 5510 North Farm Road Fax: +44 (0)191 401 5580 Hebburn Tyne & Wear
NE31 1LX A Siemens Company. Registered Number 631825 Registered Office: Siemens House, Oldbury, Bracknell, Berkshire RG12 8FZ, England
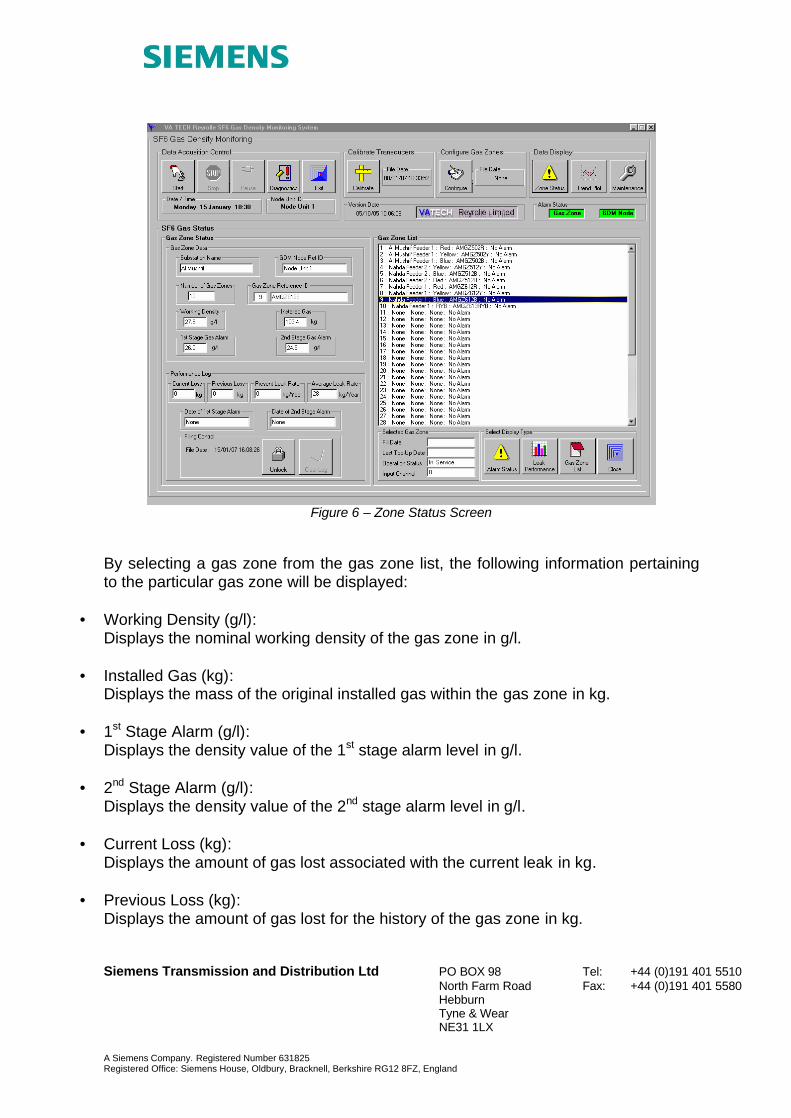
Figure 6 – Zone Status Screen
By selecting a gas zone from the gas zone list, the following information pertaining to the particular gas zone will be displayed:
• Working Density (g/l): Displays the nominal working density of the gas zone in g/l.
• Installed Gas (kg): Displays the mass of the original installed gas within the gas zone in kg.
• 1st Stage Alarm (g/l): Displays the density value of the 1st stage alarm level in g/l.
• 2nd Stage Alarm (g/l): Displays the density value of the 2nd stage alarm level in g/l.
• Current Loss (kg): Displays the amount of gas lost associated with the current leak in kg.
• Previous Loss (kg): Displays the amount of gas lost for the history of the gas zone in kg.
Siemens Transmission and Distribution Ltd PO BOX 98 Tel: +44 (0)191 401 5510 North Farm Road Fax: +44 (0)191 401 5580 Hebburn Tyne & Wear
NE31 1LX A Siemens Company. Registered Number 631825 Registered Office: Siemens House, Oldbury, Bracknell, Berkshire RG12 8FZ, England
• Date of 1st Stage Alarm: Displays the date when the 1st stage alarm is expected to be reached, based on the current leak rate.
• Date of 2nd Stage Alarm: Displays the date when the 2nd stage alarm is expected to be reached, based on the current leak rate.
• Leak Performance: A log of the leak performance of the individual gas zones connected to the Node Unit is automatically produced. Those gas zones that have lost the largest amount of gas and those that are leaking at the fastest rate are displayed at the top of the list so that they can be easily identified and targeted.
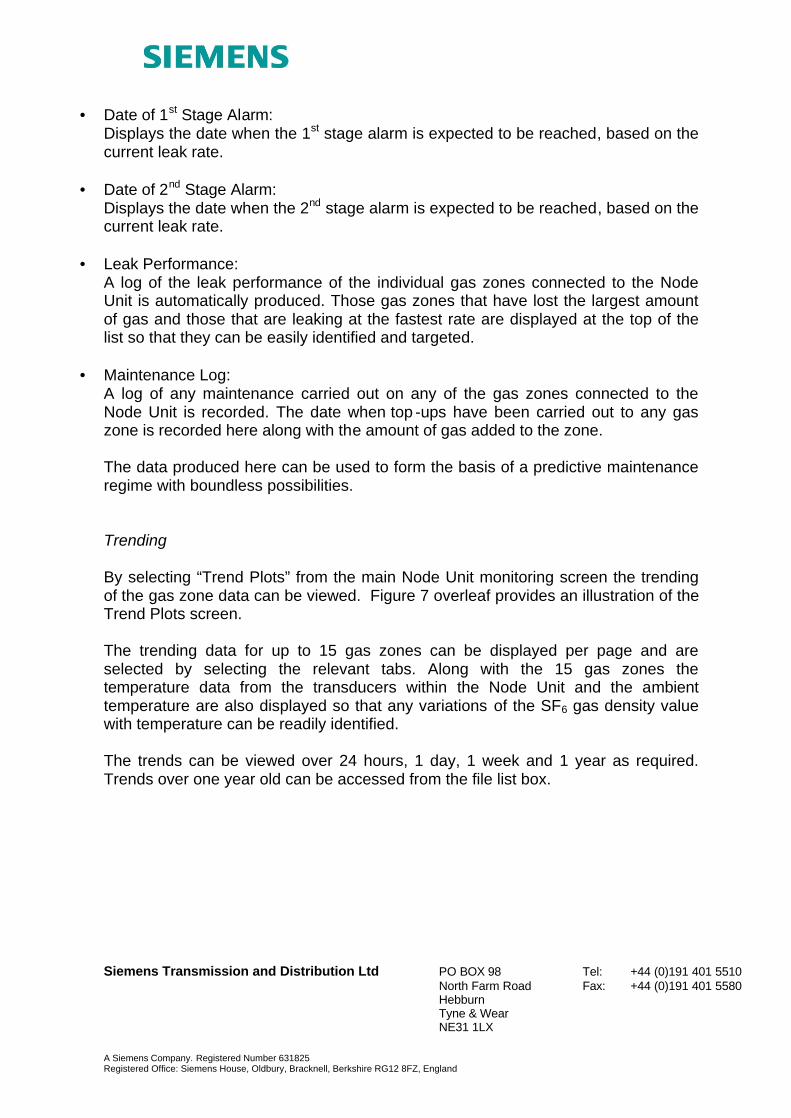
• Maintenance Log: A log of any maintenance carried out on any of the gas zones connected to the Node Unit is recorded. The date when top -ups have been carried out to any gas zone is recorded here along with the amount of gas added to the zone. The data produced here can be used to form the basis of a predictive maintenance regime with boundless possibilities. Trending By selecting “Trend Plots” from the main Node Unit monitoring screen the trending of the gas zone data can be viewed. Figure 7 overleaf provides an illustration of the Trend Plots screen. The trending data for up to 15 gas zones can be displayed per page and are selected by selecting the relevant tabs. Along with the 15 gas zones the temperature data from the transducers within the Node Unit and the ambient temperature are also displayed so that any variations of the SF6 gas density value with temperature can be readily identified. The trends can be viewed over 24 hours, 1 day, 1 week and 1 year as required. Trends over one year old can be accessed from the file list box.
Siemens Transmission and Distribution Ltd PO BOX 98 Tel: +44 (0)191 401 5510 North Farm Road Fax: +44 (0)191 401 5580 Hebburn Tyne & Wear
NE31 1LX A Siemens Company. Registered Number 631825 Registered Office: Siemens House, Oldbury, Bracknell, Berkshire RG12 8FZ, England
Figure 7 – Trend Plots Screen
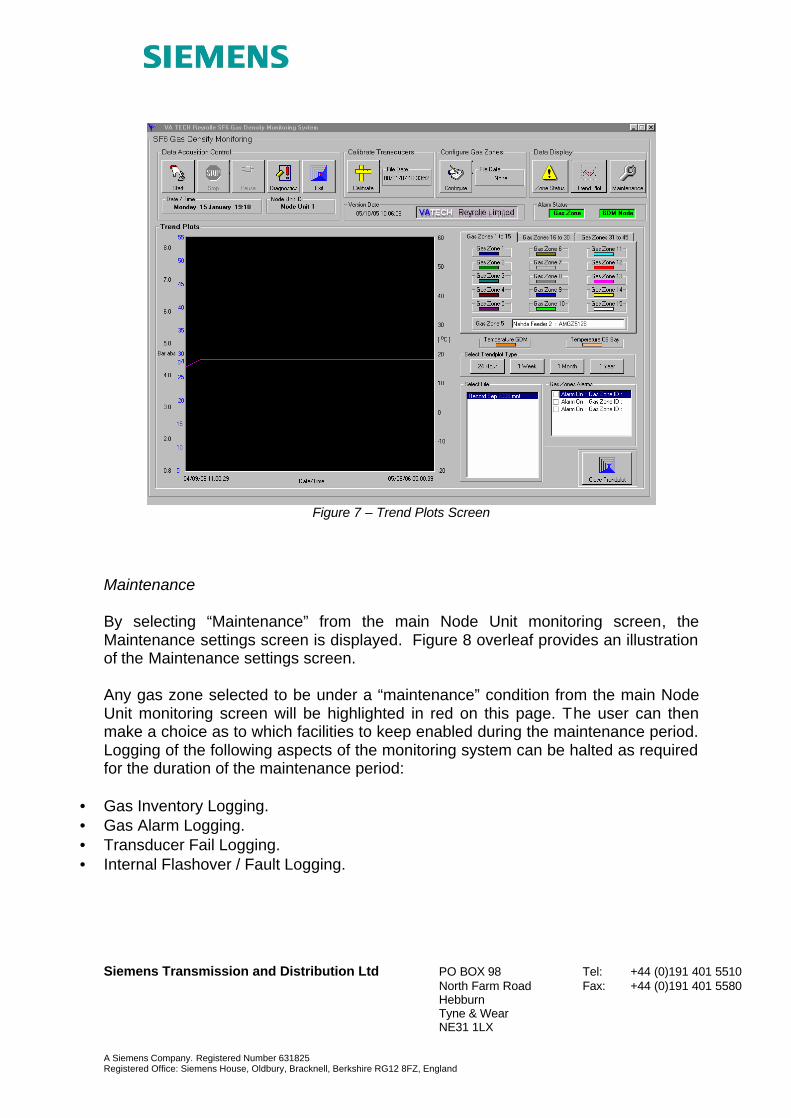
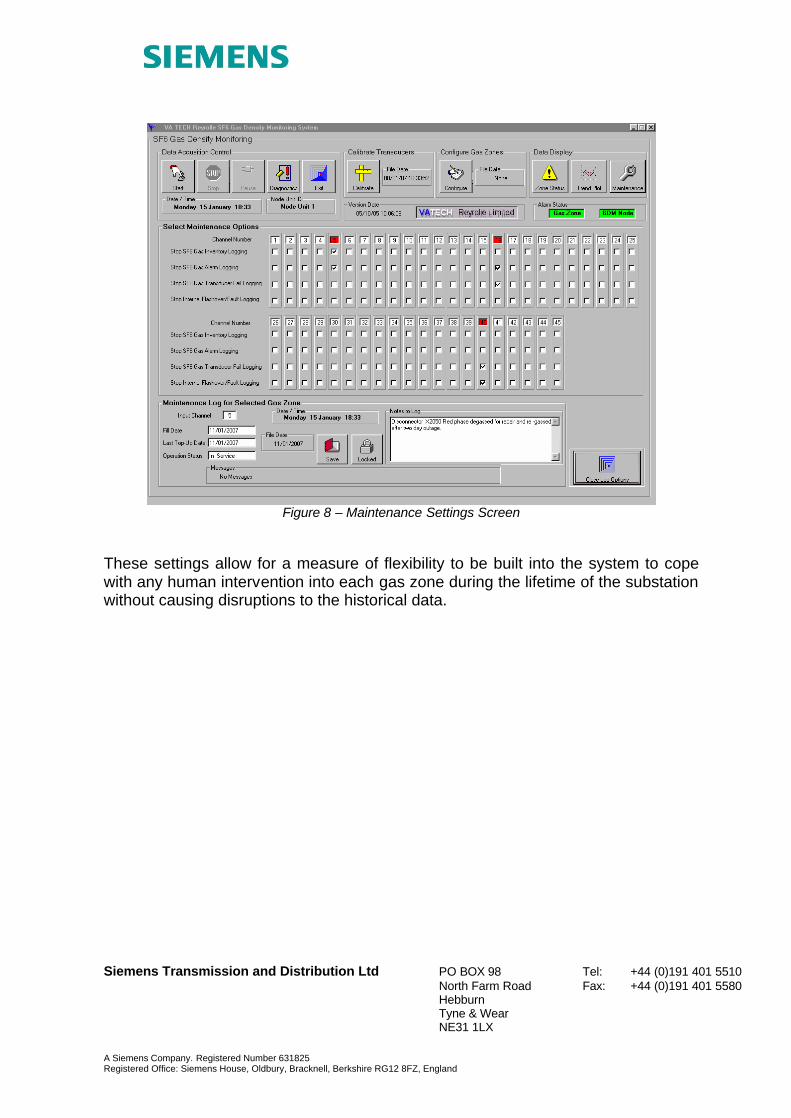
Maintenance By selecting “Maintenance” from the main Node Unit monitoring screen, the Maintenance settings screen is displayed. Figure 8 overleaf provides an illustration of the Maintenance settings screen. Any gas zone selected to be under a “maintenance” condition from the main Node Unit monitoring screen will be highlighted in red on this page. The user can then make a choice as to which facilities to keep enabled during the maintenance period. Logging of the following aspects of the monitoring system can be halted as required for the duration of the maintenance period:
• Gas Inventory Logging. • Gas Alarm Logging. • Transducer Fail Logging. • Internal Flashover / Fault Logging.
Siemens Transmission and Distribution Ltd PO BOX 98 Tel: +44 (0)191 401 5510 North Farm Road Fax: +44 (0)191 401 5580 Hebburn Tyne & Wear
NE31 1LX A Siemens Company. Registered Number 631825 Registered Office: Siemens House, Oldbury, Bracknell, Berkshire RG12 8FZ, England
Figure 8 – Maintenance Settings Screen
These settings allow for a measure of flexibility to be built into the system to cope with any human intervention into each gas zone during the lifetime of the substation without causing disruptions to the historical data.
Siemens Transmission and Distribution Ltd PO BOX 98 Tel: +44 (0)191 401 5510 North Farm Road Fax: +44 (0)191 401 5580 Hebburn Tyne & Wear
NE31 1LX A Siemens Company. Registered Number 631825 Registered Office: Siemens House, Oldbury, Bracknell, Berkshire RG12 8FZ, England
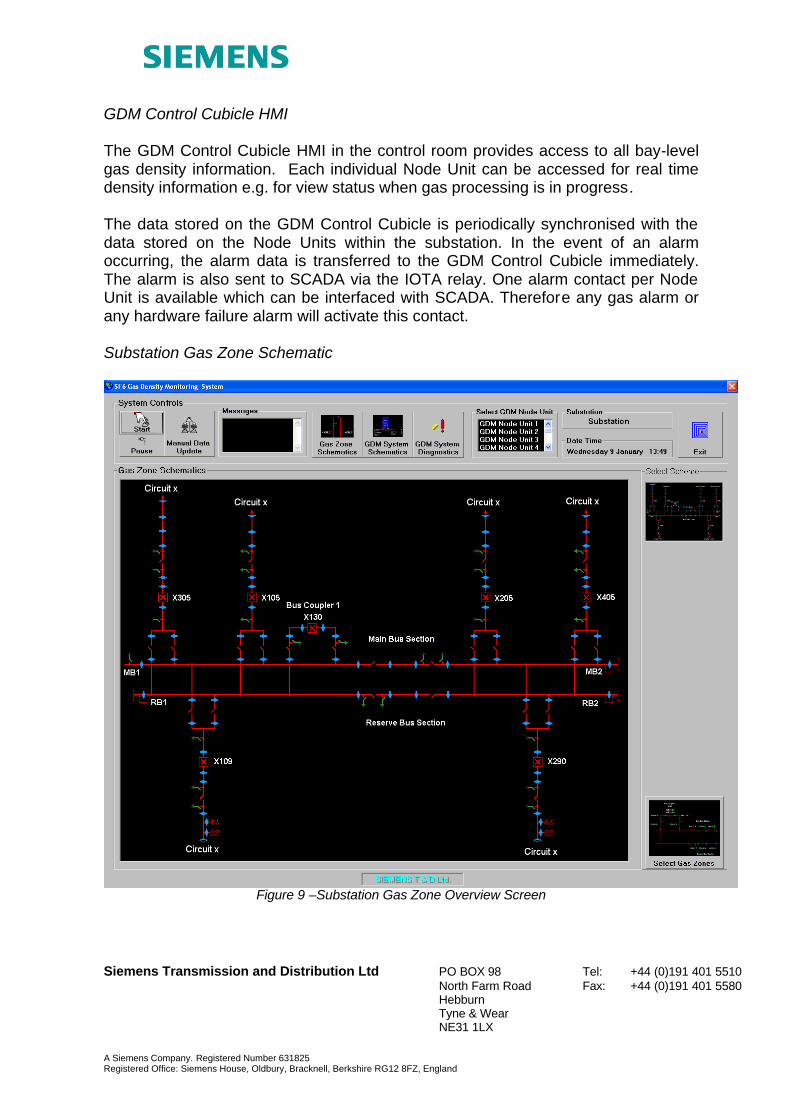
GDM Control Cubicle HMI The GDM Control Cubicle HMI in the control room provides access to all bay-level gas density information. Each individual Node Unit can be accessed for real time density information e.g. for view status when gas processing is in progress. The data stored on the GDM Control Cubicle is periodically synchronised with the data stored on the Node Units within the substation. In the event of an alarm occurring, the alarm data is transferred to the GDM Control Cubicle immediately. The alarm is also sent to SCADA via the IOTA relay. One alarm contact per Node Unit is available which can be interfaced with SCADA. Therefore any gas alarm or any hardware failure alarm will activate this contact. Substation Gas Zone Schematic
Figure 9 –Substation Gas Zone Overview Screen
Siemens Transmission and Distribution Ltd PO BOX 98 Tel: +44 (0)191 401 5510 North Farm Road Fax: +44 (0)191 401 5580 Hebburn Tyne & Wear
NE31 1LX A Siemens Company. Registered Number 631825 Registered Office: Siemens House, Oldbury, Bracknell, Berkshire RG12 8FZ, England
The user can then interrogate the GDM system to very simply identify the nature of the alarm and perform the necessary corrective action. Loss of power supplies at the cubicle will also result in alarms sent to SCADA via the IOTA relay. A range of screens are available to allow the user to be fully informed about the overall SF6 gas inventory in place at the substation and to take the appropriate action to raise maintenance rosters and to real time monitor processing during outages etc. An historical data base is also available to observe density trends where gas leaks are suspected and to keep maintenance records for outages and any ‘top-ups’. Gas Zone Identification and Status
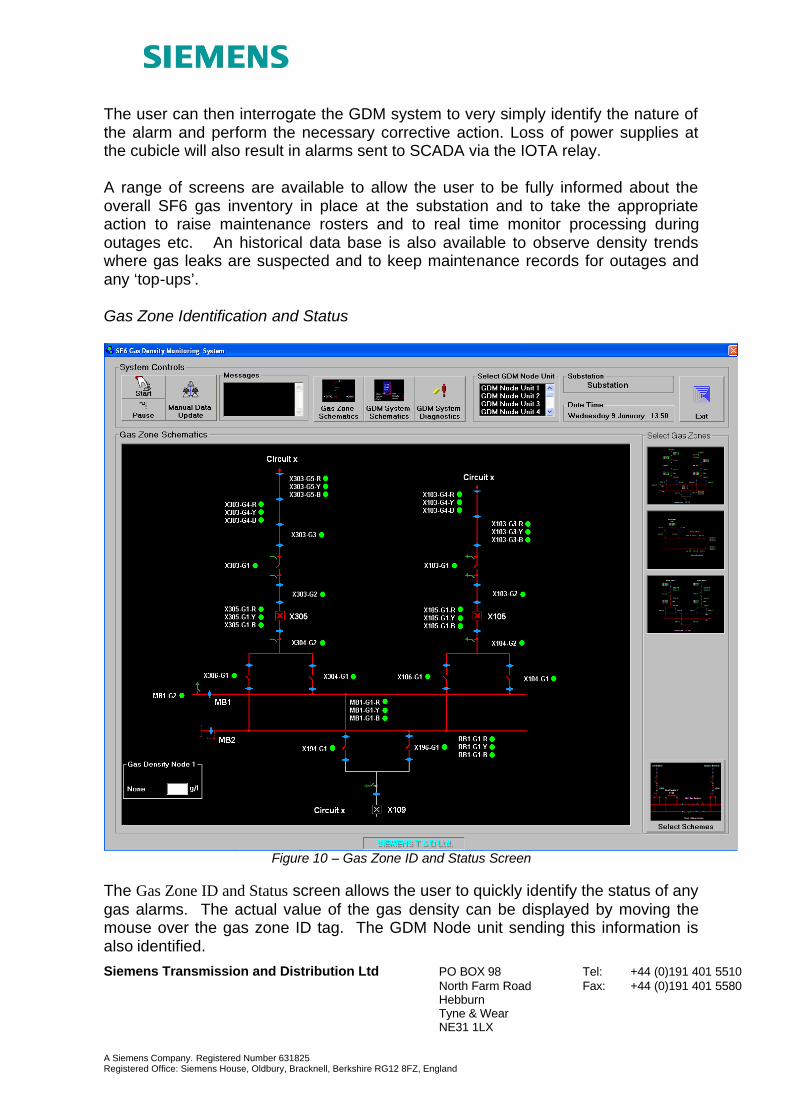
Figure 10 – Gas Zone ID and Status Screen
The Gas Zone ID and Status screen allows the user to quickly identify the status of any gas alarms. The actual value of the gas density can be displayed by moving the mouse over the gas zone ID tag. The GDM Node unit sending this information is also identified.
Siemens Transmission and Distribution Ltd PO BOX 98 Tel: +44 (0)191 401 5510 North Farm Road Fax: +44 (0)191 401 5580 Hebburn Tyne & Wear
NE31 1LX A Siemens Company. Registered Number 631825 Registered Office: Siemens House, Oldbury, Bracknell, Berkshire RG12 8FZ, England
GDM Substation Status
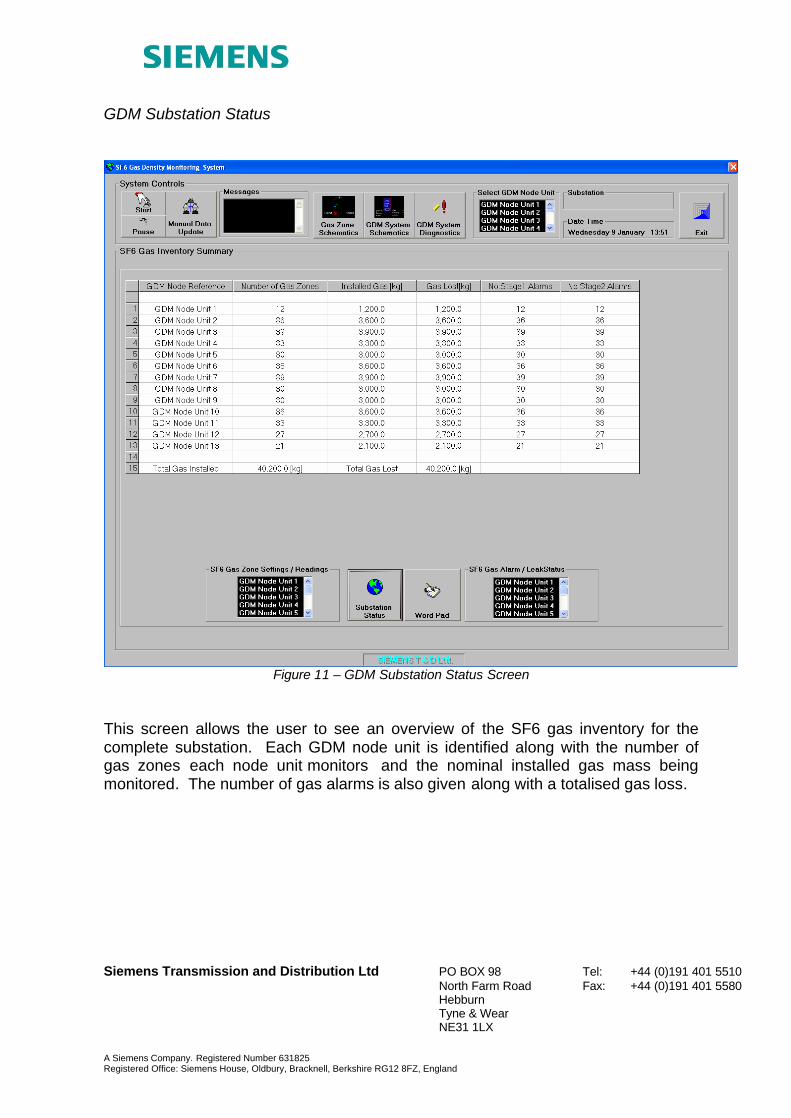
Figure 11 – GDM Substation Status Screen
This screen allows the user to see an overview of the SF6 gas inventory for the complete substation. Each GDM node unit is identified along with the number of gas zones each node unit monitors and the nominal installed gas mass being monitored. The number of gas alarms is also given along with a totalised gas loss.
Siemens Transmission and Distribution Ltd PO BOX 98 Tel: +44 (0)191 401 5510 North Farm Road Fax: +44 (0)191 401 5580 Hebburn Tyne & Wear
NE31 1LX A Siemens Company. Registered Number 631825 Registered Office: Siemens House, Oldbury, Bracknell, Berkshire RG12 8FZ, England
GDM Node Unit Gas Zone Settings and Current Readings
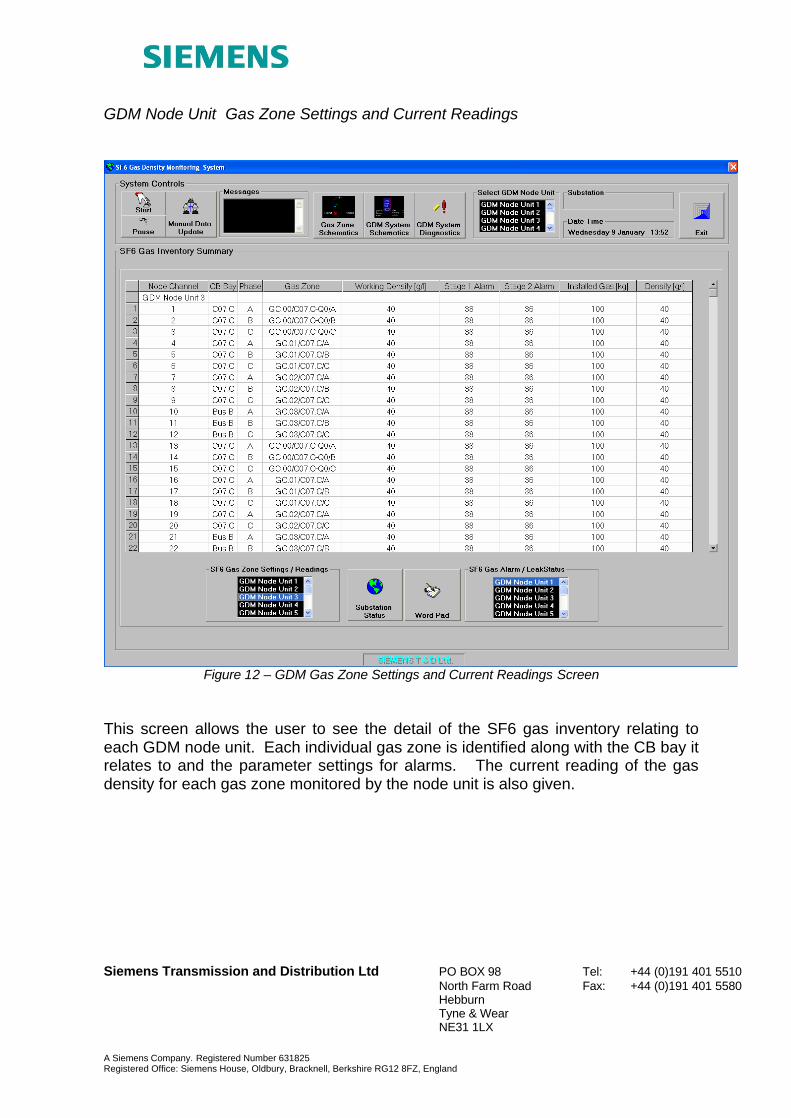
Figure 12 – GDM Gas Zone Settings and Current Readings Screen
This screen allows the user to see the detail of the SF6 gas inventory relating to each GDM node unit. Each individual gas zone is identified along with the CB bay it relates to and the parameter settings for alarms. The current reading of the gas density for each gas zone monitored by the node unit is also given.
Siemens Transmission and Distribution Ltd PO BOX 98 Tel: +44 (0)191 401 5510 North Farm Road Fax: +44 (0)191 401 5580 Hebburn Tyne & Wear
NE31 1LX A Siemens Company. Registered Number 631825 Registered Office: Siemens House, Oldbury, Bracknell, Berkshire RG12 8FZ, England
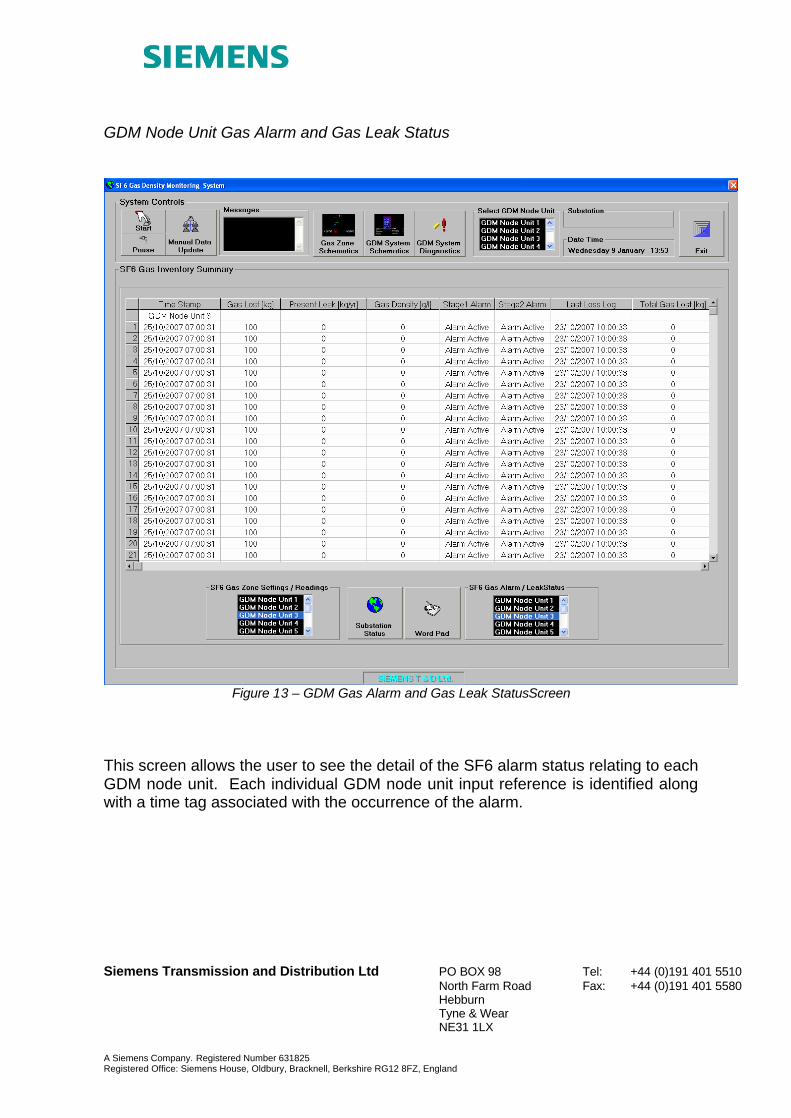
GDM Node Unit Gas Alarm and Gas Leak Status
Figure 13 – GDM Gas Alarm and Gas Leak StatusScreen
This screen allows the user to see the detail of the SF6 alarm status relating to each GDM node unit. Each individual GDM node unit input reference is identified along with a time tag associated with the occurrence of the alarm.
Siemens Transmission and Distribution Ltd PO BOX 98 Tel: +44 (0)191 401 5510 North Farm Road Fax: +44 (0)191 401 5580 Hebburn Tyne & Wear
NE31 1LX A Siemens Company. Registered Number 631825 Registered Office: Siemens House, Oldbury, Bracknell, Berkshire RG12 8FZ, England
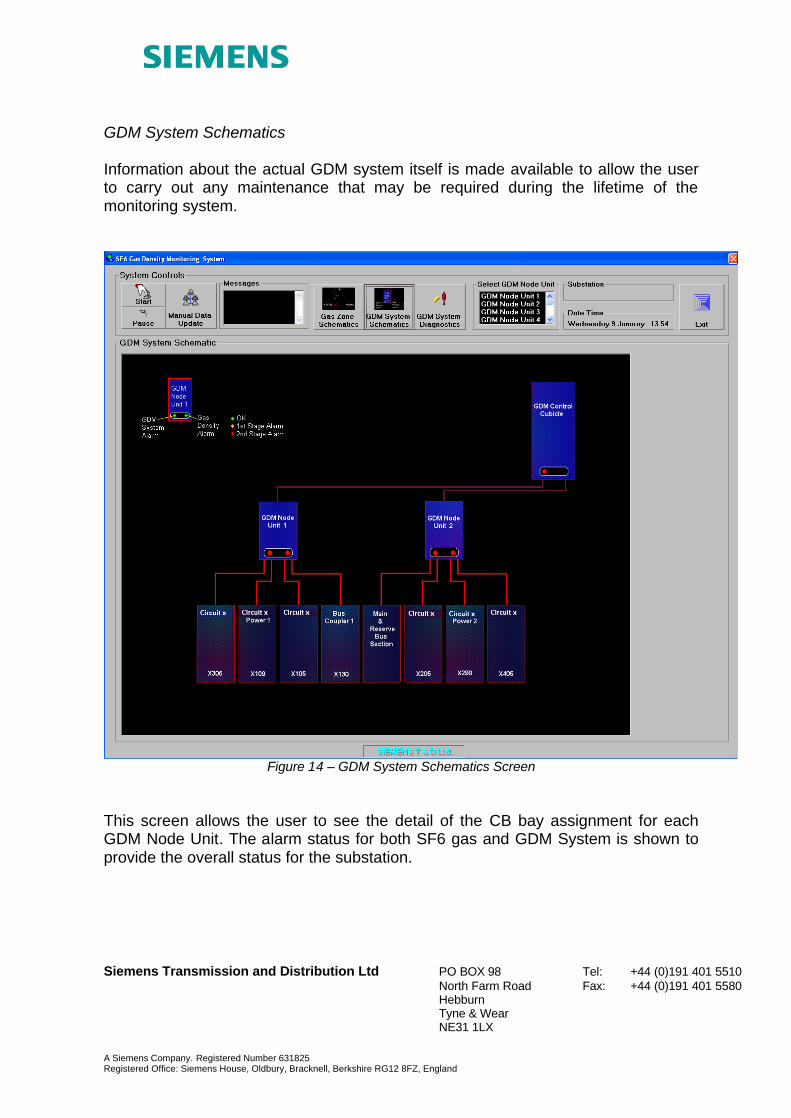
GDM System Schematics Information about the actual GDM system itself is made available to allow the user to carry out any maintenance that may be required during the lifetime of the monitoring system.
Figure 14 – GDM System Schematics Screen
This screen allows the user to see the detail of the CB bay assignment for each GDM Node Unit. The alarm status for both SF6 gas and GDM System is shown to provide the overall status for the substation.
Siemens Transmission and Distribution Ltd PO BOX 98 Tel: +44 (0)191 401 5510 North Farm Road Fax: +44 (0)191 401 5580 Hebburn Tyne & Wear
NE31 1LX A Siemens Company. Registered Number 631825 Registered Office: Siemens House, Oldbury, Bracknell, Berkshire RG12 8FZ, England
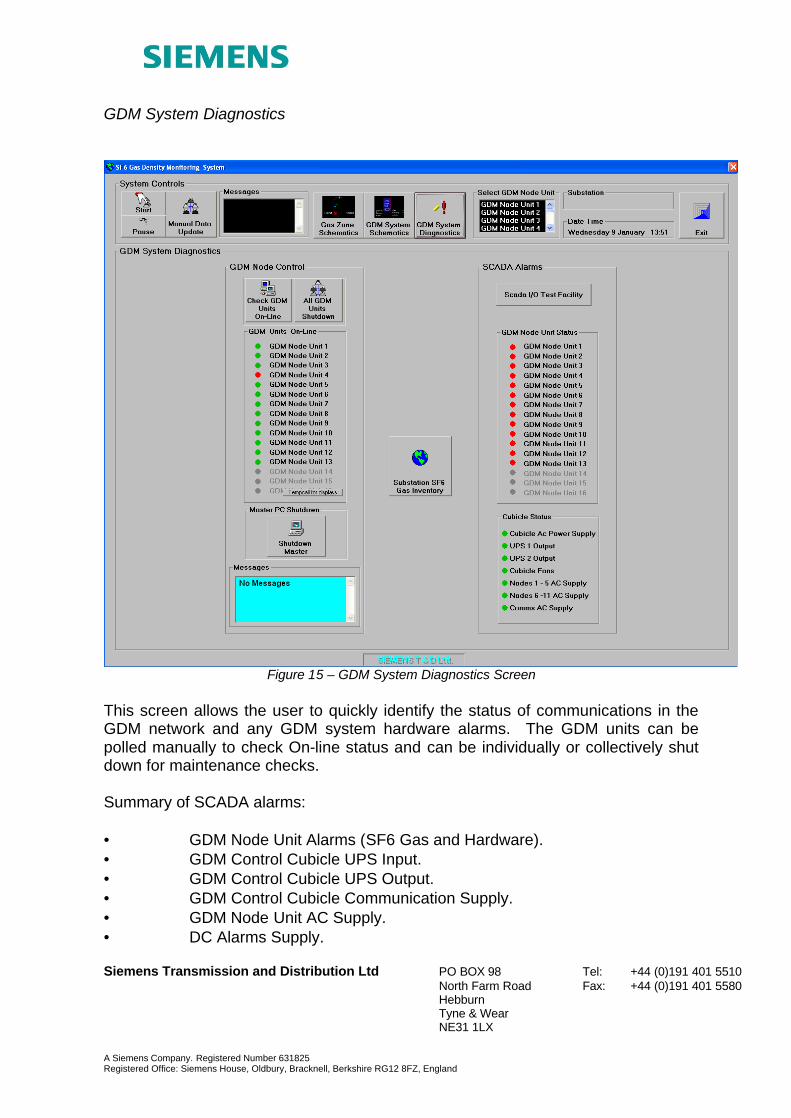
GDM System Diagnostics
Figure 15 – GDM System Diagnostics Screen
This screen allows the user to quickly identify the status of communications in the GDM network and any GDM system hardware alarms. The GDM units can be polled manually to check On-line status and can be individually or collectively shut down for maintenance checks. Summary of SCADA alarms: • GDM Node Unit Alarms (SF6 Gas and Hardware). • GDM Control Cubicle UPS Input. • GDM Control Cubicle UPS Output. • GDM Control Cubicle Communication Supply. • GDM Node Unit AC Supply. • DC Alarms Supply.
Siemens Transmission and Distribution Ltd PO BOX 98 Tel: +44 (0)191 401 5510 North Farm Road Fax: +44 (0)191 401 5580 Hebburn Tyne & Wear
NE31 1LX A Siemens Company. Registered Number 631825 Registered Office: Siemens House, Oldbury, Bracknell, Berkshire RG12 8FZ, England
Remote Access Remote access to the GDM Control Cubicle is very much dependent on the infrastructure available at the substation. The most common form of access is via a modem but it is possible to also use a Local or Wide Area Network to gain access to the data. The remote access options are explored with each individual customer to define the best possible solution to implement in each case.