substance abuse trends in maine: april 2013 (pdf) - maine.gov
TRANSCRIPT

Substance Abuse Trends in Maine State Epidemiological Profile 2013
Produced for Maine Department of Health and Human Services Office of Substance Abuse and Mental Health Services
by Hornby Zeller Associates, Inc. April 2013


Substance Abuse Trends in Maine State Epidemiological Profile 2013
THIS REPORT IS PRODUCED FOR THE MAINE OFFICE OF SUBSTANCE ABUSE AND MENTAL HEALTH SERVICES
COMMUNITY EPIDEMIOLOGY SURVEILLANCE NETWORK (CESN)
Produced by Hornby Zeller Associates, Inc. 373 Broadway South Portland, ME 04106 (207) 773-9529 www.hornbyzeller.com


Hornby Zeller Associates, Inc. i
Table of Contents
Table of Contents ................................................................................................................... i
List of Figures ....................................................................................................................... iii
Executive Summary ............................................................................................................... 1
Consumption of Substances .................................................................................................... 1
Consequences Resulting from Substance Use and Abuse ...................................................... 2
Factors Contributing to Substance Use and Abuse ................................................................. 3
Mental Health, Suicide and Co-occurring Disorders .............................................................. 4
Treatment Admissions for Substance Abuse ......................................................................... 4
Introduction .......................................................................................................................... 7
Overview of Maine .................................................................................................................. 7
Purpose of this Report ............................................................................................................. 7
Organization of the Report ...................................................................................................... 8
Data Sources, Indicators and Selection Criteria ...................................................................... 9
Description of Data Sources ................................................................................................. 10
Consumption of Substances ................................................................................................. 15
Alcohol ....................................................................................................................................... 16
Tobacco ..................................................................................................................................... 24
Prescription Drugs ..................................................................................................................... 27
Other Illegal Drugs ..................................................................................................................... 30
Consequences Resulting from Substance Use and Abuse ...................................................... 35
Substance Use and Pregnancy .................................................................................................. 36
Criminal Justice Involvement .................................................................................................... 39
Motor Vehicle Crashes Involving Alcohol ................................................................................. 45
Hospital Visits Related to Substance Abuse .............................................................................. 50
Poisonings Related to Substance Use ....................................................................................... 52
Overdoses and Related Deaths ................................................................................................. 55
Morbidity and Mortality ............................................................................................................ 60
Factors Contributing to Substance Use and Abuse ................................................................ 65
Availability and Accessibility ..................................................................................................... 66
Perceived Harm ......................................................................................................................... 74

Hornby Zeller Associates, Inc. ii
Perceived Enforcement ............................................................................................................. 79
Community and Cultural Norms ............................................................................................... 81
Mental Health, Suicide and Co-occurring Disorders .............................................................. 85
Mental Illness, Depression and Anxiety .................................................................................... 86
Suicide and Suicidal Ideation ..................................................................................................... 90
Mental Health and Substance Abuse Co-Occurrence ............................................................... 91
Treatment Admissions for Substance Abuse ........................................................................ 94
Alcohol ....................................................................................................................................... 95
Synthetic Opioids ...................................................................................................................... 97
Marijuana .................................................................................................................................. 99
Heroin/Morphine .................................................................................................................... 101
Cocaine/Crack ......................................................................................................................... 103
Methadone .............................................................................................................................. 105
Benzodiazepines ...................................................................................................................... 107
Conclusion ......................................................................................................................... 111
Hornby Zeller Associates, Inc. iii
List of Figures
Figure 1. Percent of high school students reporting alcohol use in the past month: 2009 and 2011 ................................................................................................................. 16
Figure 2. Percent of high school students reporting alcohol use in past 30 days: 2001 through 2011 ................................................................................................................... 17
Figure 3. Percent of high school students who had five or more drinks in a row at least once in the past month: 2009 and 2011 ......................................................................... 18
Figure 4. Percent of adults reporting drinking in past 30 days by age group: 2011..................... 19 Figure 5. Percent of Maine residents (age 18 and older) reporting any alcohol use in
past month, by age group: .............................................................................................. 20 Figure 6. Percent of adults at risk from heavy alcohol use in past 30 days, by age
group: 2011 ..................................................................................................................... 21 Figure 7. Percent of adults ages reporting binge drinking in past 30 days, by age group:
2011 ................................................................................................................................. 22 Figure 8. Percent of Maine residents (age 18 and older) reporting binge alcohol use in
past month, by age group: 2002-03 through 2009-10 .................................................... 23 Figure 9. Percent of high school students who smoked cigarettes during past month:
2001-2011 ........................................................................................................................ 24 Figure 10. Percent of high school students who used tobacco during past month, by
tobacco type: 2001-2011 ................................................................................................ 25 Figure 11. Current (past 30 days) and former smokers who reported smoking at least
100 cigarettes in their lifetime, by age group: 2011 ....................................................... 26 Figure 12. Percent of high school students who have taken prescription drugs that
were not prescribed to them in their lifetime and in the past month: 2009 and 2011 ................................................................................................................................. 27
Figure 13. Non-medical use of pain relievers among Maine residents in the past year, by age group: 2003-04 through 2009-10 ........................................................................ 28
Figure 14. Misuse of prescription drugs among Maine residents in their lifetime, by age group: 2011 ..................................................................................................................... 29
Figure 15. Percent of high school students who have used marijuana at least once in the past month: 2009 and 2011 ...................................................................................... 30
Figure 16. Percent of Maine residents (age 18 and older) reporting marijuana use in past month, by age group: 2002-03 through 2009-10 .................................................... 31
Figure 17. Percent of Maine residents (age 18 and older) reporting cocaine use in past year, by age group: .......................................................................................................... 32
Figure 18. Percent of high school students reporting inhalant use (ever): 2001-2011 ................ 33 Figure 19. Percent of homeless youth reporting lifetime and current heroin use: 2012 ............ 34 Figure 20. Percent of women reporting alcohol and/or cigarette use during last
trimester of pregnancy: 2001-2011 ................................................................................ 36 Figure 21. Percent of women who reported drinking alcohol during last trimester of
pregnancy, by age group: 2004-2011 .............................................................................. 37 Figure 22. Percent of pregnant treatment admissions, by primary substance: 2007-
2012 ................................................................................................................................. 38
Hornby Zeller Associates, Inc. iv
Figure 23. Adult arrests (18+ years old) related to alcohol, by arrest type: 2005-2011 .............. 39 Figure 24. Juvenile arrests (<18 years old) related to alcohol, by arrest type: 2000-2011 .......... 40 Figure 25. Arrests related to alcohol, by age group: 2011 ........................................................... 41 Figure 26. Adult and juvenile drug offenses, by type: 2011 ......................................................... 42 Figure 27. Adult and juvenile drug arrests: 2005-2011 ................................................................ 43 Figure 28. Drug offense arrests in Maine, by drug type: 2007-2011 ............................................ 44 Figure 29. Number of motor vehicle crashes, by whether they involved alcohol: 2007-
2012 ................................................................................................................................. 45 Figure 30. Number of fatal motor vehicle crashes, by whether they involved alcohol:
2005-2012 ........................................................................................................................ 46 Figure 31. Alcohol-related motor vehicle crash rate per 100,000 licensees, by age
group: 2008-2012 ............................................................................................................ 47 Figure 32. Alcohol-related motor vehicle crash fatality rate per 100,000 licensees, by
age: 2008-2012 ................................................................................................................ 48 Figure 33. Inpatient hospital admissions related to substance use: 2006-2009 .......................... 50 Figure 34. Outpatient hospital visits related to substance use: 2006-2009 ................................. 51 Figure 35. Poisonings reported to Northern New England Poison Center, by intent:
2009-2012 ........................................................................................................................ 52 Figure 36. Inpatient hospital admissions related to poisoning from alcohol and drugs:
2006-2009 ........................................................................................................................ 53 Figure 37. Outpatient hospital visits for substance-related poisonings: 2006-2009 ................... 54 Figure 38. Number of overdoses, by type: 2011 and 2012 .......................................................... 55 Figure 39. Proportion of overdose responses, by age and type: 2011 ......................................... 56 Figure 40. Number of deaths caused by pharmaceuticals and/or illicit drugs*: 2000-
2012 ................................................................................................................................. 57 Figure 41. Percent of drug deaths involving specific drug types*: 2000-2012 ............................ 58 Figure 42. Substance abuse and overdose deaths, per 100,000, by age group: 2005-
2009 ................................................................................................................................. 59 Figure 43. Deaths from chronic diseases related to substance use, per 100,000 of the
population: 2005-2010 .................................................................................................... 60 Figure 44. Deaths from alcoholic cirrhosis and liver disease per 100,000 of the
population, by gender: 2005-2010 .................................................................................. 61 Figure 45. Deaths from suicide or homicide per 100,000 of the population: 2005-2010 ............ 62 Figure 46. Deaths from suicide or homicide per 100,000 of the population, by age
groups: 2010 .................................................................................................................... 63 Figure 47. Deaths from suicide or homicide per 100,000 of the population, by gender:
2010 ................................................................................................................................. 64 Figure 48. Percent of high school students who reported it would be easy to get
alcohol: 2009 and 2011 ................................................................................................... 66 Figure 49. Percent of high school students who obtained alcohol by someone giving it
to them, among those who drank in past month: 2009 and 2011 ................................. 67 Figure 50. Percent of high school students who reported it would be easy to get
marijuana: 2009 and 2011 .............................................................................................. 68

Hornby Zeller Associates, Inc. v
Figure 51. Percent of high school students who were sold, offered, or given an illegal drug on school property in past year: 2009 and 2011 .................................................... 69
Figure 52. Number of prescriptions filled in Maine (thousands), by type: 2006-2012 ................ 70 Figure 53. Number of pills per capita in Maine, by type: 2008-2012 ....................................... 71 Figure 54. Substances most frequently requested for medication verification by non-
law enforcement, by type: 2006-2012 ............................................................................ 72 Figure 55. Gallons of ethanol sold per capita, by type: 1998-2010 .............................................. 73 Figure 56. Percent of high school students perceiving moderate to great risk from
drinking 1-2 drinks every day: 2009 and 2011 ................................................................ 74 Figure 57. Percent of high school students perceiving moderate to great risk from
drinking five or more drinks once or twice per week: 2009 and 2011 ........................... 75 Figure 58. Maine residents (age 18 and older) perceiving great risk from drinking five
or more drinks once or twice per week, by age group: 2004-05 through 2009-10 ..................................................................................................................................... 76
Figure 59. Percent of high school students perceiving moderate to great risk from smoking marijuana regularly: 2009 and 2011 ................................................................. 77
Figure 60. Maine residents (age 18 and older) perceiving great risk from smoking marijuana once per month: 2004-05 through 2009-10 .................................................. 78
Figure 61. Percent of high school students reporting they would not be caught by parents or the police if they drank: 2009 and 2011 ........................................................ 79
Figure 62. Percent of high school students reporting they would not get caught by the police if they smoked marijuana: 2009 and 2011 ........................................................... 80
Figure 63. Percent of high school students who reported they would be seen as "cool" for drinking alcohol or smoking marijuana: 2009 and 2011 ........................................... 81
Figure 64. Percent of high school students who reported perceiving that parents and adults in their community think student alcohol use is wrong: 2009 and 2011 ............ 82
Figure 65. Percent of high school students who reported that parents and adults in community think smoking marijuana is wrong: 2009 and 2011 ..................................... 83
Figure 66. Percent of high school students who reported their family has clear rules about alcohol and drug use: 2009 and 2011 ................................................................... 84
Figure 67. Percent of Maine residents (age 18 and older) experiencing any mental illness in past year, by age group: 2008-09 and 2009-10 ................................................ 86
Figure 68. Percent of Maine residents (age 18 and older) years old experiencing at least one major depressive episode in past year, by age group: 2004-05 through 2009-10 .............................................................................................................. 87
Figure 69. Percent of adults who have been told they have a depression or anxiety disorder by age group: 2011 ........................................................................................... 88
Figure 70. Percent of high school students who reported feeling sad or hopeless in past year: 2009 and 2011 ................................................................................................ 89
Figure 71. Percent of high school students who considered, planned, or attempted suicide in past year: 2009 and 2011 ................................................................................ 90
Figure 72. Percent of students reporting suicidal behavior in the past year, by alcohol use in the past month: .................................................................................................... 91

Hornby Zeller Associates, Inc. vi
Figure 73. Percent of total treatment admissions with reported mental health disorders: 2007-2012 ...................................................................................................... 92
Figure 74. Percent of total treatment admissions where individuals received previous mental health services, by type: 2007-2012 ................................................................... 93
Figure 75. Primary treatment admissions by substance: 2012 .................................................... 94 Figure 76. Number of treatment admissions where alcohol was the primary,
secondary, or tertiary substance: 2007-2012 ................................................................. 95 Figure 77. Percent of treatment admissions where alcohol was the primary, secondary,
or tertiary substance: 2007-2012 .................................................................................... 96 Figure 78. Number of treatment admissions where synthetic opioids was the primary,
secondary, or tertiary substance: 2007-2012 ................................................................. 97 Figure 79. Percent of total treatment admissions where synthetic opioids was the
primary, secondary, or tertiary substance: 2007-2012 ................................................... 98 Figure 80. Number of treatment admissions where marijuana was the primary,
secondary, or tertiary substance: 2007-2012 ................................................................. 99 Figure 81. Percent of total treatment admissions where marijuana was the primary,
secondary, or tertiary substance: 2007-2012 ............................................................... 100 Figure 82. Number of treatment admissions where heroin/morphine was the primary,
secondary, or tertiary substance: 2007-2012 ............................................................... 101 Figure 83. Percent of total treatment admissions where heroin/morphine was the
primary, secondary, or tertiary substance: 2007-2012 ................................................. 102 Figure 84. Number of treatment admissions where cocaine/crack was the primary,
secondary, or tertiary substance: 2007-2012 ............................................................... 103 Figure 85. Percent of total treatment admissions where cocaine/crack was the
primary, secondary, or tertiary substance: 2007-2012 ................................................. 104 Figure 86. Number of treatment admissions where methadone was the primary,
secondary, or tertiary substance: 2007-2012 ............................................................... 105 Figure 87. Percent of total treatment admissions where methadone was the primary,
secondary, or tertiary substance: 2007-2012 ............................................................... 106 Figure 88. Number of treatment admissions where benzodiazepines were the primary,
secondary, or tertiary substance: 2007-2012 ............................................................... 107 Figure 89. Percent of total treatment admissions where benzodiazepines was the
primary, secondary, or tertiary substance: 2007-2012 ................................................. 108 Figure 90. Percent of total treatment admissions where bath salts were the primary,
secondary, or tertiary substance: 2007-2012 ............................................................... 109
Hornby Zeller Associates, Inc. 1
Executive Summary
This report takes into account the primary objectives of the Office of Substance Abuse and Mental Health Services (SAMHS): to identify substance abuse patterns in defined geographical areas, establish substance abuse trends, detect emerging substances, and provide information for policy development and program planning. It also highlights all the prevention priorities identified in the SAMHS strategic plan: underage drinking, high-risk drinking among 18-25 year olds, misuse of prescription drugs among 18-25 year olds, and marijuana use in 12-25 year olds; as well as monitors the progress being made to address these priorities. This report includes data available through December 2012 and when possible updates the March 2012 report which included data through December 2011. Key findings of this report include: Consumption of Substances
• Just over one-quarter of high school students in Maine reported consuming alcohol in the past month. This has been decreasing since 2001 and there was a significant drop between 2005 and 2011.
• Although the rate of reported high-risk “binge” alcohol use among high school students has been decreasing, in 2011 close to one in five students still reported engaging in high-risk use during the past month.
• Among high school students who had consumed alcohol in 2011, just under one-third reported starting before the age of 13. This appears to be decreasing since 2001.
• Alcohol is the most frequently used substance among adults in Maine, with more than half of adults indicating they had consumed it within the past month. In 2011, 18-25 year olds appeared to be at greatest risk from heavy alcohol use, with more than one in ten reporting that they consumed at least one alcoholic drink per day in the past 30 days.
• Almost three out of ten adults ages 18 to 35 reported binge drinking in the past 30 days in 2011. Young adults have the highest rates of binge drinking but the gap appears to be closing.
• The use of any cigarettes by high school students has fluctuated between 15 and 20 percent since 2005. The rate of smoking regularly among high school students appears to be declining.
• In 2011, nearly one in five Mainers 18 and older reported smoking cigarettes daily. The highest rate of daily smoking was observed among adults between the ages of 26 and 35.
• In 2011, one in seven high school students in Maine reported misusing a prescription drug at least once in their lifetime; less than one in ten reported doing so within the past month. Both appear to have decreased since 2009.
• Non-medical use of prescription pain relievers is higher among adults ages 18 to 25 compared to adults 26 and older and has remained relatively stable since 2003-04.
Hornby Zeller Associates, Inc. 2
• In 2011, lifetime prescription drug misuse rates was highest among adults between the ages of 26 and 35; nearly one in ten adults reported to have misused prescription drugs within their lifetime.
• Marijuana is the most often used illegal drug in Maine. One in five high school students reported using it within the past month; similar rates are seen within the young adult population.
• Among high school students, the reported rates of cocaine use decreased from 2009 to 2011. Among adults, those between the ages of 18 to 25 reported the highest rates of cocaine use within the past year.
• The current rate of inhalant use among high school students was about half the lifetime rate. It appears that lifetime rates for inhalant use in high school decreased in 2011 while past 30 day use has remained stable.
• Almost one in ten homeless youth in Maine have used heroin during their lifetime, a rate that was almost twice as much as Maine high school students.
Consequences Resulting from Substance Use and Abuse
• In 2011, almost one in five women reported smoking in the last trimester, and eight percent reported drinking alcohol. More than one in 10 pregnant women 25 or older reported to have consumed alcohol in their last trimester.
• Since 2007, about five percent of all women who have been admitted to substance abuse treatment were pregnant; of those, admissions primarily due to synthetic opioids have increased steadily since 2009.
• In 2011, more adult arrest related to alcohol came from OUIs than from violations of liquor laws, whereas alcohol-related arrests among juveniles show the opposite pattern (that there are more arrests for liquor law violations than OUIs).
• Most drug-related offenses in 2011 were for possession rather than sale and manufacturing. Since 2005, it appears that adult arrests related to drugs have remained stable, while juvenile arrests have generally declined.
• Since 2009, the majority of drug seizures in Maine involved pharmaceutical narcotics. The proportion of pharm-narcotics has been steadily increasing since 2007.
• Both the number of non-alcohol and alcohol related motor vehicle crashes appeared to have increased slightly from 2011 to 2012. In 2012, more than one in three of fatal motor vehicle crashes involved alcohol.
• In 2012, drivers between the ages of 21 and 24 had the highest alcohol-related crash rates, followed closely by drivers between the ages of 25 and 34. In 2012, the rates of alcohol related motor vehicle crash fatalities were highest among 16 to 20 year olds, followed by 21 to 24 year olds.
• In 2009, inpatient admissions related to substance use decreased for alcohol and opiates after rising sharply in 2008. Outpatient visits related to substance abuse also increased in 2009, driven largely by opiates which were indicated as the substance of concern nearly twice as often as alcohol.

Hornby Zeller Associates, Inc. 3
• Outpatient hospital visits for substance-related poisonings have also increased. Among inpatient hospital admissions for substance poisoning, psychotropic medications are indicated most often as the substance of concern followed by opiates.
• About four percent of all poisoning calls received by the Poison Center in 2012 were substance abuse cases.
• In 2012, Emergency Medical Services helped 5,206 individuals experiencing an overdose; this appears to be increasing. Alcohol and drugs or medications account for most overdoses to which EMS responds. Alcohol-related overdoses are more prevalent among older populations, while drug/medication overdoses are more common among younger populations.
• There were an estimated 154 overdose deaths in Maine in 2012, continuing a slight decrease from previous years. The proportion of overdose deaths associated with pharmaceuticals may be leveling off after steadily rising over the past decade.
• In 2012, most drug overdose deaths involved oxycodone (29%), benzodiazepines (24%) and methadone (20%). While overdose deaths involving methadone have been decreasing, those related to heroin may be on the rise.
• Ischemic cerebrovascular diseases were more prevalent among Mainers in 2010 than cardiovascular diseases and alcoholic cirrhosis. Cirrhosis and liver disease related to alcohol were more likely among men than women.
• Adults between the ages of 35 to 54 had the highest rate of death due to substance abuse or overdose during 2009, followed by those between the ages of 21 and 29.
• The overall rates of violence deaths involving suicide or homicide have remained fairly stable from 2005 to 2010. Suicides appear to be much more prevalent than homicides. Suicides are more likely among men and people between the ages of 40 and 59.
Factors Contributing to Substance Use and Abuse
• Overall, about two out of three high school students think it would be easy to obtain alcohol and social access appears to be a primary way that underage youth obtain alcohol, about the same as 2009.
• Over half of high school students believed that marijuana was easy to obtain, although this has decreased slightly since 2009.
• The percentage of high school students who report they were sold, offered or given an illegal drug on school property appears to have increased recently. In 2011, students who reported they were offered drugs at school were 2.5 times as likely to use marijuana as their peers who were not offered drugs at school.
• Overall, the number of prescriptions filled involving narcotics, tranquilizers, and stimulants has decreased from 2011 to 2012. Narcotics accounted for most prescriptions filled as well as pills per capita in Maine for the past several years.
• Most calls to NNEPC requesting substance verification involved opioids, followed by benzodiazepines. The overall number of requests has decreased since 2010.

Hornby Zeller Associates, Inc. 4
• Although most high school students think there is moderate to great risk of harm from drinking alcohol regularly, two out of five students in 2011 did not think regular use was risky.
• While four out of five high school students thought that binge drinking a few times a week posed a moderate to great risk of harm (an increase since 2009), only one in five young adults (18-25) thought that binge drinking a few times a week was risky.
• Although most high school students think there is moderate to great risk of harm from smoking marijuana regularly, more than two out of five students in 2011 did not think regular use was risky. Among adults, those between 18 and 25 years of age were the least likely to view a great risk in smoking marijuana once per a month.
• High school students continue to think they are more likely to be caught by their parents for drinking alcohol than by the police and few think they will be caught by police for smoking marijuana.
• Although less than half of all high school students think that alcohol use and marijuana use would be seen as “cool” by their peers, about two in five continue to think that using substances would be seen as cool. This has decreased slightly since 2009.
• High school students generally believe that their parents and adults in their community think it would be wrong for them to drink alcohol or smoke marijuana, although perceptions of disapproval for using marijuana may be decreasing. Most students in Maine report that their family has clear rules around alcohol and drug use.
Mental Health, Suicide and Co-occurring Disorders
• Young adults (18 to 25) are more likely to report experiencing any mental illness in the past year than older adults (one in three); they are also more likely than other age groups to experience a major depressive episode in the past year.
• One-fourth of adults in Maine reported having ever been diagnosed with depression compared to one-fifth reporting to have been diagnosed with anxiety. Almost a quarter of high school students have reported feeling sad or helpless during the past year.
• In 2011, about one in ten high school students considered or planned a suicide. The proportion reporting an actual suicide attempt in the past year is slightly lower. This has changed little since 2009.
• High school students who consumed alcohol in the past month were more than two times as likely to have attempted or planned suicide compared to those students who had not consumed alcohol.
• In 2012, just over half of all substance abuse treatment admissions also involved a mental health disorder. Nearly one-third had received outpatient mental health services in the past year.
Treatment Admissions for Substance Abuse
• The overall number of Mainers seeking treatment has been declining since 2007, from 14,843 to 11,688 in 2012. Mainers continued to seek out treatment for abuse involving

Hornby Zeller Associates, Inc. 5
a wide array of substances besides alcohol; in 2012 there were 4,135 admissions for alcohol as the primary substance. This was followed by synthetic opioids (3,838) and marijuana (1,024).
• Alcohol continues to be the most frequent substance for which Mainers seek treatment, although the number of treatment admissions for alcohol has decreased since 2007. The proportion in which alcohol accounts for primary admissions has been gradually decreasing since 2007.
• One in three of all primary admissions are due to synthetic opiates. The number of primary treatment admissions involving synthetic opiates has remained relatively steady since 2008.
• Marijuana tends to be listed as a secondary or tertiary substance for which treatment is sought. Overall, treatment admissions for marijuana have been decreasing.
• Total treatment admissions for heroin or morphine have been unsettled since 2007. Primary admissions related to heroin or morphine have been increasing since 2010.
• After gradually decreasing from 2007 to 2010, the numbers as well as proportions of primary, secondary, and tertiary admissions in which treatment for crack or cocaine was sought have remained stable.
• Although the number of admissions where methadone was the primary substance for which treatment was sought decreased in 2012, the proportions of treatment admissions where methadone was the primary, secondary, or tertiary substance have been slowly increasing since 2007.
• Both the number and proportion of total treatment admissions involving benzodiazepines have remained relatively stable since 2007.
• There were 82 total treatment admissions related to bath salts in 2012. Between 2011 and 2012, treatment admissions related to bath salts have tripled.

Hornby Zeller Associates, Inc. 6

Hornby Zeller Associates, Inc. 7
Introduction
Overview of Maine The state of Maine has a population of 1,329,192 people in 2012. Maine is considered an “aging” state, with 16 percent of the population being 65 years old and over, a higher rate than the overall US population (13%). On the other hand, 20 percent of the state’s population is under the age of 18 years old, a lower rate than the United States average (24%). According to the 2011 U.S. Census estimate, 95 percent of Maine’s population is White, non-Hispanic, followed by 1.4 percent Hispanic, 1.3 percent who are Black, 1.1 percent who are Asian, and 0.7 percent who are American Indian. There are five Native American tribal communities in Maine: the Penobscot, the Passamaquoddy (Pleasant Point and Indian Township), the Maliseet and the Micmac, whose numbers likely are underreported on the census. In Washington County, 4.9 percent of the population reports being Native American. Androscoggin and Cumberland counties are the most diverse communities, each home to communities with many ethnic backgrounds and national origins due in large part to refugee resettlement programs there. Maine has four metropolitan areas throughout the state, numerous small towns and communities and vast areas that are virtually unpopulated. While the average number of people per square mile was 43.1 in 2011, this greatly varies by county. The most populated counties were Cumberland with 337.2 per square mile and Androscoggin with 220.8 persons per square mile, while the least densely populated counties were Piscataquis with 4.4, Aroostook with 10.8 and Somerset with 13.3 persons per square mile. Maine is also a diverse state economically. The median household income was $47,898 in 2011, lower than the United States median income of $52,762. Income varies greatly by location in a similar fashion as population density. The southern coastal counties, such as Cumberland (where most of the population is located) have much higher median incomes than the northern, rural, and less densely populated counties such as Piscataquis and Washington. At $57,267, Cumberland has the highest median income and is one of only three Maine counties where the median income is higher than the United States median income (the others are Sagadahoc at $56,865 and York at $56,552). At the other end of this range, Washington County has the lowest median income at $35,272 a year. Piscataquis, the county with the lowest population density, has a median income of $35,123, the second lowest in the state. It is within the context of these demographic characteristics that substance abuse in Maine must be examined. Purpose of this Report This report takes into account the primary objectives of the Office of Substance Abuse and Mental Health Services (SAMHS): to identify substance abuse patterns in defined geographical areas, establish substance abuse trends, detect emerging substances, and provide information for policy development and program planning. It also highlights all the prevention priorities

Hornby Zeller Associates, Inc. 8
identified in the OSA strategic plan: underage drinking, high-risk drinking among 18-25 year olds, misuse of prescription drugs among 18-25 year olds, marijuana use in 12-25 year olds, and slowing the spread of methamphetamine abuse; as well as monitors the progress being made to address these priorities. This report includes data available through December 2012 and when possible updates the March 2012 report which included data through December 2011. Older and unchanged data are included when more recent data were not available. Five major types of indicators are included: self-reported substance consumption, consequences of substance use, factors contributing to substance use, indicators about mental health and substance abuse, and treatment admissions. Previous reports are available at the www.maineosa.org website. Organization of the Report This report is used by a variety of people for many reasons. Some need a snapshot of the current status of a particular substance, while others are looking for longer-term trends. Still others may be seeking information on a particular population. Sometimes these points of view do not require new data, but rather special comparisons or presentations. To accommodate these diverse needs, the report is organized as follows:
• The Executive Summary provides the reader with a brief overview of the larger report. It includes statistics and findings, but does not contain graphical illustrations, long-term trends or comparative findings.
• The section Data Sources, Indicators and Selection Criteria describes the data sources and indicators that are included in the profile, as well as the process used to decide which indicators should be included in the profile.
• The Full Report presents the reader with more in-depth comparative and trend analyses for indicators that are critical to substance abuse and is broken into five major sections.
o Consumption trends and patterns among some of the most abused substances, in order to provide the reader a deeper understanding of those substances.
o Consequences related to substance use, such as traffic accidents and poisonings. o Factors that contribute to substance use overall, such as norms and perceptions. o Mental Health indicators and how they relate to substance abuse. o Recent trends in substance abuse treatment admissions.

Hornby Zeller Associates, Inc. 9
Data Sources, Indicators and Selection Criteria
This report includes data that was gathered from a number of sources. A detailed description of each source is provided below, consisting of information about the data included in each source, the strengths and weaknesses, and retrieval or contact information. The report includes data that were available through December 2012 and updates the March 2012 report. A number of criteria are used annually to determine what information should be included in this report. A small SEOW workgroup applies these standards to each indicator and selects the best possible data source (or sources) to be included. Indicators that are determined to be redundant, no longer useful, or too confusing are updated in order to provide the reader with a streamlined and more comprehensive report. Each criterion is defined below:
• Relevance: To be included, each of the indicators must be directly related to substance use. The indirect effects of substance use reach throughout society in such areas as crime, health and education. However, this report limits indicators to those which can be directly related to substance use (e.g., hospital admissions in which substance use was recorded as a factor, rather than generating an estimate of the percentage of all hospital admissions that could be related to substance use).
• Timeliness: Each of the indicators includes the most updated data available from the source. The timeliest data included are from the previous six months or year, but some data as old as three years may be included; this happens when the most recently collected data from the source are not yet available due to the timing of data collection and the publication of this report. The sources that reflect older information are included when they meet other important criteria. For example, the National Survey on Substance Use and Health, for which the most recent data available are from 2009-10, provides data that are highly relevant and reliable.
• Availability: For an indicator to be included in this report, data regarding its use must be available from a reliable source. That is, a question must be asked on a representative survey or an office must record incidents, and the source must be willing to release the results either to the general population, or the SEOW and/or its members. As stated above, the most recent data available from those sources are included in this report.
• Reliability: In order to include trended data in this report, the data available for each indicator must be reliable and comparable from year to year. They need to reflect the same indicator in the same manner for the same population each year.
• Trending: Trends are included in this survey for indicators in which reliable and comparable data are available from multiple years. In some instances, trending is limited or not possible due to limited availability of the data. For example, questions regarding the use of specific substances have been included and discontinued in use surveys as those substances have become more or less of a concern. Therefore, trending is only available for their use in the years those questions were included in the survey.

Hornby Zeller Associates, Inc. 10
As described previously, there are multiple purposes for this report. One is to provide a snapshot of the most recent data regarding substance abuse, while another is to examine trends over time. Therefore, each indicator may have multiple sources of data that are included. While each indicator provides a unique and important perspective on drug use in Maine, none should individually be interpreted as providing a full picture of drug trends in Maine. In particular, the percentages and figures from one data source do not always align with the data and percentages from a similar source. Older data are often included in order to examine an indicator among a specific population or to find trends over time. When discussing rates of prevalence, however, the user should rely upon the most recent data source available. Description of Data Sources Behavioral Risk Factor Surveillance System (BRFSS). The BRFSS is a national survey administered on an ongoing basis by the National Centers for Disease Control and Prevention (CDC) to adults in all 50 states and several districts and territories. The instrument collects data on adult risk behaviors, including alcohol abuse. BRFSS defines heavy drinking as adult men having more than two drinks per day and adult women having more than one drink per day, and binge drinking as males having five or more drinks on one occasion and females having four or more drinks on one occasion. The most recent data available are from 2011. Due to methodological changes in weighting and sampling, 2011 BRFSS data cannot be trended with previous BRFSS years. For this reason, we have only included snapshots of 2011 BRFSS data for this year’s SEOW report. Both state and national data are available. Contact: Kim E. Haggan, Maine BRFSS Acting Coordinator; [email protected]; (207) 287-5459. Maine Department of Public Safety (DPS), Bureau of Highway Safety (BHS), Maine Department of Transportation (MDOT). The Bureau of Highway Safety is responsible for tracking all fatalities that occur on Maine's highways and reporting this information through the Fatal Analysis Reporting System (FARS). The data represented provides information on highway crashes and fatalities. Much of this information is gathered from our FARS system, which records data on fatal crashes in Maine for input into a larger national record-keeping system of statistical data. FARS data is also used by BHS and the Maine State Police to analyze enforcement priorities and schedules. Impaired driving is one of the most serious traffic risks facing the nation, killing thousands every year. Contact: Duane Brunell, Safety Performance Analysis Manager; [email protected]; (207) 624-3278. Maine Department of Public Safety (DPS), Uniform Crime Reports (UCR). UCR data include drug and alcohol arrests. Drug arrests include sale and manufacturing as well as possession of illegal substances. Liquor arrests include all liquor law violations. OUI arrests are arrests for operating a motor vehicle under the influence of a controlled substance. DPS data are now available from 2011. Arrest data may reflect differences in resources or focus of law enforcement efforts, so may not be directly comparable from year to year. Retrieval: http://www.maine.gov/dps/cim/crime_in_maine/cim.htm

Hornby Zeller Associates, Inc. 11
Maine Drug Enforcement Agency (MDEA). The MDEA through its regional multi-jurisdictional task forces is the lead state agency in confronting drug trafficking crime. The data included in this report represents those arrested for a drug offense but does not indicate what other drug(s) may have been seized. For example, a person may be arrested for the sale of cocaine but also be in possession of oxycodone and marijuana. It is important to note that arrests and multi-jurisdictional drug enforcement are resource-dependent; such funds fluctuate from year to year, and must be reallocated to combat highest priority threats. Contact: Roy E. McKinney, Director; [email protected]; (207) 626-3852. Maine Emergency Medical Services (EMS). Maine EMS is a bureau within the Maine Department of Public Safety (DPS) and is responsible for the coordination and integration of all state activities concerning Emergency Medical Services and the overall planning, evaluation, coordination, facilitation and regulation of EMS systems. EMS collects data statewide from the 272 licensed ambulance and non-transporting services. It is mandated that services submit an electronic patient care report to Maine EMS within one business day of patient contact. Data are compiled upon request. Contact: Jon Powers, Maine Emergency Medical Services; [email protected]; (207) 626-3860. Maine Health Data Organization (MHDO). MHDO data includes all inpatient admissions to all hospitals in Maine for calendar year 2009. Data categories created by the authors include alcohol, opioids, illegal drugs, and pharmaceuticals. All drug categories include intoxication, abuse, dependence, and poisoning cases related to the drug. The opioid category includes methadone, heroin, and opiates. The illegal drug category includes crack/cocaine, cannabis, and hallucinogens. The pharmaceuticals category includes all other non-opioid medications (including stimulants and depressants). Data are compiled annually and are therefore not available on a more frequent basis. Contact: Lisa Parker, Maine Health Data Organization (MHDO), [email protected]; (207) 287-3225. Maine Integrated Youth Health Survey (MIYHS). The MIYHS is a statewide survey administered biennially through a collaborative partnership by the Maine Office of Substance Abuse and Mental Health Services (SAMHS) the Maine Center for Disease Control and Prevention and the Maine department of Education to students in grades 5 through 12. The survey collects information on student substance use, risk factors related to substance use, as well as consequences, perceptions and social risk factors related to substances, and collects information on many other health factors. MIYHS defines binge-drinking as consuming five or more drinks in a row. As of the date of this report, the most recent data available are from 2011. Contact: Anne Rogers, Data and Research Manager, Substance Abuse and Mental Health Services; [email protected]; (207) 287-4706. Maine Homeless Youth Survey. The Maine Homeless Youth Health Survey purpose is to measure the personal safety, sexual, and substance use behaviors of homeless youth in Maine. The survey has necessarily relied on community-based organizations that provide services to homeless youth to administer the survey. Thus, the survey participants represent youth who are using drop-in, outreach or residential services at agencies in some of Maine’s largest cities.

Hornby Zeller Associates, Inc. 12
The survey was administered to as diverse and representative a group of homeless youth as possible. Ten agencies distributed the survey to the youth in their programs. The survey was anonymous, voluntary, and self-administered. It was completed by 305 youth (aged 20 or younger) from January through April, 2012. Youth were given food coupons equal to a five dollar value for their participation. They were asked 31 questions (several of which included a follow-up question) about a range of topics, including: demographic identifiers, educational achievement, personal safety, substance use, and sexual experiences. Contact: Jean Zimmerman, Health Consultant; [email protected]; (207) 624-6687. Maine Office of the Chief Medical Examiner. The Maine Office of the Chief Medical Examiner maintains records of all deaths associated with drug overdose. Drug categories include methadone, cocaine, benzodiazepines, oxycodone and heroin/morphine. The death data are compiled on an annual basis and must be finalized prior to release, and so are not available to track changes that may occur over shorter time frames. Contact: Dr. Marcella Sorg, Director, Rural Drug & Alcohol Research Program, Margaret Chase Smith Policy Center, University of Maine; [email protected]; (207) 581-2596. National Survey on Substance Use and Health (NSDUH). The NSDUH is a national survey administered annually by the Substance Abuse and Mental Health Services Administration (SAMHSA) to youth grades 6 through 12 and adults ages 18 and up. The instrument collects information on substance use and health at the national, regional and state levels. The advantage of NSDUH is that it allows comparisons to be made across the lifespan (that is, ages 12 and up). However, NSDUH is not as current as other data sources; as of this report, data at the state level are available from 2009-2010. Older data are included for trending and comparative purposes. NSDUH defines Illicit Drugs as marijuana/hashish, cocaine (including crack), heroin, hallucinogens, inhalants, or any prescription-type psychotherapeutic used non-medically; Binge Alcohol Use as drinking five or more drinks on the same occasion (i.e., at the same time or within a couple of hours of each other) on at least one day in the past 30 days; Dependence or abuse based on definitions found in the fourth edition of the Diagnostic and Statistical Manual of Mental Disorders (DSM-IV); and Serious Mental Illness (SMI) as a diagnosable mental, behavioral, or emotional disorder that met the criteria found in the fourth edition of the Diagnostic and Statistical Manual of Mental Disorders (DSM-IV) and resulted in functional impairment that substantially interfered with or limited one or more major life activities. Retrieval: https://nsduhweb.rti.org/ Northern New England Poison Center (NNEPC). The Northern New England Poison Center provides services to Maine, New Hampshire, and Vermont. A poisoning case represents a single individual’s contact with a potentially toxic substance. Intentional poisoning includes those related to substance abuse, suicide and misuse. Data include the number of confirmed cases where exposures are judged to be substance abuse-related (i.e., an individual's attempt to get high). NNEPC collects detailed data on specific substances involved in poisonings, including the categories of stimulants/street drugs, alcohol, opioids, asthma/cold and cough, benzodiazepines, antidepressants, and pharmaceuticals, as well as other substances. The category of stimulants/street drugs includes marijuana and other cannabis, amphetamine and

Hornby Zeller Associates, Inc. 13
amphetamine-like substances, cocaine (salt and crack), amphetamine/dextroamphetamine, caffeine tablets/capsules, ecstasy, methamphetamine, GHB, and other/unknown stimulants/street drugs. The category alcohol includes alcohol-containing products such as mouthwash. The opioid category includes Oxycodone, Hydrocodone, buprenorphine, methadone, tramadol, morphine, propoxyphene, codeine, hydromorphone, stomach opioids, Meperidine (Demerol), heroin, Fentanyl, and other/unknown opioids. The asthma/cold and cough category includes eye, ear, nose, and throat medications. Data available from the poison center are reported on a continual daily basis and are included through December 2012. These data are only reflective of cases in which the Poison Center was contacted. Contact: Karen Simone, Director, Northern New England Poison Center; [email protected]; (207) 662-7221. Office of Data, Research and Vital Statistics (ODRVS). ODRVS is a program within the Maine CDC. The data include Maine resident deaths in which the death certificate statistical file included any mention that alcohol or drug use may have had a role. Data include unintentional, self-inflicted, assault and undetermined intent deaths. Contact: Kim Haggan, Office of Data, Research and Vital Statistics; [email protected]; (207) 287-5459. Pregnancy Risk Assessment Monitoring System (PRAMS). PRAMS is an ongoing, population-based surveillance system designed to identify and monitor selected maternal behaviors and experiences before, during, and after pregnancy among women who have recently given birth to a live infant. Data are collected monthly from women using a mail/telephone survey. For more information contact: [email protected]; (207) 287-5469. Prescription Monitoring Program (PMP). PMP maintains a database of all transactions for class C-II through C-IV drugs dispensed in the state of Maine. Drug categories used in this report include narcotics, tranquilizers, stimulants, and other prescriptions. Other prescriptions include those drugs that are not classified as narcotics, tranquillizers or stimulants, including products such as endocrine and metabolic drugs, analgesics and anesthetics, gastrointestinal agents, and nutritional products. Prescription counts do not reflect amounts in terms of dosage or quantity of pills, but rather represent the volume of active prescriptions during the time period. The counts included in this report represent the number of prescriptions filled between 2006 and 2012. Contact: John Lipovsky, PMP Coordinator, Substance Abuse and Mental Health Services; [email protected]; (207) 287-3363. Treatment Data System (TDS). TDS is a statewide database that includes information about clients admitted to treatment in OSA-funded facilities through December 2012. Analyses in this report are based on clients’ reported primary, secondary and tertiary drug(s) of choice as well as other demographic and background information that is collected at intake. Drug categories included in this report are alcohol, marijuana, cocaine, heroin, synthetic opiates, methadone/buprenorphine and benzodiazepines. Contact: Stacey Chandler, Substance Abuse and Mental Health Services; [email protected]; (207) 287-6337. Youth Risk Behavior Surveillance System (YRBSS). The YRBSS is national survey administered biennially by the National Centers for Disease Control and Prevention (CDC) to students in

Hornby Zeller Associates, Inc. 14
grades 9 through 12. The survey collects information on youth risk behaviors, including substance use. The YRBSS defines binge drinking as consuming five or more drinks of alcohol in a row; first drink of alcohol as first drink other than a few sips; and inhalant use as sniffed glue, breathed the contents of aerosol spray cans, or inhaled any paints or sprays to get high. The most recent YRBSS data is available for 2011, and older data is included as well for trending reports. Both state and national data are available. Due to the changes in the MIYHS described above, data from the YRBSS are included to provide trending analysis in this report. Retrieval: http://www.cdc.gov/healthyyouth/yrbs/index.htm

Hornby Zeller Associates, Inc. 15
Consumption of Substances
Consuming harmful substances can have detrimental effects on an individual’s well-being, including increased risks of morbidity, addiction and mortality, and has a harmful effect on society as a whole including increased motor vehicle accidents and crime. However, it is the manner and frequency with which people drink, smoke, and use drugs that are often linked to particular substance-related consequences. To understand fully the magnitude of substance use consequences, it is important to first understand the prevalence of substance use consumption itself. Consumption includes overall use of substances, acute or heavy consumption, and consumption by high risk groups (e.g., youth, college students, pregnant women, etc.). As demonstrated by the indicators below, alcohol remains the substance most often used by Mainers across the lifespan. In particular, high-risk drinking among the 18 to 25 year old population continues to be a concern, although it appears that the rates of use among those who are below the legal age to drink are declining. Prescription drugs and marijuana are the two most commonly used drugs in Maine. Again, the young adult population rises to the top in terms of high rates of using these substances.

Hornby Zeller Associates, Inc. 16
Alcohol Indicator Description: CURRENT ALCOHOL USE AMONG YOUTH. This measure shows the percentage of high school students who reported having had one or more alcoholic drinks on one or more days within the past month. Why Indicator is Important: Alcohol is the most often used substance among youth in Maine. In addition to the risks alcohol consumption carries for adults, developing adolescent brains are especially susceptible to the health risks of alcohol consumption. Adolescents who consume alcohol are more likely to have poor grades and be at risk for experiencing social problems, depression, suicidal thoughts, assault, and violence. Data Source(s): MIYHS, 2009-2011; YRBSS, 2001-2011. Summary: The proportion of high school students in Maine who report consuming alcohol in the past month has been decreasing since 2001 and there was a significant drop between 2005 and 2011.
Figure 1. Percent of high school students reporting alcohol use in the past month: 2009 and 2011
Source: MIYHS, 2009-2011
• According to the MIYHS, the percentage of High School students consuming alcohol in the past month fell from 32 percent in 2009 to 28 percent in 2011.
• Although not shown, 29 percent of high school students who ever consumed alcohol reported having their first drink of alcohol before the age of 13.
32% 28%
0%
10%
20%
30%
40%
50%
2009 2011

Hornby Zeller Associates, Inc. 17
Figure 2. Percent of high school students reporting alcohol use in past 30 days: 2001 through 2011
Source: YRBSS, 2001-2011
• According to the YRBSS, the percentage of students who have had at least one drink of alcohol during the past 30 days decreased dramatically from 48 percent in 2001 to 29 percent in 2011.
48% 42% 43%
39% 32% 29%
0%
20%
40%
60%
80%
100%

Hornby Zeller Associates, Inc. 18
Indicator Description: CURRENT HIGH-RISK ALCOHOL USE AMONG YOUTH. This indicator presents the percentage of youth who reported having had five or more alcoholic drinks in a row in the past two weeks and on at least one day within the past month. Why Indicator is Important: Youth are more likely than adults to binge drink when they consume alcohol. High risk alcohol use contributes to violence and motor vehicle crashes and can result in negative health consequences for the consumer, including injuries and chronic liver disease. Youth who engage in high-risk drinking also are more likely to use drugs and engage in risky and antisocial behavior. Data Source(s): MIYHS, 2009-2011. Summary: From 2009 to 2011 there has been a decrease in the proportion of high school students who report binge drinking within the past month.
Figure 3. Percent of high school students who had five or more drinks in a row at least once in the past month:
2009 and 2011
Source: MIYHS, 2009-2011
• The percentage of high school students who reported having consumed five or more drinks in a row one or more times during the past two weeks fell from 19 percent in 2009 to 17 percent in 2011.
19% 17%
0%
10%
20%
30%
40%
50%
2009 2011

Hornby Zeller Associates, Inc. 19
Indicator Description: CURRENT ALCOHOL USE AMONG ADULTS. This indicator portrays the percentage of adults who reported having consumed one or more alcoholic drinks on one or more days within the past month.1 Why Indicator is Important: Alcohol is the most often used substance by Maine adults. Excessive and high risk alcohol use may contribute to violence and result in many negative health consequences for the consumer. Moderate drinking can also have negative health effects and lead to such consequences as alcohol-related motor vehicle crashes and increased injuries. Current alcohol use in pregnant women is also linked to low birth weight babies, sudden infant death, and other developmental delays in children. Data Source(s): BRFSS, 2011; NSDUH, 2002-03 to 2009-10 Summary: Alcohol is the most frequently used substance among adults in Maine, with six out of ten adults indicating they had consumed it within the past month. Adults ages 26 to thirty-five exhibit the highest rates of use.
Figure 4. Percent of adults reporting drinking in past 30 days by age group: 2011
Source: BRFSS, 2011
• In 2011, among Mainers over the age of 18, 60 percent reported consuming any alcohol in the past 30 days. The highest observed rates are among 26 to 35 year olds at 68 percent, followed by 36 to 49 year olds with a rate of 66 percent.
1 NSDUH defines current use as use within the past month, while BRFSS, MIYHS, and YRBSS define it as use within the past 30 days.
60% 65% 68% 66%
54%
0%
20%
40%
60%
80%
100%
18+ 18-25 26-35 36-49 50+

Hornby Zeller Associates, Inc. 20
Figure 5. Percent of Maine residents (age 18 and older) reporting any alcohol use in past month, by age group:
2002-03 through 2009-10
Source: NSDUH, 2002-03 to 2009-10
• According to the 2009-10 NSDUH, the rate of past month alcohol use among 18 to 25 year olds was 65 percent compared to 59 percent among those 26 years old and older. Alcohol use among adults 26 and older has increased by 7 percentage points between 2003-04 and 2009-10.
67% 64% 64% 67% 66% 64% 66% 65%
54% 52% 54% 57% 56% 55% 58% 59%
0%
20%
40%
60%
80%
100%
18-25 year olds 26+ year olds

Hornby Zeller Associates, Inc. 21
Indicator Description: AT RISK FROM HEAVY ALCOHOL USE. This indicator examines the percentage of Maine residents who are at risk from heavy drinking in the past month. Heavy drinking is defined as two drinks per day for a man or one drink per day for a woman. Why Indicator is Important: Heavy drinking increases the risk for many health and social related consequences. People who consume alcohol heavily are at increased risk for a variety of negative health consequences, including alcohol abuse and dependence, liver disease, certain cancers, pancreatitis, heart disease, and death. It has also been found that the more heavily a person drinks the greater the potential for problems at home, work, and with friends.2 Data Source(s): BRFSS, 2011 Summary: In 2011, 18-25 year olds appeared to be at greatest risk from heavy alcohol use, with more than one in ten reporting that they consumed at least one alcoholic drink per day in the past 30 days.
Figure 6. Percent of adults at risk from heavy alcohol use in past 30 days, by age group: 2011
Source: BRFSS, 2011
• In 2011, seven percent of adults over the age of 18 reported having consumed alcohol on a daily basis, putting them at risk from heavy alcohol use. Eighteen to 25 year olds reported the highest rate at 11 percent while 26 to 35 year olds reported the second highest rate at 9 percent.
2 Citation from Alcoholscreening.org, a service of Join Together and the Boston University School of Public Health. Retrieved from http://www.alcoholscreening.org/Learn-More.aspx?topicID=8&articleID=26 on 5/5/2011.
7%
11% 9%
6% 7%
0%
5%
10%
15%
20%
25%
18+ 18-25 26-35 36-49 50+

Hornby Zeller Associates, Inc. 22
Indicator Description: CURRENT HIGH-RISK ALCOHOL USE AMONG ADULTS. This indicator reflects the percentage of adults who reported consuming five or more alcoholic drinks in a row on at least one day within the past month.3 Why Indicator is Important: Binge drinking is considered to be a type of high-risk drinking, meaning it increases the risk for many health and social related consequences. High-risk alcohol use has been linked to injury (such as falls, fights, and suicides), violence, crime rates, motor vehicle crashes stroke, chronic liver disease, addiction, and some types of cancer. Data Source(s): BRFSS, 2011; NSDUH, 2002-03 to 2009-10 Summary: In 2011, the highest binge drinking rates were found to be among age groups 18 to 25 and 26 to 35. Rates of binge drinking have remained fairly stable over time.
Figure 7. Percent of adults ages reporting binge drinking in past 30 days, by age group: 2011
Source: BRFSS, 2011
• In 2011, 16 percent of Maine adults 18 and over reported binge drinking at least once in past 30 days. The age group 18 to 25 reported the highest rate at 30 percent; this was followed by 26 to 35 year olds with a rate of 28 percent. The lowest rate of binge drinking was reported among Mainers over the age of 50 (9%).
3 BRFSS defines binge drinking as five or more drinks in one sitting for a male and four or more drinks in one sitting for a female.
16%
30% 28%
18%
9%
0%
10%
20%
30%
40%
50%
18+ 18-25 26-35 36-49 50+

Hornby Zeller Associates, Inc. 23
Figure 8. Percent of Maine residents (age 18 and older) reporting binge alcohol use in past month, by age group:
2002-03 through 2009-10
Source: NSDUH, 2002-03 to 2009-10
• The higher rate of binge drinking among young adults age 18 to 25 appears to be relatively stable, fluctuating between 43 to 46 percent since 2002-03. This is compared to older Mainers, where about 1 in 5 consistently reported binge drinking.
45% 44% 43% 46% 46%
43% 45% 46%
20% 19% 19% 20% 21% 20% 20% 21%
0%
10%
20%
30%
40%
50%
18-25 years old 26+ years old
Hornby Zeller Associates, Inc. 24
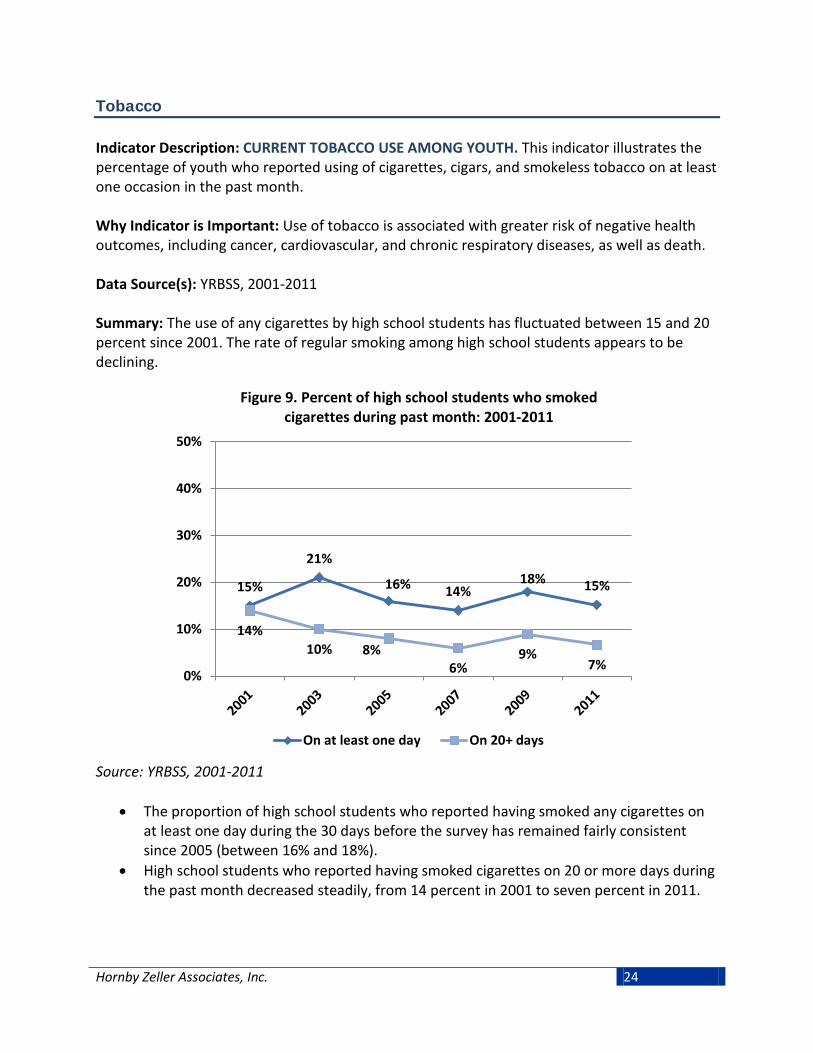
Tobacco Indicator Description: CURRENT TOBACCO USE AMONG YOUTH. This indicator illustrates the percentage of youth who reported using of cigarettes, cigars, and smokeless tobacco on at least one occasion in the past month. Why Indicator is Important: Use of tobacco is associated with greater risk of negative health outcomes, including cancer, cardiovascular, and chronic respiratory diseases, as well as death. Data Source(s): YRBSS, 2001-2011 Summary: The use of any cigarettes by high school students has fluctuated between 15 and 20 percent since 2001. The rate of regular smoking among high school students appears to be declining.
Figure 9. Percent of high school students who smoked cigarettes during past month: 2001-2011
Source: YRBSS, 2001-2011
• The proportion of high school students who reported having smoked any cigarettes on at least one day during the 30 days before the survey has remained fairly consistent since 2005 (between 16% and 18%).
• High school students who reported having smoked cigarettes on 20 or more days during the past month decreased steadily, from 14 percent in 2001 to seven percent in 2011.
15%
21%
16% 14% 18% 15%
14% 10% 8%
6% 9%
7% 0%
10%
20%
30%
40%
50%
On at least one day On 20+ days

Hornby Zeller Associates, Inc. 25
Figure 10. Percent of high school students who used tobacco during past month, by tobacco type: 2001-2011
Source: YRBSS, 2001-2011
• In 2011, cigarettes continued to be the preferred form of tobacco for high school students during the previous 30 days (15%), closely followed by cigars (13%), and then smokeless tobacco (8%). The rate of cigarette use has remained fairly stable between 2001 and 2011, while the use of smokeless tobacco appears to have increased slightly.
15%
21%
16% 14% 18%
15%
6% 4%
7% 6% 9% 8%
14% 14%
15% 13%
0%
10%
20%
30%
40%
50%
Cigarettes Smokeless tobacco Cigars

Hornby Zeller Associates, Inc. 26
Indicator Description: CIGARETTE USE AMONG ADULTS. This measure depicts cigarette use among adults who reported smoking at least 100 cigarettes in their lifetime, in three groups: those who sometimes still smoke; those who currently smoke every day; and those who formerly smoked at least 100 cigarettes in their lifetime but do not currently smoke at all. Why Indicator is Important: Tobacco use has been linked to several negative health outcomes, including cancer, cardiovascular, and chronic respiratory diseases, as well as death. Second-hand smoke is also associated with many negative health outcomes, such as increased colds, flu, asthma, bronchitis, lung cancer, low birth weight babies. Data Source(s): BRFSS, 2011 Summary: In 2011, nearly one in five Mainers 18 and older reported smoking cigarettes daily. The highest rate of daily smoking was observed among adults between the ages of 26 and 35.
Figure 11. Current (past 30 days) and former smokers who reported smoking at least 100 cigarettes in their lifetime,
by age group: 2011
Source: BRFSS, 2011
• In 2011, 18 percent of Maine adults reported daily cigarette use and five percent said they currently smoke but not every day; this means 23 percent of Maine adults have smoked at least once in the past month. Thirty-one percent reported being former smokers. Mainers ages 26 to 35 reported the highest rate of daily cigarette use at 27 percent, followed by 18 to 25 year olds at 23 percent, and 36 to 49 year olds at 22 percent. Almost one in three Maine adults has smoked at least 100 cigarettes but does not currently smoke.
5% 8% 8%
6% 4%
18%
23%
27%
22%
11%
31%
11%
24% 25%
42%
0%
10%
20%
30%
40%
50%
18+ 18-25 26-35 36-49 50+
Smoked Some Days Smoked Everyday Former Smokers

Hornby Zeller Associates, Inc. 27
Prescription Drugs Indicator Description: MISUSE OF PRESCRIPTION DRUGS AMONG YOUTH. This indicator presents the percentage of youth who reported using prescription drugs that were not prescribed to them by a doctor. The indicator examines both current use (i.e., within the past month) and lifetime use (i.e., ever). Why Indicator is Important: Young people are increasingly using available prescription drugs, including stimulants and opiates, instead of illegal drugs to get high. Abuse of prescription drugs may lead to consequences such as unintentional poisonings or overdose, automobile crashes, addiction, and increased crime. Data Source(s): MIYHS, 2009-2011. Summary: It appears that among high school students, the rates for lifetime as well as past month usage of prescription drugs that were not prescribed have decreased from 2009 to 2011. In 2011, about one in seven high school students reported misusing a prescription drug in their lifetime.
Figure 12. Percent of high school students who have taken prescription drugs that were not prescribed to them in their
lifetime and in the past month: 2009 and 2011
Source: MIYHS, 2009-2011
• From 2009 to 2011, the proportion of high school students who reported having taken a prescription drug that had not been prescribed to them by a doctor at least once in their lifetime decreased from 18 percent to 15 percent. The rate of students who reported having done so within the past month fell from nine percent in 2009 to seven percent in 2011.
18%
9%
15%
7%
0%
10%
20%
30%
40%
50%
Lifetime Past month2009 2011

Hornby Zeller Associates, Inc. 28
Indicator Description: NONMEDICAL USE OF PAIN RELEIVERS AMONG ADULTS. This measure reflects the percentage of adults who reported using prescription drugs, particularly prescription pain relievers, for reasons other than their intended purpose. Why Indicator is Important: Mainers are increasingly misusing available prescription drugs (including stimulants and opiates) instead of illegal drugs to get high. Abuse of prescription drugs may lead to consequences such as unintentional poisonings, overdose, dependence and increased crime. Data Source(s): NSDUH, 2003-04 to 2009-10 Summary: Non-medical use of prescription pain relievers is higher among adults ages 18 to 25 compared to adults 26 and older. This trend has remained relatively stable since 2003-04.
Figure 13. Non-medical use of pain relievers among Maine residents in the past year, by age group:
2003-04 through 2009-10
Source: NSDUH, 2003-04 to 2009-10
• The reported non-medical use of pain relievers in the past year among Mainers 18 to 25 years old was 14 percent in 2009-10. Those ages 26 and older were consistent at three percent across all years shown.
14% 13% 14% 14% 12%
14% 14%
3% 3% 3% 3% 3% 3% 3%
0%
5%
10%
15%
20%
25%
18-25 year olds 26+ year olds

Hornby Zeller Associates, Inc. 29
Indicator Description: MISUSE OF PRESCRIPTION DRUGS AMONG ADULTS. This measure reflects the percentage of adults in Maine who reported using prescription drugs not prescribed to them by a doctor, or using them in a way other than the one prescribed, at least once in their lifetime. Why Indicator is Important: Mainers are increasingly misusing available prescription drugs (including stimulants and opiates) instead of illegal drugs to get high. Abuse of prescription drugs may lead to consequences such as unintentional poisonings, overdose, dependence and increased crime. Data Source(s): BRFSS, 2011 Summary: In 2011, lifetime prescription drug misuse rates was highest among adults between the ages of 26 and 35; nearly one in ten adults reported to have misused prescription drugs within their lifetime.
Figure 14. Misuse of prescription drugs among Maine residents in their lifetime, by age group: 2011
Source: BRFSS, 2011
• In 2011, three percent of adults 18 and older in Maine reported having misused prescription drugs during their lifetime. The highest rate of misuse was observed among adults 26 to 35 years old (10%), followed by 18 to 25 year olds (6%).
3%
6%
10%
1% 1% 0%
5%
10%
15%
20%
25%
18+ 18-25 26-35 36-49 50+

Hornby Zeller Associates, Inc. 30
Other Illegal Drugs Indicator Description: CURRENT MARIJUANA USE. This measure shows the percentage of Mainers who reported using marijuana in the past month. This is presented for high school students and across the lifespan (i.e., among Mainers over the age of 12). Why Indicator is Important: Marijuana can be addictive and is associated with increased risk for respiratory illnesses and memory impairment. Also, youth who begin smoking marijuana at an early age are more likely to develop substance abuse and dependence later in life.4 Data Source(s): MIYHS 2009-2011; NSDUH, 2002-03 to 2009-10; BRFSS, 2011 Summary: One in five high school students reported using marijuana within the past month; similar rates are seen within the young adult (18-25) population.
Figure 15. Percent of high school students who have used marijuana at least once in the past month: 2009 and 2011
Source: MIYHS, 2009-2011
• The percentage of high school students who used marijuana one or more times during the previous 30 days has maintained at a rate of 22 percent from 2009 to 2011.
• Although not pictured, in 2011, the majority of high school students who had ever used marijuana did so when they were between the ages 13 and 16 (70%). Twenty-two percent had tried marijuana for the first time before the age of 13. Ten percent did so at the age of 10 or younger.
4 Kosterman, R., Hawkins, J. D., Guo, J., Catalano, R. F., & Abbott, R. D. (2000). The dynamics of alcohol and marijuana initiation: Patterns and predictors of first use in adolescence. American Journal of Public Health, 90, 360-366.
22% 22%
0%
10%
20%
30%
40%
50%
2009 2011

Hornby Zeller Associates, Inc. 31
Figure 16. Percent of Maine residents (age 18 and older) reporting marijuana use in past month, by age group:
2002-03 through 2009-10
Source: NSDUH, 2002-03 to 2009-10
• Twenty-seven percent of Maine residents between the ages of 18 and 25 used marijuana in the past month in 2009-10, an increase of four percentage points since 2007-08. In this same time period, marijuana use in the past month was lower for people ages 26 and older (7%).
• Although not depicted here, according to the 2011 BRFSS, about eight percent of Maine adults (18 and older) reported using marijuana recreationally within the past 30 days while two percent reported using marijuana for medical purposes.
23% 24% 25% 28% 26%
23% 26% 27%
5% 5% 6% 6% 6% 6% 8%
7%
0%
10%
20%
30%
40%
50%
18-25 year olds 26+ year olds
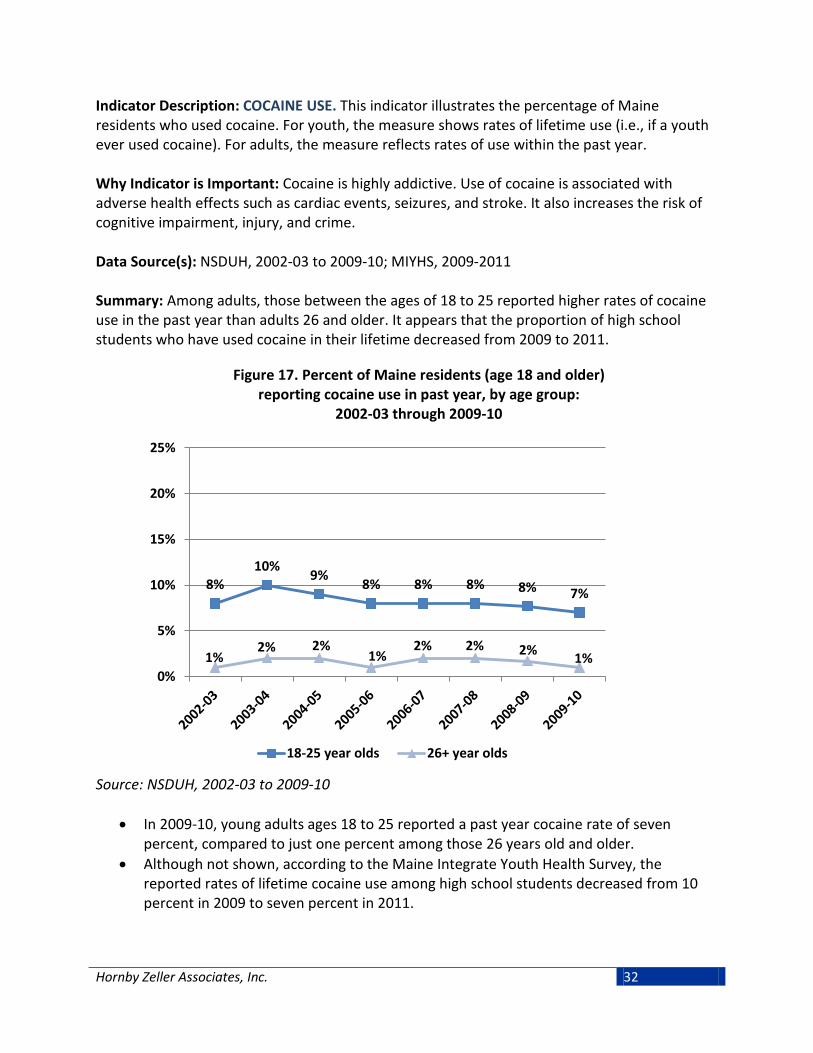
Hornby Zeller Associates, Inc. 32
Indicator Description: COCAINE USE. This indicator illustrates the percentage of Maine residents who used cocaine. For youth, the measure shows rates of lifetime use (i.e., if a youth ever used cocaine). For adults, the measure reflects rates of use within the past year. Why Indicator is Important: Cocaine is highly addictive. Use of cocaine is associated with adverse health effects such as cardiac events, seizures, and stroke. It also increases the risk of cognitive impairment, injury, and crime. Data Source(s): NSDUH, 2002-03 to 2009-10; MIYHS, 2009-2011 Summary: Among adults, those between the ages of 18 to 25 reported higher rates of cocaine use in the past year than adults 26 and older. It appears that the proportion of high school students who have used cocaine in their lifetime decreased from 2009 to 2011.
Figure 17. Percent of Maine residents (age 18 and older) reporting cocaine use in past year, by age group:
2002-03 through 2009-10
Source: NSDUH, 2002-03 to 2009-10
• In 2009-10, young adults ages 18 to 25 reported a past year cocaine rate of seven percent, compared to just one percent among those 26 years old and older.
• Although not shown, according to the Maine Integrate Youth Health Survey, the reported rates of lifetime cocaine use among high school students decreased from 10 percent in 2009 to seven percent in 2011.
8% 10% 9% 8% 8% 8% 8% 7%
1% 2% 2%
1% 2% 2% 2% 1%
0%
5%
10%
15%
20%
25%
18-25 year olds 26+ year olds

Hornby Zeller Associates, Inc. 33
Indicator Description: INHALANT USE. This indicator depicts the percentage of high school students who reported having used inhalants in their lifetime and in the past month. Inhalants include substances such as glue, aerosol spray cans, paints or sprays. Why Indicator is Important: Chronic use of inhalants risks impaired brain function and damage to the nervous system and other organs. Even occasional use may cause heart attack, suffocation, or death. Data Source(s): YRBSS, 2001-2011 Summary: The current rate of inhalant use among high school students was about half the lifetime rate. It appears that lifetime rates for inhalant use in high school decreased in 2011 while past 30 day use has remained stable.
Figure 18. Percent of high school students reporting inhalant use (ever): 2001-2011
Source: YRBSS, 2001-2011
• The rate of reported lifetime inhalant use among high school students has been fairly steady since 2001 (around 13%). After increasing slightly in 2009, the reported rate of use appears to have declined in 2011.
13% 13% 13% 13% 15%
11%
0%
5%
10%
15%
20%
25%

Hornby Zeller Associates, Inc. 34
Indicator Description: HEROIN USE AMONG YOUTH. This indicator depicts the percentage of homeless youth in Maine who reported having used heroin in their lifetime and in the past month.
Why Indicator is Important: Chronic use of heroin risks collapsing veins, infection of heart lining and valves, abscesses, cellulites, and liver disease. Heroin is highly addictive and has been linked to detrimental health problems such as the transmission of HIV/AIDS, Hepatitis B and C, and birth defects. Key informants indicate that heroin use is an increasing problem, particularly in the southern part of the state and people addicted to opiate pharmaceuticals may use heroin if they cannot get access to their drug of choice. Data Source(s): Maine Homeless Youth Survey, 2012 Summary: Almost one in ten homeless youth in Maine have used heroin during their lifetime, a rate that was almost twice as much as Maine high school students.
Figure 19. Percent of homeless youth reporting lifetime and current heroin use: 2012
Source: Maine Homeless Youth Survey, 2012
• In 2012, nine percent of Maine homeless youth reported to have used heroin at least once in their lifetime. This was compared to one percent who reported using heroin within the past month.
• Although not shown, according to the Maine Integrated Youth Health Survey, the rate of 11th and 12th grade students reporting heroin use in their lifetime decreased between 2009 and 2011 (from 7% to 5%).
1%
9%
0%
2%
4%
6%
8%
10%
Past month use Lifetime use

Hornby Zeller Associates, Inc. 35
Consequences Resulting from Substance Use and Abuse
Both individuals and communities suffer the consequences of substance abuse in terms of increased health care needs and criminal justice resources. While a great deal of information regarding substance use can be obtained from the data described in the previous section, information on the effects of that use on individuals and communities can be derived from what has come to be called “consequence” data. Consequences are defined as the social, economic, and health problems associated with the use of alcohol and illicit drugs. Examples of these include illnesses related to alcohol, drug overdose deaths, property and personal crimes, as well as driving accidents, poisonings, and suicides that involve alcohol or drugs. Alcohol was involved in more than one-third of fatal motor vehicle crashes in 2012; the rate is particularly high among males between the ages of 16 and 24. In recent years, the numbers of substance abuse-related hospital visits, poisoning cases and overdose deaths have increased although most recent data suggest that these trends may be leveling off.

Hornby Zeller Associates, Inc. 36
Substance Use and Pregnancy Indicator Description: ALCOHOL AND CIGARETTE USE DURING THE LAST TRIMESTER. This measure reflects the percentage of mothers who reported smoking cigarettes or drinking any alcohol during the last three months of pregnancy. Why Indicator is Important: Exposure to alcohol can cause damage to the fetus during all stages of pregnancy. Because the minimum quantity of alcohol required to produce those damaging effects is unknown, the American Academy of Pediatrics recommends complete abstinence from alcohol for pregnant women. Babies born to mothers who smoked during pregnancy have lower birth weights than their peers whose mothers did not smoke. The Surgeon General warns against smoking during pregnancy. Substance use during pregnancy can cause a host of short term and long term developmental delays to the fetus and child. Data Source(s): PRAMS, 2001-2011 Summary: Almost one in five women reported smoking in the last trimester, and eight percent reported drinking alcohol. More than one in 10 pregnant women 25 or older reported to have consumed alcohol in their last trimester.
Figure 20. Percent of women reporting alcohol and/or cigarette use during last trimester of pregnancy: 2001-2011
Source: PRAMS, 2001-2011
• Alcohol and cigarette use during the last three months of pregnancy has remained relatively constant between 2001 and 2011. Nineteen percent of women reported smoking cigarettes during the last three months of pregnancy in 2011, and alcohol was reportedly used by eight percent of women during the same timeframe.
6% 5% 7% 7% 6% 9% 7% 7% 8% 6% 8%
17% 16% 16% 20% 18%
17% 20% 20% 21% 18% 19%
0%
10%
20%
30%
40%
50%
Alcohol Cigarettes

Hornby Zeller Associates, Inc. 37
Figure 21. Percent of women who reported drinking alcohol during last trimester of pregnancy, by age group: 2004-2011
Source: PRAMS, 2004-2011 *Due to small cell sizes, rates for pregnant women under 20 and rates for years 2004, 2010, and 2011 among 20 to 24 year olds have been suppressed.
• In 2011, drinking alcohol during the last three months of pregnancy increased among pregnant 25 to 34 year olds, from seven percent in 2010 to 11 percent in 2011. Similarly, a two point increase was observed among 35 year olds during the same period. Rates among 25 to 34 year olds have been rising overtime. From 2005 to 2009, the lowest reportable* rates were among women who were between the ages of 20 and 24, ranging between five and eight percent.
• Although not pictured, in 2011 over half of the women who reported drinking during their last trimester had a household income of $50,000 or greater. In 2011, 16 percent of women from households earning $50,000 or more had consumed alcohol during their last trimester, an increase of seven percentage points since 2010.
2004 2005 2006 2007 2008 2009 2010 201120-24 years old 5% 5% 5% 5% 8%25-34 years old 8% 5% 10% 6% 7% 9% 7% 11%35+ years old 16% 18% 16% 15% 11% 10% 9% 12%
0%
5%
10%
15%
20%
25%
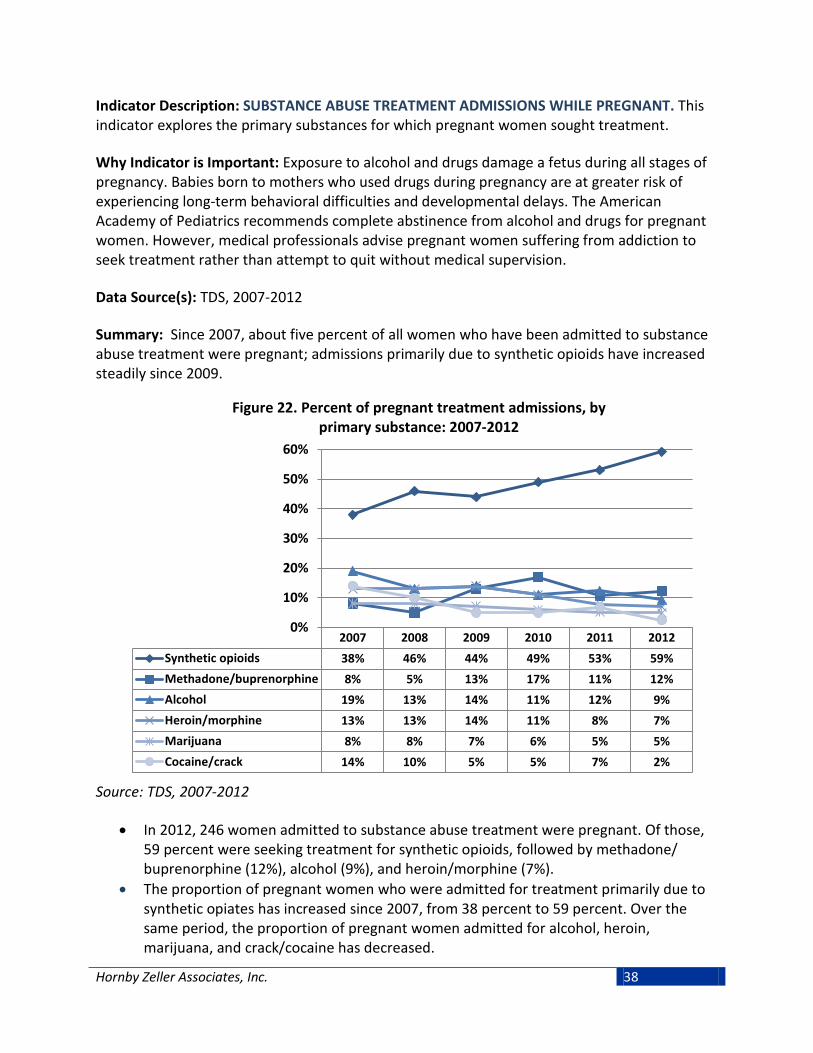
Hornby Zeller Associates, Inc. 38
Indicator Description: SUBSTANCE ABUSE TREATMENT ADMISSIONS WHILE PREGNANT. This indicator explores the primary substances for which pregnant women sought treatment. Why Indicator is Important: Exposure to alcohol and drugs damage a fetus during all stages of pregnancy. Babies born to mothers who used drugs during pregnancy are at greater risk of experiencing long-term behavioral difficulties and developmental delays. The American Academy of Pediatrics recommends complete abstinence from alcohol and drugs for pregnant women. However, medical professionals advise pregnant women suffering from addiction to seek treatment rather than attempt to quit without medical supervision. Data Source(s): TDS, 2007-2012 Summary: Since 2007, about five percent of all women who have been admitted to substance abuse treatment were pregnant; admissions primarily due to synthetic opioids have increased steadily since 2009.
Figure 22. Percent of pregnant treatment admissions, by primary substance: 2007-2012
Source: TDS, 2007-2012
• In 2012, 246 women admitted to substance abuse treatment were pregnant. Of those, 59 percent were seeking treatment for synthetic opioids, followed by methadone/ buprenorphine (12%), alcohol (9%), and heroin/morphine (7%).
• The proportion of pregnant women who were admitted for treatment primarily due to synthetic opiates has increased since 2007, from 38 percent to 59 percent. Over the same period, the proportion of pregnant women admitted for alcohol, heroin, marijuana, and crack/cocaine has decreased.
2007 2008 2009 2010 2011 2012Synthetic opioids 38% 46% 44% 49% 53% 59%Methadone/buprenorphine 8% 5% 13% 17% 11% 12%Alcohol 19% 13% 14% 11% 12% 9%Heroin/morphine 13% 13% 14% 11% 8% 7%Marijuana 8% 8% 7% 6% 5% 5%Cocaine/crack 14% 10% 5% 5% 7% 2%
0%
10%
20%
30%
40%
50%
60%

Hornby Zeller Associates, Inc. 39
Criminal Justice Involvement Indicator Description: ARRESTS RELATED TO ALCOHOL. This indicator reflects arrests related to alcohol and includes Operating Under the Influence (OUI) and liquor law violations. The data includes those who were released without having been formally charged. Why Indicator is Important: OUI and liquor law arrest rates can be an indication of the rate of criminal behavior, but it is important to note that they are also an indication of the level of law enforcement. Arrests rates are expected to increase with increased enforcement regardless of whether a decline in criminal behavior is observed. The education component of Maine’s Driver Education and Evaluation Program serviced 5,538 Maine residents who received alcohol OUIs during the 2012 state fiscal year. Data Source(s): DPS-UCR, 2005-2011 Summary: More adult arrest related to alcohol came from OUIs than from violations of liquor laws, whereas alcohol-related arrests among juveniles show the opposite pattern (that there are more arrests for liquor law violations than OUIs).
Figure 23. Adult arrests (18+ years old) related to alcohol, by arrest type: 2005-2011
Source: DPS-UCR, 2005-2011
• In 2011, there were 5,765 adult arrests for OUIs compared to 3,043 arrests for breaking liquor laws. However, OUIs have been decreasing steadily since 2007.
0
2,000
4,000
6,000
8,000
10,000
OUI Liquor law violation

Hornby Zeller Associates, Inc. 40
Figure 24. Juvenile arrests (<18 years old) related to alcohol, by arrest type: 2000-2011
Source: DPS-UCR, 2000-2011
• Alcohol related arrests among juveniles differ from adult arrests related to alcohol in that there are more arrests for liquor law violations OUIs. In 2011, there were more arrests for breaking liquor laws (893) than there were for OUIs (47). Juvenile liquor law violations have decreased steadily from 2009 (1,204) to 2011.
0
250
500
750
1,000
1,250
1,500
OUI Liquor law violation

Hornby Zeller Associates, Inc. 41
Figure 25. Arrests related to alcohol, by age group: 2011
Source: DPS-UCR, 2011
• As previously noted, it appears that the number of arrests related to OUI and liquor law violations differs among adults and juveniles. This pattern remains when comparing the number of arrests among those of legal drinking age to those who are under 21. In 2011, there were 893 liquor law violations for people under 18 and 2,399 for people between the ages of 18 to 20. This is compared to 306 liquor law violations for those between the ages of 21 and 29, and even fewer among older age groups.
• Conversely, the opposite can be seen in OUI violations: in 2011, there were 47 arrests for those under the age of 18 and 438 for 18 to 20 year olds, compared to 1,849 OUIs for those between the ages of 21 and 29. The number of OUIs appears to decrease across the lifespan.
47
438
1,849
1,220 1,203
748
307
893
2,399
306 68 143 107 20 0
500
1,000
1,500
2,000
2,500
3,000
Under 18 18 to 20 21 to 29 30 to 39 40 to 49 50 to 59 60+
OUI Liquor law violation

Hornby Zeller Associates, Inc. 42
Indicator Description: ARRESTS RELATED TO DRUGS. This indicator reflects the number of arrests that were related to drugs and includes manufacturing, sales, and possession. Why Indicator is Important: Arrest rates for drug sales, manufacturing and drug possession can be an indication of the rate of criminal behavior, but it is important to note that they are also an indication of the level of law enforcement. Arrests rates are expected to increase with increased enforcement regardless of whether a decline in criminal behavior is observed. Data Source(s): DPS-UCR, 2005-2011 Summary: Most drug-related offenses in 2011 were for possession rather than sale and manufacturing. Since 2005, it appears that adult arrests related to drugs have remained stable, while juvenile arrests have generally declined.
Figure 26. Adult and juvenile drug offenses, by type: 2011
Source: DPS-UCR, 2011
• Most drug offenses in 2011 for both juveniles and adults were for possession (436 for juveniles, 3,957 for adults) rather than sales/manufacturing (77 for juveniles and 1,158 for adults).
3,957
436
1,158
77 0
1,000
2,000
3,000
4,000
5,000
Adult Juvenile
Possession Sales/manufacturing

Hornby Zeller Associates, Inc. 43
Figure 27. Adult and juvenile drug arrests: 2005-2011
Source: DPS-UCR, 2005-2011
• In general, arrests related to drugs have remained stable between 2005 and 2011 although the number has risen slightly among adults (from 4,627 in 2005 to 5,115 in 2011), and declined slightly among juveniles (from 625 in 2005 to 513 in 2011).
4,627 5,161 5,146 5,214 5,262 5,345 5,115
0
1,000
2,000
3,000
4,000
5,000
6,000
Juvenile Adult

Hornby Zeller Associates, Inc. 44
Indicator Description: DRUG OFFENSE ARRESTS BY TYPE. This indicator reflects drug offense arrests made by the Maine’s Drug Enforcement Agency, by drug type. Why Indicator is Important: Drug arrest rates can be an indication of the rate of criminal behavior, but it is important to note that they are also an indication of the level of law enforcement. Drug arrest rates are expected to increase with increased enforcement regardless of whether a decline in criminal behavior is observed. Data Source(s): DEA-UCR, 2007-2012
Summary: Since 2009, the majority of drug offense arrests by Maine DEA involved pharmaceutical narcotics and this has been steadily increasing since 2007.
Figure 28. Drug offense arrests in Maine, by drug type: 2007-2011
Source: MDEA, 2007-2012 *Preliminary results.
• In 2012, for the fourth year in a row, pharmaceutical narcotics accounted for the largest proportion of drug offense arrests (40%). This represents an increase of 19 percentage points since 2007.
• Arrests related to crack/cocaine accounted for 16 percent of all arrests in 2012, an apparent decrease from 28 percent in the previous year. As a proportion of all arrests, those related to heroin continued to rise, to 11 percent in 2012 compared to 5 percent in 2010. A similar trend is observed for arrests related to methamphetamines.
2007 2008 2009 2010 2011 2012*Pharm-Narcotic 21% 34% 37% 38% 39% 40%Crack/Cocaine 46% 36% 27% 22% 28% 16%Marijuana 17% 17% 22% 22% 11% 17%Heroin 8% 6% 6% 5% 10% 11%Methamphetamine 3% 1% 3% 4% 4% 6%
0%
10%
20%
30%
40%
50%
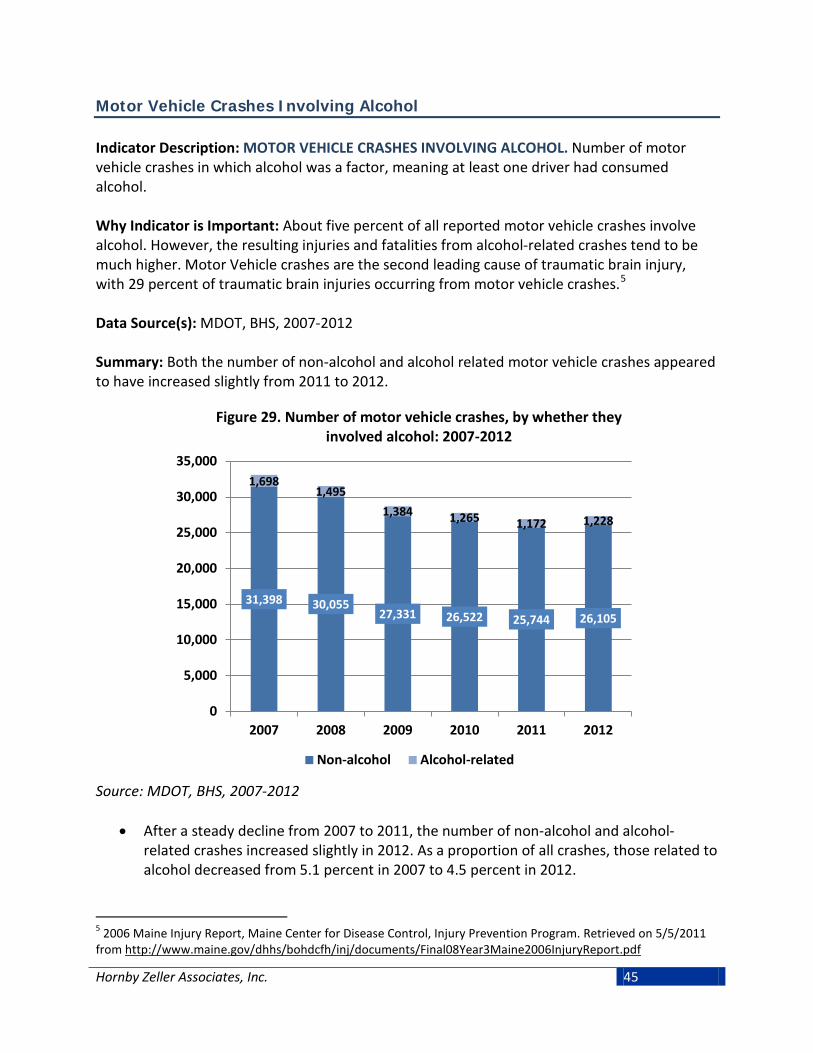
Hornby Zeller Associates, Inc. 45
Motor Vehicle Crashes Involving Alcohol Indicator Description: MOTOR VEHICLE CRASHES INVOLVING ALCOHOL. Number of motor vehicle crashes in which alcohol was a factor, meaning at least one driver had consumed alcohol. Why Indicator is Important: About five percent of all reported motor vehicle crashes involve alcohol. However, the resulting injuries and fatalities from alcohol-related crashes tend to be much higher. Motor Vehicle crashes are the second leading cause of traumatic brain injury, with 29 percent of traumatic brain injuries occurring from motor vehicle crashes.5 Data Source(s): MDOT, BHS, 2007-2012 Summary: Both the number of non-alcohol and alcohol related motor vehicle crashes appeared to have increased slightly from 2011 to 2012.
Figure 29. Number of motor vehicle crashes, by whether they involved alcohol: 2007-2012
Source: MDOT, BHS, 2007-2012
• After a steady decline from 2007 to 2011, the number of non-alcohol and alcohol-related crashes increased slightly in 2012. As a proportion of all crashes, those related to alcohol decreased from 5.1 percent in 2007 to 4.5 percent in 2012.
5 2006 Maine Injury Report, Maine Center for Disease Control, Injury Prevention Program. Retrieved on 5/5/2011 from http://www.maine.gov/dhhs/bohdcfh/inj/documents/Final08Year3Maine2006InjuryReport.pdf
31,398 30,055 27,331 26,522 25,744 26,105
1,698 1,495
1,384 1,265 1,172 1,228
0
5,000
10,000
15,000
20,000
25,000
30,000
35,000
2007 2008 2009 2010 2011 2012
Non-alcohol Alcohol-related

Hornby Zeller Associates, Inc. 46
Indicator Description: NUMBER OF FATAL MOTOR VEHICLE CRASHES INVOLVING ALCOHOL. This indicator presents the number fatal motor vehicle crashes where alcohol was a factor in the crash. This means that at least one driver had consumed alcohol. It is important to note that small fluctuations from year to year do not indicate overall trends. Why Indicator is Important: Alcohol-related crash fatalities are a major consequence of alcohol consumption. Although alcohol was involved in only five percent of all crashes, more than one-third all of all fatal motor vehicle crashes in 2009 involved alcohol. Data Source(s): MDOT, BHS, 2005-2012 Summary: In 2012, more than one in three (34%) of fatal motor vehicle crashes involved alcohol.
Figure 30. Number of fatal motor vehicle crashes, by whether they involved alcohol: 2005-2012
Source: BHS/MDOT, 2005-2012
• Although alcohol was involved in five percent of total motor vehicle crashes, it was involved in 34 percent of fatal crashes in 2012 (52 out of 151 total fatal crashes). This proportion increased by six percentage points between 2010 and 2012 (from 28%).
55 64 69 46 50 40 38
52
114 124 114
109 109 104
87
99
0
50
100
150
200
2005 2006 2007 2008 2009 2010 2011 2012
Alcohol No alcohol

Hornby Zeller Associates, Inc. 47
Indicator Description: ALCOHOL-RELATED MOTOR VEHICLE CRASH RATE. This indicator presents the number of motor vehicle crashes involving alcohol (drivers with a blood alcohol content of .08 or greater), relative to the licensed population. The rate per 100,000 allows us to see frequency with which an occurrence shows up within a population over time. In this case, the population is the number of licensees in Maine. Where applicable, the number of licensees used to calculate the rate reflects the relevant age group or gender. Why Indicator is Important: More than one-third of all motor vehicle crashes resulting in fatalities involve alcohol. Data Source(s): BHS/MDOT, 2008-2012 Summary: In 2012, drivers between the ages of 21 and 24 had the highest alcohol-related crash rates, followed closely by drivers between the ages of 25 and 34.
Figure 31. Alcohol-related motor vehicle crash rate per 100,000 licensees, by age group: 2008-2012
Source: BHS/MDOT, 2008-2012
• Following a substantial decrease in alcohol-related crash rate among young adults between the ages of 21 and 24 in 2011, the proportion rose to 376 per 100,000 licensees in 2012.
• Conversely, in 2012 the rate of alcohol-related crashes decreased among 16 to 20 year olds from 209 per 100,000 licensees in 2011 to 177 per 100,000 licensees in 2012.
• Among older age groups, the rates progressively decrease with age and have remained steady for the past several years.
16-20year olds
21-24year olds
25-34year olds
35-44year olds
45-54year olds
55+ yearolds
2008 306 482 252 168 106 342009 377 319 250 152 106 332010 218 433 238 145 95 312011 209 292 219 123 89 342012 177 376 222 127 94 37
0.0
100.0
200.0
300.0
400.0
500.0

Hornby Zeller Associates, Inc. 48
Indicator Description: ALCOHOL-RELATED MOTOR VEHICLE CRASH FATALITY RATE. This indicator presents the number of fatalities resulting from motor vehicle crash fatalities that involved alcohol (drivers with a blood alcohol content of .08 or greater), relative to the licensed population. The rate per 100,000 allows us to see frequency with which an occurrence shows up within a population over time. In this case, the population is the number of licensees in Maine. Where applicable, the number of licensees used to calculate the rate reflects the relevant age group or gender. Why Indicator is Important: More than one-third of all motor vehicle crashes resulting in fatalities involve alcohol. Data Source(s): MDOT/BHS, 2008-2012 Summary: In 2012, the rates of alcohol related motor vehicle crash fatalities were highest among 16 to 20 year olds, followed by 21 to 24 year olds.
Figure 32. Alcohol-related motor vehicle crash fatality rate per 100,000 licensees, by age: 2008-2012
Source: MDOT, 2008-2012
• The rate of fatalities from alcohol-related motor vehicle crashes among 16 to 20 year olds increased from seven crashes per 100,000 licensees in 2011 to 19 crashes per 100,000 licensees in 2012. The rate among 21 to 24 year olds jumped from 11 per 100,000 in 2011 to 16 per 100,000 in 2012). Rates among 25 to 34 year olds have been decreasing since 2010.
16 to 20 21to 24 25 to 34 35 to 44 45 to 54 55+2008 7 8 4 4 2 22009 5 8 7 4 5 12010 9 16 8 1 3 12011 7 11 7 3 4 12012 19 16 5 5 6 1
0
10
20
30
40
50

Hornby Zeller Associates, Inc. 49
• Although not pictured, the highest rate of alcohol-related motor vehicle crash fatalities tends to be among males, particularly those between the ages of 16 to 34, although the rates appear to be decreasing.

Hornby Zeller Associates, Inc. 50
Hospital Visits Related to Substance Abuse Indicator Description: INPATIENT ADMISSIONS RELATED TO SUBSTANCE USE. Number of inpatient hospital admissions where alcohol, opiates, or other drugs was recorded as the primary diagnosis for which services were sought at admission. “Inpatient” refers to a patient whose treatment needs at least one night's residence in a hospital. The substance for which treatment was received was identified through hospital codes (ICD-9 codes) and includes those related to alcohol and psychoactive substances (303-305). Why Indicator is Important: Hospital admissions related to substance use are an indication of injury sustained through substance use and the impact it has on the healthcare system. Data Source(s): MHDO, 2006-2009 Summary: In 2009, inpatient admissions related to substance use decreased for alcohol and opiates after rising sharply in 2008.
Figure 33. Inpatient hospital admissions related to substance use: 2006-2009
Source: MHDO, 2006-2009 *Includes prescription narcotics, methadone, and heroin.
• Among inpatient admissions for substance use, alcohol the substance most often associated with inpatient visits in 2009 (686), followed by opiates (216).Inpatient admissions related to substance use decreased in 2009 after rising sharply in 2008.
638 540
793
686
312 246
367
216
136 112 146
88
0
200
400
600
800
1,000
2006 2007 2008 2009
Alcohol Opiates* Other drugs

Hornby Zeller Associates, Inc. 51
Indicator Description: OUTPATIENT HOSPITAL VISITS RELATED TO SUBSTANCE USE. Number of outpatient hospital admissions where alcohol, opiates, or other drugs was recorded as the primary diagnosis for which services were received. “Outpatient” refers to patients who receive treatment at a hospital or clinic but are not admitted overnight. The substance for which treatment was received was identified through hospital codes (ICD-9 codes) and includes those related to alcohol psychoactive substances (303-305). Why Indicator is Important: Outpatient hospital visits related to substance use are an indication of injury sustained through substance use and the impact it has on the healthcare system. Data Source(s): MHDO, 2006-2009 Summary: Outpatient hospital visits related to opiate abuse have been steadily increasing since 2006. Opiates were the substance of concern more than twice as often as alcohol in 2009.
Figure 34. Outpatient hospital visits related to substance use: 2006-2009
Source: MHDO, 2006-2009 *Includes prescription narcotics, methadone, and heroin.
• Hospital outpatient visits related to substance abuse continued to increase sharply in 2009, driven primarily by visits related to opiates (including prescription narcotics, methadone, and heroin) which increased from 30,451 visits in 2008 to 35,950 in 2009.
• Outpatient visits related to alcohol have remained steady, decreasing only slightly between 2008 and 2009 (from 16,319 to 15,770). Outpatient visits related to other drugs have been low in comparison and also remained steady in 2009.
15,718 15,033 16,319 15,770 19,739
23,742
30,451
35,950
6,755 8,021 6,946 7,046
0
10,000
20,000
30,000
40,000
50,000
2006 2007 2008 2009
Alcohol Opiates* Other drugs

Hornby Zeller Associates, Inc. 52
Poisonings Related to Substance Use Indicator Description: POISONING CASES DOCUMENTED BY THE POISON CENTER. This measure reflects the number of calls to the Northern New England Poison Center in which the Center determined that a poisoning occurred. These calls are for the state of Maine only. The Center reports poisonings in three categories: unintentional, meaning those that are accidental; suspected substance abuse cases, meaning cases where the Center believes the intent is for an individual to get high; and suspected suicides, meaning staff at the Center determine that the individual attempted suicide. The categories reflect the caller’s self-report and are not considered clinical or medical diagnoses. Why Indicator is Important: The exposure to and ingestion of damaging substances can have many physiologic side effects. Poisonings can be influenced by programs to prevent substance abuse, accidental poisoning, suicide and fatal interaction among medications. Data Source(s): NNEPC, 2009-2012 Summary: Both the number and proportion of total poisonings reported to NNEPC related to substance abuse have increased since 2009.
Figure 35. Poisonings reported to Northern New England Poison Center, by intent: 2009-2012
Source: NNEPC, 2009-2012
• The majority of calls to the Northern New England Poison Center between 2009 and 2012 in which a poisoning occurred were related to unintentional poisonings. It appears that poisonings related to substance abuse have been increasing over this period. About four percent (589) of all poisoning calls received in 2012 were substance abuse cases, up from two percent (388) in 2009.
11,462 11,071 10,700 9,752
1,571 1,477 1,601 1,634
388 406 557 589
0
2,500
5,000
7,500
10,000
12,500
15,000
2009 2010 2011 2012
Unintentional Suspected suicide Substance abuse

Hornby Zeller Associates, Inc. 53
Indicator Description: INPATIENT ADMISSIONS RELATED TO SUBSTANCE POISONING. Number of inpatient hospital admissions in which the recorded reason for admission included poisoning by alcohol and drugs. “Inpatient” refers to a patient whose treatment needs at least one night's residence in a hospital. The substance for which treatment was received was identified through hospital codes (ICD-9 codes) and includes those related to poisoning by drugs, medicinal and biological substances (960-979) and toxic effects of alcohol (980). Why Indicator is Important: Hospital admissions related to substance poisoning are an indication of injury sustained through substance use and the impact it has on the healthcare system. Data Source(s): MHDO, 2006-2009 Summary: In 2009, psychotropic medications continued to be the substance of concern most often cited among inpatient admissions for substance poisoning, followed by opiates.
Figure 36. Inpatient hospital admissions related to poisoning from alcohol and drugs: 2006-2009
Source: MHDO, 2006-2009 *Includes prescription narcotics, methadone, and heroin. **Includes legal pharmaceuticals not included elsewhere.
• Since 2006, psychotropic medications have been the most often cited substance of concern in inpatient substance poisonings; the number increased in 2009 to 491. This was followed by poisoning by other legal pharmaceuticals (385) and opiates (174).
Alcohol Opiates* Sedatives Psycho-tropics
Depress-ants Stimulants
OtherPharma-cueticals
2006 38 146 43 470 11 40 3212007 20 168 38 469 16 28 3712008 38 188 59 421 6 26 3592009 36 174 47 491 11 24 385
0
200
400
600
800
1,000

Hornby Zeller Associates, Inc. 54
Indicator Description: OUTPATIENT VISITS RELATED TO SUBSTANCE POISONING. Number of outpatient hospital visits in which the recorded reason for the visit included poisoning by alcohol and other drugs. “Outpatient” refers to patients who receive treatment at a hospital or clinic but are not admitted overnight. The substance for which treatment was received was identified through hospital codes (ICD-9 codes) and includes those related to poisoning by drugs, medicinal and biological substances (960-979) and toxic effects of alcohol (980). Why Indicator is Important: Hospital visits related to substance poisoning are an indication of injury sustained through substance use and the impact it has on the healthcare system. Data Source(s): MHDO, 2006-2009 Summary: Outpatient hospital visits for substance-related poisonings have increased.
Figure 37. Outpatient hospital visits for substance-related poisonings: 2006-2009
Source: MHDO, 2006-2009 *Includes prescription narcotics, methadone, and heroin. **Includes legal pharmaceuticals not included elsewhere.
• In 2009, most outpatient hospital visits related to substance poisoning were associated with depressants (752) followed by opiates (225). Overall, outpatient hospital visits related to substance poisoning have been steadily increasing.
Alcohol Opiates* Sedatives Psycho-tropics
Depress-ants Stimulants
OtherPharma-cueticals
2006 41 154 58 12 655 43 8792007 55 161 73 20 688 36 9252008 51 217 91 29 725 37 9642009 45 225 116 19 752 49 1,005
0
200
400
600
800
1,000

Hornby Zeller Associates, Inc. 55
Overdoses and Related Deaths Indicator Description: OVERDOSES. This indicator shows the number of persons receiving help from Emergency Medical Services (EMS) related to an overdose in 2011 and 2012. Why Indicator is Important: Overdosing on a substance can cause serious physical harm resulting in hospitalization and even death. Responding to overdoses also uses valuable EMS resources. Data Source(s): Emergency Medical Services, 2011-2012 Summary: Alcohol and drugs or medications account for most overdoses to which Emergency Medical Services responded in 2012 and appear to be increasing. Alcohol-related overdoses are more prevalent among older populations, while drug/medication overdoses are more common among younger populations.
Figure 38. Number of overdoses, by type: 2011 and 2012
Source: Emergency Medical Services, 2011 and 2012
• In 2012, Emergency Medical Services helped 5,206 individuals experiencing an overdose. Individuals were primarily helped in relation to alcohol (2,118) and drugs or medication (1,953). These numbers have increased dramatically since 2011.
1,364 1,331
27
929
1,953 2,118
51
1,084
0
500
1,000
1,500
2,000
2,500
Drug/ Medication
Alcohol Inhalant Other
2011 2012

Hornby Zeller Associates, Inc. 56
Figure 39. Proportion of overdose responses, by age and type: 2011
Source: Emergency Medical Services, 2012
• Overdoses related to drugs or medication were most likely among individuals between the ages of 26 and 45 (48%) followed by those under the age of 18 (44%). Alcohol-related overdoses were highest among 19 to 25 years old (49%), as well as among those over the age of 46 (42% and 46%).
44%
36%
48%
42%
31% 31%
39%
49%
32% 34%
42% 46%
0%
10%
20%
30%
40%
50%
< 18 19 - 25 26 - 35 36 - 45 46 - 55 56 +
Drug/Medication Alcohol

Hornby Zeller Associates, Inc. 57
Indicator Description: DEATHS DUE TO OVERDOSE. This measure reflects the number of deaths where the cause of death was directly related to the consumption of one or more substances. This excludes deaths where a substance may have been ingested prior to engaging in a behavior that resulted in death (e.g., drunk driving) or where lifetime substance use and abuse may have impacted health (e.g., cirrhosis). Pharmaceuticals are drugs used in medical treatment; illicit drugs are those illegally produced and sold outside of medical channels. Why Indicator is Important: One of the most extreme consequences of alcohol and drug abuse is overdose death, where the substance(s) played a direct role in an individual’s death. These are seen as potentially preventable deaths. Data Source(s): Office of Chief Medical Examiner, 2000-20126 Summary: There were an estimated 154 overdose deaths in Maine in 2012. The proportion of overdose deaths associated with pharmaceuticals may be leveling off after steadily rising over the past decade.
Figure 40. Number of deaths caused by pharmaceuticals and/or illicit drugs*: 2000-2012
Source: Office of the Chief Medical Examiner, 2000-2012 *Deaths involving pharmaceuticals and illicit drugs are not mutually exclusive.
• In 2012, overdose deaths continued to decline slightly to 154 total deaths after peaking at 179 in 2009. Of note, those involving pharmaceuticals have risen dramatically over the same period but appear to be leveling off in the past two years.
6 Sorg, Marcella H. Margaret Chase Smith Policy Center, University of Maine.
2000 2001 2002 2003 2004 2005 2006 2007 2008 2009 2010 2011 2012Est.
All 60 90 165 153 162 176 167 154 164 179 167 155 154Pharmaceutical 51 74 149 129 141 139 134 136 155 164 160 140 144Illicit 15 31 35 47 50 61 59 49 30 22 17 17 26
0
50
100
150
200
250

Hornby Zeller Associates, Inc. 58
Indicator Description: DRUG OVERDOSE DEATHS ASSOCIATED WITH SPECIFIC DRUG TYPES. When a death is investigated, the Medical Examiner determines what substances contributed to the individual’s death. This measure examines the percent of drug deaths associated with certain types of substances. Note that more than one substance can be determined as contributing to death. Data from 2012 are “estimated” because in some cases the cause of death has not been finalized. Why Indicator is Important: In addition to the fact that some substances are used in greater numbers than others, some substances are more lethal than others. Data Source(s): Office of Chief Medical Examiner, 2000-20127 Summary: In 2012, overdose deaths were most likely to involve oxycodone, benzodiazepines and methadone. While overdose deaths involving methadone have been decreasing, those related to heroin may be on the rise.
Figure 41. Percent of drug deaths involving specific drug types*: 2000-2012
Source: Office of the Chief Medical Examiner, 2001-2012 *Some deaths may be caused by more than one key drug. **Deaths caused by known pharmaceutical morphine removed from total.
• In 2012, most drug overdose deaths involved oxycodone (29%), benzodiazepines (24%) and methadone (20%); those involving methadone appear to be declining over time. Conversely, as a proportion of all overdose deaths, those involving heroin increased sharply in 2012 to 14 percent (up from 4% in the two previous years).
7 Sorg, Marcella H. Margaret Chase Smith Policy Center, University of Maine.
2002 2003 2004 2005 2006 2007 2008 2009 2010 2011 2012Est.
Methadone 40% 35% 46% 40% 41% 38% 34% 26% 30% 27% 20%Oxycodone 17% 19% 9% 10% 14% 25% 16% 28% 29% 23% 29%Heroin/Morphine** 18% 24% 15% 24% 19% 16% 12% 7% 4% 4% 14%Cocaine 4% 10% 17% 13% 19% 19% 7% 5% 6% 8% 8%Benzodiazepines 19% 18% 22% 20% 22% 23% 24% 31% 34% 26% 24%
0%
10%
20%
30%
40%
50%

Hornby Zeller Associates, Inc. 59
Indicator Description: RATE OF DEATHS DUE TO SUBSTANCE ABUSE. This measure estimates the rate of deaths due to substance abuse or overdose per 100,000 people. The rate per 100,000 allows us to see the frequency with which an occurrence shows up within a population over time. Why Indicator is Important: Drug-induced deaths are influenced by programs to prevent: substance abuse, accidental poisoning, suicide and fatal interaction among medications. Data Source(s): ODRVS, 2005-2010 Summary: Adults between the ages of 35 to 54 had the highest rate of death due to substance abuse or overdose during 2009, followed by those between the ages of 21 and 29.
Figure 42. Substance abuse and overdose deaths, per 100,000, by age group: 2005-2009
Source: ODRVS, 2005-2010
• At 24.9 deaths per 100,000, people between the ages of 35 to 54 had the highest rate of death due to substance abuse or overdose during 2009. The second highest rate was among people between the ages of 21 to 29 years old at 19.8 per 100,000.
• Since 2005, the highest rates of substance abuse and overdose deaths per 100,000 have been among adults between the ages of 21 and 54.
• Notably, the substance abuse and overdose death rate among 30 to 34 year olds declined sharply in 2009 to 12.4 per 100,000. Also noteworthy is that the overdose death rate has doubled among the 65+ year old population since 2005.
2005 2006 2007 2008 200912-20 years old 4.9 3.2 3.2 2.6 3.921-29 years old 19.4 24.1 29.0 14.4 19.830-34 years old 29.6 14.6 28.6 26.5 12.435-54 years old 19.8 21.7 16.4 24.6 24.955-64 years old 11.1 9.6 9.2 5.6 10.465+ years old 2.6 2.1 4.6 3.0 5.8
0.0
10.0
20.0
30.0
40.0
50.0
Rate
per
100
,000

Hornby Zeller Associates, Inc. 60
Morbidity and Mortality Indicator Description: RATES OF DEATH FROM CHRONIC CONDITIONS ASSOCIATED WITH SUBSTANCE USE. Every death in Maine has a recorded cause. This indicator examines the rate of chronic diseases commonly associated with substance use, including ischemic cerebrovascular diseases (commonly known as stroke), cardiovascular diseases, and alcohol-related liver diseases. In this case, a rate per 100,000 of the state population is used to compare the prevalence across certain populations. Why Indicator is Important: Prolonged and lifelong use of substances, including tobacco and alcohol, can often result in chronic health problems later in life. As a consequence of substance abuse, these health-related deaths are considered potentially preventable. Data Source(s): ODRVS, 2005-2010 Summary: Ischemic cerebrovascular diseases were more prevalent among Mainers in 2010 than cardiovascular diseases and alcoholic cirrhosis. Cirrhosis and liver disease related to alcohol were more likely among men than women.
Figure 43. Deaths from chronic diseases related to substance use, per 100,000 of the population: 2005-2010
Source: ODRVS, 2005-2010
• At 152.9 deaths per 100,000, ischemic cerebrovascular diseases were more prevalent among Mainers in 2010 than cardiovascular diseases (70.7) and alcoholic cirrhosis (6.2).
• Although not pictured, deaths from cerebrovascular and cardiovascular diseases afflict the older population (those 60 and older) at higher rates, whereas alcoholic cirrhosis/liver disease has a high rate of incidence among adults over the age of 40.
311.6 291.9 290.4
187.2 172.6 152.9
74.8 76.0 82.0 74.5 77.2 70.7
4.8 5.1 5.6 4.5 5.8 6.2 0
100
200
300
400
500
Rate
per
100
,000
Ischemic cerebrovascular Cardiovascular Alcoholic cirrhosis/liver

Hornby Zeller Associates, Inc. 61
Figure 44. Deaths from alcoholic cirrhosis and liver disease per 100,000 of the population, by gender: 2005-2010
Source: ODRVS, 2005-2010
• In 2010, cirrhosis and liver disease related to alcohol were more likely among men (7.8
per 100,000) than women (4.6 per 100,000). This pattern has been consistent since 2005 although there appears to be some fluctuation among women.
2.1 2.4
4.0
2.1 2.4
4.6
7.6 8.0
7.3 7.6 8.0 7.8
0.0
2.0
4.0
6.0
8.0
10.0
Rate
per
100
,000
Female Male

Hornby Zeller Associates, Inc. 62
Indicator Description: RATE OF VIOLENT DEATHS. Every death in Maine has a recorded cause. This indicator examines deaths that were the result of violence, i.e., those classified as a suicide or homicide. In this case, a rate per 100,000 of the state population is used to compare the prevalence across certain populations. Why Indicator is Important: Although not the leading cause of death, substance use and abuse is often a factor in homicides and suicides. For example, the federal Substance Abuse and Mental Health Services Administration (SAMHSA) has estimated that about 47 percent of homicides and 23 percent of suicides are attributable to alcohol nationally. Data Source(s): ODRVS, 2005-2010 Summary: The overall rates of violence deaths involving suicide or homicide have remained fairly stable from 2005 to 2010. Suicides appear to be much more prevalent than homicides. Suicides are more likely among men and people between the ages of 40 and 59.
Figure 45. Deaths from suicide or homicide per 100,000 of the population: 2005-2010
Source: ODRVS, 2005-2010
• The rate of suicide deaths in Maine decreased from 14.9 per 100,000 in 2009 to 13.5 per 100,000 in 2010. The overall rate of homicide deaths in Maine has remained steady, increasing slightly from 1.6 per 100,000 in 2005 to 1.8 per 100,000 in 2010.
13.2 11.9
14.4 13.7 14.9
13.5
1.6 1.5 2.0 2.5 2.0 1.8
0
5
10
15
20
25
2005 2006 2007 2008 2009 2010
Rate
per
100
,000
Suicides Homicides

Hornby Zeller Associates, Inc. 63
Figure 46. Deaths from suicide or homicide per 100,000 of the population, by age groups: 2010
Source: ODRVS, 2010
• In 2010, deaths from suicide as well as deaths from homicide were most prevalent among the 40 to 59 year old population at a rate of 19.6 per 100,000 for suicides and 2.9 per 100,000 for homicides.
3.2
14.8
19.6
14.0
1.0 2.6 2.9
0.3 0.0
5.0
10.0
15.0
20.0
25.0
0 to 19 20 to39
40 to59
60+ 0 to 19 20 to39
40 to59
60+
Suicides Homicides
Rate
per
100
,000

Hornby Zeller Associates, Inc. 64
Figure 47. Deaths from suicide or homicide per 100,000 of the population, by gender: 2010
Source: ODRVS, 2010
• Suicide deaths were much more common among men in 2010 (22.5 per 100,000),
compared to women (4.7 per 100,000). • Although the homicide rate is much lower, the rate for men was double the homicide
rate for women in 2010 at 2.5 per 100,000 and 1.2 per 100,000 respectively. Although not shown here, these rates have been relatively consistent between 2005 and 2010.
4.7
22.5
1.2 2.5
0
5
10
15
20
25
Female Male Female Male
Suicides Homicides
Rate
per
100
,000

Hornby Zeller Associates, Inc. 65
Factors Contributing to Substance Use and Abuse
A body of substance abuse prevention research has identified certain groups of factors that “cause” or have an impact on substance use and the consequences related to use. That is, they appear to influence the occurrence and magnitude of substance use and its related consequences. Generically, these causal factors (also known as contributing factors) are categorized into groups which include:
• Social Access (e.g., getting drugs and alcohol from friends or family) • Retail Availability (e.g., retailer not carding properly) • Pricing & Promotion (e.g., two-for-one specials, industry sponsorships or signage) • Social/Community Norms (e.g., parental/community attitudes and beliefs) • Enforcement (e.g., lack of compliance checks) • Perceptions of Harm (e.g., individuals’ belief that using a substance is harmful) • Perceived Risk of Being Caught (e.g., individuals’ belief that s/he will be caught by
parents or police)8, 9 Substance abuse prevention in Maine is undertaken with the assumption that making changes to these factors at the community level will result in changing behaviors around substance use and related problems. It is through positively impacting these factors that Maine can achieve population-level changes in substance consumption and consequences. Although most high school students seem to perceive that regular use of substances pose a risk of harm and that their parents and community think it is wrong, few think they will be caught by the police and most think it is easy to obtain alcohol and marijuana. Among adults, young adults are least likely to perceive risks of harm from using alcohol and marijuana regularly.
8A General Causal Model to Guide Alcohol, Tobacco and Illicit Drug Prevention: Assessing the Research Evidence. Multi-State Technical Assistance Workshop. Washington, DC. March 16, 2006. 9 Bonnie, Richard J., and Mary Ellen O’Connell, eds. (2004). Reducing Underage Drinking: A Collective Responsibility. (2004). The National Academies Press: Washington, DC.

Hornby Zeller Associates, Inc. 66
Availability and Accessibility Indicator Description: EASE OF OBTAINING ALCOHOL BY UNDERAGE YOUTH. This indicator reflects the percentage of high school students (grades 9 to 12) who reported that it would be easy or very easy for them to get alcohol if they wanted some. Why Indicator is Important: In 2011, students who reported that they thought alcohol was easy to obtain were three times as likely to report consuming alcohol within the past month compared to students who did not think it was easy obtain. Data Source(s): MIYHS, 2009-2011 Summary: Overall, about two out of three high school students think it would be easy to obtain alcohol.
Figure 48. Percent of high school students who reported it would be easy to get alcohol: 2009 and 2011
Source: MIYHS, 2009-2011
• In 2011, two out of three high school students (or 67%) reported it would be easy to get alcohol, compared to 69 percent in 2009.
69% 67%
0%
20%
40%
60%
80%
100%
2009 2011

Hornby Zeller Associates, Inc. 67
Indicator Description: UNDERAGE YOUTH RECEIVING ALCOHOL FROM OTHERS. Among high school students who drank within the past 30 days, this measure reflects the percentage reporting that they usually obtain the alcohol they drink from someone giving it to them. Why Indicator is Important: Easy social access to alcohol is a major contributing factor to underage drinking. Students who report that alcohol is easy to get are three times as likely to drink as their peers who report it is not easy. Data Source(s): MIYHS 2009-2011 Summary: Social access appears to be a primary way that underage youth obtain alcohol.
Figure 49. Percent of high school students who obtained alcohol by someone giving it to them, among those who
drank in past month: 2009 and 2011
Source: MIYHS 2009-2011
• In 2011, one in three high school students who consumed alcohol in the past month reported that someone gave them the alcohol they consumed. This has decreased slightly from 35 percent in 2009.
35% 33%
0%
20%
40%
60%
80%
100%
2009 2011

Hornby Zeller Associates, Inc. 68
Indicator Description: EASE OF OBTAINING MARIJUANA BY YOUTH. The percentage of high school students reporting it would be easy or very easy to obtain marijuana if they wanted it. Why Indicator is Important: In 2011, students who reported that they thought marijuana was easy to obtain were seven times as likely to use marijuana in the past 30 days compared to their peers who thought it was difficult to obtain. Data Source(s): MIYHS, 2009-2011 Summary: In 2011 over half of high school students believe that marijuana is easy to obtain. This has decreased slightly from 2009.
Figure 50. Percent of high school students who reported it would be easy to get marijuana: 2009 and 2011
Source: MIYHS, 2009-2011
• In 2011, well over half (57%) of high school students felt it would be easy to get
marijuana.
58% 57%
0%
20%
40%
60%
80%
100%
2009 2011
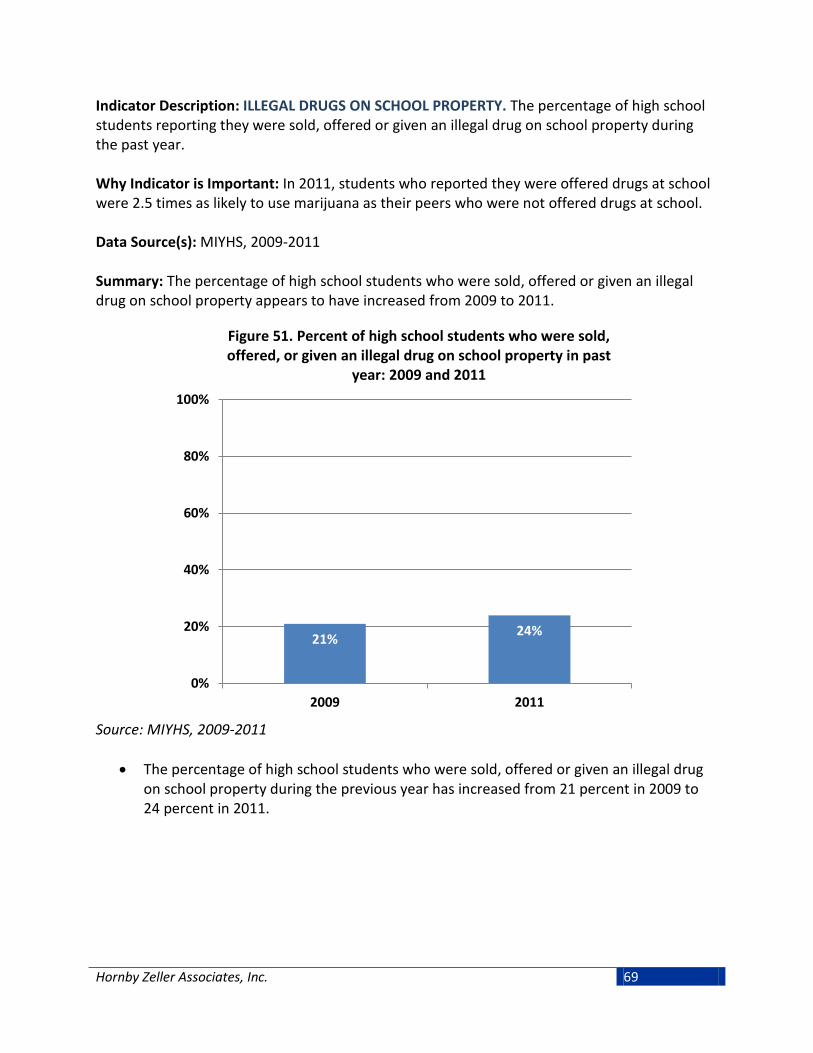
Hornby Zeller Associates, Inc. 69
Indicator Description: ILLEGAL DRUGS ON SCHOOL PROPERTY. The percentage of high school students reporting they were sold, offered or given an illegal drug on school property during the past year. Why Indicator is Important: In 2011, students who reported they were offered drugs at school were 2.5 times as likely to use marijuana as their peers who were not offered drugs at school. Data Source(s): MIYHS, 2009-2011 Summary: The percentage of high school students who were sold, offered or given an illegal drug on school property appears to have increased from 2009 to 2011.
Figure 51. Percent of high school students who were sold, offered, or given an illegal drug on school property in past
year: 2009 and 2011
Source: MIYHS, 2009-2011
• The percentage of high school students who were sold, offered or given an illegal drug on school property during the previous year has increased from 21 percent in 2009 to 24 percent in 2011.
21% 24%
0%
20%
40%
60%
80%
100%
2009 2011

Hornby Zeller Associates, Inc. 70
Indicator Description: NUMBER OF SCHEDULE II PRESCRIPTIONS AND PILLS PER CAPITA. These indicators reflect the number of narcotic, tranquilizer, and stimulant prescriptions filled as well as the pill counts per capita for each drug type. This includes only prescription drugs that are classified “Schedule II” drugs, meaning those with a high potential for abuse. It is important to note that the number of prescriptions and pill counts per capita do not indicate the size/dosage of the pills. All pharmacies in Maine report to the Prescription Monitoring Program. Why Indicator is Important: The number of prescriptions filled and pill counts per capita indicate the volume of prescription drugs potentially available in the community for diversion (e.g., gift, sale, or theft). A higher level of availability contributes to misuse by individuals without a prescription. Data Source(s): PMP, 2006-2012 Summary: Overall, the number of prescriptions filled involving narcotics, tranquilizers, and stimulants has decreased from 2011 to 2012. Narcotics accounted for most prescriptions filled as well as pills per capita in Maine for the past several years.
Figure 52. Number of prescriptions filled in Maine (thousands), by type: 2006-2012
Source: PMP, 2006-2012
• The number of prescriptions filled including narcotics, tranquilizers, and stimulants has decreased from 2,259,339 in 2010 to 1,797,814 in 2012. Narcotics accounted for most prescriptions filled in Maine between the years of 2006 to 2012. This was followed by tranquilizers and, at a much lower number, stimulants.
0
250
500
750
1,000
1,250
1,500
Narcotics Tranquilizers Stimulants

Hornby Zeller Associates, Inc. 71
Figure 53. Number of pills per capita in Maine, by type: 2008-2012
Source: PMP, 2008-2012
• The number of pills per capita for narcotics has decreased from 70 per person in 2008 to 61 per person in 2012. Narcotics have accounted for the most pills per capita filled in Maine between the years of 2008 to 2012. Pill counts per capita for tranquilizers have been relatively stable over this same period (about 30 pills per person), while stimulants have gradually risen over time (from nine pills per person in 2008 to 13 pills per person in 2012).
70 65 64 63 61
27 29 29 30 30
9 10 10 11 13
0.0
20.0
40.0
60.0
80.0
100.0
2008 2009 2010 2011 2012
Pills
per
cap
ita
Narcotics Tranquilizers Stimulants

Hornby Zeller Associates, Inc. 72
Indicator Description: SUBSTANCES REQUESTED FOR VERIFICATION. This indicator shows the number of requests by non-law enforcement for medication verification through the Northern New England Poison Center. A person may call the NNEPC for many reasons, one being to help identify a medication or substance which another person has consumed or that has been found. The calls reflected in this indicator have been characterized by NNEPC as likely related to substance abuse, although NNEPC staffs do not make a formal or clinical assessment. Why Indicator is Important: The increased volume of medication verification calls suggests a greater availability of those drugs in the community. This measure also suggests that there is a higher awareness among the community and parents for potential misuse of prescription pills which is prompting calls. Data Source(s): NNEPC, 2006-2012 Summary: Most calls to NNEPC requesting substance verification involved opioids, followed by benzodiazepines. The overall number of requests has decreased since 2010.
Figure 54. Substances most frequently requested for medication verification by non-law enforcement, by type: 2006-2012
Source: NNEPC, 2006-2012
• In 2012, the Northern New England Poison Center received 9,108 calls requesting
verification for substances that were identified as opioids. This is nearly twice the number of verification calls related to benzodiazepines, which was the second most requested drug type at 5,320. The volume of calls for both these substances has decreased since 2010.
• Although not pictured, in 2010 there were two calls in 2010 involving confirmed or suspected contact with bath salts. This increased to 266 calls in 2011, and then decreased to 66 calls in 2012.
2006 2007 2008 2009 2010 2011 2012Opioids 10,171 14,208 16,306 19,249 19,695 13,687 9,108Benzodiazepines 3,539 4,525 5,554 7,686 8,654 7,037 5,320Non-opioid analgesics 2,021 2,404 2,576 2,866 2,838 2,146 1,905Antidepressants 1,871 2,163 2,334 2,427 2,567 2,001 1,672Stimulants/street drugs 1,078 1,443 1,930 2,811 3,054 2,968 2,207
0
5,000
10,000
15,000
20,000
25,000

Hornby Zeller Associates, Inc. 73
Indicator Description: ANNUAL GALLONS OF ETHANOL SOLD PER CAPITA. This indicator captures the total sales of ethanol in beer, wine, and spirits per year, estimated in gallons of ethanol, per capita. Measuring ethanol takes into account the range of alcohol content per volume. Why Indicator is Important: A higher quantity of alcohol and alcoholic beverages available in the community presents greater opportunity for use, abuse, and dependence. Per capita consumption of absolute alcohol has been used historically as an indicator of overall drinking within a state and has been shown to be correlated with many types of alcohol problems. Data Source(s): AEDS, 1998-2010 Summary: Most alcohol in Maine is sold as beer, followed by spirits and then wine. This has not changed since 1990.
Figure 55. Gallons of ethanol sold per capita, by type: 1998-2010
Source: AEDS, 1998-2010
• Since 1998, gallons of beer purchased per capita have increased somewhat, from 1.14 in
1998 to 1.23 in 2010. Gallons of spirits and wine purchased per capita have also increased slightly over the same timeframe. Spirits increased from 0.68 to 0.84, while gallons of wine purchased per capita increased from .34 to .42.
0.0
0.5
1.0
1.5
2.0
2.5
Gal
lons
per
cap
ita
Beer Wine Spirits

Hornby Zeller Associates, Inc. 74
Perceived Harm Indicator Description: PERCEIVED RISK FROM REGULAR ALCOHOL USE. This indicator reflects the percentage of high school students who report that there is moderate to great risk of harm from drinking one or two alcoholic beverages every day. Why Indicator is Important: High School students who do not perceive regular alcohol use (one to two drinks per day) as risky were almost twice as likely to drink in the past month than students who did perceive harm. Data Source(s): MIYHS, 2009-2011 Summary: Although most high school students think there is moderate to great risk of harm from drinking alcohol regularly, two out of five students in 2011 did not think regular use was risky. Perception of harm from regular alcohol use decreased from 2009 to 2011.
Figure 56. Percent of high school students perceiving moderate to great risk from drinking 1-2 drinks every day:
2009 and 2011
Source: MIYHS, 2009-2011
• The proportion of high school students who reported that people risk harming themselves if they drink one or two drinks every day decreased from 61 percent in 2009 to 59 percent in 2011.
61% 59%
0%
20%
40%
60%
80%
100%
2009 2011
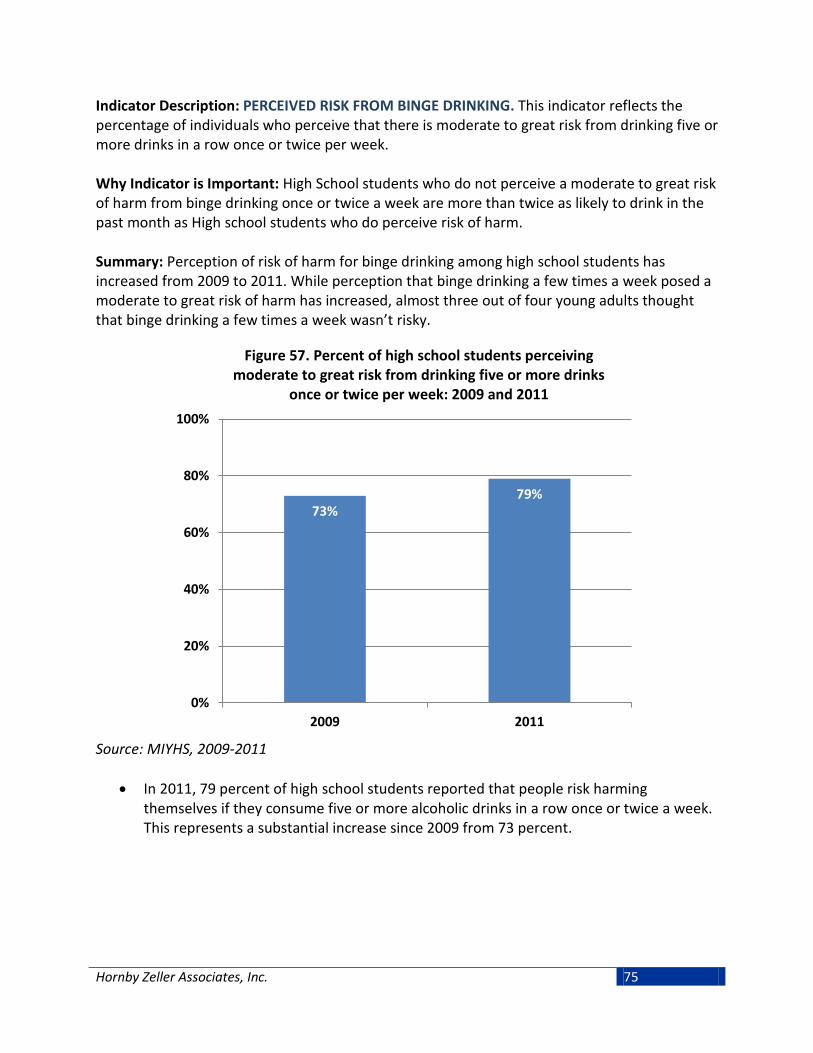
Hornby Zeller Associates, Inc. 75
Indicator Description: PERCEIVED RISK FROM BINGE DRINKING. This indicator reflects the percentage of individuals who perceive that there is moderate to great risk from drinking five or more drinks in a row once or twice per week. Why Indicator is Important: High School students who do not perceive a moderate to great risk of harm from binge drinking once or twice a week are more than twice as likely to drink in the past month as High school students who do perceive risk of harm. Summary: Perception of risk of harm for binge drinking among high school students has increased from 2009 to 2011. While perception that binge drinking a few times a week posed a moderate to great risk of harm has increased, almost three out of four young adults thought that binge drinking a few times a week wasn’t risky.
Figure 57. Percent of high school students perceiving moderate to great risk from drinking five or more drinks
once or twice per week: 2009 and 2011
Source: MIYHS, 2009-2011
• In 2011, 79 percent of high school students reported that people risk harming themselves if they consume five or more alcoholic drinks in a row once or twice a week. This represents a substantial increase since 2009 from 73 percent.
73% 79%
0%
20%
40%
60%
80%
100%
2009 2011

Hornby Zeller Associates, Inc. 76
Figure 58. Maine residents (age 18 and older) perceiving great risk from drinking five or more drinks once or twice per
week, by age group: 2004-05 through 2009-10
Source: NSDUH 2004-05 to 2009-10
• In 2009-10, 40 percent of Mainers ages 26 and up reported that drinking five or more drinks once or twice per week posed some risk of harm. Young adults ages 18 to 25 were much less likely to perceive a great risk of harm from drinking five or more drinks once or twice a week, at 27 percent in 2009-10. These trends have remained generally stable since 2004-05.
23% 22% 23% 25% 26% 27%
40% 41% 42% 40% 39% 40%
0%
10%
20%
30%
40%
50%
18-25 year olds 26+ year olds
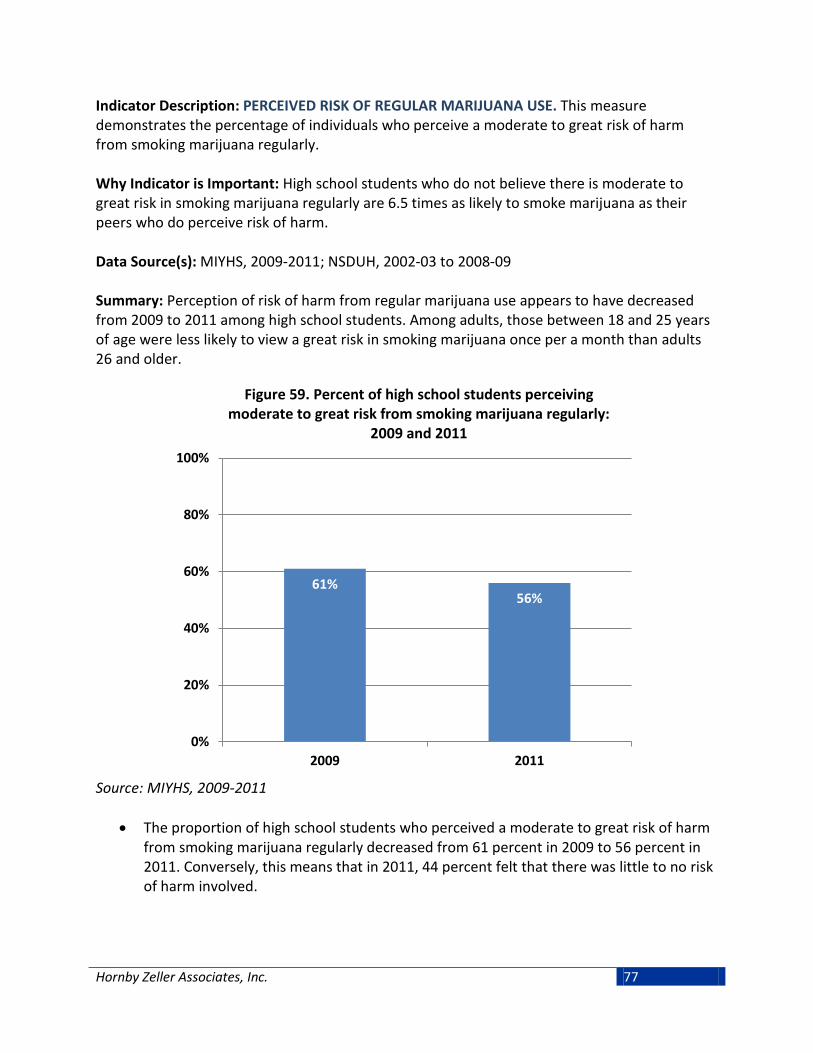
Hornby Zeller Associates, Inc. 77
Indicator Description: PERCEIVED RISK OF REGULAR MARIJUANA USE. This measure demonstrates the percentage of individuals who perceive a moderate to great risk of harm from smoking marijuana regularly. Why Indicator is Important: High school students who do not believe there is moderate to great risk in smoking marijuana regularly are 6.5 times as likely to smoke marijuana as their peers who do perceive risk of harm. Data Source(s): MIYHS, 2009-2011; NSDUH, 2002-03 to 2008-09 Summary: Perception of risk of harm from regular marijuana use appears to have decreased from 2009 to 2011 among high school students. Among adults, those between 18 and 25 years of age were less likely to view a great risk in smoking marijuana once per a month than adults 26 and older.
Figure 59. Percent of high school students perceiving moderate to great risk from smoking marijuana regularly:
2009 and 2011
Source: MIYHS, 2009-2011
• The proportion of high school students who perceived a moderate to great risk of harm from smoking marijuana regularly decreased from 61 percent in 2009 to 56 percent in 2011. Conversely, this means that in 2011, 44 percent felt that there was little to no risk of harm involved.
61% 56%
0%
20%
40%
60%
80%
100%
2009 2011

Hornby Zeller Associates, Inc. 78
Figure 60. Maine residents (age 18 and older) perceiving great risk from smoking marijuana once per month: 2004-05
through 2009-10
Source: NSDUH, 2004-05 to 2009-10
• In the 2009-10 period, young adults between the ages of 18 to 25 year old were less likely to view a great risk in smoking marijuana once per month (13%) and this has been the case since 2004-05. However, among Mainers who were 26 years old or older, perceptions of risk have decreased by eight percentage points since 2004-05, from 35 percent to 27 percent.
15% 14% 14% 15% 15% 13%
35% 36% 34% 32% 30%
27%
0%
10%
20%
30%
40%
50%
18-25 year olds 26+ year olds

Hornby Zeller Associates, Inc. 79
Perceived Enforcement Indicator Description: YOUTH PERCEIVED RISK OF BEING CAUGHT FOR DRINKING ALCOHOL. The percentage of high school students perceiving they would be caught by their parents and by police if they drank alcohol. Why Indicator is Important: According to the 2011 statewide MIYHS, high school students who believe they will be caught by their parents are one-fifth as likely to drink in the past month as compared to students who do not think they will be caught. Students who believe that they would be caught by the police are half as likely to drink alcohol in the past month as those who do not think they would be caught. Data Source(s): MIYHS, 2009-2011 Summary: High school students think they are more likely to be caught by their parents for drinking alcohol than by the police. Perception of not being caught by parents decreased slightly from 2009 to 2011.
Figure 61. Percent of high school students reporting they would not be caught by parents or the police if they drank:
2009 and 2011
Source: MIYHS, 2009-2011
• In 2011, 56 percent of students reported that they did not think they would be caught by their parents for drinking alcohol revealing a decrease of two percentage points since 2009. Students who reported that kids in the community would not be caught by the police if they drank alcohol increased slightly, from 84 percent in 2009 to 85 percent in 2011.
58%
84%
56%
85%
0%
20%
40%
60%
80%
100%
Parents Police
2009 2011

Hornby Zeller Associates, Inc. 80
Indicator Description: YOUTH PERCEIVED RISK OF BEING CAUGHT FOR SMOKING MARIJUANA. The percentage of high school students perceiving they would be caught by police if they smoked marijuana. Why Indicator is Important: High school students who believe they would be caught by the police are less than half as likely to smoke marijuana as their peers. Data Source(s): MIYHS, 2009-2011 Summary: The majority of high school students do not think they will be caught by police for smoking marijuana.
Figure 62. Percent of high school students reporting they would not get caught by the police if they smoked marijuana:
2009 and 2011
Source: MIYHS, 2009-2011
• In both 2009 and 2011, three quarters of high school students felt kids in the community would not be caught by police for smoking marijuana, whereas 25 percent felt they would be caught.
75% 75%
0%
20%
40%
60%
80%
100%
2009 2011

Hornby Zeller Associates, Inc. 81
Community and Cultural Norms Indicator Description: YOUTH PERCEPTION OF PEER ATTITUDES TOWARD SUBSTANCE USE. This measure reflects the percentage of high school students perceiving that they would be seen as cool if they began drinking alcohol or smoking marijuana. Why Indicator is Important: High school students who believe they would be seen as cool are more likely to engage in drinking and marijuana use than their peers. Data Source(s): MIYHS, 2009-2011 Summary: Although more than half of all high school students think that alcohol use and marijuana use would not be seen as “cool” by their peers, about two out of five continue to think that using substances would be seen as cool. This has decreased slightly since 2009.
Figure 63. Percent of high school students who reported they would be seen as "cool" for drinking alcohol or smoking
marijuana: 2009 and 2011
Source: MIYHS, 2009-2011
• The proportion of high school students who believed that their peers would see them as “cool” if the drank alcohol decreased from 42 percent in 2009 to 39 percent in 2011 while students who perceived they would be seen as “cool” if they smoked marijuana remained the same at 39 percent.
42% 37% 39% 37%
0%
20%
40%
60%
80%
100%
Drinking alcohol Smoking marijuana
2009 2011

Hornby Zeller Associates, Inc. 82
Indicator Description: YOUTH PERCEPTION OF ADULT ATTITUDES TOWARD ALCOHOL USE. This indicator depicts the percentage of high school students who thought that their parents feel it would be wrong for them to drink regularly. It also examines the proportion who reported that adults in their community think it would be wrong for kids their age to consume alcohol. Why Indicator is Important: High school students who do not believe their parents feel it would be wrong for them to drink are 2.5 times as likely to drink as their peers who do feel their parents would think it was wrong. A similar pattern can be observed in relation to adult attitudes towards drinking. Data Source(s): MIYHS, 2009-2011 Summary: High school students generally believe that their parents and adults in their community think it would be wrong for them to drink alcohol. The perception of disapproval increased in both parents and adults in community from 2009 to 2011.
Figure 64. Percent of high school students who reported perceiving that parents and adults in their community think
student alcohol use is wrong: 2009 and 2011
Source: MIYHS, 2009-2011
• The proportion of high school students who thought their parents felt it would be wrong for them to drink regularly increased from 83 percent in 2009 to 86 percent in 2011.
• The rate of students who reported that adults in their community think it is wrong for youth to use alcohol increased from 73 percent in 2009 to 75 percent in 2011.
84%
73%
86%
75%
0%
20%
40%
60%
80%
100%
Parents Adults in community
2009 2011

Hornby Zeller Associates, Inc. 83
Indicator Description: YOUTH PERCEPTION OF ADULT ATTITUDES TOWARD MARIJUANA USE. This indicator shows the percentage of high school students who reported that their parents feel it would be wrong for them to smoke marijuana. It also examines the proportion who thought adults in their neighborhood feel it would be wrong for kids their age to smoke marijuana. Why Indicator is Important: High school students who believe their parents feel it is wrong for them to smoke marijuana are one quarter as likely to use marijuana as students who do not believe their parents would think it is wrong. Students who believe adults in their neighborhood do not think it is wrong for kids to use marijuana are three times as likely to use it as their peers. Data Source(s): MIYHS, 2009-2011 Summary: Although high school students generally believe that their parents and adults in their community think it would be wrong for them to smoke marijuana, perception of disapproval for both parents and adults in the community decreased from 2009 to 2011.
Figure 65. Percent of high school students who reported that parents and adults in community think smoking marijuana is
wrong: 2009 and 2011
Source: MIYHS, 2009-2011
• The proportion of high school students who reported their parents feel it would be wrong for them to smoke marijuana decreased from 87 percent in 2009 to 84 percent in 2011. The rate of high school students who reported that adults in their community would feel it would be wrong to smoke marijuana also decreased by three percentage points from 2009 to 2011.
87% 80%
84% 77%
0%
20%
40%
60%
80%
100%
Parents Adults in community2009 2011
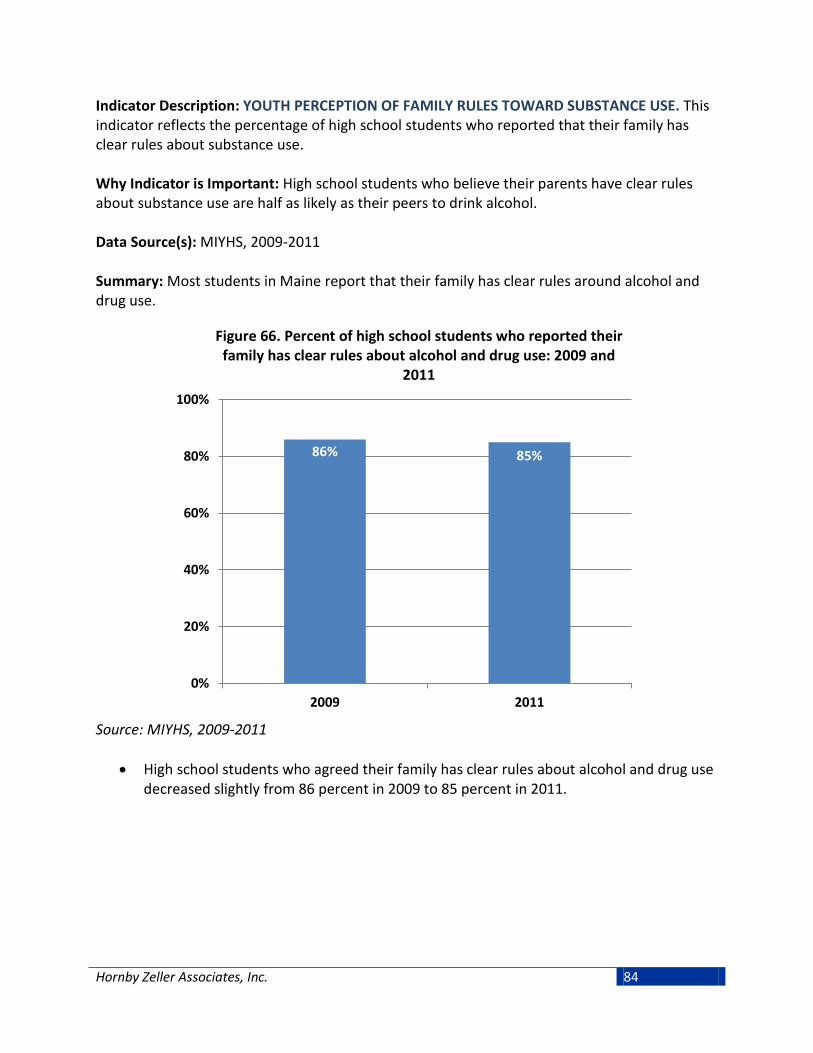
Hornby Zeller Associates, Inc. 84
Indicator Description: YOUTH PERCEPTION OF FAMILY RULES TOWARD SUBSTANCE USE. This indicator reflects the percentage of high school students who reported that their family has clear rules about substance use. Why Indicator is Important: High school students who believe their parents have clear rules about substance use are half as likely as their peers to drink alcohol. Data Source(s): MIYHS, 2009-2011 Summary: Most students in Maine report that their family has clear rules around alcohol and drug use.
Figure 66. Percent of high school students who reported their family has clear rules about alcohol and drug use: 2009 and
2011
Source: MIYHS, 2009-2011
• High school students who agreed their family has clear rules about alcohol and drug use decreased slightly from 86 percent in 2009 to 85 percent in 2011.
86% 85%
0%
20%
40%
60%
80%
100%
2009 2011

Hornby Zeller Associates, Inc. 85
Mental Health, Suicide and Co-occurring Disorders
The relationship between substance use and mental health has been well documented. There are great efforts underway at the Substance Abuse Mental Health Services Administration (SAMHSA) and throughout Maine to better integrate mental health promotion and substance abuse prevention. At the individual level, it is important to know if one exists because the symptoms of each can affect the other; that is, a person who is depressed may abuse alcohol in an effort to feel better. At the community level, it is important to understand how the prevalence of one interacts with the other so that prevention and intervention efforts can better address the needs of both. The data indicators included below represent multiple mental health indicators that can be routinely monitored in relation to substance abuse in hopes that this will lead to better prevention and intervention. About one in five adults in Maine report having ever been diagnosed with depression or anxiety. Young adults are more likely to report experiencing any mental illness in the past year than older adults (one in three). About one in ten high school students planned for suicide in 2011. Just over half of all substance abuse treatment admissions in 2012 also involved a mental health disorder and nearly one third had received outpatient mental health services in the past year.
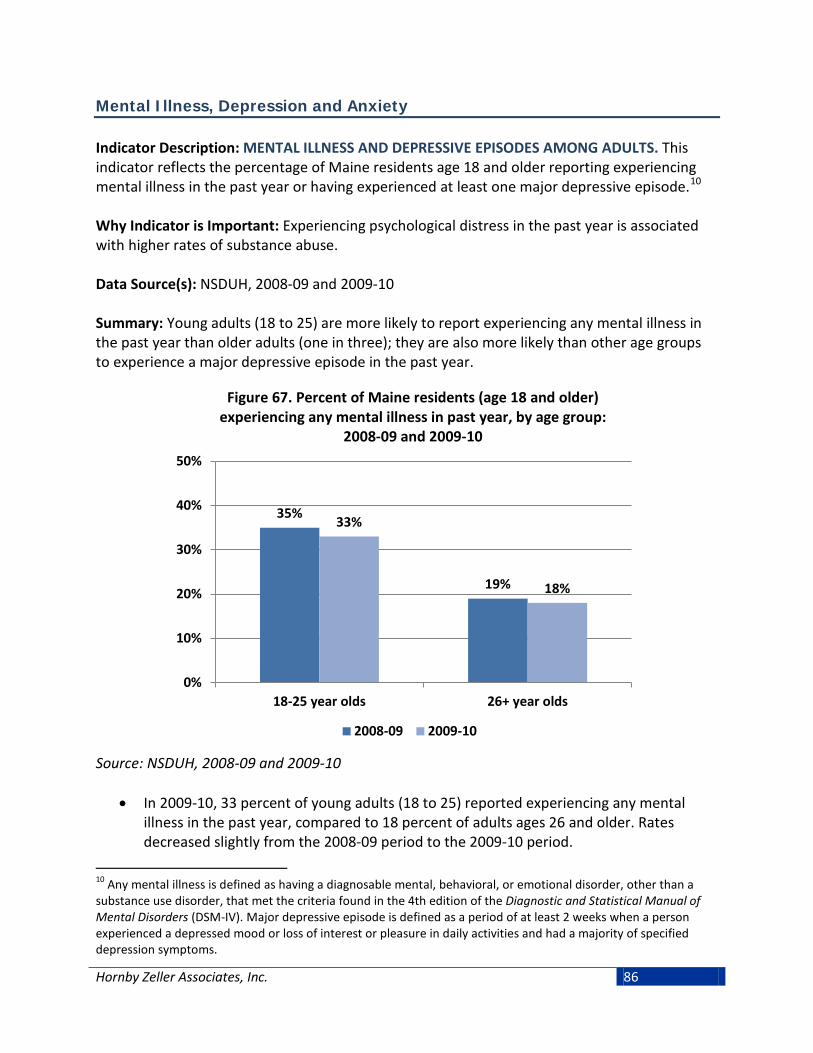
Hornby Zeller Associates, Inc. 86
Mental Illness, Depression and Anxiety Indicator Description: MENTAL ILLNESS AND DEPRESSIVE EPISODES AMONG ADULTS. This indicator reflects the percentage of Maine residents age 18 and older reporting experiencing mental illness in the past year or having experienced at least one major depressive episode.10 Why Indicator is Important: Experiencing psychological distress in the past year is associated with higher rates of substance abuse. Data Source(s): NSDUH, 2008-09 and 2009-10 Summary: Young adults (18 to 25) are more likely to report experiencing any mental illness in the past year than older adults (one in three); they are also more likely than other age groups to experience a major depressive episode in the past year.
Figure 67. Percent of Maine residents (age 18 and older) experiencing any mental illness in past year, by age group:
2008-09 and 2009-10
Source: NSDUH, 2008-09 and 2009-10
• In 2009-10, 33 percent of young adults (18 to 25) reported experiencing any mental
illness in the past year, compared to 18 percent of adults ages 26 and older. Rates decreased slightly from the 2008-09 period to the 2009-10 period.
10 Any mental illness is defined as having a diagnosable mental, behavioral, or emotional disorder, other than a substance use disorder, that met the criteria found in the 4th edition of the Diagnostic and Statistical Manual of Mental Disorders (DSM-IV). Major depressive episode is defined as a period of at least 2 weeks when a person experienced a depressed mood or loss of interest or pleasure in daily activities and had a majority of specified depression symptoms.
35%
19%
33%
18%
0%
10%
20%
30%
40%
50%
18-25 year olds 26+ year olds
2008-09 2009-10

Hornby Zeller Associates, Inc. 87
Figure 68. Percent of Maine residents (age 18 and older) years old experiencing at least one major depressive episode
in past year, by age group: 2004-05 through 2009-10
Source: NSDUH, 2004-05 to 2009-10
• In 2009-10, major depressive episodes were more prevalent among young adults ages
18 to 25 (9%) compared to adults 26 and older. From 2004-05 to 2009-10 the rate of major depressive episodes among 18 to 25 year olds has decreased by four percentage points. Rates among adults 26 and older have remained relatively stable since 2004-05.
13% 11% 11%
9% 9% 9%
8% 8% 9% 7% 6% 7%
0%
5%
10%
15%
20%
25%
18-25 year olds 26+ year olds

Hornby Zeller Associates, Inc. 88
Indicator Description: DIAGNOSIS OF ANXIETY AND DEPRESSION AMONG ADULTS. This indicator examines the percentage of Maine residents age 18 and older who have been told they have a depression or anxiety disorder. Why Indicator is Important: The link between mental health and substance abuse is well documented. Experiencing anxiety or depression in the past year is associated with higher rates of substance abuse. Data Source(s): BRFSS, 2011 Summary: One-fourth of adults in Maine reported having ever been diagnosed with depression compared to one-fifth reporting to have been diagnosed with anxiety.
Figure 69. Percent of adults who have been told they have a depression or anxiety disorder by age group: 2011
Source: BRFSS 2011
• In 2011, 24 percent of adults in Maine reported having ever been diagnosed with depression, while 20 percent reported having ever been diagnosed with anxiety. Adults ages 26-35 reported the highest rates in both depression and anxiety.
24% 23%
28% 27% 22%
20% 22%
31%
23%
15%
0%
10%
20%
30%
40%
50%
18+ 18-25 26-35 36-49 50+
Diagnosed Depression Diagnosed Anxiety

Hornby Zeller Associates, Inc. 89
Indicator Description: DEPRESSION AMONG YOUTH. This indicator measures the percentage of high school students reporting they felt sad or hopeless almost every day for two weeks in a row during the past year. Why Indicator is Important: Experiencing depression in the past year is associated with higher rates of substance abuse. Among youth, depression is also associated with problems with relationships and academic achievement. Data Source(s): MIYHS 2009-2011 Summary: Almost a quarter of high school students have reported feeling sad or helpless during the past year.
Figure 70. Percent of high school students who reported feeling sad or hopeless in past year: 2009 and 2011
Source: MIYHS 2009-2011
• The proportion of high school students who reported feeling so sad or helpless during the past year that they stopped doing some usual activities increased slightly, from 22 percent in 2009 to 23 percent in 2011.
22% 23%
0%
10%
20%
30%
40%
50%
2009 2011
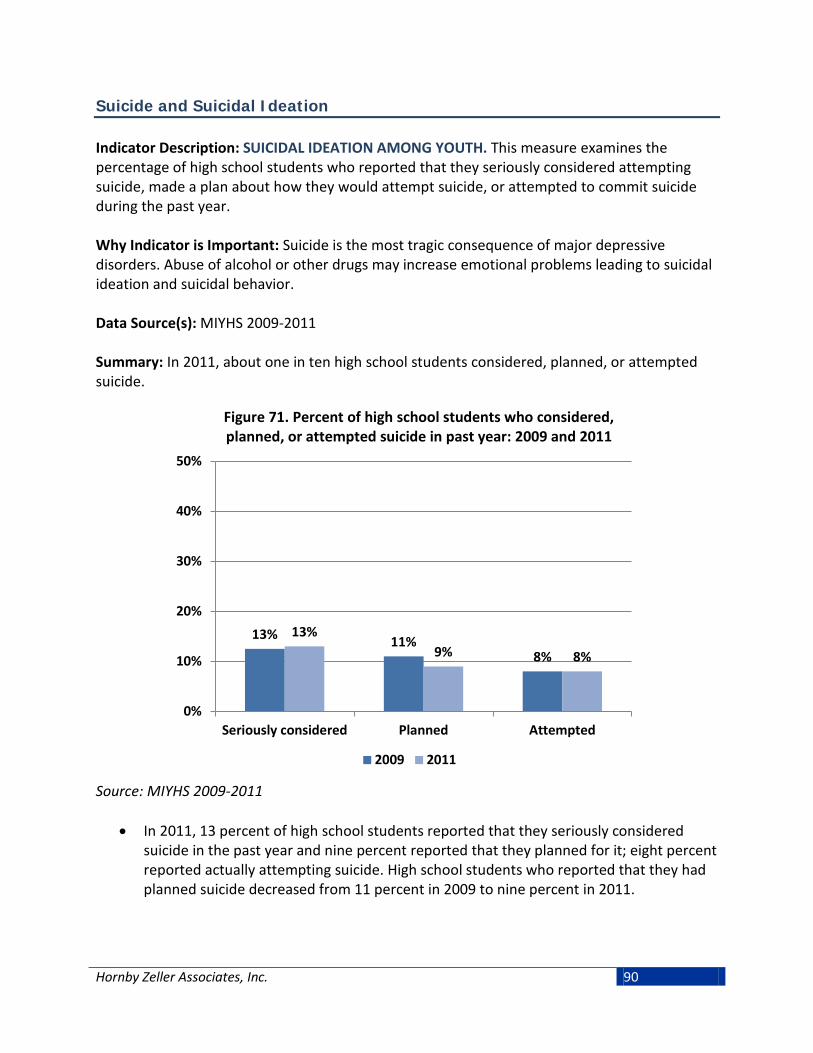
Hornby Zeller Associates, Inc. 90
Suicide and Suicidal Ideation Indicator Description: SUICIDAL IDEATION AMONG YOUTH. This measure examines the percentage of high school students who reported that they seriously considered attempting suicide, made a plan about how they would attempt suicide, or attempted to commit suicide during the past year. Why Indicator is Important: Suicide is the most tragic consequence of major depressive disorders. Abuse of alcohol or other drugs may increase emotional problems leading to suicidal ideation and suicidal behavior. Data Source(s): MIYHS 2009-2011 Summary: In 2011, about one in ten high school students considered, planned, or attempted suicide.
Figure 71. Percent of high school students who considered, planned, or attempted suicide in past year: 2009 and 2011
Source: MIYHS 2009-2011
• In 2011, 13 percent of high school students reported that they seriously considered suicide in the past year and nine percent reported that they planned for it; eight percent reported actually attempting suicide. High school students who reported that they had planned suicide decreased from 11 percent in 2009 to nine percent in 2011.
13% 11% 8%
13% 9% 8%
0%
10%
20%
30%
40%
50%
Seriously considered Planned Attempted
2009 2011

Hornby Zeller Associates, Inc. 91
Mental Health and Substance Abuse Co-Occurrence Indicator Description: CO-OCCURRING SUBSTANCE USE AND SUICIDAL BEHAVIOR AMONG YOUTH. This indicator explores the relationship between alcohol use within the past 30 days and suicidal behavior. It reflects the likelihood of high school students to report that they planned or attempted suicide during the past year by whether they reported consuming alcohol in the past month. Why Indicator is Important: The link between mental health and substance abuse is well documented. Alcohol is a depressant and its use by depressed individuals may increase suicidal behavior. Data Source(s): MIYHS, 2009-2011 Summary: In 2009 and 2011, high school students who drank in the past month were more than twice as likely to have planned or attempted suicide as those who abstained.
Figure 72. Percent of students reporting suicidal behavior in the past year, by alcohol use in the past month:
2009 and 2011
Source: MIYHS 2009-2011
• In 2011, Fifteen percent of high school students who had consumed alcohol in the previous 30 days reported they had planned suicide and 12 percent reported that they attempted suicide in the past year. This compares to those students who did not drink alcohol in the previous 30 days, where only seven percent planned suicide and five percent attempted suicide.
16% 15%
7% 6%
12% 12%
5% 5%
0%
10%
20%
30%
40%
50%
2009 2011 2009 2011
Drank Did Not Drink
Planned Suicide Attempted Suicide

Hornby Zeller Associates, Inc. 92
Indicator Description: CO-OCCURRING MENTAL HEALTH AND SUBSTANCE ABUSE TREATMENT. This indicator reflects the proportion of treatment admissions for substance abuse where the individual has a mental health diagnosis or has previously received mental health services. Why Indicator is Important: The link between mental health and substance abuse is well documented. In terms of treatment, it is important to know if one exists since the symptoms of each can affect the other. Data Source(s): TDS, 2007-2012 Summary: In 2012, just over half of all substance abuse treatment admissions also involved a mental health disorder. Nearly one-third had received outpatient mental health services in the past year.
Figure 73. Percent of total treatment admissions with reported mental health disorders: 2007-2012
Source: TDS, 2007-2012
• In 2012, 54 percent of all substance abuse treatment admissions also had a diagnosed mental health disorder. The proportion has increased by nine percentage points since 2007. Beginning in 2007, Maine engaged in an initiative to better diagnose and treat individuals with co-occurring substance abuse and mental health disorders.
45% 50% 50% 49%
53% 54%
0%
20%
40%
60%
80%
100%
2007 2008 2009 2010 2011 2012

Hornby Zeller Associates, Inc. 93
Figure 74. Percent of total treatment admissions where individuals received previous mental health services, by
type: 2007-2012
Source: TDS, 2007-2012
• In 2012, 30 percent of all substance abuse treatment admissions reported they had received outpatient mental health services in the past year; this has increased from 24 percent in 2007.
• Ten percent of substance abuse treatment admissions in 2012 reported a psychiatric admission (meaning hospitalization due to mental health) within the past two years. This has remained relatively stable since 2007.
24% 27% 28% 28% 29% 30%
9% 10% 10% 9% 10% 10%
0%
10%
20%
30%
40%
50%
2007 2008 2009 2010 2011 2012
Outpatient (past year) Psychiatric (past two years)

Hornby Zeller Associates, Inc. 94
Treatment Admissions for Substance Abuse
Substance abuse treatment admissions are an indicator of how many people receive treatment for a substance abuse problem. Treatment admission data should not be used as an indicator of the magnitude of the problems related to substance abuse. Rather, treatment should been seen a major consequence stemming from substance use and one that requires many resources. Information regarding treatment admissions also provides useful information about the patterns of substance use among various populations. Treatment related to substance abuse is measured in two forms: substance abuse treatment program admissions and general hospital admissions related to substance abuse problems. These admissions can be voluntary, but they can also be court-ordered. Hospital admissions (including both inpatient and outpatient services) with the primary diagnosis related to substance abuse problems are an indicator of how many people experiencing hospitalization are doing so with substance abuse problems. These substance-related problems can include diagnoses of intoxication, substance abuse or dependence, and poisonings. As previously stated, these data should not be used to measure the prevalence of substance abuse within Maine. The overall number of Mainers seeking treatment has been declining since 2007, from 14,843 to 11,688 in 2012. Mainers continued to seek out treatment for abuse involving a wide array of substances besides alcohol; in 2012 there were 4,135 admissions for alcohol as the primary substance. This was followed by synthetic opioids (3,838) and marijuana (1,024).
Figure 75. Primary treatment admissions by substance: 2012
Source: TDS, 2012
4,135
3,838
1,284
1,024
526
397
263
69
42
- 1,000 2,000 3,000 4,000 5,000
Alcohol
Synthetic opioids
Heroin/morphine
Marijuana
Methadone/buprenorphine
Cocaine/crack
Other drugs
Benzodiazepines
Bath Salts

Hornby Zeller Associates, Inc. 95
Alcohol Indicator Description: TREATMENT ADMISSIONS RELATED TO ALCOHOL. This measure reflects substance abuse treatment admissions in which alcohol was listed as the primary, secondary, or tertiary substance for which treatment was sought. The analysis excludes admissions for shelter/detoxification services. Why Indicator is Important: The number of substance abuse treatment admissions is bound by both the need and the capacity for treatment. Therefore, treatment admissions data do not provide a good indication of substance use, abuse or dependence. They do, however, provide an indication of service usage and the impact of substance use on the behavioral healthcare system. Data Source(s): TDS, 2007-2012 Summary: Alcohol continues to be the most frequent substance for which Mainers seek treatment, although the number of treatment admissions for alcohol has decreased since 2007. The proportion in which alcohol accounts for primary admissions has been gradually decreasing since 2007.
Figure 76. Number of treatment admissions where alcohol was the primary, secondary, or tertiary substance: 2007-2012
Source: TDS, 2007-2012
• Overall, the number of treatment admissions for alcohol has steadily decreased since 2007. In 2012, there were 4,135 primary admissions, 1,029 secondary admissions, and 632 tertiary admissions for which treatment was sought.
2007 2008 2009 2010 2011 2012Tertiary 781 763 724 672 645 632Secondary 1,465 1,443 1,271 1,168 1,077 1,029Primary 7,531 7,257 6,689 6,063 4,939 4,135
0
2,000
4,000
6,000
8,000
10,000

Hornby Zeller Associates, Inc. 96
Figure 77. Percent of treatment admissions where alcohol was the primary, secondary, or tertiary substance: 2007-2012
Source: TDS, 2007-2012
• In 2012, 36 percent of all primary treatment admissions were alcohol related which has decreased from 51 percent in 2007. As a proportion of secondary or tertiary substances, alcohol admissions have remained relatively stable over that time period.
2007 2008 2009 2010 2011 2012Primary 51% 47% 46% 45% 39% 36%Secondary 17% 16% 14% 14% 14% 14%Tertiary 17% 15% 15% 15% 15% 16%
0%
20%
40%
60%
80%
100%

Hornby Zeller Associates, Inc. 97
Synthetic Opioids Indicator Description: TREATMENT ADMISSIONS RELATED TO SYNTHETIC OPIOIDS. This measure reflects substance abuse treatment admissions in which synthetic opioids are listed as the primary, secondary, or tertiary substance for which treatment is sought. This excludes methadone, buprenorphine, heroin, morphine or opium. This analysis also excludes admissions for shelter/detoxification services. Why Indicator is Important: The number of substance abuse treatment admissions is bound by both the need and the capacity for treatment. Therefore, treatment admission data do not provide a good indication of substance use, abuse or dependence. They do, however, provide an indication of service usage and the impact of substance use on the behavioral healthcare system. Data Source(s): TDS, 2007-2012 Summary: One in three of all primary admissions are due to synthetic opiates. The number of primary treatment admissions involving synthetic opiates has remained relatively steady since 2008.
Figure 78. Number of treatment admissions where synthetic opioids was the primary, secondary, or tertiary substance:
2007-2012
Source: TDS, 2007-2012
• In 2012, there were 3,838 primary treatment admissions involving synthetic opiates. After a four year period (2008-2011) of stability, the overall number of treatment admissions related to synthetic opiates appears to have decreased slightly.
2007 2008 2009 2010 2011 2012Tertiary 875 1,008 890 899 790 596Secondary 1,836 2,214 2,269 2,207 2,163 1,837Primary 3,065 3,877 3,902 3,876 4,085 3,838
0
2,000
4,000
6,000
8,000
10,000

Hornby Zeller Associates, Inc. 98
Figure 79. Percent of total treatment admissions where synthetic opioids was the primary, secondary, or tertiary
substance: 2007-2012
Source: TDS, 2007-2012
• In 2012, synthetic opiates were the primary substance for which treatment was sought in 33 percent of all treatment admissions and were listed the secondary substance in 25 percent of admissions that listed a second substance. The proportion of primary treatment admissions due to synthetic opiates has been increasing steadily since 2007.
2007 2008 2009 2010 2011 2012Primary 21% 25% 27% 29% 32% 33%Secondary 21% 24% 26% 27% 28% 25%Tertiary 19% 20% 19% 21% 18% 15%
0%
10%
20%
30%
40%
50%

Hornby Zeller Associates, Inc. 99
Marijuana Indicator Description: TREATMENT ADMISSIONS RELATED TO MARIJUANA. This measure reflects substance abuse treatment admissions in which marijuana is listed as the primary, secondary, or tertiary substance for which treatment is sought. This analysis excludes admissions for shelter/detoxification services. Why Indicator is Important: The number of substance abuse treatment admissions is bound by both the need and the capacity for treatment. Therefore, treatment admissions data do not provide a good indication of substance use, abuse or dependence. They do, however, provide an indication of service usage and the impact of substance use on the behavioral healthcare system. Data Source(s): TDS, 2007-2012 Summary: Marijuana tends to be listed as a secondary or tertiary substance for which treatment is sought. Overall, treatment admissions for marijuana have been decreasing since 2008.
Figure 80. Number of treatment admissions where marijuana was the primary, secondary, or tertiary substance: 2007-2012
Source: TDS, 2007-2012
• In 2012, marijuana was listed as a secondary substance in more treatment admissions than as a primary substance (2,190 compared to 1,024). This pattern has remained relatively consistent since 2007. Total treatment admissions for marijuana have decreased from 5,577 in 2008 to 4,279 in 2012.
2007 2008 2009 2010 2011 2012Tertiary 1,071 1,187 1,216 1,136 1,154 1,065Secondary 2,892 2,875 2,774 2,567 2,221 2,190Primary 1,544 1,515 1,361 1,314 1,233 1,024
0
2,000
4,000
6,000
8,000
10,000

Hornby Zeller Associates, Inc. 100
Figure 81. Percent of total treatment admissions where marijuana was the primary, secondary, or tertiary substance:
2007-2012
Source: TDS, 2007-2012
• In 2012, marijuana accounted for a small proportion of primary treatment admissions (10 percent), but accounted for 30 percent of secondary admissions. Marijuana also accounted for about one-quarter (27%) of tertiary admissions in 2012.
2007 2008 2009 2010 2011 2012Primary 10% 10% 9% 10% 10% 9%Secondary 33% 31% 32% 31% 28% 30%Tertiary 23% 24% 26% 26% 27% 27%
0%
10%
20%
30%
40%
50%

Hornby Zeller Associates, Inc. 101
Heroin/Morphine Indicator Description: TREATMENT ADMISSIONS RELATED TO HEROIN/MORPHINE. This measure reflects substance abuse treatment admissions in which heroin or morphine is listed as the primary, secondary, or tertiary substance for which treatment is sought. This analysis excludes admissions for shelter/detoxification services. Why Indicator is Important: The number of substance abuse treatment admissions is bound by both the need and the capacity for treatment. Therefore, treatment admissions data do not provide a good indication of substance use, abuse or dependence. They do, however, provide an indication of service usage and the impact of substance use on the behavioral healthcare system. Data Source(s): TDS, 2007-2012 Summary: Total treatment admissions for heroin or morphine have been unsettled since 2007. Primary admissions related to heroin or morphine have been increasing since 2010.
Figure 82. Number of treatment admissions where heroin/morphine was the primary, secondary, or tertiary
substance: 2007-2012
Source: TDS, 2007-2012
• In 2012, there were 1,284 admissions in which heroin or morphine was the primary substance for which treatment was sought; they were listed as a secondary substance in 566 cases. The total number of admissions related to heroin/morphine has been steadily increasing since 2010.
2007 2008 2009 2010 2011 2012Tertiary 260 284 265 248 232 211Secondary 595 705 664 580 568 566Primary 1,092 1,198 1,311 940 1,099 1,284
0
1,000
2,000
3,000
4,000
5,000

Hornby Zeller Associates, Inc. 102
Figure 83. Percent of total treatment admissions where heroin/morphine was the primary, secondary, or tertiary
substance: 2007-2012
Source: TDS, 2007-2012
• Heroin was listed as the primary substance in 11 percent of all treatment admissions in 2012, representing an increase of three percentage points since 2010. Secondary and tertiary admissions for heroin have remained fairly stable since 2007.
2007 2008 2009 2010 2011 2012Primary 7% 8% 9% 7% 9% 11%Secondary 7% 8% 8% 7% 7% 8%Tertiary 6% 6% 6% 6% 5% 5%
0%
5%
10%
15%
20%
25%

Hornby Zeller Associates, Inc. 103
Cocaine/Crack Indicator Description: TREATMENT ADMISSIONS RELATED TO CRACK/COCAINE. This measure reflects substance abuse treatment admissions in which cocaine or crack is listed as the primary, secondary, or tertiary substance for which treatment is sought. This analysis excludes admissions for shelter/detoxification services. Why Indicator is Important: The number of substance abuse treatment admissions is bound by both the need and the capacity for treatment. Therefore, treatment admissions data do not provide a good indication of substance use, abuse or dependence. They do, however, provide an indication of service usage and the impact of substance use on the behavioral healthcare system. Data Source(s): TDS, 2007-2012 Summary: After gradually decreasing from 2007 to 2010, the numbers as well as proportions of primary, secondary, and tertiary admissions in which treatment for crack or cocaine was sought have remained stable.
Figure 84. Number of treatment admissions where cocaine/crack was the primary, secondary, or tertiary
substance: 2007-2012
Source: TDS, 2007-2012
• In 2012, cocaine and crack were listed as the primary substance for which treatment
was sought in 568 admissions, although it was more likely to be listed as a secondary (760) substance. Treatment admissions for cocaine or crack as the primary, secondary, and tertiary reason for treatment has been steadily decreasing, from 2,881 in 2007 to 1,725 in 2012.
2007 2008 2009 2010 2011 2012Tertiary 813 802 687 543 594 568Secondary 1,102 1,118 887 774 752 760Primary 966 869 596 470 475 397
0
1,000
2,000
3,000
4,000
5,000

Hornby Zeller Associates, Inc. 104
Figure 85. Percent of total treatment admissions where cocaine/crack was the primary, secondary, or tertiary
substance: 2007-2012
Source: TDS, 2007-2012
• In 2012, cocaine or crack were most likely listed as a tertiary substance for which
treatment was sought (15%), followed by secondary (10%), and primary (3%). The percentage of primary treatment admissions for crack or cocaine has remained relatively stable since 2009 while both secondary and tertiary rates have increased slightly in recent years.
2007 2008 2009 2010 2011 2012Primary 7% 6% 4% 3% 4% 3%Secondary 13% 12% 10% 9% 10% 10%Tertiary 17% 16% 15% 12% 14% 15%
0%
5%
10%
15%
20%
25%

Hornby Zeller Associates, Inc. 105
Methadone Indicator Description: TREATMENT ADMISSIONS RELATED TO METHADONE. This measure reflects substance abuse treatment admissions in which methadone is listed as the primary, secondary, or tertiary substance for which treatment is sought. This analysis excludes admissions for shelter/detoxification services. Why Indicator is Important: The number of substance abuse treatment admissions is bound by both the need and the capacity for treatment. Therefore, treatment admissions data do not provide a good indication of substance use, abuse or dependence. They do, however, provide an indication of service usage and the impact of substance use on the behavioral healthcare system. Data Source(s): TDS, 2007-2012 Summary: Although the number of admissions where methadone was the primary substance for which treatment was sought decreased in 2012, the proportions of treatment admissions where methadone was the primary, secondary, or tertiary substance have been slowly increasing since 2007.
Figure 86. Number of treatment admissions where methadone was the primary, secondary, or tertiary substance: 2007-2012
Source: TDS, 2007-2012
• After a steady increase between 2007 and 2011, the total number of admissions
decreased from 1,192 in 2011 to 1,089 in 2011. There were 526 admissions in which methadone was listed as the primary substance for which treatment was sought, 341 admissions in which it was listed as a secondary substance, and 222 admissions in which it was listed as a tertiary substance.
2007 2008 2009 2010 2011 2012Tertiary 228 211 265 224 266 222Secondary 313 315 343 324 341 341Primary 356 425 455 575 585 526
0
500
1,000
1,500
2,000
2,500

Hornby Zeller Associates, Inc. 106
Figure 87. Percent of total treatment admissions where methadone was the primary, secondary, or tertiary
substance: 2007-2012
Source: TDS, 2007-2012
• In 2012, methadone as a tertiary substance for treatment accounted for 5.7 percent of
admissions, an increase of 1.2 percent since 2007. The proportion of admissions for methadone as a primary substance increased from 2.4 percent in 2007 to 4.6 percent in 2012.
2007 2008 2009 2010 2011 2012Primary 2.4% 2.8% 3.1% 4.3% 4.6% 4.6%Secondary 3.6% 3.4% 3.9% 4.0% 4.4% 4.6%Tertiary 4.9% 4.3% 5.6% 5.1% 6.1% 5.7%
0%
5%
10%
15%
20%
25%

Hornby Zeller Associates, Inc. 107
Benzodiazepines Indicator Description: TREATMENT ADMISSIONS RELATED TO BENZODIAZEPINES. This measure reflects substance abuse treatment admissions in which benzodiazepines are listed as the primary, secondary, or tertiary substance for which treatment is sought. Benzodiazepines are psychoactive drugs used to treat anxiety, insomnia, agitation, seizures, muscle spasms and alcohol withdrawal. This analysis excludes admissions for shelter/detoxification services. Why Indicator is Important: The number of substance abuse treatment admissions is bound by both the need and the capacity for treatment. Therefore, treatment admissions data do not provide a good indication of substance use, abuse or dependence. They do, however, provide an indication of service usage and the impact of substance use on the behavioral healthcare system. Data Source(s): TDS, 2007-2012 Summary: Both the number and proportion of total treatment admissions involving benzodiazepines have remained relatively stable since 2007.
Figure 88. Number of treatment admissions where benzodiazepines were the primary, secondary, or tertiary
substance: 2007-2012
Source: TDS, 2007-2012
• In 2012, benzodiazepines were listed as a secondary substance for which treatment was sought in 283 admissions and as a tertiary substance for 267 admissions. Overall, treatment admissions for benzodiazepines have remained fairly stable since 2007.
2007 2008 2009 2010 2011 2012Tertiary 301 327 356 296 292 267Secondary 354 320 306 326 370 283Primary 91 76 86 78 98 68
0
500
1,000
1,500
2,000
2,500
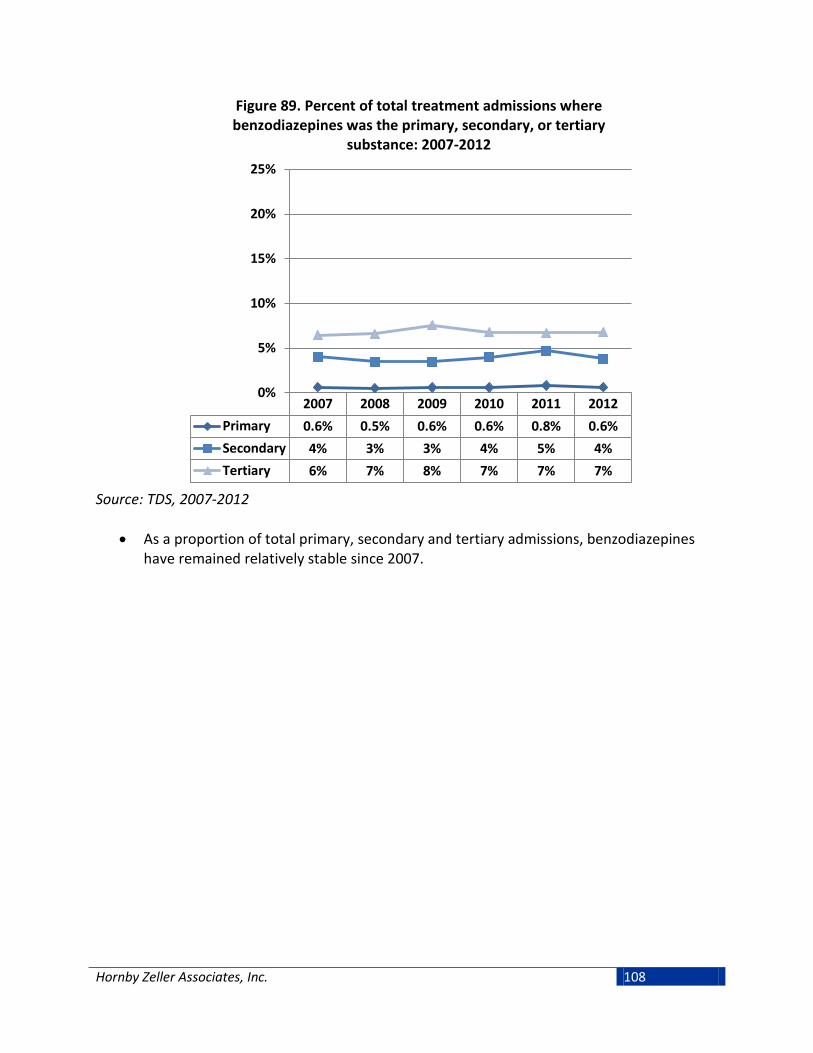
Hornby Zeller Associates, Inc. 108
Figure 89. Percent of total treatment admissions where benzodiazepines was the primary, secondary, or tertiary
substance: 2007-2012
Source: TDS, 2007-2012
• As a proportion of total primary, secondary and tertiary admissions, benzodiazepines have remained relatively stable since 2007.
2007 2008 2009 2010 2011 2012Primary 0.6% 0.5% 0.6% 0.6% 0.8% 0.6%Secondary 4% 3% 3% 4% 5% 4%Tertiary 6% 7% 8% 7% 7% 7%
0%
5%
10%
15%
20%
25%

Hornby Zeller Associates, Inc. 109
Indicator Description: TREATMENT ADMISSIONS RELATED TO BATH SALTS. This measure reflects substance abuse treatment admissions in which bath salts are listed as the primary, secondary, or tertiary substance for which treatment is sought. Bath salts are synthetic substances that act in the brain like powerful stimulant drugs. Often marketed as “not for human consumption” to avoid legal prosecution, “bath salts” and the chemicals used to create them are now illegal to sell or possess in the United States. Bath salts emerged as a substance of concern in 2010 and have been tracked in the TDS system since 2011. Why Indicator is Important: The number of substance abuse treatment admissions is bound by both the need and the capacity for treatment. Therefore, treatment admissions data do not provide a good indication of substance use, abuse or dependence. They do, however, provide an indication of service usage and the impact of substance use on the behavioral healthcare system. Data Source(s): TDS, 2011-2012 Summary: There were 82 total treatment admissions related to bath salts in 2012.
Figure 90. Percent of total treatment admissions where bath salts were the primary, secondary, or tertiary substance:
2007-2012
Source: TDS, 2011-2012
• In 2012, there were 42 treatment admissions primarily related to bath salts, 19 secondary admissions and 21 tertiary admissions. Between 2011 and 2012, treatment admissions related to bath salts have tripled.
2011 2012Tertiary 3 21Secondary 4 19Primary 14 42
0
20
40
60
80
100

Hornby Zeller Associates, Inc. 110

Hornby Zeller Associates, Inc. 111
Conclusion
Alcohol is the substance most often used by Mainers across the lifespan and the substance for which most seek treatment. Great progress has been made towards reducing the rate of alcohol use among Maine’s youth, as evidenced by the most recent data trends that show an overall decline in both lifetime use and past 30-day use of alcohol. Moreover, young adults are the most likely age group to binge drink and to drink heavily. Binge-drinking rates among 18 to 25 year olds appear to have been increasing within recent years. This age group also has the highest rates of motor vehicle crashes and crash fatalities, especially young men. Finally, alcohol is the primary presenting factor in most substance abuse treatment admissions in Maine. Prescription drugs represent a serious public health concern for Maine. While pinpointing the extent of prescription drug use is difficult because of a wide range of definitions among various data sources and lack of comparable data, seven percent of high school students had used prescription drugs for a reason other than their intended purpose in the past 30 days and one in seven reported misusing prescription drugs in their lifetime. Among adults, 14 percent of young adults ages 18-25 had used pain relievers for non-medical purposes within the past year. Finally, prescription drug misuse continues to have a large impact on treatment and hospitalizations in Maine. In terms of illicit drugs, the most commonly used illegal drug in Maine is marijuana. Among the 18-25 year old population, 27 percent of young adults used marijuana in the past month, and only 13 percent think smoking marijuana once per month poses great risks. Moreover, recent data indicate that 22 percent of high school students in Maine have used marijuana in the past 30 days. While over half of all high school students think that regular use of marijuana poses moderate to great risks of harm, this appears to be decreasing. Although there are few consequences that can be specifically linked to marijuana, early use has been associated with later adolescent problems that limit skills for employment and increase the risk of using other illicit drugs. The relationship between substance use and mental health has been well documented. About one fifth of adults in Maine report having ever been diagnosed with depression. Young adults are more likely to report experiencing serious any mental illness in the past year than older adults (one in three). And about one in ten high school students considered or planned for suicide in 2011. Over half of all substance abuse treatment admissions in 2011 also involved a mental health disorder; close to one third of those admitted had received outpatient mental health services in the past year. These mental health indicators should continue to be monitored in terms of the relationship they have with substance use and abuse.