substance abuse treatment - outpatient
TRANSCRIPT
Baltimore City Health Department, Ryan White, CQM Outpatient Substance Abuse Report Page 1
BALTIMORE CITY HEALTH DEPARTMENT
RYAN WHITE OFFICE
CLINICAL QUALITY MANAGEMENT PROGRAM (CQM)
Service Category: Outpatient Substance Abuse Treatment
June, 2011
Baltimore City Health Department, Ryan White, CQM Outpatient Substance Abuse Report Page 2
TABLE OF CONTENTS
Section 1. Introduction………………………………………………………………………………………………………….……3
Section 2. Methodology………………………………………………………………………………………………………………4
Section 3. Demographics…………………………………………………………………………………………………………….6
Section 4. Early Intervention Services………………………………………………………………………………….……14
Section 5. Level I Outpatient Services………………………………………………………………………………….…….16
Section 6. Level II Intensive Outpatient Services………………………………………………………………………..18
Section 7. Medication Assisted Treatment…………………………………………………………………………...…….20
Section 8. Other Services…………………………………………………………………………………………………………..22
Section 9. Consumer Survey………………………………………………………………………………………………...……23
Section 10. Quality Improvement (QI) Organizational Assessment……………………………………….…….27
Section 11. Summary of Findings………………………………………………………………………………………………30
Section 12. Discussion and Recommendations………………………………………………………………….……….31
Appendix A: Outpatient Substance Abuse Standards of Care……………………………………………...……….32
Baltimore City Health Department, Ryan White, CQM Outpatient Substance Abuse Report Page 3
SECTION 1. INTRODUCTION
The Baltimore City Health Department (BCHD) Clinical Quality Management Program (CQM) began in 2001, the purpose of which is to ensure that people living with HIV/AIDS (PLWH/A) in the Baltimore/Towson Eligible Metropolitan Area (EMA) have access to quality care and services consistent with the Ryan White HIV/AIDS Treatment Extension Act of 2009. In fiscal year 2010, the CQM initiative focused on adult primary medical care, mental health, outpatient substance abuse, residential substance abuse, and outreach services. This report presents outpatient substance abuse services.
As defined in the Greater Baltimore HIV Health Services Planning Council (Planning Council) local standards of care, substance abuse services are defined as, “Medical or other treatment and/or counseling to address substance‐abuse problems (i.e. abuse of alcohol and/or legal or illegal drugs) provided in an outpatient setting rendered by a licensed professional as specified in COMAR 10.47.01.02 and 10.47.01.06.” Additionally, “Substance‐abuse treatment services (medication‐assisted treatment) are defined as treatment, support and recover for opioid‐addicted patients using pharmacological interventions, including but not limited to methadone and Buprenorphine per COMAR 10.47.02.11.”
To assess the degree to which the standards of care were adhered to across the EMA, data was gathered and analyzed from all Part A‐ and Minority AIDS Initiative (MAI)‐funded outpatient substance abuse vendors in the EMA. In addition to providing the results of the data collected, this report provides details of the methodology, as well as a summary of the findings, national comparisons, and recommendations for improving the quality of substance abuse services. The Appendix contains the standards of care used during the review.

Baltimore City Health Department, Ryan White, CQM Outpatient Substance Abuse Report Page 4
SECTION 2. METHODOLOGY
Clinical Quality Management reviews were conducted in 2010 at 11 agencies providing outpatient substance abuse services. Data was collected through three avenues, 1) Client chart abstractions, 2) Consumer surveys, and 3) QI organizational assessments. The data presented is not intended to reflect all Ryan White outpatient substance abuse clients throughout the Baltimore/Towson EMA.
Client Chart Abstraction: The chart abstraction tool was designed to assess vendor compliance with the standards of care. The review period included services provided in fiscal year 2009 under Part A (March 1, 2009 – February 28, 2010) and MAI (August 1, 2009 – July 31, 2010) funding streams. One chart abstraction tool was utilized to abstract the services provided across both funding streams. Results from the chart abstractions are presented in Sections 47.
Vendors were directed to provide a random sample of charts and CQM provided two methodologies for doing so. CQM staff did not verify that the charts provided represented a random sample. The number of charts requested from each agency was based on the number of Ryan White clients receiving substance abuse services in 2009 and guided by the 2008 HIVQUAL sampling methodology developed by the New York State Department of Health AIDS Institute. 1
A total of 221 client charts (204 Part A and 17 MAI) were reviewed at the 11 agencies. The number of charts reviewed per site ranged from 2 to 46 with an average of 20 charts reviewed per site. Based on the data reported to BCHD by the agencies funded, a total of 351 persons received outpatient substance abuse services during 2009.2 Sixty three percent of all outpatient substance abuse charts were reviewed during the 2010 CQM reviews, Table 1.
Table 1. Outpatient Substance Abuse Charts Reviewed, N=221
Program Charts Reviewed
% CQM Sample
Clients Seen
% Agency Sample
Chase Brexton Health Services, Inc. 46 21% 61 75%Health Care for the Homeless 17 8% 23 74%Park West Medical Center 27 12% 45 60%
People’s Community Health Center 11 5% 31 35%Family Health Centers 6 3% 6 100%Total Health Care 28 13% 49 57%
Total Health Care MAI 17 8% 18 94%University of Maryland Psychiatric 46 21% 93 49%
BSAS Tuerk House 2 1% 2 100%BSAS Man Alive 13 6% 13 100%
BSAS A Helping Hand 8 4% 10 80%Total 221 100% 351 63%
1 New York State Department of Health AIDS Institute, The 2008 HIVQUAL Project Sampling Methodology, August 2009 2 This data was obtained from monthly Form 8 submissions to the grantee’s office. This total is unduplicated at the vendor level and then aggregated to give a duplicated EMA‐wide count.

Baltimore City Health Department, Ryan White, CQM Outpatient Substance Abuse Report Page 5
Consumer Survey: The consumer survey assesses quality from the client’s perspective. CQM staff utilized a consumer questionnaire developed by the New York State Department of Health AIDS Institute. 3 The tool captured demographics, specific substance abuse services received, and client satisfaction with services. Vendors were instructed to provide a sample of consumers for interviews during the scheduled visit. An independent consultant administered the consumer interviews while on site. When on‐site interviews were not possible, telephone interviews were conducted after obtaining client consent by the agency.
Organizational Assessment: CQM utilized a quality improvement organizational assessment checklist to measure quality improvement indicators in multiple domains including quality structure, quality planning, quality performance measurement, quality improvement activities, staff involvement, consumer involvement, evaluation of the quality program, and clinical information systems. CQM staff interviewed each agency and completed the organizational assessment based on vendor responses and substantiating documentation where available. The assessment was developed by the HIVQUAL‐US program at the New York State Department of Health AIDS Institute. 4
The client chart abstraction tool and QI organizational assessment were distributed to vendors and the Greater Baltimore Health Services Planning Council (Planning Council) for comment prior to utilization during the reviews. CQM also conducted conference calls with all substance abuse programs in advance of their reviews to confirm dates, locations, any additional logistics, and to answer any questions specific to the tools and/or review process.
Data Comparisons: Throughout this report where possible, these data were compared with the 2006 review of outpatient substance abuse services and with data compiled by the Center for HIV Surveillance and Epidemiology at the Maryland Department of Mental Health and Hygiene.
3 http://www.nationalqualitycenter.org/index.cfm/35778/index.cfm/2214265 4 http://www.hivguidelines.org/wp‐content/uploads/HIVQUAL‐OA.pdf
Baltimore City Health Department, Ryan White, CQM Outpatient Substance Abuse Report Page 6
SECTION 3. DEMOGRAPHICS
GENDER
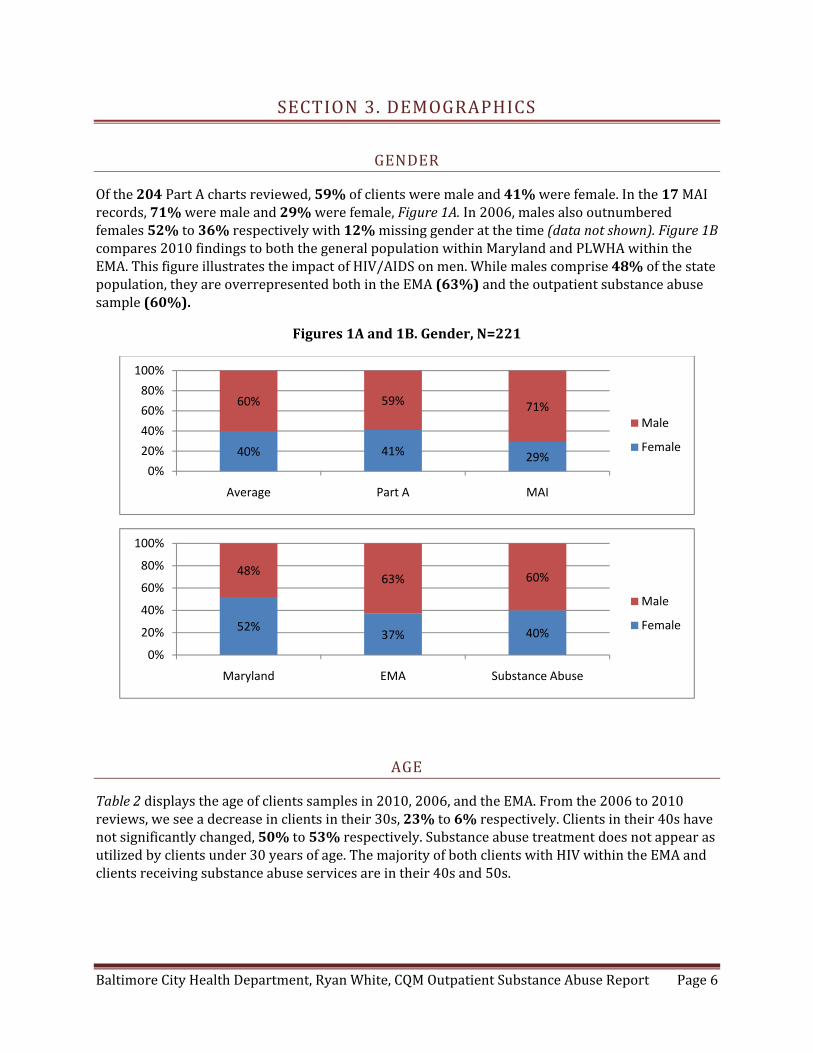
Of the 204 Part A charts reviewed, 59% of clients were male and 41% were female. In the 17 MAI records, 71% were male and 29% were female, Figure 1A. In 2006, males also outnumbered females 52% to 36% respectively with 12% missing gender at the time (data not shown). Figure 1B compares 2010 findings to both the general population within Maryland and PLWHA within the EMA. This figure illustrates the impact of HIV/AIDS on men. While males comprise 48% of the state population, they are overrepresented both in the EMA (63%) and the outpatient substance abuse sample (60%).
Figures 1A and 1B. Gender, N=221
AGE
Table 2 displays the age of clients samples in 2010, 2006, and the EMA. From the 2006 to 2010 reviews, we see a decrease in clients in their 30s, 23% to 6% respectively. Clients in their 40s have not significantly changed, 50% to 53% respectively. Substance abuse treatment does not appear as utilized by clients under 30 years of age. The majority of both clients with HIV within the EMA and clients receiving substance abuse services are in their 40s and 50s.
40% 41% 29%
60% 59% 71%
0%
20%
40%
60%
80%
100%
Average Part A MAI
Male
Female
52%37% 40%
48%63% 60%
0%
20%
40%
60%
80%
100%
Maryland EMA Substance Abuse
Male
Female
Baltimore City Health Department, Ryan White, CQM Outpatient Substance Abuse Report Page 7
Table 2. Age, N=221
Age 2006 2010 EMA 019 1% 0% 2%20s 8% 4% 8%30s 23% 6% 16%40s 50% 53% 38%50s 17% 34% 28%60+ 2% 2% 8%
RACE/ETHNICITY
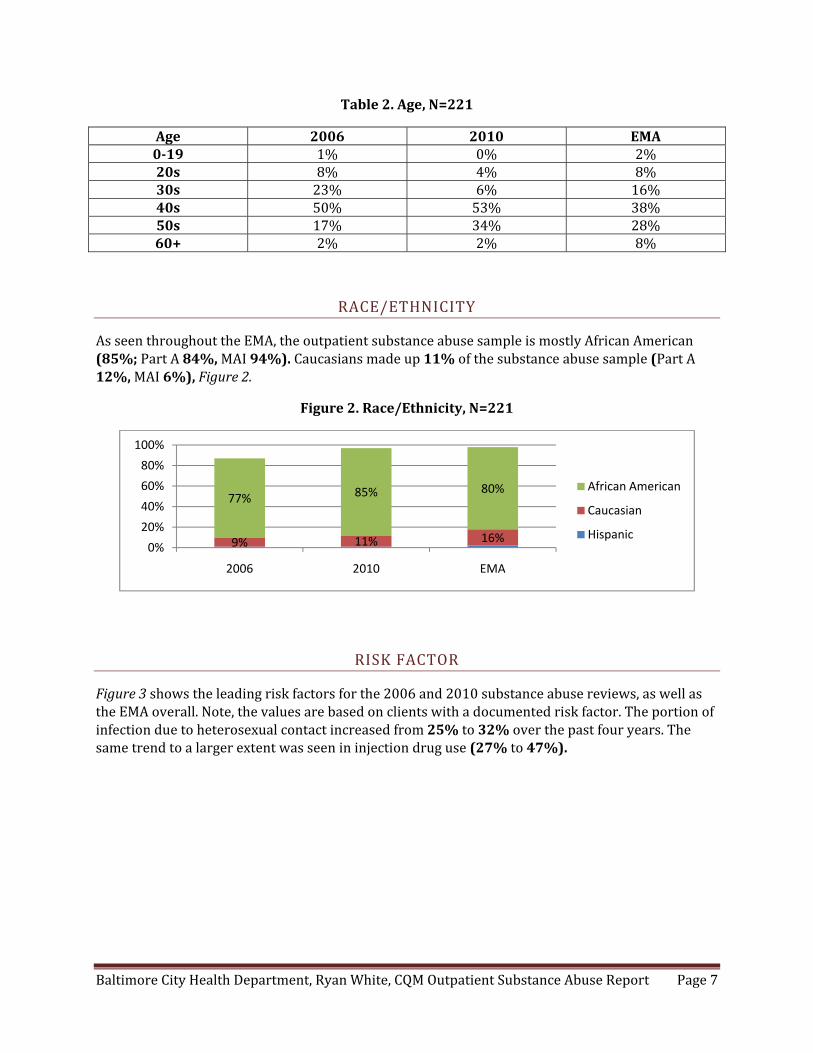
As seen throughout the EMA, the outpatient substance abuse sample is mostly African American (85%; Part A 84%, MAI 94%). Caucasians made up 11% of the substance abuse sample (Part A 12%, MAI 6%), Figure 2.
Figure 2. Race/Ethnicity, N=221
RISK FACTOR
Figure 3 shows the leading risk factors for the 2006 and 2010 substance abuse reviews, as well as the EMA overall. Note, the values are based on clients with a documented risk factor. The portion of infection due to heterosexual contact increased from 25% to 32% over the past four years. The same trend to a larger extent was seen in injection drug use (27% to 47%).
9% 11% 16%
77% 85% 80%
0%
20%
40%
60%
80%
100%
2006 2010 EMA
African American
Caucasian
Hispanic

Baltimore City Health Department, Ryan White, CQM Outpatient Substance Abuse Report Page 8
Figure 3. Risk Factor, N=162
RESIDENCY
CQM reviews were conducted in Baltimore City and Baltimore County. One agency visited was outside the EMA, but received funding from Part A. Baltimore City zip codes accounted for 81% of the outpatient substance abuse sample followed by Baltimore County at 12%. Anne Arundel County accounted for 4% of the zip codes and one zip code (<1%) showed Harford County. Three (1%) were outside the EMA and included Talbot and Prince George’s Counties, as well as the state of Pennsylvania. Eight (4%) zip codes were missing in the charts.
INSURANCE STATUS
Of the 221 charts reviewed, Medicaid was the most common form of insurance followed by Medicare, 37% and 16% respectively, Figure 4. In 2006, Medicaid was also the leading insurance followed by the Maryland Pharmacy Assistance Program. A smaller portion of clients (18%) were uninsured compared to four years ago when 31% had no insurance coverage. Small portions of clients are covered by private insurance (5%). For the MAI program specifically, 5 charts indicated Medicaid, 3 Medicare, 3 were uninsured, 1 had private insurance, and 5 charts were missing insurance status.
Figure 4. Insurance Coverage, N=221
27% 25%
8%
27%
3%
47%
32%
10% 7%3%
43%
27% 24%
0%4%
0%
10%
20%
30%
40%
50%
IDU Heterosexual MSM Hetero & IDU MSM & IDU
2006
2010
EMA
34%
10% 11%
3% 3%7%
31%
14%
37%
16%12%
5% 4% 2%
18%
12%
0%
10%
20%
30%
40%
Medicaid Medicare PAC Private Other MADAP None Missing
2006
2010
Baltimore City Health Department, Ryan White, CQM Outpatient Substance Abuse Report Page 9
CLINICAL INDICATORS
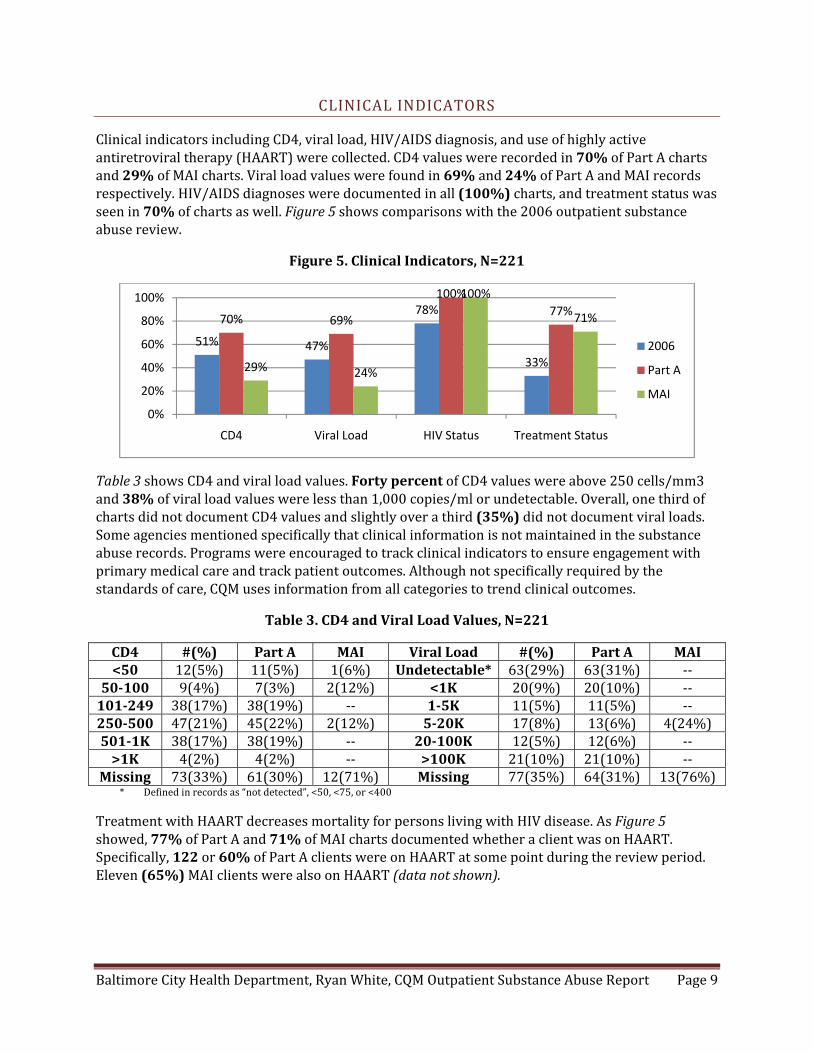
Clinical indicators including CD4, viral load, HIV/AIDS diagnosis, and use of highly active antiretroviral therapy (HAART) were collected. CD4 values were recorded in 70% of Part A charts and 29% of MAI charts. Viral load values were found in 69% and 24% of Part A and MAI records respectively. HIV/AIDS diagnoses were documented in all (100%) charts, and treatment status was seen in 70% of charts as well. Figure 5 shows comparisons with the 2006 outpatient substance abuse review.
Figure 5. Clinical Indicators, N=221
Table 3 shows CD4 and viral load values. Forty percent of CD4 values were above 250 cells/mm3 and 38% of viral load values were less than 1,000 copies/ml or undetectable. Overall, one third of charts did not document CD4 values and slightly over a third (35%) did not document viral loads. Some agencies mentioned specifically that clinical information is not maintained in the substance abuse records. Programs were encouraged to track clinical indicators to ensure engagement with primary medical care and track patient outcomes. Although not specifically required by the standards of care, CQM uses information from all categories to trend clinical outcomes.
Table 3. CD4 and Viral Load Values, N=221
CD4 #(%) Part A MAI Viral Load #(%) Part A MAI <50 12(5%) 11(5%) 1(6%) Undetectable* 63(29%) 63(31%) ‐‐
50100 9(4%) 7(3%) 2(12%) <1K 20(9%) 20(10%) ‐‐101249 38(17%) 38(19%) ‐‐ 15K 11(5%) 11(5%) ‐‐250500 47(21%) 45(22%) 2(12%) 520K 17(8%) 13(6%) 4(24%)5011K 38(17%) 38(19%) ‐‐ 20100K 12(5%) 12(6%) ‐‐>1K 4(2%) 4(2%) ‐‐ >100K 21(10%) 21(10%) ‐‐
Missing 73(33%) 61(30%) 12(71%) Missing 77(35%) 64(31%) 13(76%)* Defined in records as “not detected”, <50, <75, or <400
Treatment with HAART decreases mortality for persons living with HIV disease. As Figure 5 showed, 77% of Part A and 71% of MAI charts documented whether a client was on HAART. Specifically, 122 or 60% of Part A clients were on HAART at some point during the review period. Eleven (65%) MAI clients were also on HAART (data not shown).
51% 47%
78%
33%
70% 69%
100%
77%
29% 24%
100%
71%
0%
20%
40%
60%
80%
100%
CD4 Viral Load HIV Status Treatment Status
2006
Part A
MAI

Baltimore City Health Department, Ryan White, CQM Outpatient Substance Abuse Report Page 10
NATIONAL HIV/AIDS STRATEGY
Since being elected, President Obama and his cabinet have developed a National HIV/AIDS Strategy that aims to bring a more comprehensive response to the HIV/AIDS epidemic. The plan has three goals, 1) Reducing the number of people who become infected with HIV, 2) Increasing access to care and optimizing health outcomes for people living with HIV, and 3) Reducing HIV‐related health disparities. This section of the report focuses on the third goal. In order to gain an understanding and benchmark for how well our EMA is reducing HIV‐related health disparities, additional information was cross‐tabulated to determine, 1) The number of HIV diagnosed gay and bisexual men with undetectable viral loads, 2) The proportion of HIV diagnosed Blacks with undetectable viral loads, and 3) The proportion of HIV diagnosed Latinos with undetectable viral loads. Each of these goals is targeted, per the National HIV/AIDS Strategy, by 2015 and should be increased by twenty percent. More information on the President’s strategy to address HIV/AIDS can be accessed at www.WhiteHouse.gov/ONAP.
In the 2010 outpatient substance abuse sample, there were 89 men with a clearly defined risk factor, that is it was either heterosexual, MSM, or IDU. One client identified as transgender reported contracting HIV through MSM contact. There were also 35 men without a documented risk factor, but did have viral load values recorded. Table 4 compares the proportion of undetectable viral loads in men with an MSM, heterosexual, and IDU risk factor. Of the 12 MSM with a documented viral load, 42% were undetectable. Of the 11 men with heterosexual contact, 65% were undetectable, and for the 36 men with an IDU risk factor, 44% had undetectable viral load values. This sample size is very small and cannot directly substantiate any disparity in the medical management of HIV disease based on client risk factor.
Similarly, there were 188 African Americans, 25 Caucasians, and 2 Hispanics in the 2010 outpatient substance abuse sample. One hundred nineteen African Americans had a documented viral load value and of those, 43% were undetectable. Twenty Caucasians had a viral load present in the chart and of those, half (50%) were also undetectable. The one Hispanic with a viral load was not undetectable, Table 4. Again, the sample size for race/ethnicity is also very small.
Table 4. Viral Load Suppression by Race and Risk Factor, N=215
Demographic # (%) Viral Loads # (%) Undetectable MSM (N=16) 12 (75%) 5 (42%)
Heterosexual (N=18) 11 (61%) 7 (64%) IDU (N=55) 36 (65%) 16 (44%)
Missing Risk Factor (N=35) 18 (51%) 9 (50%)
African American (N=188) 119 (63%) 51 (43%) Caucasian (N=25) 20 (80%) 10 (50%) Hispanic (N=2) 1 (50%) 0 (0%)
For purposes of this report, the cross‐tabulations will serve as baselines for comparisons in future reviews. Some limitations to keep in mind include risk factor data is self‐reported, men with multiple risk factors were excluded from analysis, and only the last viral load value of the review period was recorded from the charts.

Baltimore City Health Department, Ryan White, CQM Outpatient Substance Abuse Report Page 11
ELIGIBILITY
All Ryan White clients must establish initial eligibility prior to the initiation of services. Residency and financial eligibility were documented in 62% and 58% of Part A charts respectively. These elements were poorly documented in MAI charts at 18% for both residency and financial documents. Eligibility has increased dramatically from 2006 when residency and financial requirements were 17% and 13% respectively, Figure 6.
Figure 6. Eligibility, N=221
Before services are rendered, clients must be provided with copies of policies and procedures. At least 84% of all policies were distributed to Part A clients and every policy was distributed to the MAI clients, Figure 7. Documentation of every policy has increased since 2006, (data not shown).
Figure 7. Policies, N=221
ADMISSIONS REQUIREMENTS
Upon admission, the program must establish an interview date falling within ten working days of the client’s initial contact. If an interview date is not established, the client must be referred or wait listed (COMAR 10.47.01.04). Less than half (48%) of Part A charts met this requirement, while all MAI charts did. Similarly, 86% of Part A charts documented an assessment prior to the initiation of treatment while all MAI charts had an assessment. Table 5 illustrates the elements required in the initial assessment and the proportion of Part A and MAI records containing the needed elements.
17% 13%
62% 58%
18% 18%
0%
20%
40%
60%
80%
100%
Residency Financial
2006
Part A
MAI
88% 94% 86% 84% 90%100% 100% 100% 100% 100%
0%
20%
40%
60%
80%
100%
Client Rights Confidentiality Grievance Release Informed Consent
Part A
MAI

Baltimore City Health Department, Ryan White, CQM Outpatient Substance Abuse Report Page 12
Overall, each element was documented at least 82% of the time. The Addiction Severity Index was completed for 78% of Part A clients and 88% of MAI clients.
Table 5. Assessment Elements, N=193
Assessment Element Part A (N=176) MAI (N=17) Physical 97% 82%
Employment 91% 100% Drug/Alcohol 99% 94%
Legal 90% 94% Family/Social 93% 100% Education 91% 100%
Mental Health 96% 94%
TREAMENT PLAN
COMAR regulation 10.47.01.04C requires that treatment plans be developed within seven days of admission to the program. In 2006, 49% of charts had a treatment plan developed. Today, 88% of Part A and all MAI records had a treatment plan, a marked increase. Socialization, psychological, vocation, education, legal, and family status were all documented less in 2010 than in 2006, however. CQM staff noticed some agencies did not have treatment plans in the charts or, if they were present, they were incomplete. Providers should develop more narrative within their treatment plans, customize them to the specific client needs, and limit the use of treatment plan templates. As one would expect, alcohol and drug use assessment was the most common treatment plan element seen in both Part A (99%) and MAI (100%) plans, Table 6.
Table 6. Treatment Plan Contents, N=196
Plan Element 2006 (N=100) Part A (N=179) MAI (N=17) Socialization 44% 28% 41%
Alcohol/Drug Use 92% 99% 100%Psychological 45% 36% 35%Vocation 41% 5% 0%Education 29% 7% 6%
Physical Health 46% 35% 53%Legal 44% 9% 0%Family 38% 8% 12%
Treatment plans are also required to identify long‐ and short‐term goals, strategies to reach stated goals, target dates, as well as document the services received, completion date, and whether clients were referred to any self‐help or ancillary services. Figure 8 shows that both Part A and MAI treatment plans recorded good documentation of client goals and also documented a schedule of services. Criteria for completion of the goals were better documented in MAI charts at 88% than Part A charts (41%). Documentation of criteria for successful completion of treatment, as well as documentation of goals both increased from 2006. Implementation of goals remained the same, however target dates for completion of goals decreased, (data not shown).

Baltimore City Health Department, Ryan White, CQM Outpatient Substance Abuse Report Page 13
Figure 8. Treatment Plan Interventions, N=196
New clients are also required to receive infectious disease education within the first thirty days of treatment. All 17 MAI clients and 147 Part A clients were new in fiscal year 2009. Figure 9 shows that a larger proportion of MAI clients received infectious disease education than Part A clients, 94% vs. 68% respectively. HIV risk assessments (94%), risk reduction counseling (88%), and referrals to counseling and testing (41%) were all seen at higher rates in MAI charts.
Figure 9. Infectious Disease Education, N=164
76% 66% 58%74%
41%
6%24%
100% 100% 76% 88% 88%
6%
53%
0%20%40%60%80%100%
Part A
MAI
68% 72%64%
28%
94% 94% 88%
41%
0%
20%
40%
60%
80%
100%
ID Education Risk Assessment Risk Reduction Counseling/Testing
Part A
MAI

Baltimore City Health Department, Ryan White, CQM Outpatient Substance Abuse Report Page 14
SECTION 4. EARLY INTERVENTION SERVICES
Early intervention services (EIS) are used to, “Treat patients who are, for a known reason, at risk for developing alcohol or other drug abuse or dependence but for whom there is not yet sufficient information to document alcohol or other drug abuse or dependence” (COMAR 10.47.02.03A). In the 2010 review, 27 clients received EIS; 19 were new clients and 8 were ongoing.
New Clients: Clients receiving EIS should be given an assessment within two weeks of admission and have a treatment plan developed within seven working days of the assessment, per COMAR 10.47.01.04. Seven (37%) new EIS clients had no assessment conducted. Figure 8 shows that 37% of clients also had an assessment completed within two weeks of admission and 26% had assessments completed more than two weeks after admission. Thirteen (68%) new clients had completed treatment plans. Of those, 38% were completed and signed by a counselor within seven days, 23% tool longer than seven days to complete, and 38% of plans had no signature present, Figures 8 & 9.
Figures 8 and 9. Intake Assessments and Treatment Plans, N=19
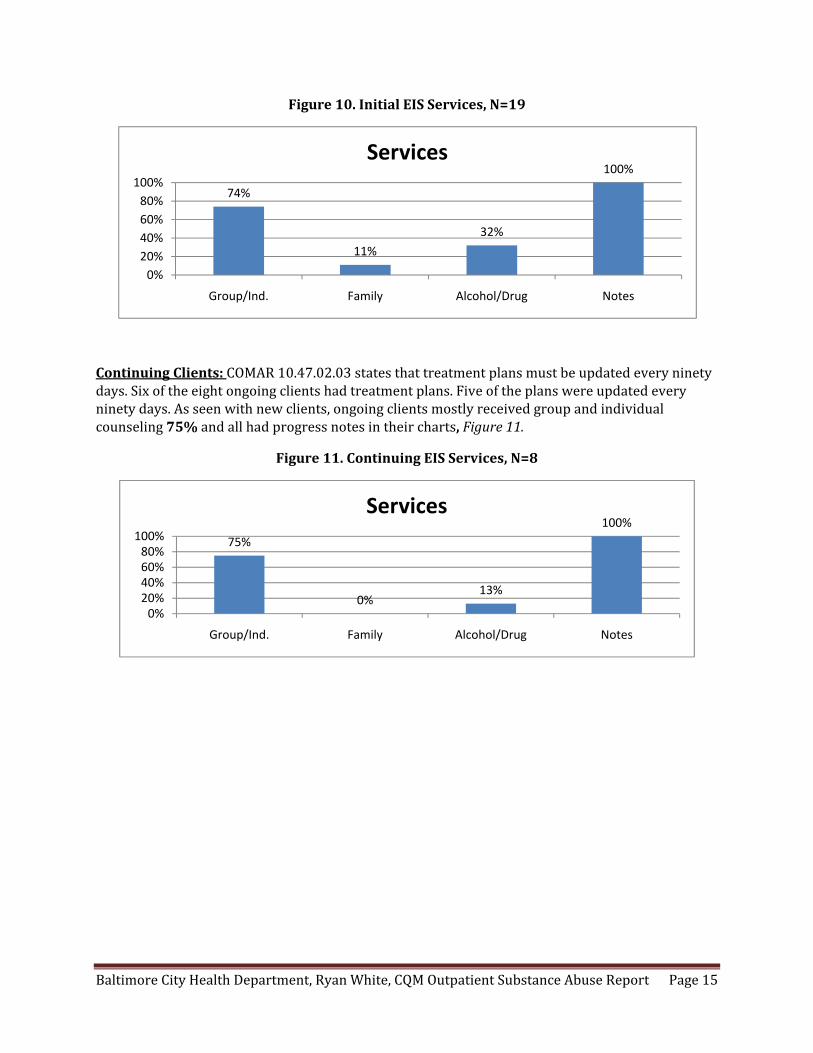
Figure 10 shows the EIS services of which 14 (74%) received group or individual counseling, 2 (11%) received family counseling, and 6 (32%) received alcohol and drug education. All 19 charts of new clients had progress notes indicating the services that were received.
37%26%
37%
0%20%40%60%80%
100%
< 2 Weeks > 2 Weeks Missing
Assessment
38%23%
38%
0%20%40%60%80%100%
< 7 Days > 7 Days No Signature
Plan
Baltimore City Health Department, Ryan White, CQM Outpatient Substance Abuse Report Page 15
Figure 10. Initial EIS Services, N=19
Continuing Clients: COMAR 10.47.02.03 states that treatment plans must be updated every ninety days. Six of the eight ongoing clients had treatment plans. Five of the plans were updated every ninety days. As seen with new clients, ongoing clients mostly received group and individual counseling 75% and all had progress notes in their charts, Figure 11.
Figure 11. Continuing EIS Services, N=8
74%
11%
32%
100%
0%
20%
40%
60%
80%
100%
Group/Ind. Family Alcohol/Drug Notes
Services
75%
0%13%
100%
0%20%40%60%80%100%
Group/Ind. Family Alcohol/Drug Notes
Services
Baltimore City Health Department, Ryan White, CQM Outpatient Substance Abuse Report Page 16
SECTION 5. LEVEL I OUTPATIENT SERVICES
Level I Outpatient Services (OP) include, “Evaluation and treatment to patients who require services for less than nine hours weekly” (COMAR 10.47.02.04A). Ninety one clients received OP services; 63 clients were new in the fiscal year and 28 were continuing clients.
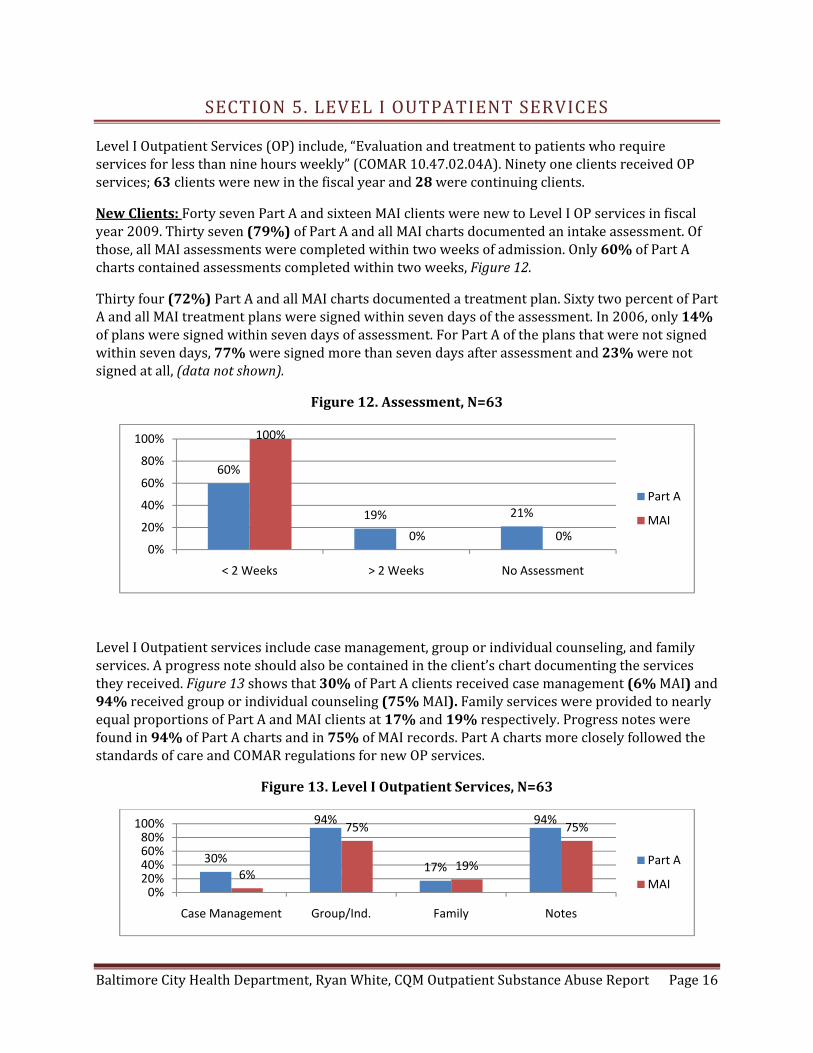
New Clients: Forty seven Part A and sixteen MAI clients were new to Level I OP services in fiscal year 2009. Thirty seven (79%) of Part A and all MAI charts documented an intake assessment. Of those, all MAI assessments were completed within two weeks of admission. Only 60% of Part A charts contained assessments completed within two weeks, Figure 12.
Thirty four (72%) Part A and all MAI charts documented a treatment plan. Sixty two percent of Part A and all MAI treatment plans were signed within seven days of the assessment. In 2006, only 14% of plans were signed within seven days of assessment. For Part A of the plans that were not signed within seven days, 77% were signed more than seven days after assessment and 23% were not signed at all, (data not shown).
Figure 12. Assessment, N=63
Level I Outpatient services include case management, group or individual counseling, and family services. A progress note should also be contained in the client’s chart documenting the services they received. Figure 13 shows that 30% of Part A clients received case management (6% MAI) and 94% received group or individual counseling (75% MAI). Family services were provided to nearly equal proportions of Part A and MAI clients at 17% and 19% respectively. Progress notes were found in 94% of Part A charts and in 75% of MAI records. Part A charts more closely followed the standards of care and COMAR regulations for new OP services.
Figure 13. Level I Outpatient Services, N=63
60%
19% 21%
100%
0% 0%0%
20%
40%
60%
80%
100%
< 2 Weeks > 2 Weeks No Assessment
Part A
MAI
30%
94%
17%
94%
6%
75%
19%
75%
0%20%40%60%80%100%
Case Management Group/Ind. Family Notes
Part A
MAI

Baltimore City Health Department, Ryan White, CQM Outpatient Substance Abuse Report Page 17
Continuing Clients: There were 28 ongoing clients for Outpatient services. Twenty six (93%) had a treatment plan and all had been updated. Twenty‐five percent of clients had documentation of case management services and just 18% documented family services. Most (89%) were involved in group or individual counseling and the same proportion had ongoing progress notes in their charts, Figure 14.
Figure 14. Continuing Level I Outpatient Services, N=28
25%
89%
18%
89%
0%20%40%60%80%100%
Case Management Group/Ind. Family Notes
Services

Baltimore City Health Department, Ryan White, CQM Outpatient Substance Abuse Report Page 18
SECTION 6. LEVEL II INTENSIVE OUTPATIENT SERVICES
COMAR 10.47.02.05A states that intensive outpatient services (IOP) are, “Structured outpatient evaluation and treatment” programs to patients requiring from “9 to20 hours weekly” for adults. Fifty three clients (52 Part A, 1 MAI) were new to intensive outpatient services and 26 Part A clients were continuing.
New Clients: The assessment for IOP must be completed within one week of admission. The MAI client assessment was completed within one week while 67% of the Part A charts met this one week criteria, (data not shown). Treatment plans are to be signed within five days of the assessment and were present in 98% of Part A charts and in the one MAI record as well. Fifty nine percent of Part A treatment plans were signed within five days, Figure 15.
Figure 15. Treatment Plans, N=53
Intensive outpatient services include case management, group counseling, individual counseling, and family services. A progress note should also be included in the chart. For the one MAI chart, no services were documented. A progress note was present, but did not indicate anything related to IOP. For the 52 Part A charts, 42% contained evidence of case management services, 96% documented group counseling, 77% individual counseling, and 15% also showed family services. All Part A charts contained progress notes as well, Figure 16.
Figure 16. Level II IOP Services, N=52
98%
59%
29%
12%
100% 100%
0% 0%0%
20%
40%
60%
80%
100%
Plan Signed < 5 Days Signed > 5 Days Not Signed
Part A
MAI
42%
96%
77%
15%
100%
0%
20%
40%
60%
80%
100%
Case Management
Group Individual Family Notes
Services
Baltimore City Health Department, Ryan White, CQM Outpatient Substance Abuse Report Page 19
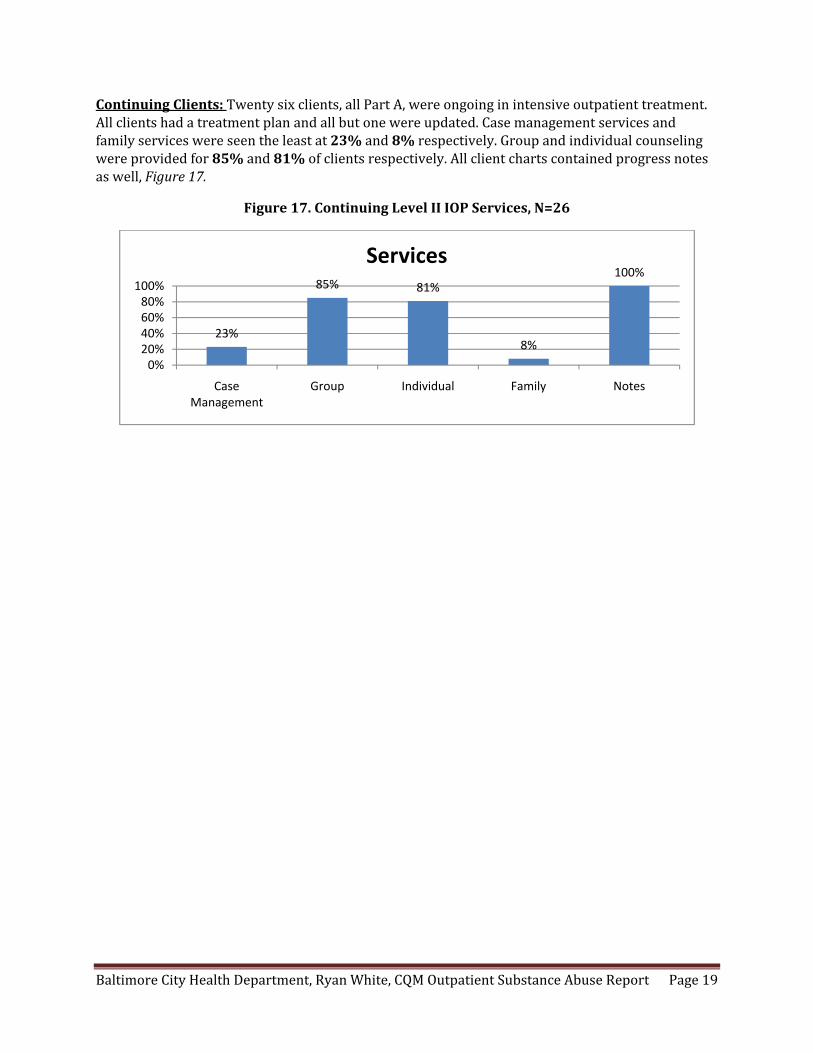
Continuing Clients: Twenty six clients, all Part A, were ongoing in intensive outpatient treatment. All clients had a treatment plan and all but one were updated. Case management services and family services were seen the least at 23% and 8% respectively. Group and individual counseling were provided for 85% and 81% of clients respectively. All client charts contained progress notes as well, Figure 17.
Figure 17. Continuing Level II IOP Services, N=26
23%
85% 81%
8%
100%
0%20%40%60%80%100%
Case Management
Group Individual Family Notes
Services

Baltimore City Health Department, Ryan White, CQM Outpatient Substance Abuse Report Page 20
SECTION 7. MEDICATION ASSISTED TREATMENT
Medication assisted treatment (MAT) services are defined as, “Treatment, support and recovery for opioid‐addicted patients using pharmacological interventions, including but not limited to methadone and Buprenorphine.” Thirty two clients received MAT services. Of those, 19 were new clients and 13 were continuing clients.
New Clients: Sixteen Part A clients and 3 MAI clients were new to MAT services. Per COMAR 10.47.02.11, clients receiving MAT must be randomly tested at least monthly for benzodiazepines, marijuana, cocaine, opiates, alcohol, and methadone. In this sample, clients were drug tested monthly for between one to nine months. On average, each client received three drug screenings. All clients were tested at least once and when looking only at the last drug screen of the review period, Table 7 shows how many clients were screened for each substance and how many were positive. The three MAI clients are collapsed into this analysis.
Table 7. New Client Drug Screen Results, N=19
Drug # Screened # Positive Benzodiazepines 4 2
Marijuana 16 3 Cocaine 18 8 Opiates 18 8 Alcohol 13 0
Methadone 17 10
With the exception of methadone, if the client receives any positive screenings, agencies should intervene. A total of 12 clients had at least one positive drug screen. Of those, 7 (58%) received some type of clinical intervention. Five (42%) of the positive clients continued to use drugs. Of the eight clients (67%) positive for opiates none received a methadone dosage increase, and one (13%) received behavioral therapy.
One (5%) new client required detoxification services, but the chart did not contain a detox schedule as required by COMAR. No clients required an administrative detox.
Eight (42%) clients received take‐home privileges but only one (13%) of them met the take‐home criteria. Eighteen (95%) new clients on MAT had progress notes in their charts.
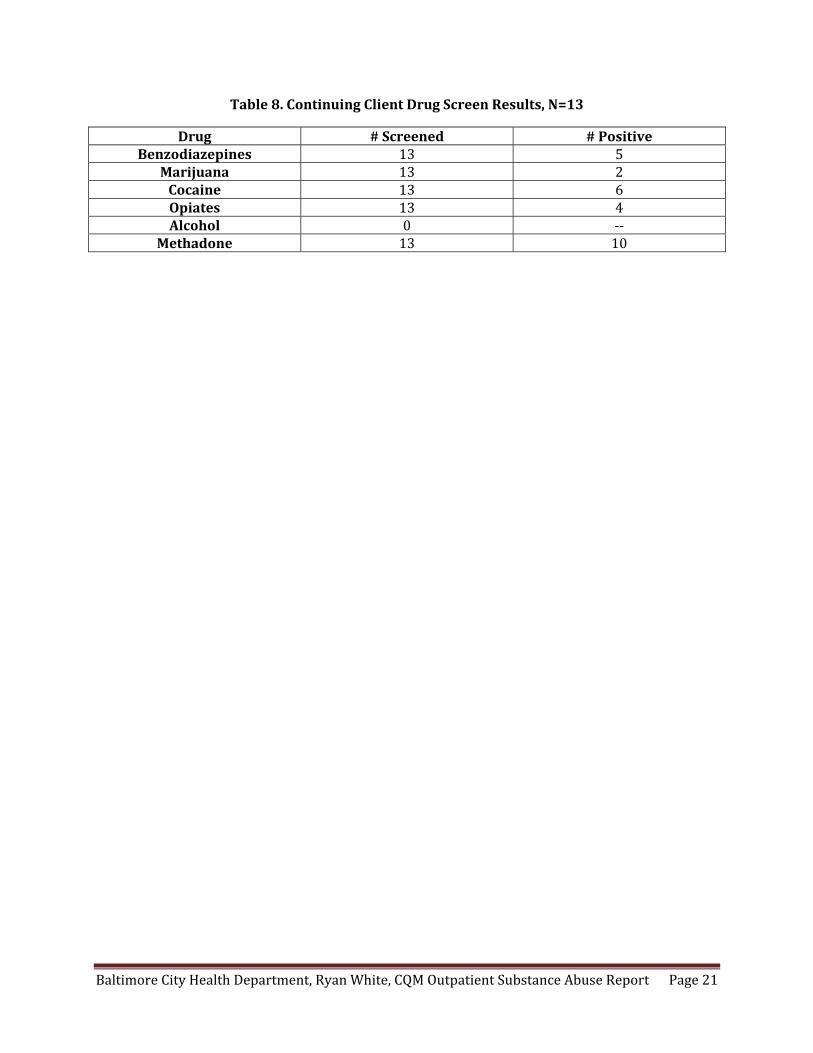
Continuing Clients: Thirteen clients, all Part A, were ongoing in MAT services. Clients received drug screenings between once per year to once per month; on average each client received 8 drug screens. Again all clients were drug screened at least once and when looking at the last drug screen of the review period, Table 8 shows the number of clients screened for each substance and the number who were positive. Each client screened positive for at least one substance. With the exception of methadone 11 (85%) clients had a positive drug screening; of these, 6 (46%) received an intervention. Three continued to use drugs and 1 of those received behavioral therapy.
One continuing client required detoxification services, but the chart did not contain a detox schedule. No clients required an administrative detox.
Baltimore City Health Department, Ryan White, CQM Outpatient Substance Abuse Report Page 21
Table 8. Continuing Client Drug Screen Results, N=13
Drug # Screened # Positive Benzodiazepines 13 5
Marijuana 13 2 Cocaine 13 6 Opiates 13 4 Alcohol 0 ‐‐
Methadone 13 10

Baltimore City Health Department, Ryan White, CQM Outpatient Substance Abuse Report Page 22
SECTION 8. OTHER SERVICES
Per COMAR 10.47.01.04, a program may provide education and support services to a patient’s family. Of the 221 clients receiving outpatient substance abuse treatment, no families were given education and support services. However, 20 clients (20 Part A, 2 MAI) indicated they wanted family involvement in their treatment.
Forty seven (21%) clients received referrals to other services. Referrals are required to contain the reason for referral, the client’s name, referring and receiving program, as well as the final disposition of the referral. Most (91%) referrals gave a reason, 87% contained the client’s name, 94% documented the referring program, and 87% the receiving program. Just 30% documented the final disposition of the referral. Reasons for referrals included mental health (17%), additional substance abuse treatment (28%), legal referrals (2%), medical examination (34%), and transportation (2%). Other reasons included dental services, home delivery of medications, and housing services.
Nearly half (47%) of clients were discharged from treatment compared to just 18% in 2006. Of the 104 charts showing a discharge, 100 (96%) contained a discharge summary. Most (89%) were completed within the required thirty days. Discharge summaries are required to contain the reason for admission, reason for discharge, address, services the client received, diagnosis and prognosis at discharge, medications, continuing service recommendations, summary of the transition process, and the extent of the client’s involvement in the plan. Table 9 shows the rates these discharge requirements were met in the 2006 and 2010 reviews. Virtually all elements improved over the past four years with the exception of the summary of the transition process.
Table 9. Discharge Summary Elements, N=100
Discharge Element 2006 2010 Reason for Admission 58% 74%Reason for Discharge 100% 100%
Client Address 0% 74%Summary of Services 61% 85%
Diagnosis and Prognosis 49% 96%Current Medications 0% 54%
Continuing Service Recommendations 46% 85%Summary of Transition Process 32% 21%
Client Involvement 16% 48%
In the event that the client is transferred to another program, a transfer summary must be completed at discharge. It should include the reason for admission and discharge, client’s address, diagnosis and prognosis at discharge, and current medications. Six (3%) clients were transferred to another program. Three (50%) of the summaries were completed at discharge. Three (50%) also contained the reason for admission, the reason for discharge, the address, and diagnosis and prognosis at discharge. Two of the summaries contained the client’s current medications.

Baltimore City Health Department, Ryan White, CQM Outpatient Substance Abuse Report Page 23
SECTION 9. CONSUMER SURVEYS
Consumers for the substance abuse survey were directly recruited from the Ryan White agencies. Consumers were surveyed about their substance abuse service experiences during the past twelve months. A total of 52 substance abuse consumers were interviewed at eleven sites. Survey questions were administered by a consultant interviewer either in‐person or by telephone. The consumers represent a convenience sample and consent for permission to contact clients by telephone was obtained prior to calling individual clients. Note, results may total above or below 100% due to rounding and all survey participants were 18 years of age or older. The following 22 items were asked and Figures 1825 display the consumer assessment of the quality of services.
1. When I needed an appointment, I could see my substance abuse counselors soon enough for my needs. Most (83%) consumers reported “all of the time,” 6 (12%) reported “most times,” and 3 (6%) reported “sometimes.”
2. My substance use counselors were responsible and professional. Most (79%) consumers reported “all of the time,” 10 (19%) reported “most times,” and 1 (2%) reported “sometimes.”
3. My substance use counselors knew about both substance use and HIV, Figure 18.
Figure 18. N=52
4. I found it hard to relate to my substance use counselors, Figure 19.
Figure 19. N=52
2%
2%
4%
27%
65%
0% 20% 40% 60% 80% 100%
I Don't Know
Rarely
Sometimes
Most Times
All of the Time
SA & HIV
79%
4%
9%
6%
2%
0% 20% 40% 60% 80% 100%
Never
Rarely
Sometimes
Most Times
All of the Time
Relate
Baltimore City Health Department, Ryan White, CQM Outpatient Substance Abuse Report Page 24
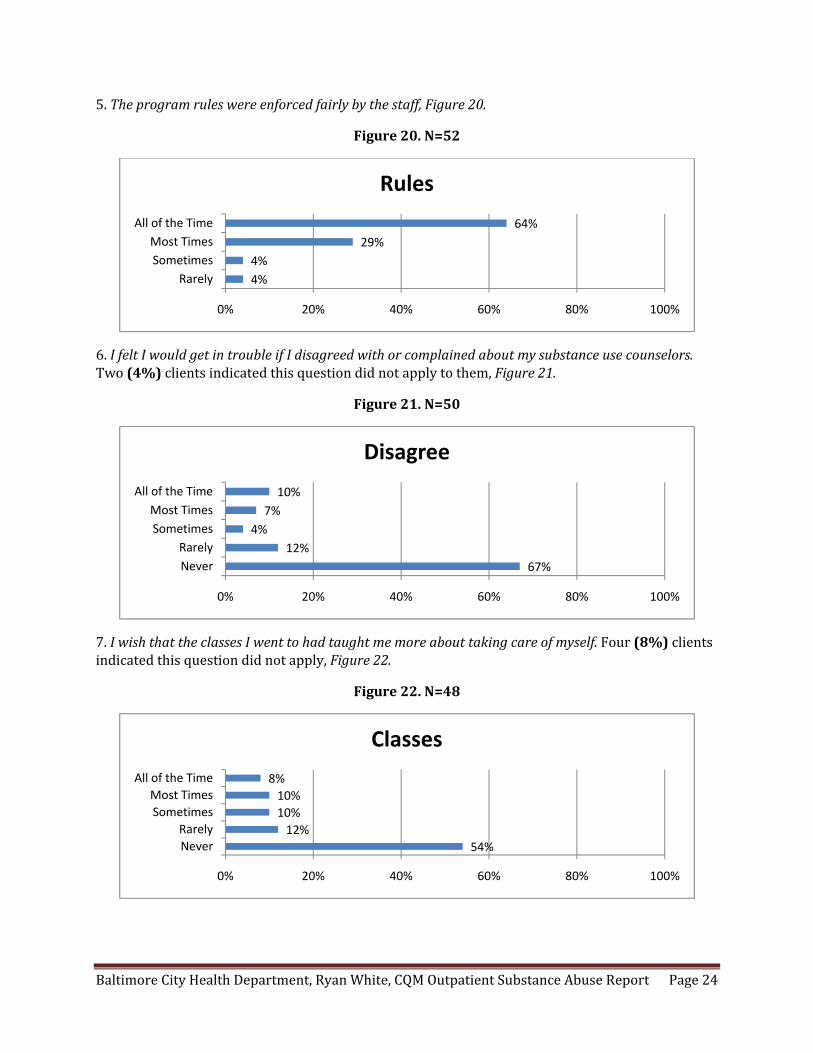
5. The program rules were enforced fairly by the staff, Figure 20.
Figure 20. N=52
6. I felt I would get in trouble if I disagreed with or complained about my substance use counselors. Two (4%) clients indicated this question did not apply to them, Figure 21.
Figure 21. N=50
7. I wish that the classes I went to had taught me more about taking care of myself. Four (8%) clients indicated this question did not apply, Figure 22.
Figure 22. N=48
4%
4%
29%
64%
0% 20% 40% 60% 80% 100%
Rarely
Sometimes
Most Times
All of the Time
Rules
67%
12%
4%
7%
10%
0% 20% 40% 60% 80% 100%
Never
Rarely
Sometimes
Most Times
All of the Time
Disagree
54%
12%
10%
10%
8%
0% 20% 40% 60% 80% 100%
Never
Rarely
Sometimes
Most Times
All of the Time
Classes
Baltimore City Health Department, Ryan White, CQM Outpatient Substance Abuse Report Page 25
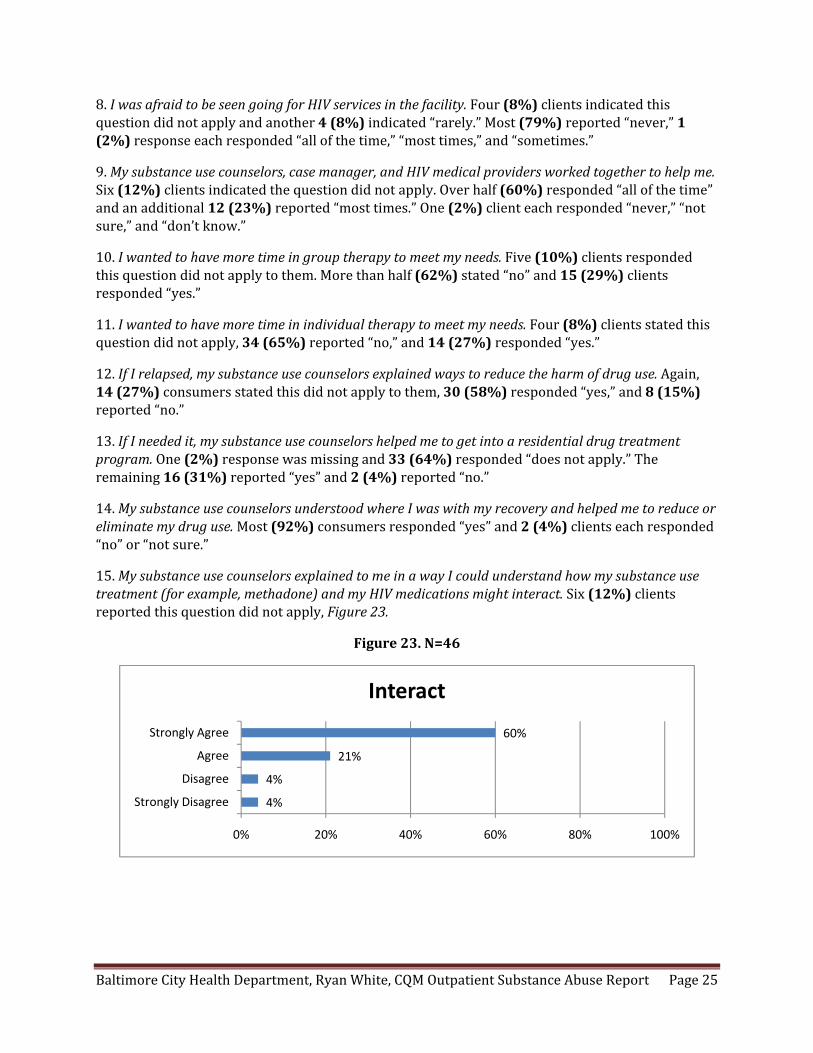
8. I was afraid to be seen going for HIV services in the facility. Four (8%) clients indicated this question did not apply and another 4 (8%) indicated “rarely.” Most (79%) reported “never,” 1 (2%) response each responded “all of the time,” “most times,” and “sometimes.”
9. My substance use counselors, case manager, and HIV medical providers worked together to help me. Six (12%) clients indicated the question did not apply. Over half (60%) responded “all of the time” and an additional 12 (23%) reported “most times.” One (2%) client each responded “never,” “not sure,” and “don’t know.”
10. I wanted to have more time in group therapy to meet my needs. Five (10%) clients responded this question did not apply to them. More than half (62%) stated “no” and 15 (29%) clients responded “yes.”
11. I wanted to have more time in individual therapy to meet my needs. Four (8%) clients stated this question did not apply, 34 (65%) reported “no,” and 14 (27%) responded “yes.”
12. If I relapsed, my substance use counselors explained ways to reduce the harm of drug use. Again, 14 (27%) consumers stated this did not apply to them, 30 (58%) responded “yes,” and 8 (15%) reported “no.”
13. If I needed it, my substance use counselors helped me to get into a residential drug treatment program. One (2%) response was missing and 33 (64%) responded “does not apply.” The remaining 16 (31%) reported “yes” and 2 (4%) reported “no.”
14. My substance use counselors understood where I was with my recovery and helped me to reduce or eliminate my drug use. Most (92%) consumers responded “yes” and 2 (4%) clients each responded “no” or “not sure.”
15. My substance use counselors explained to me in a way I could understand how my substance use treatment (for example, methadone) and my HIV medications might interact. Six (12%) clients reported this question did not apply, Figure 23.
Figure 23. N=46
4%
4%
21%
60%
0% 20% 40% 60% 80% 100%
Strongly Disagree
Disagree
Agree
Strongly Agree
Interact

Baltimore City Health Department, Ryan White, CQM Outpatient Substance Abuse Report Page 26
16. My substance use counselors helped me to achieve my substance use treatment plan goals, Figure 24.
Figure 24. N=52
17. Clients should have had more help in transitioning out of the program, Figure 25.
Figure 25. N=52
18. The program helped me to feel better about myself. Two thirds (69%) of clients responded “strongly agree,” 13 (25%) responded “agree,” and 3 (6%) “disagree.”
19. The program helped me to reduce my substance use. Similarly, 33 (64%) clients reported “strongly agree,” 18 (35%) reported “agree,” and 1 (2%) “disagree.”
20. If I knew someone who was HIVpositive and had a substance use problem, I would refer her or him to this program for help. Most (90%) clients reported “definitely yes” and 3 (6%) reported “not sure.” One (2%) client each reported “maybe” and “definitely not.”
21. Overall, I am satisfied with the substance use services I received over the past 12 months. Most consumers responded either “strongly agree” (71%) or “agree” (25%). Two (4%) clients reported “disagree.”
22. (Methadone maintenance only) The dispensing line was too slow. This question did not apply to 41 consumers. Of the remaining clients, 6 (55%) responded “sometimes” and 3 (27%) stated “rarely.” One (9%) client each responded “all of the time” and “never.”
17%2%4%
21%56%
0% 20% 40% 60% 80% 100%
No PlanStrongly Disagree
DisagreeAgree
Strongly Agree
Goals
54%
13%
12%
12%
10%
0% 20% 40% 60% 80% 100%
I Don't Know
Strongly Disagree
Disagree
Agree
Strongly Agree
Transitioning

Baltimore City Health Department, Ryan White, CQM Outpatient Substance Abuse Report Page 27
SECTION 10. QI ORGANIZATIONAL ASSESSMENT
Ten agencies, including one with both inpatient and outpatient services, completed the organizational assessment. The 15 items covered the programs’ quality structure, planning, performance measurement, improvement activities, staff involvement, consumer involvement, evaluation, and data systems. The survey was administered by CQM staff and agencies were asked to score themselves on a scale from 0‐5 where 0 was the lowest score and 5 the highest. Agencies were asked to provide an explanation of each ranking and, where backup documentation was available, it was reviewed. Each question is presented along with the average score. Figures 26A & 26B show the average scores per item across substance abuse treatment programs.
SECTION A. QUALITY STRUCTURE
1. Does the HIV program have an organizational structure to assess and improve the quality of care? – Average score 4.2. Overall, most agencies had regular quarterly meetings attended by clinicians and multidisciplinary representation who were involved in the process.
2. Were appropriate resources committed to support the HIV quality program? – Average score 4.2. Most agencies reported that key staff had allotted time for QI activities and that their programs were headed by a full time quality manager.
3. Did the HIV leadership support the HIV quality program? – Average score 4.2. Most agencies report that HIV program leadership set quality priorities and established a commitment to quality.
4. Does the HIV quality program have a comprehensive quality plan? – Average score 3.8. Written quality management plans existed at most agencies. Plans were updated annually but all staff members were not involved in the plan’s development or update.
SECTION B. QUALITY PLANNING
1. Were annual goals established for the HIV quality program? – Average score 4.1. Annual goals are discussed by the HIV quality committee and were based on past performance. However, quality goals were not always communicated to all staff nor were all staff involved in the selection process for the goals.
2. Does the HIV program have clearly described roles and responsibilities for the HIV quality program? – Average score 3.8. Many agencies report that key roles and responsibilities are described for the quality program. There is some staff involvement in the design of these roles and responsibilities.
3. Is there a document in place to specify timelines for the implementation of the HIV quality program? – Average score 3.8. Agencies report that work plans and timelines are in place and are updated periodically. Some staff are aware of the work plan.

Baltimore City Health Department, Ryan White, CQM Outpatient Substance Abuse Report Page 28
SECTION C. QUALITY PERFORMANCE MEASUREMENT
1. Were appropriate quality indicators selected in the HIV quality program? – Average score 3.8. Agencies selected indicators based on results of their quality initiatives and were reflective of the standards of care. Staff were not always involved in the development of the indicators.
2. Did the HIV program routinely measure the quality of care? – Average score 3.8. Performance measurement was completed with the input of most staff with the results reviewed by a quality committee. The process of performance measurement was described to some extent, but action may not have been taken on the results.
SECTION D. QUALITY IMPROVEMENT ACTIVITIES
1. Did the HIV program conduct quality projects to improve the quality of care? – Average score 4.1. A score of 4 indicates that quality improvement activities focused on processes and that projects were based on data. Findings were submitted to the quality committee and at least one data‐driven quality improvement project was completed.
2. Was a team approach utilized to improve specific quality aspects? – Average score 4.2. Team approaches were common among agencies surveyed. All staff had a basic knowledge about the QI team approach and basic methodologies including PDSAs and root‐cause analyses. Team approaches were used to identify and address complex quality issues.
SECTION E. STAFF INVOLVEMENT
1. Does the HIV program routinely engage staff in quality program activities? – Average score 4.2. Nearly all staff members are involved in quality activities and some may attend annual quality trainings and participate in quality projects. Staff members are most knowledgeable about quality principles and may participate in identifying priorities and goals for the quality program.
SECTION F. CONSUMER INVOLVEMENT
1. Are consumers involved in quality related activities? – Average score 3.7. Agencies report that patient needs are assessed and discussed in quality meetings. These findings are not always integrated into the quality program. Results of quality activities are not always shared with consumers.
SECTION G. EVALUATION OF QUALITY PROGRAM
1. Is a process in place to evaluate the HIV quality program? – Average score 4. The quality program is reviewed using a team approach and the results may be used to plan ahead for the future. Past results may be used to update the work plan, annual goals, and timelines.

Baltimore City Health Department, Ryan White, CQM Outpatient Substance Abuse Report Page 29
SECTION H. CLINICAL INFORMATION SYSTEMS
1. Does the HIV program have an information system in place to track patient care and measure quality? – Average score 4.3. Most agencies report having a functional information system to track patient care and produce reports. Some of the data collected are used for quality activities.
Figures 26A and 26B. QI Organizational Assessment, N=10
3.8
3.8
4.1
3.8
4.2
4.2
4.2
0 1 2 3 4 5
Timelines
Responsibilities
Annual Goals
Quality Plan
HIV Leadership
Resources
Org. Structure
OA
4.3
4
3.7
4.2
4.2
4.1
3.8
3.8
0 1 2 3 4 5
Info. System
Evaluation
Ct. Involvement
Staff Involvement
Team Approach
Quality Projects
Measurement
Indicators
OA

Baltimore City Health Department, Ryan White, CQM Outpatient Substance Abuse Report Page 30
SECTION 11. SUMMARY OF FINDINGS
The CQM process provided a systematic review of compliance to the EMA standards of care for 11 agencies providing outpatient substance abuse services under Ryan White Part A and MAI during fiscal year 2009. A total of 221 substance abuse charts were reviewed, representing approximately 63% of outpatient clients receiving services in 2009. Following are both strengths and areas for improvement from the review of outpatient substance abuse services.
Strengths Demographics, insurance coverage, and HIV status were all documented at high rates. Agency policies were also routinely provided to Ryan White clients. In general, admissions requirements were met, treatment planning was conducted including developing goals, implementation strategies, and service documentation, and referrals were documented as well. Discharge summaries were also conducted within the timeframe required.
In terms of early intervention services, treatment planning including signatures, progress notes, and group and individual counseling were all documented at high rates. Ongoing EIS clients’ treatment plans were also updated at good rates. Level I outpatient clients had strong assessments, timely signed treatment plans, appropriate progress notes, and documentation of both group and individual counseling sessions. Ongoing outpatient clients also had their treatment plans updated on a regular basis. Level II intensive outpatient clients also had signed treatment plans within the required timeframes, group and individual counseling and appropriate progress notes. Ongoing IOP clients also had updated treatment plans as well. New methadone clients had appropriate drug screenings and services documented in progress notes. Finally, consumers reported a high level of satisfaction with the substance abuse services received and agencies for the most part have functional continuous quality improvement practices in place.
Areas for Improvement Risk factor, HIV labs, and treatment status with HAART were all missing in many substance abuse records. This information is helpful in tracking the trends of the HIV epidemic in Baltimore and ensuring client engagement in primary medical care.
Specific to substance abuse services, many treatment plans focused on drug use exclusively. Documentation of socialization, psychological issues, vocational challenges, educational needs, physical health, legal status, and family issues were not well incorporated into the treatment plans. Plans should address each element as determined by client need as stipulated in COMAR. In terms of treatment plan interventions, target dates for completion of goals and the criteria for successful completion of treatment were also not well documented. For new clients, infectious disease education and risk reduction counseling are required, but not consistently seen.
Specific to early intervention services, assessments for new clients are required and should be completed within two weeks of admission. Documentation that clients received drug and alcohol education and family services were also low. For Level I outpatient services, the completion of intake assessments within two weeks for new clients was low. For Level II intensive outpatient services, case management and family services were not seen for most IOP clients. Finally for continuing methadone clients, on average only eight drug screens were completed over the course of a year of treatment, less than the monthly urinalysis required. Also, clients testing positive for substances did not always receive a clinical intervention.
Baltimore City Health Department, Ryan White, CQM Outpatient Substance Abuse Report Page 31
SECTION 12. DISCUSSION AND RECOMMENDATIONS
Baltimore City Health Department: The CQM program held a technical assistance session with the substance abuse providers on March 17th, 2011. During this session, chart abstraction, consumer, and agency data were presented to attendees. Strengths and areas for improvement were identified and presented to the group. After prioritizing the data presented, providers were broken into teams and they utilized quality improvement tools to brainstorm an improvement project. Providers ranked data and used a fishbone diagram to identify root causes of low performing indicators. Participants then used the Plan, Do, Study, Act (PDSA) cycle to plan an improvement project specific to their individual agencies. After returning to their agencies, providers were instructed to share their QI project and form an improvement project team for implementation.
In addition, each agency receiving a substance abuse review in 2010 will receive a vendor report that compares their performance to that of the EMA. Each vendor report identifies specific areas of improvement required by the agency and that the agency submits documentation of an improvement project addressing the issues identified.
Providers: Providers must ensure proper documentation of client risk factor, HIV labs, and treatment status with HAART. At minimum, attempts to gather this clinical information should be contained within the client chart. Treatment plans should be initiated and completed for each client and each element outlined in COMAR should be assessed for potential goals. Interventions and strategies should also be incorporated into treatment plans. In general, assessments and treatment plans must be initiated and completed in the applicable timeframes dependent on the level of care. Finally, methadone clients must receive monthly drug screening as required by COMAR.
Planning Council: Since January, 2010, Primary Adult Care (PAC) has extended coverage to substance abuse services to include assessment, methadone, intensive outpatient services, group, individual, and family counseling services. Providers experienced a decrease in Ryan White enrollment as a result of PAC. The planning council should consider how this will affect the need for funding in the substance abuse categories moving forward. The planning council should also emphasize the eligibility requirements for substance abuse services in the standards of care. Particularly for agencies referring to sub‐recipients, while an initial eligibility certification may accompany the referral, all agencies are responsible for eligibility re‐determinations every six months and specific documentation must be collected and maintained in the client chart. A list of acceptable documents to establish initial and ongoing client eligibility may be obtained by request from the Ryan White Office at any time.

Baltimore City Health Department, Ryan White, CQM Outpatient Substance Abuse Report Page 32
Appendix A: Outpatient Substance Abuse Standards of Care