subsonic aerodynamic characteristics of semispan ... · subsonic aerodynamic characteristics of...
TRANSCRIPT
NASA Technical Paper 3427
Subsonic Aerodynamic Characteristics ofSemispan Commercial Transport Model WithWing-Mounted Advanced Ducted PropellerOperating in Reverse Thrust
Zachary T. Applin, Kenneth M. Jones, Brenda E. Gile, and P. Frank Quinto
July 1994
https://ntrs.nasa.gov/search.jsp?R=19940032994 2020-04-28T01:09:11+00:00Z
NASA Technical Paper 3427
Subsonic Aerodynamic Characteristics ofSemispan Commercial Transport Model WithWing-Mounted Advanced Ducted PropellerOperating in Reverse ThrustZachary T. Applin, Kenneth M. Jones, Brenda E. Gile, and P. Frank QuintoLangley Research Center � Hampton, Virginia
National Aeronautics and Space AdministrationLangley Research Center � Hampton, Virginia 23681-0001
July 1994
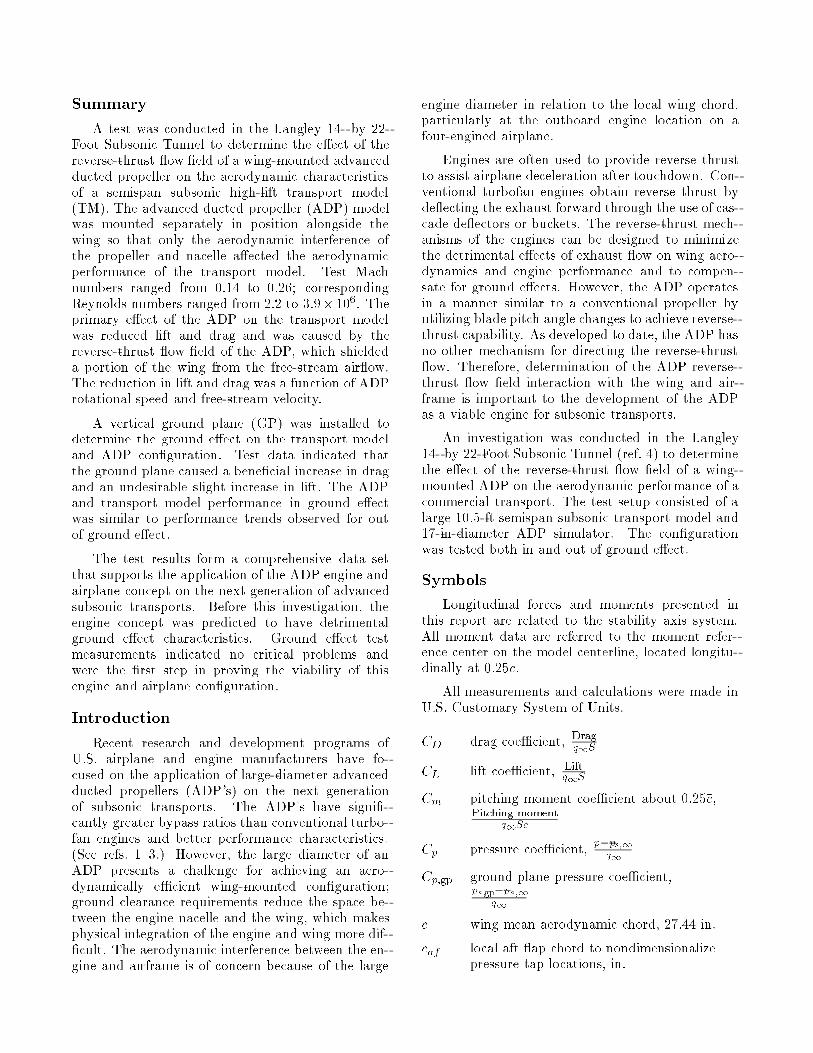
Summary
A test was conducted in the Langley 14- by 22-Foot Subsonic Tunnel to determine the e�ect of thereverse-thrust ow �eld of a wing-mounted advancedducted propeller on the aerodynamic characteristicsof a semispan subsonic high-lift transport model(TM). The advanced ducted propeller (ADP) modelwas mounted separately in position alongside thewing so that only the aerodynamic interference ofthe propeller and nacelle a�ected the aerodynamicperformance of the transport model. Test Machnumbers ranged from 0.14 to 0.26; correspondingReynolds numbers ranged from 2.2 to 3:9�106. Theprimary e�ect of the ADP on the transport modelwas reduced lift and drag and was caused by thereverse-thrust ow �eld of the ADP, which shieldeda portion of the wing from the free-stream air ow.The reduction in lift and drag was a function of ADProtational speed and free-stream velocity.
A vertical ground plane (GP) was installed todetermine the ground e�ect on the transport modeland ADP con�guration. Test data indicated thatthe ground plane caused a bene�cial increase in dragand an undesirable slight increase in lift. The ADPand transport model performance in ground e�ectwas similar to performance trends observed for outof ground e�ect.
The test results form a comprehensive data setthat supports the application of the ADP engine andairplane concept on the next generation of advancedsubsonic transports. Before this investigation, theengine concept was predicted to have detrimentalground e�ect characteristics. Ground e�ect testmeasurements indicated no critical problems andwere the �rst step in proving the viability of thisengine and airplane con�guration.
Introduction
Recent research and development programs ofU.S. airplane and engine manufacturers have fo-cused on the application of large-diameter advancedducted propellers (ADP's) on the next generationof subsonic transports. The ADP's have signi�-cantly greater bypass ratios than conventional turbo-fan engines and better performance characteristics.(See refs. 1{3.) However, the large diameter of anADP presents a challenge for achieving an aero-dynamically e�cient wing-mounted con�guration;ground clearance requirements reduce the space be-tween the engine nacelle and the wing, which makesphysical integration of the engine and wing more dif-�cult. The aerodynamic interference between the en-gine and airframe is of concern because of the large
engine diameter in relation to the local wing chord,particularly at the outboard engine location on afour-engined airplane.
Engines are often used to provide reverse thrustto assist airplane deceleration after touchdown. Con-ventional turbofan engines obtain reverse thrust byde ecting the exhaust forward through the use of cas-cade de ectors or buckets. The reverse-thrust mech-anisms of the engines can be designed to minimizethe detrimental e�ects of exhaust ow on wing aero-dynamics and engine performance and to compen-sate for ground e�ects. However, the ADP operatesin a manner similar to a conventional propeller byutilizing blade pitch angle changes to achieve reverse-thrust capability. As developed to date, the ADP hasno other mechanism for directing the reverse-thrust ow. Therefore, determination of the ADP reverse-thrust ow �eld interaction with the wing and air-frame is important to the development of the ADPas a viable engine for subsonic transports.
An investigation was conducted in the Langley14- by 22-Foot Subsonic Tunnel (ref. 4) to determinethe e�ect of the reverse-thrust ow �eld of a wing-mounted ADP on the aerodynamic performance of acommercial transport. The test setup consisted of alarge 10.5-ft semispan subsonic transport model and17-in-diameter ADP simulator. The con�gurationwas tested both in and out of ground e�ect.
Symbols
Longitudinal forces and moments presented inthis report are related to the stability axis system.All moment data are referred to the moment refer-ence center on the model centerline, located longitu-dinally at 0.25�c.
All measurements and calculations were made inU.S. Customary System of Units.
CD drag coe�cient, Drag
q1S
CL lift coe�cient, Lift
q1S
Cm pitching moment coe�cient about 0.25�c,Pitching moment
q1Sc
Cp pressure coe�cient,p�ps;1q1
Cp;gp ground plane pressure coe�cient,ps;gp�ps;1
q1
�c wing mean aerodynamic chord, 27.44 in.
caf local aft ap chord to nondimensionalizepressure tap locations, in.
cmf local main ap chord to non-dimensionalize pressure taplocations, in.
cs local slat chord to nondimensionalizepressure tap locations, in.
cw local cruise wing chord to non-dimensionalize pressure taplocations, in.
L=D lift-drag ratio, CL
CD
M1 free-stream Mach number
n boundary layer rake total pressure probenumber (n = 1; 2; 3; : : : ; 52)
p wing pressure, psf
patm atmospheric reference pressure, psf
ps;gp ground plane static pressure, psf
ps;1 free-stream static pressure, psf
pt;n boundary layer rake total pressure, psf
qgp e�ective dynamic pressure to calculateground plane velocity, psf
q1 reference dynamic pressure to charac-terize ow conditions with ground planeinstalled, psf
q1 free-stream dynamic pressure, psf
R Reynolds number based on wing meanaerodynamic chord
S semispan wing reference area, 23.075 ft2
s distance of pressure tap from groundplane leading edge, in.
T temperature, �F
ugp velocity from ground plane pres-sure, ft/sec
un velocity from boundary layer rake pres-sure, ft/sec
uq1 velocity determined from q1 dynamicpressure, ft/sec
u1 free-stream velocity, ft/sec
x chord station of pressure tap relative toleading edge, in.
z height of boundary layer rake pressureprobe above tunnel oor, in.
� angle of attack, deg
�ADP ADP blade pitch angle, deg
� incremental value
�wall wall ap de ection angle, deg
� nondimensional semispan station
� free-stream density, slugs/ft3
Abbreviations:
ADP advanced ducted propeller
AF axial force
BL boundary layer
GP ground plane
NF normal force
PM pitching moment
RM rolling moment
SF side force
TM transport model
YM yawing moment
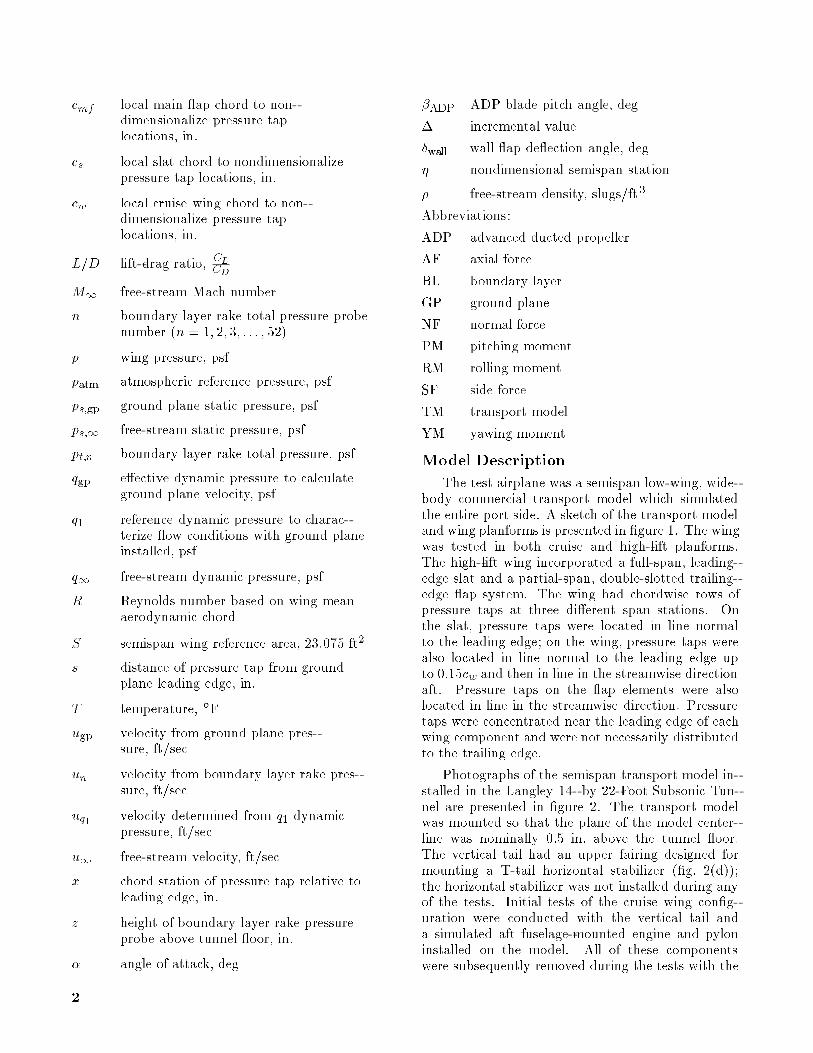
Model Description
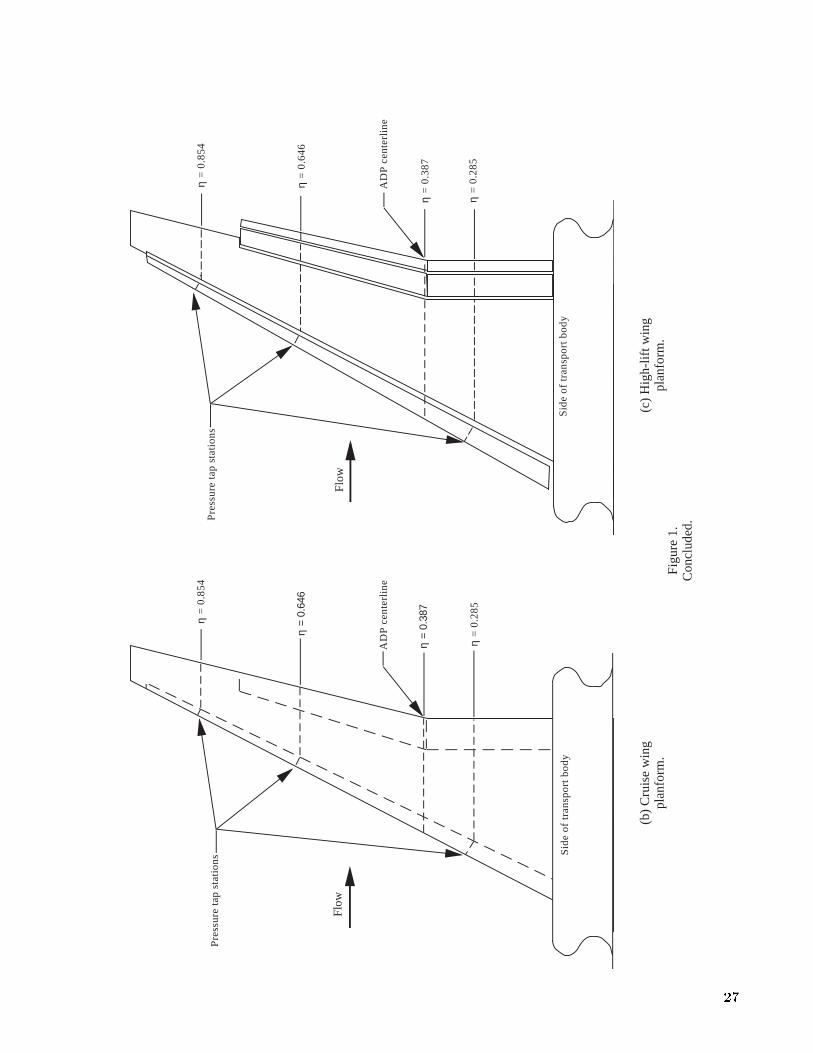
The test airplane was a semispan low-wing, wide-body commercial transport model which simulatedthe entire port side. A sketch of the transport modeland wing planforms is presented in �gure 1. The wingwas tested in both cruise and high-lift planforms.The high-lift wing incorporated a full-span, leading-edge slat and a partial-span, double-slotted trailing-edge ap system. The wing had chordwise rows ofpressure taps at three di�erent span stations. Onthe slat, pressure taps were located in line normalto the leading edge; on the wing, pressure taps werealso located in line normal to the leading edge upto 0:15cw and then in line in the streamwise directionaft. Pressure taps on the ap elements were alsolocated in line in the streamwise direction. Pressuretaps were concentrated near the leading edge of eachwing component and were not necessarily distributedto the trailing edge.
Photographs of the semispan transport model in-stalled in the Langley 14- by 22-Foot Subsonic Tun-nel are presented in �gure 2. The transport modelwas mounted so that the plane of the model center-line was nominally 0.5 in. above the tunnel oor.The vertical tail had an upper fairing designed formounting a T-tail horizontal stabilizer (�g. 2(d));the horizontal stabilizer was not installed during anyof the tests. Initial tests of the cruise wing con�g-uration were conducted with the vertical tail anda simulated aft fuselage-mounted engine and pyloninstalled on the model. All of these componentswere subsequently removed during the tests with the
2
high-lift wing con�guration because of balance loadlimitations.
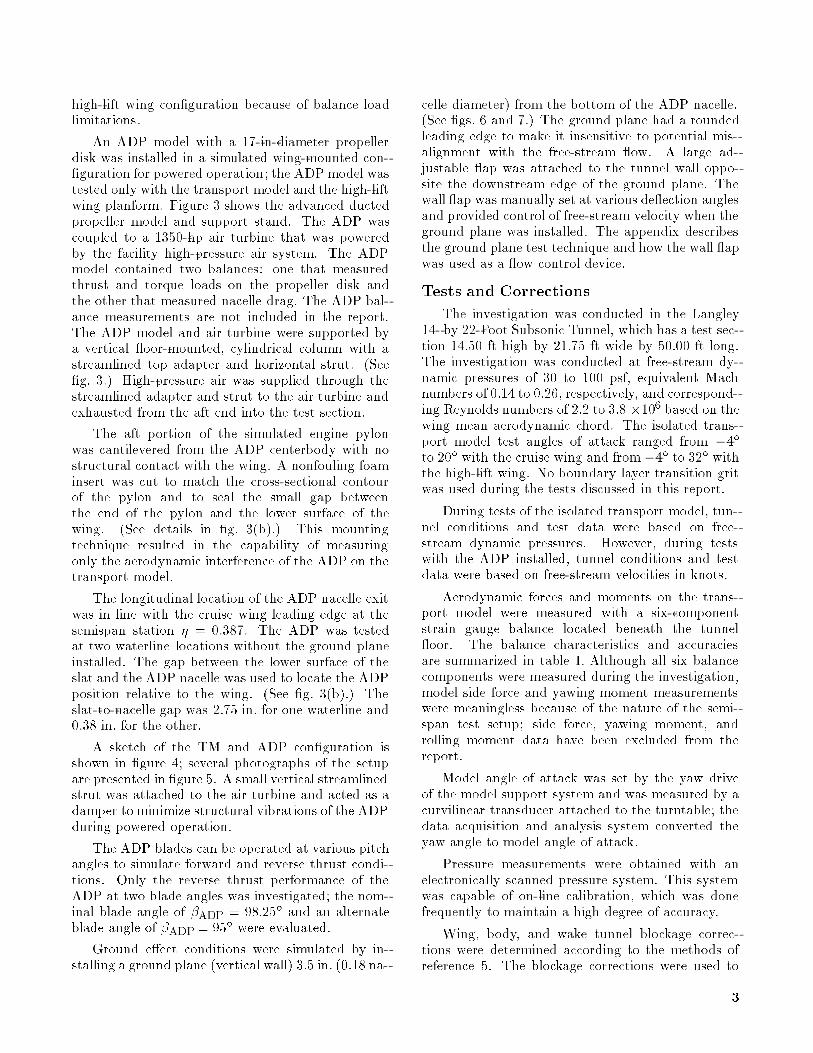
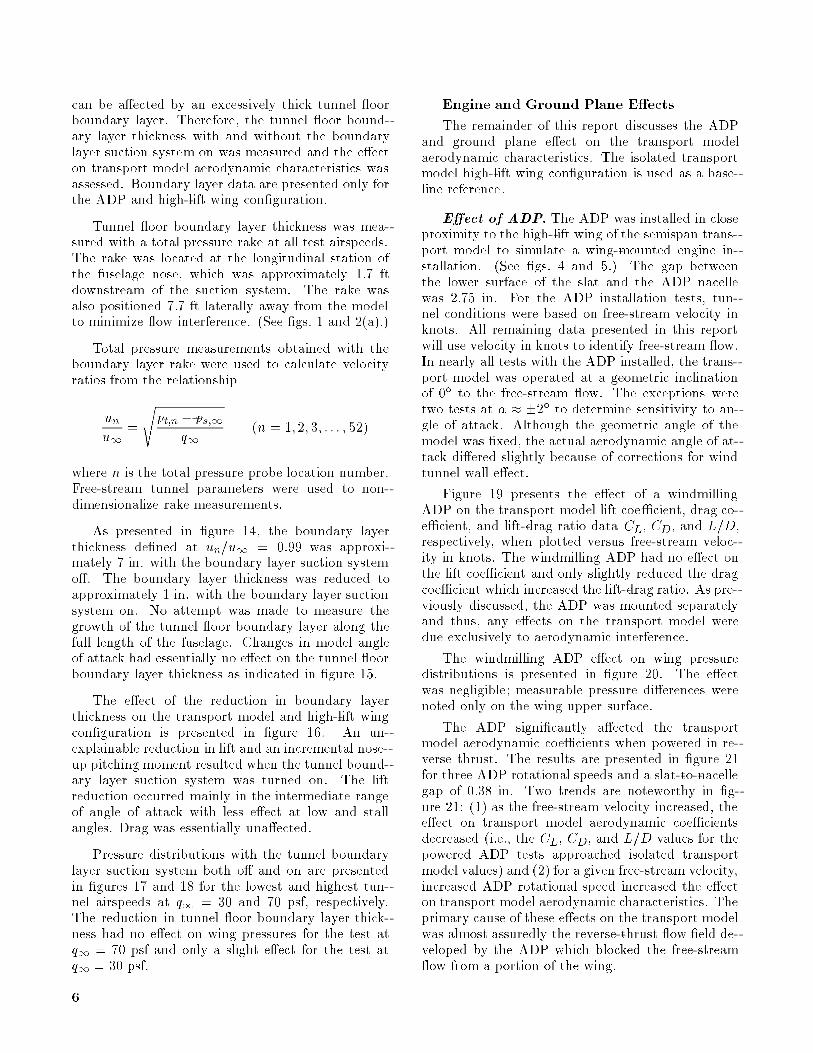
An ADP model with a 17-in-diameter propellerdisk was installed in a simulated wing-mounted con-�guration for powered operation; the ADPmodel wastested only with the transport model and the high-liftwing planform. Figure 3 shows the advanced ductedpropeller model and support stand. The ADP wascoupled to a 1350-hp air turbine that was poweredby the facility high-pressure air system. The ADPmodel contained two balances: one that measuredthrust and torque loads on the propeller disk andthe other that measured nacelle drag. The ADP bal-ance measurements are not included in the report.The ADP model and air turbine were supported bya vertical oor-mounted, cylindrical column with astreamlined top adapter and horizontal strut. (See�g. 3.) High-pressure air was supplied through thestreamlined adapter and strut to the air turbine andexhausted from the aft end into the test section.
The aft portion of the simulated engine pylonwas cantilevered from the ADP centerbody with nostructural contact with the wing. A nonfouling foaminsert was cut to match the cross-sectional contourof the pylon and to seal the small gap betweenthe end of the pylon and the lower surface of thewing. (See details in �g. 3(b).) This mountingtechnique resulted in the capability of measuringonly the aerodynamic interference of the ADP on thetransport model.
The longitudinal location of the ADP nacelle exitwas in line with the cruise wing leading edge at thesemispan station � = 0.387. The ADP was testedat two waterline locations without the ground planeinstalled. The gap between the lower surface of theslat and the ADP nacelle was used to locate the ADPposition relative to the wing. (See �g. 3(b).) Theslat-to-nacelle gap was 2.75 in. for one waterline and0.38 in. for the other.
A sketch of the TM and ADP con�guration isshown in �gure 4; several photographs of the setupare presented in �gure 5. A small vertical streamlinedstrut was attached to the air turbine and acted as adamper to minimize structural vibrations of the ADPduring powered operation.
The ADP blades can be operated at various pitchangles to simulate forward and reverse thrust condi-tions. Only the reverse thrust performance of theADP at two blade angles was investigated; the nom-inal blade angle of �ADP = 98:25� and an alternateblade angle of �ADP= 95� were evaluated.
Ground e�ect conditions were simulated by in-stalling a ground plane (vertical wall) 3.5 in. (0.18 na-
celle diameter) from the bottom of the ADP nacelle.(See �gs. 6 and 7.) The ground plane had a roundedleading edge to make it insensitive to potential mis-alignment with the free-stream ow. A large ad-justable ap was attached to the tunnel wall oppo-site the downstream edge of the ground plane. Thewall ap was manually set at various de ection anglesand provided control of free-stream velocity when theground plane was installed. The appendix describesthe ground plane test technique and how the wall apwas used as a ow control device.
Tests and Corrections
The investigation was conducted in the Langley14- by 22-Foot Subsonic Tunnel, which has a test sec-tion 14.50 ft high by 21.75 ft wide by 50.00 ft long.The investigation was conducted at free-stream dy-namic pressures of 30 to 100 psf, equivalent Machnumbers of 0.14 to 0.26, respectively, and correspond-ing Reynolds numbers of 2.2 to 3.8 �106 based on thewing mean aerodynamic chord. The isolated trans-port model test angles of attack ranged from �4�
to 20� with the cruise wing and from �4� to 32� withthe high-lift wing. No boundary layer transition gritwas used during the tests discussed in this report.
During tests of the isolated transport model, tun-nel conditions and test data were based on free-stream dynamic pressures. However, during testswith the ADP installed, tunnel conditions and testdata were based on free-stream velocities in knots.
Aerodynamic forces and moments on the trans-port model were measured with a six-componentstrain gauge balance located beneath the tunnel oor. The balance characteristics and accuraciesare summarized in table I. Although all six balancecomponents were measured during the investigation,model side force and yawing moment measurementswere meaningless because of the nature of the semi-span test setup; side force, yawing moment, androlling moment data have been excluded from thereport.
Model angle of attack was set by the yaw driveof the model support system and was measured by acurvilinear transducer attached to the turntable; thedata acquisition and analysis system converted theyaw angle to model angle of attack.
Pressure measurements were obtained with anelectronically scanned pressure system. This systemwas capable of on-line calibration, which was donefrequently to maintain a high degree of accuracy.
Wing, body, and wake tunnel blockage correc-tions were determined according to the methods ofreference 5. The blockage corrections were used to
3
Table I. Balance-to-Model Component Orientation and Balance Load Characteristic E�ects
on Aerodynamic Coe�cient Accuracy
Full-scale Accuracy of Coe�cient accuracy at
Balance Model load, lb, or Accuracy, load, lb, or � = 0� for|
component component moment, in-lb percent moment, in-lb q1= 30 psf q1= 50 psf q1= 100 psf
NF �NF 5000 0.5 �25 �0.0361 �0.0217 �0.0108
AFa SFa 3500 2.0 �70 �0.1011 �0.0607 �0.0303
PMa�RMa 400000 0.5 �2000 �0.0229 �0.0137 �0.0069
RM �PM 150000 0.5 �750 �0.0395 �0.0237 �0.0119
YMa�YMa 60000 0.5 �300 �0.0034 �0.0020 �0.0010
SF AF 1500 0.5 �7.5 �0.0108 �0.0065 �0.0033
aComponent data not included in results.
calculate the corrected free-stream dynamic pressure.No additional corrections were made to account forsolid shape or ow �eld tunnel blockage by the ADPor ground plane. Tunnel wall interference correctionswere applied to the data using the techniques of ref-erence 6. No corrections were made to the data fortunnel buoyancy or ow angularity.
Results
Transport model longitudinal aerodynamic char-acteristics (i.e., lift, drag, and pitching moment co-e�cients) and wing pressure distributions are pre-sented for various test conditions. Pitching momentdata are presented for completeness but are not dis-cussed in detail because no airplane horizontal sta-bilizer was installed during the investigation. Thelift and drag data are untrimmed due to the absenceof the horizontal stabilizer. The focus of this inves-tigation was to simulate the airplane operating inreverse thrust in ground e�ect. In reality, the air-plane would be decelerating to a stop on the runway,where lift and drag are of primary concern and pitch-ing moment less important. For ADP interferenceand ground e�ect analysis, transport model pitchingmoment data are not presented.
Discussion of results will follow the general out-line shown in table II.
Isolated Transport Model Characteristics
E�ect of tunnel airspeed. The Langley 14-by 22-Foot Subsonic Tunnel is an atmospheric windtunnel which does not have the capability to inde-pendently vary dynamic pressure q1, Reynolds num-ber R, and Mach number M1. Therefore, an in-crease or decrease in any one of these parametersresults in a corresponding increase or decrease in theother two. For this investigation, an increase in q1
from 30 to 100 psf resulted in an equivalent M1 of0.14 and 0.26, respectively, and a corresponding Rof 2.2 and 3.9 �106. These relationships are pre-sented graphically in �gure 8(a). During tests withthe ADP, the free-stream velocity in knots was usedto set tunnel conditions. Figure 8(b) shows the re-lationship between free-stream velocity and dynamicpressure. A comparison is made of two ambient con-ditions which represent the greatest variation in tem-peratures recorded during the ADP tests.
Figure 9 presents the e�ect of the variation indynamic pressure and corresponding Reynolds andMach numbers on model aerodynamic character-istics of the isolated transport model with cruiseand high-lift wings. The cruise wing con�guration(�g. 9(a)) included installation of the vertical tail andaft fuselage-mounted engine nacelle. These compo-nents were removed for the high-lift wing con�gura-tion (�g. 9(b)) and all subsequent tests. The tunnel oor boundary layer suction system was o� for thedata presented in �gure 9.
The only signi�cant variation in model aero-dynamic performance occurred near the stall condi-tion. Note that a similar cruise wing stall angle ofattack (� � 14�) resulted at both the lowest andhighest velocities ; the stall angles of attack were ap-proximately 1� greater for intermediate velocities.The high-lift wing stall angle of attack decreased pro-gressively as tunnel airspeed was increased.
In general, tunnel airspeed had little or no e�ecton the data for low angles of attack (� = �2�).Note that data comparisons are presented later inthis report for the ADP installation and ground e�ecttests performed at � = �2�. Free-stream velocitieswere not matched exactly for the con�gurations inthose comparisons; however, the transport modelaerodynamic coe�cients were insensitive to changes
4
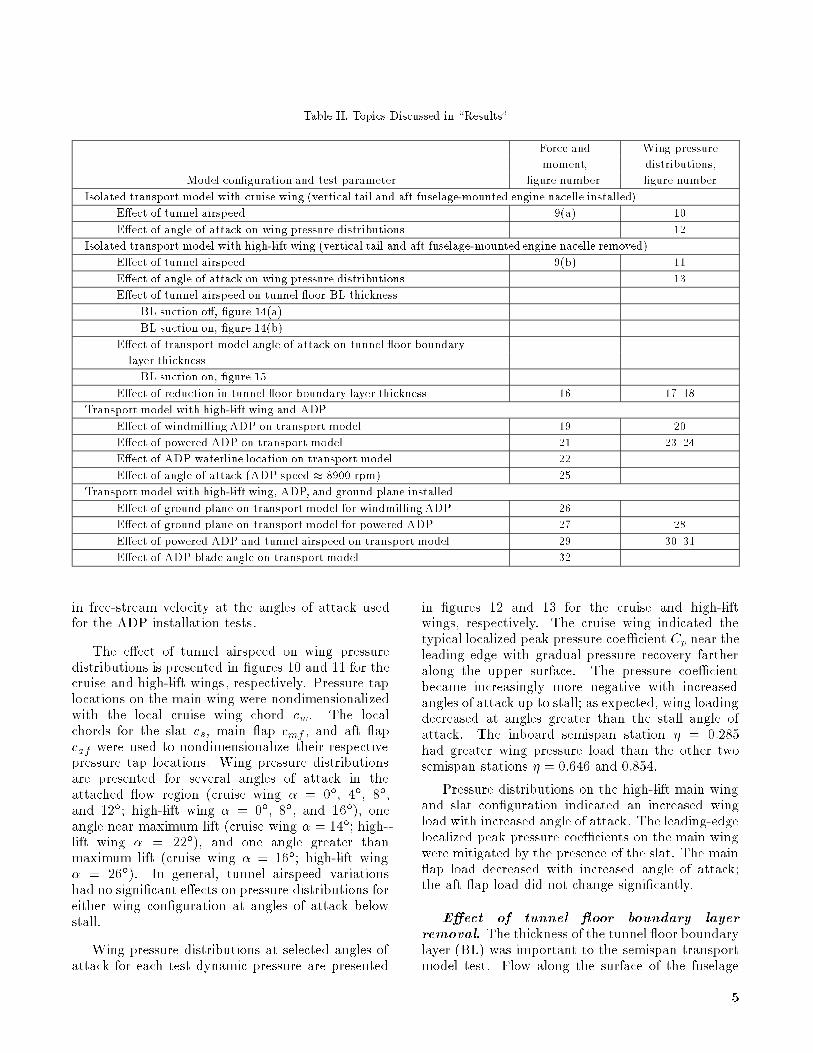
Table II. Topics Discussed in \Results"
Force and Wing pressure
moment, distributions,
Model con�guration and test parameter �gure number �gure number
Isolated transport model with cruise wing (vertical tail and aft fuselage-mounted engine nacelle installed)
E�ect of tunnel airspeed 9(a) 10
E�ect of angle of attack on wing pressure distributions 12
Isolated transport model with high-lift wing (vertical tail and aft fuselage-mounted engine nacelle removed)
E�ect of tunnel airspeed 9(b) 11
E�ect of angle of attack on wing pressure distributions 13
E�ect of tunnel airspeed on tunnel oor BL thickness
BL suction o�, �gure 14(a)
BL suction on, �gure 14(b)
E�ect of transport model angle of attack on tunnel oor boundary
layer thickness
BL suction on, �gure 15
E�ect of reduction in tunnel oor boundary layer thickness 16 17{18
Transport model with high-lift wing and ADP
E�ect of windmillingADP on transport model 19 20
E�ect of powered ADP on transport model 21 23{24
E�ect of ADP waterline location on transport model 22
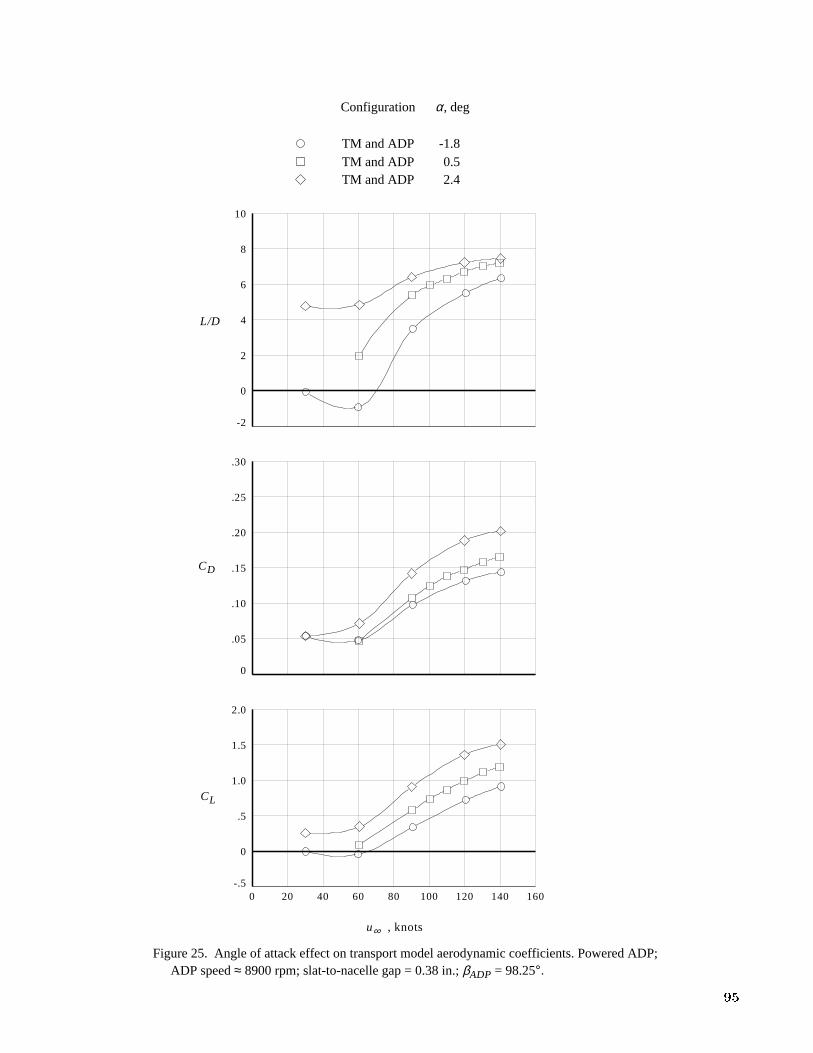
E�ect of angle of attack (ADP speed � 8900 rpm) 25
Transport model with high-lift wing, ADP, and ground plane installed
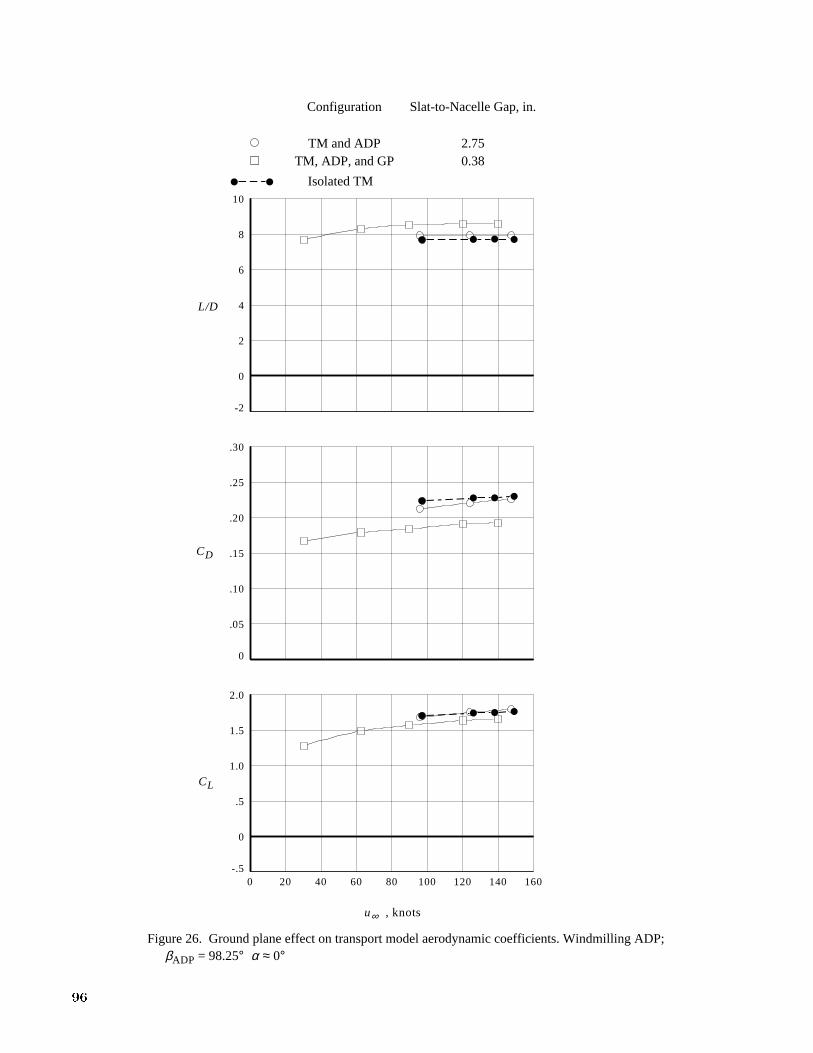
E�ect of ground plane on transport model for windmillingADP 26
E�ect of ground plane on transport model for powered ADP 27 28
E�ect of powered ADP and tunnel airspeed on transport model 29 30{31
E�ect of ADP blade angle on transport model 32
in free-stream velocity at the angles of attack usedfor the ADP installation tests.
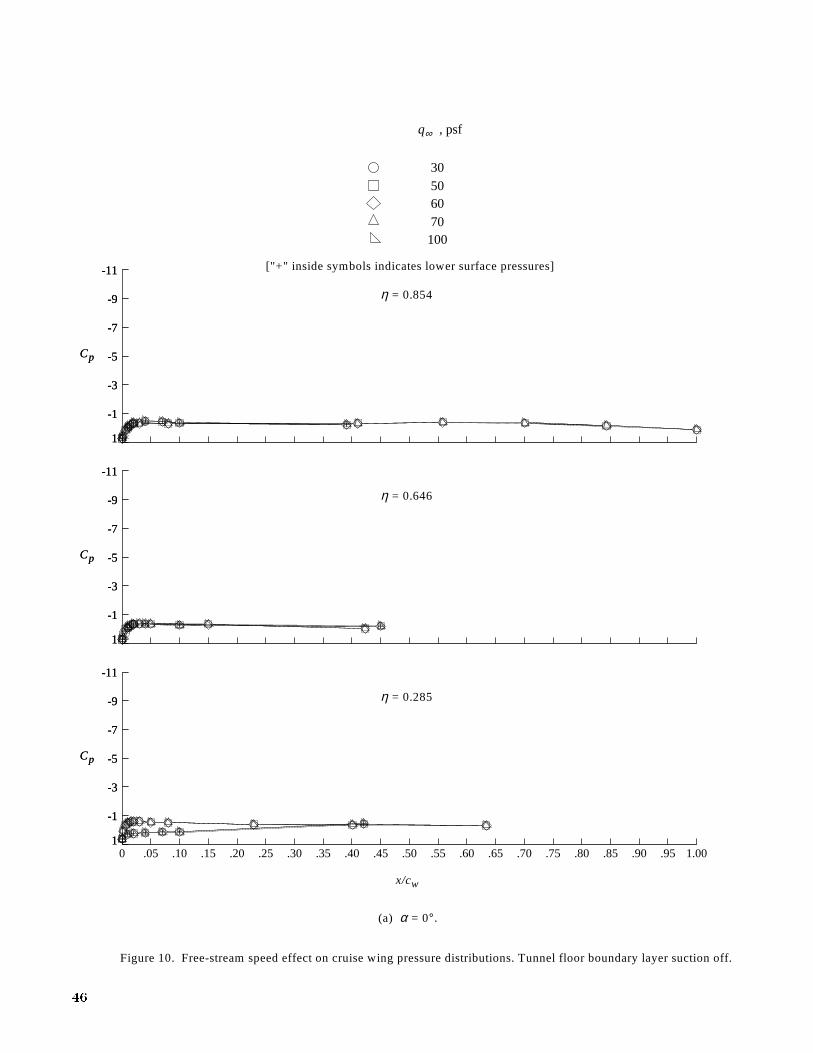
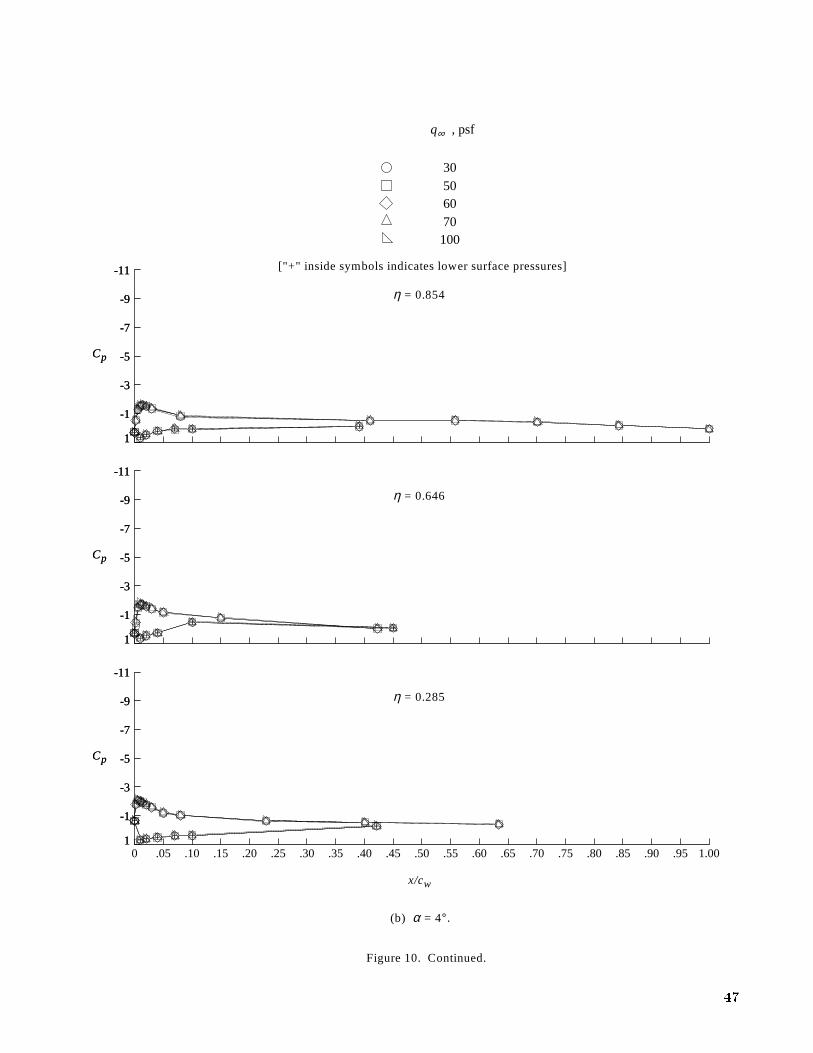
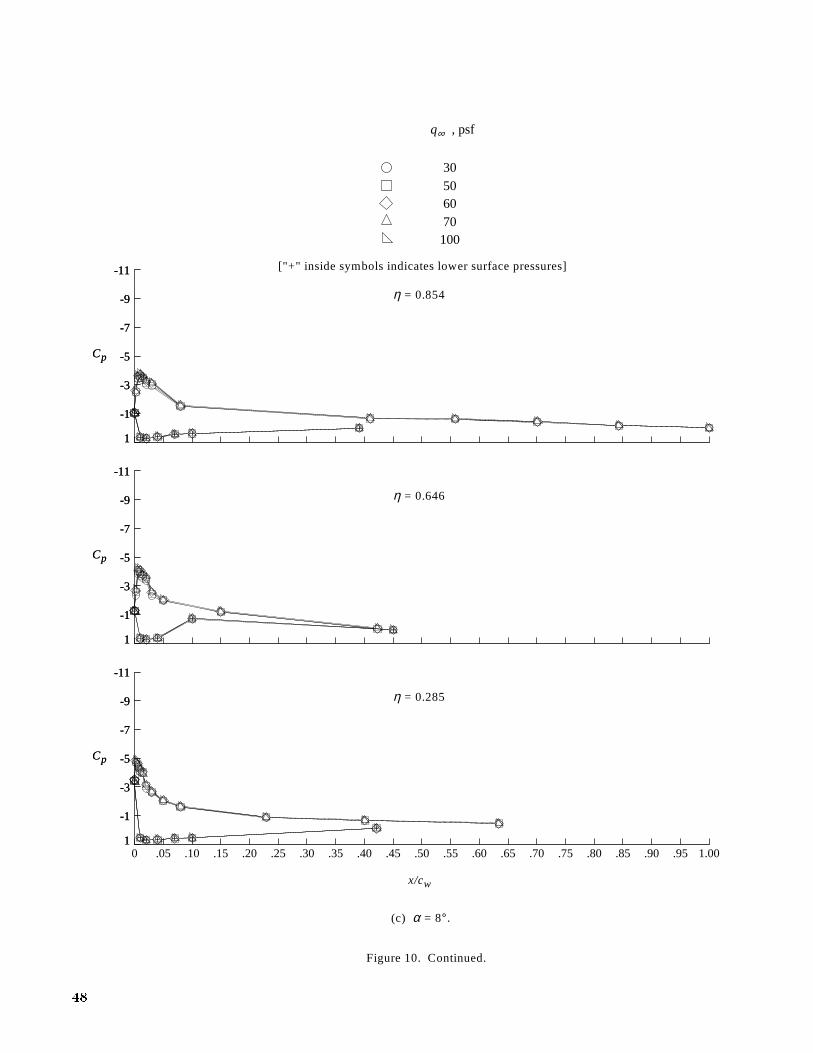
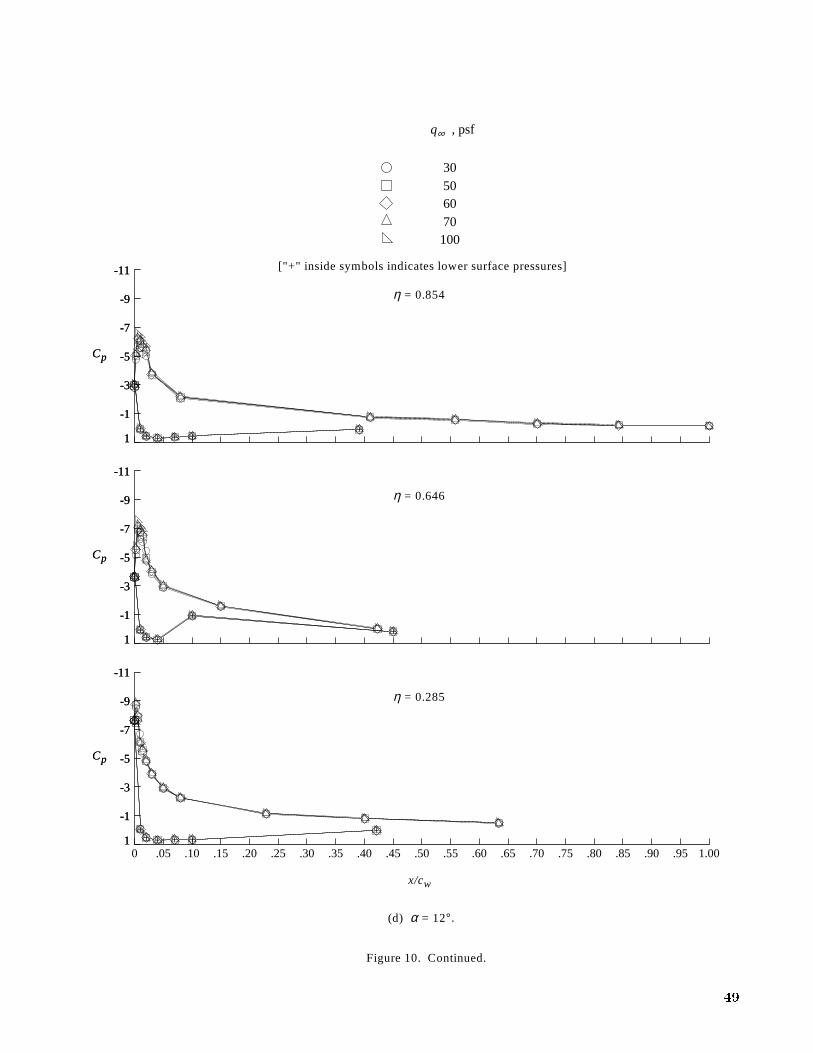
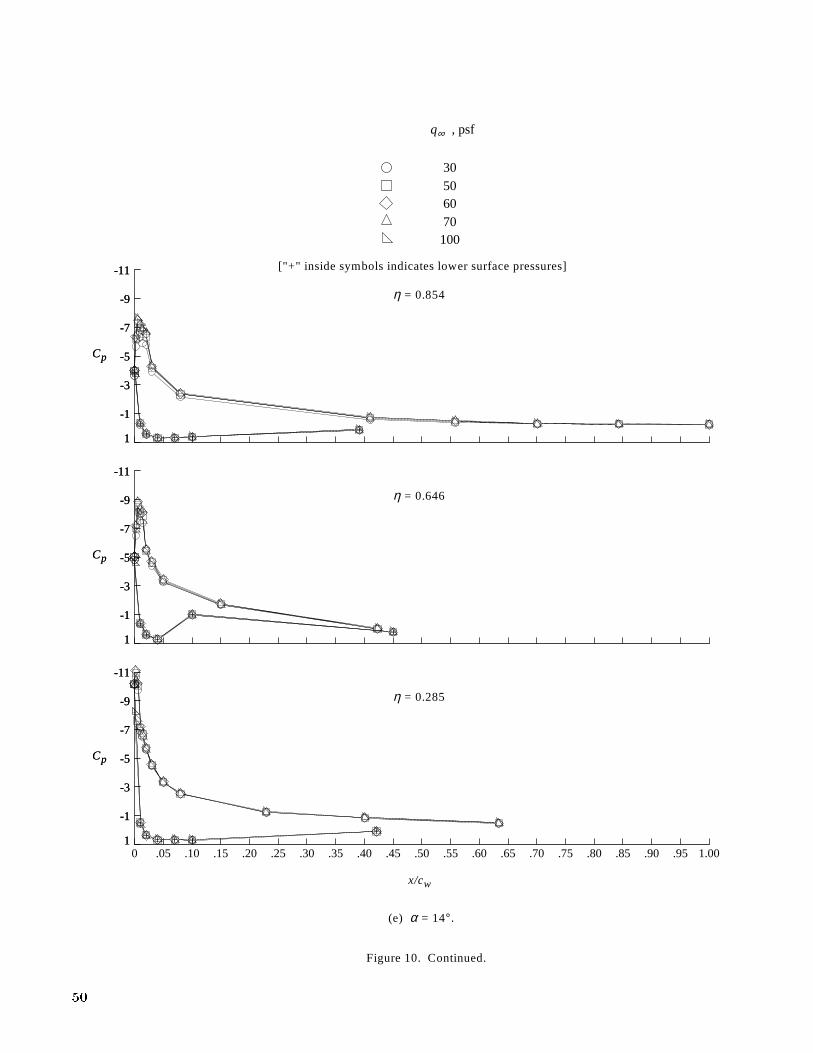
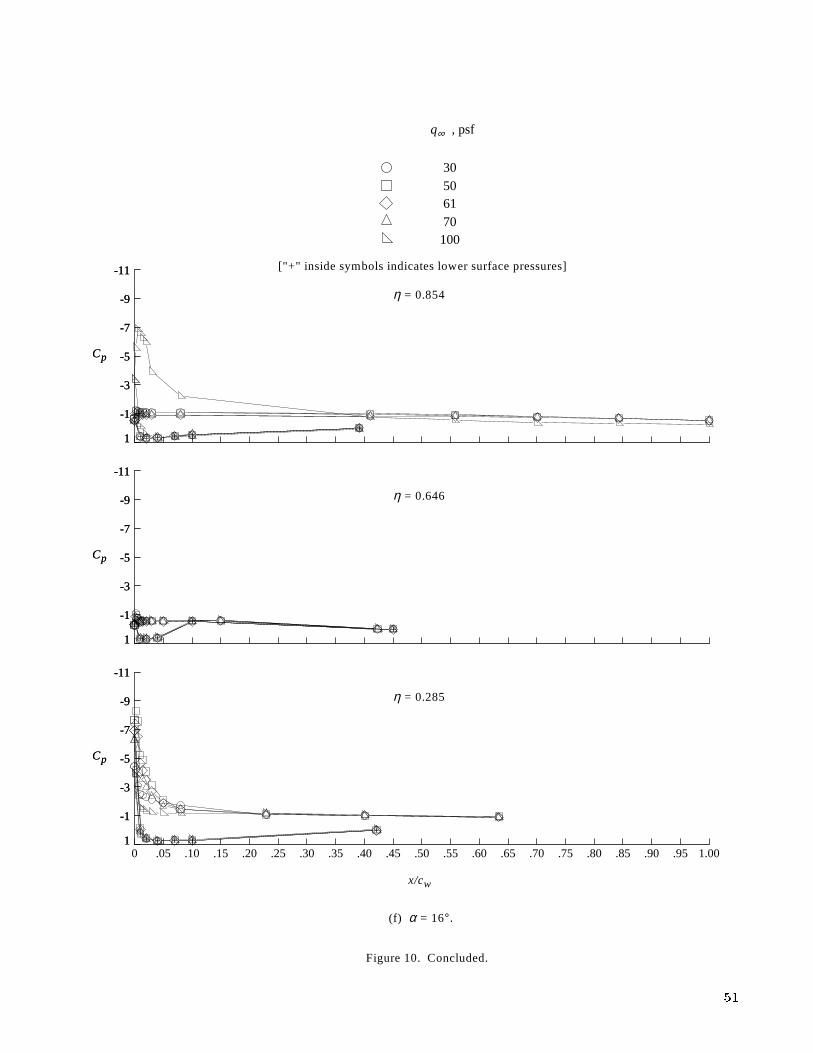
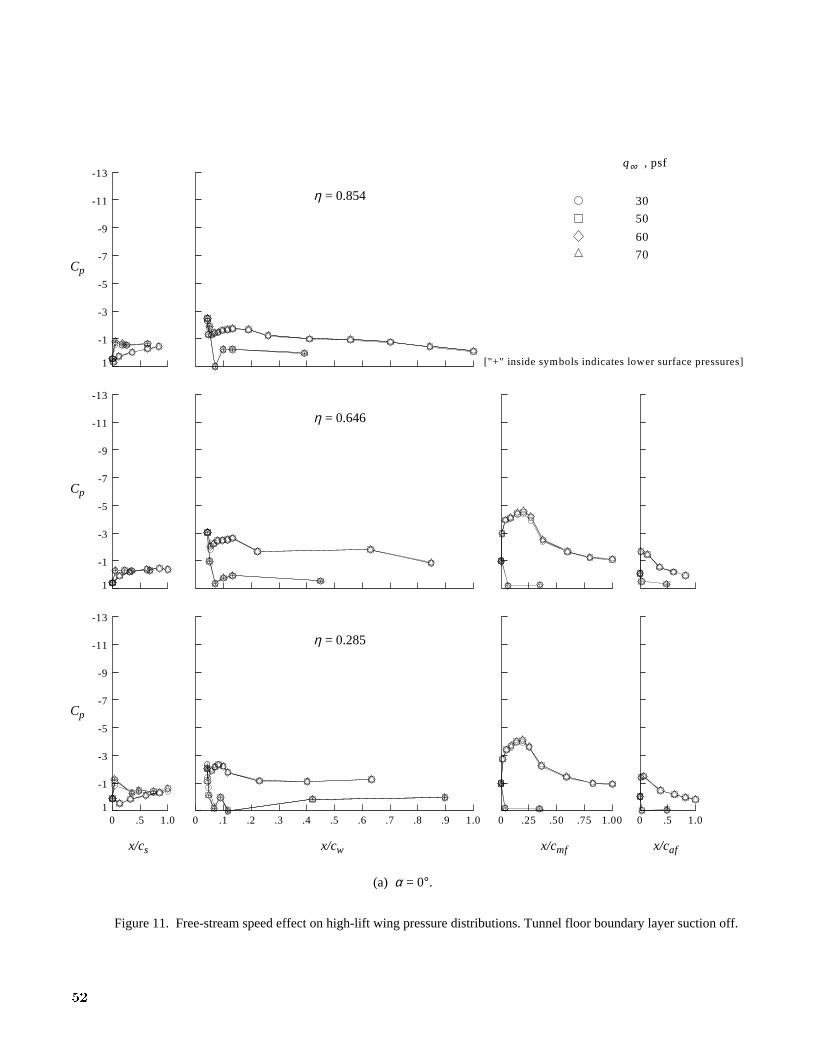
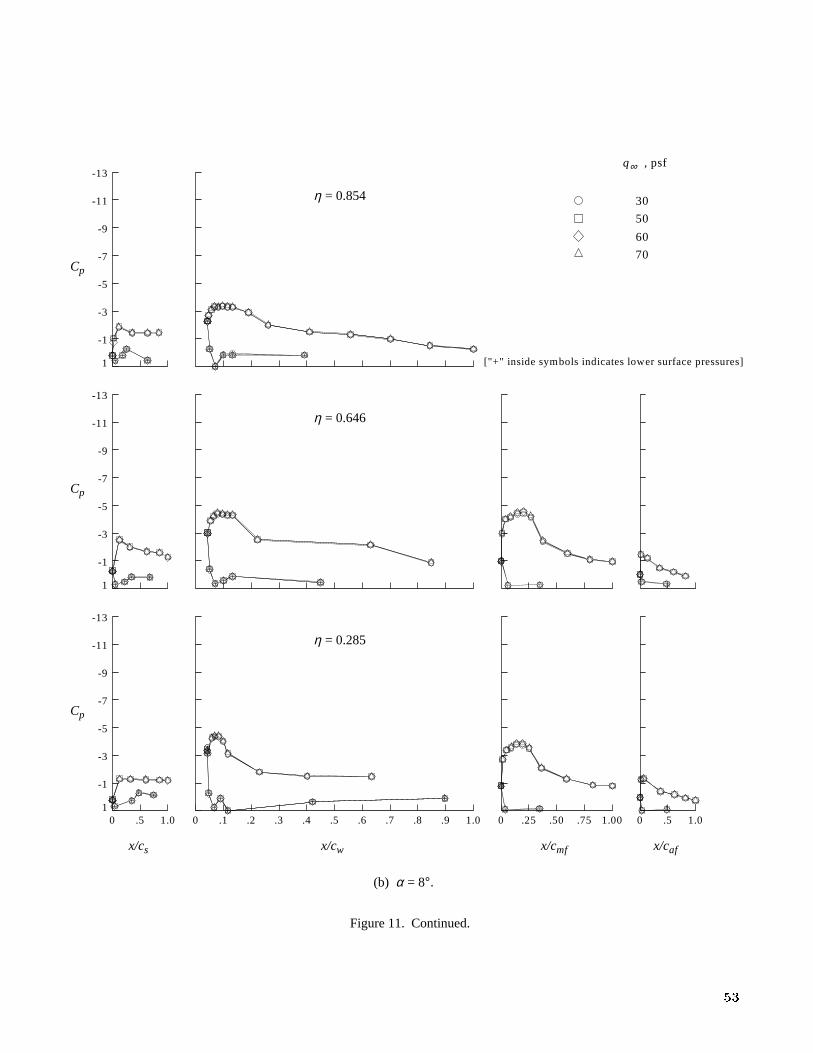
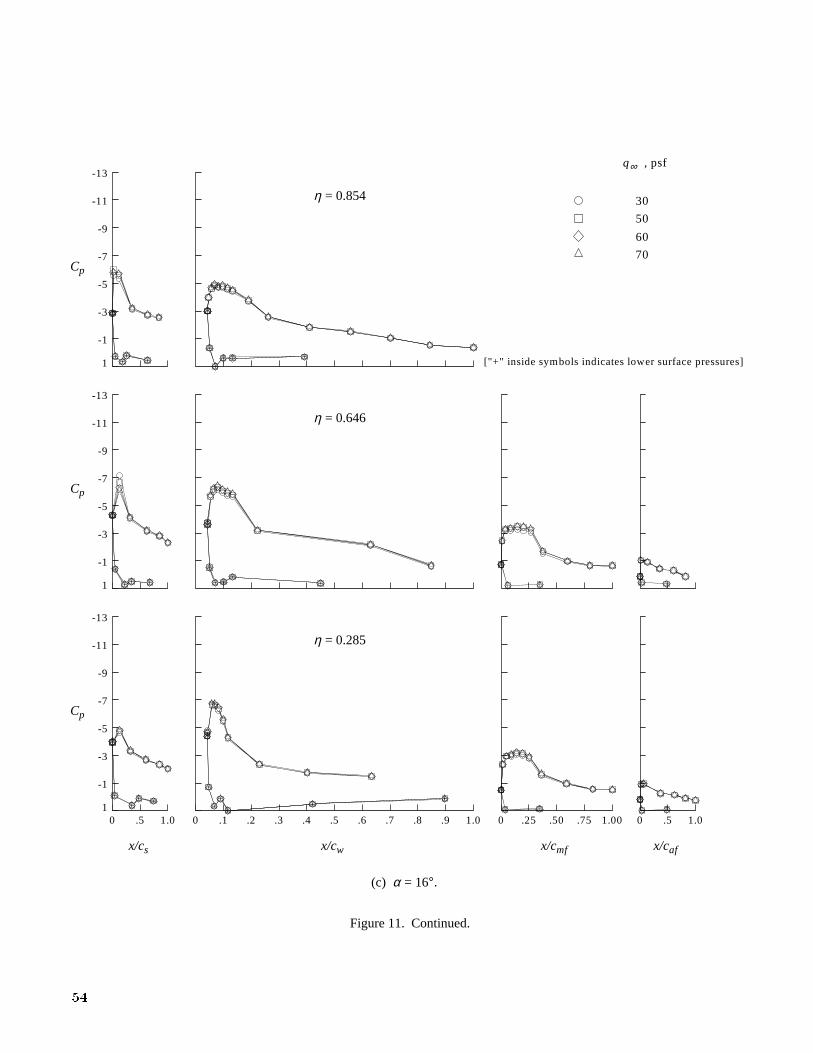
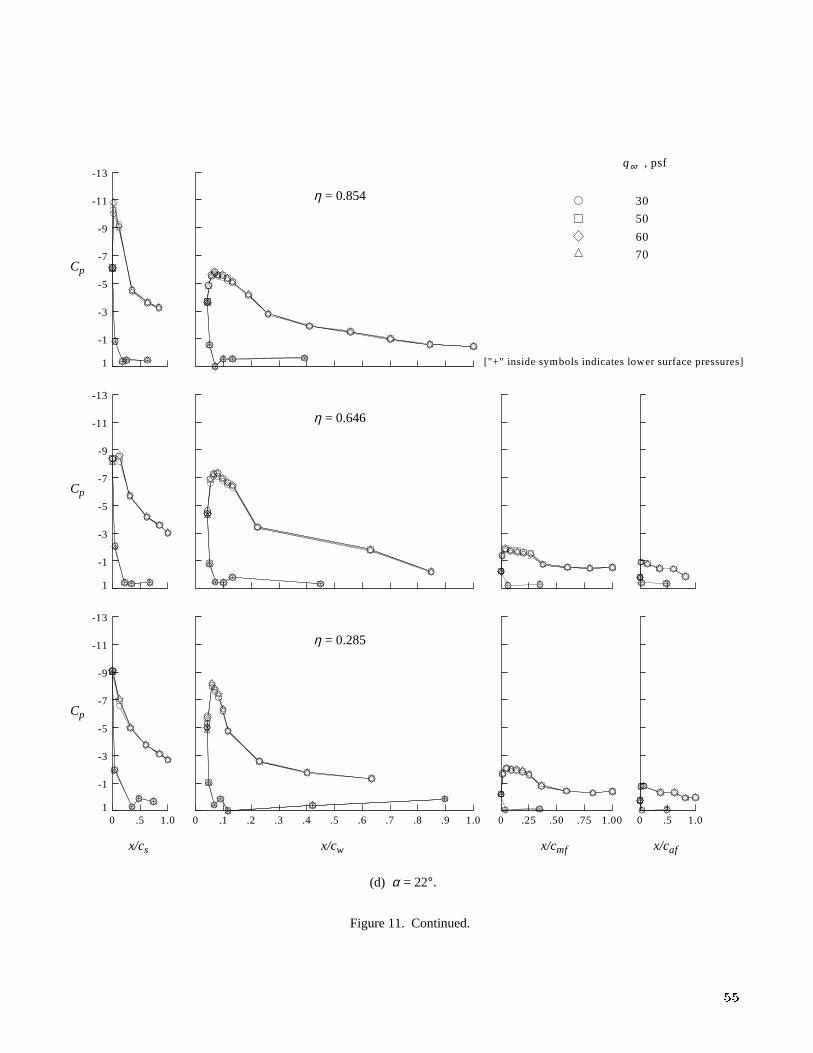
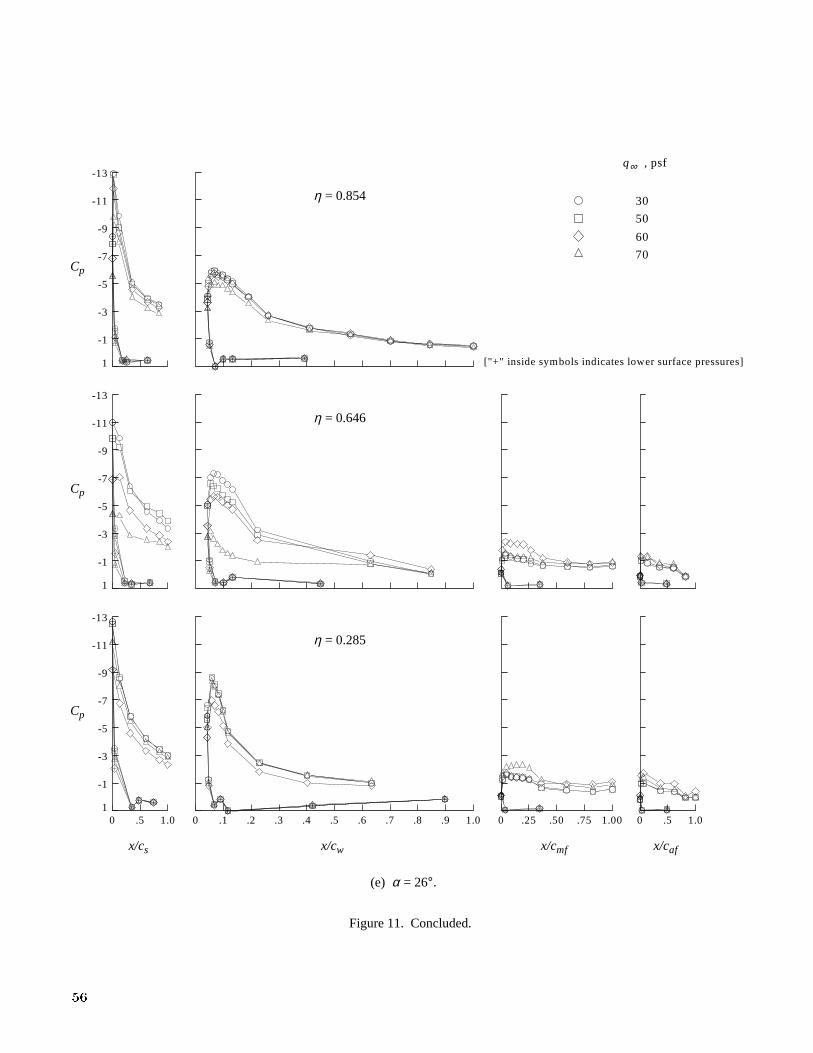
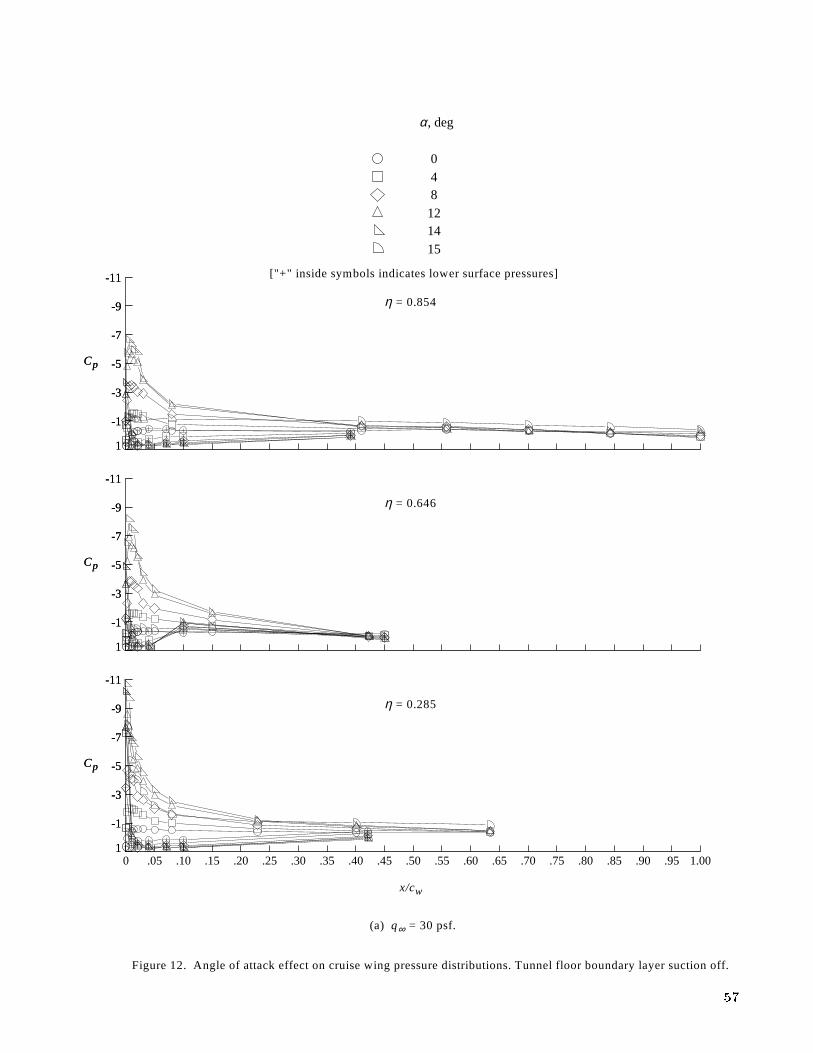
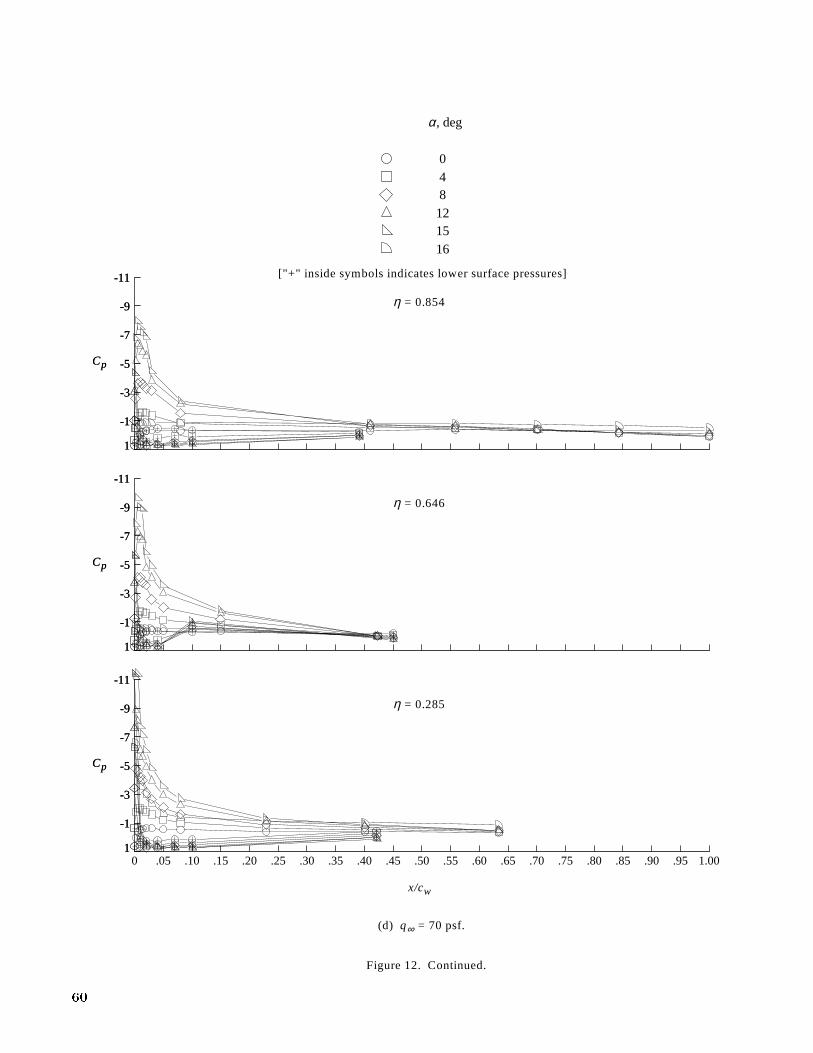
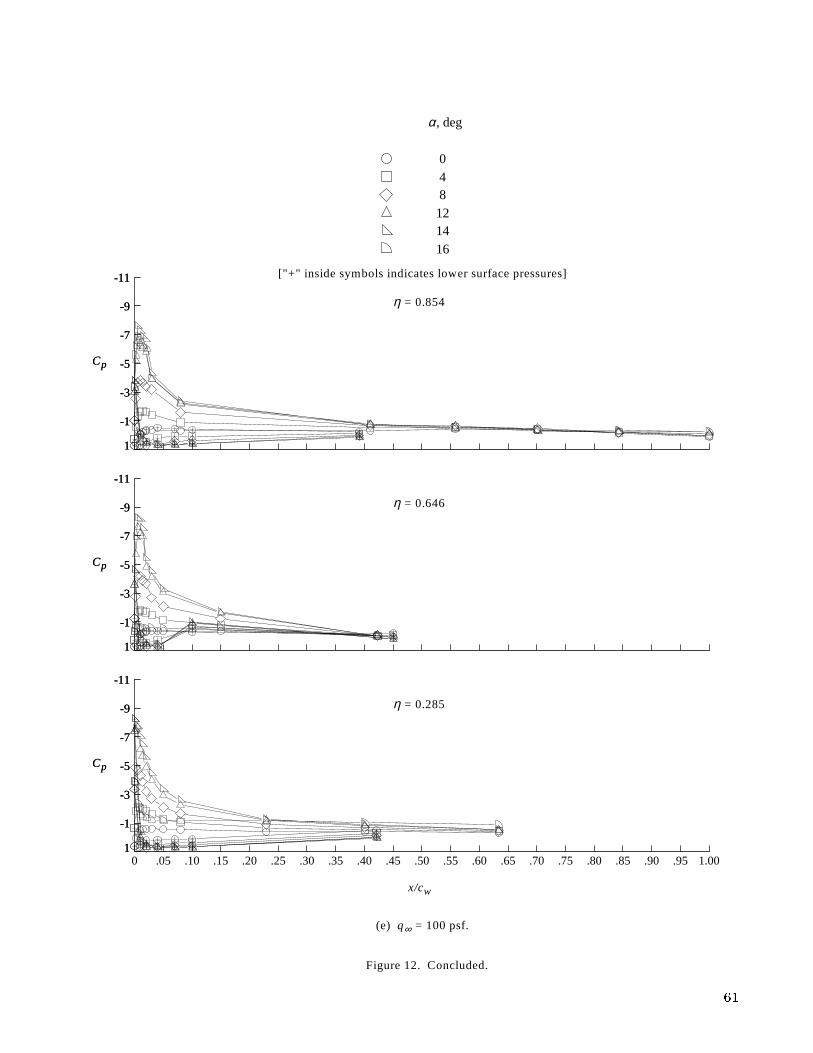
The e�ect of tunnel airspeed on wing pressuredistributions is presented in �gures 10 and 11 for thecruise and high-lift wings, respectively. Pressure taplocations on the main wing were nondimensionalizedwith the local cruise wing chord cw. The localchords for the slat cs, main ap cmf , and aft apcaf were used to nondimensionalize their respectivepressure tap locations. Wing pressure distributionsare presented for several angles of attack in theattached ow region (cruise wing � = 0�, 4�, 8�,and 12�; high-lift wing � = 0�, 8�, and 16�), oneangle near maximum lift (cruise wing � = 14�; high-lift wing � = 22�), and one angle greater thanmaximum lift (cruise wing � = 16�; high-lift wing� = 26�). In general, tunnel airspeed variationshad no signi�cant e�ects on pressure distributions foreither wing con�guration at angles of attack belowstall.
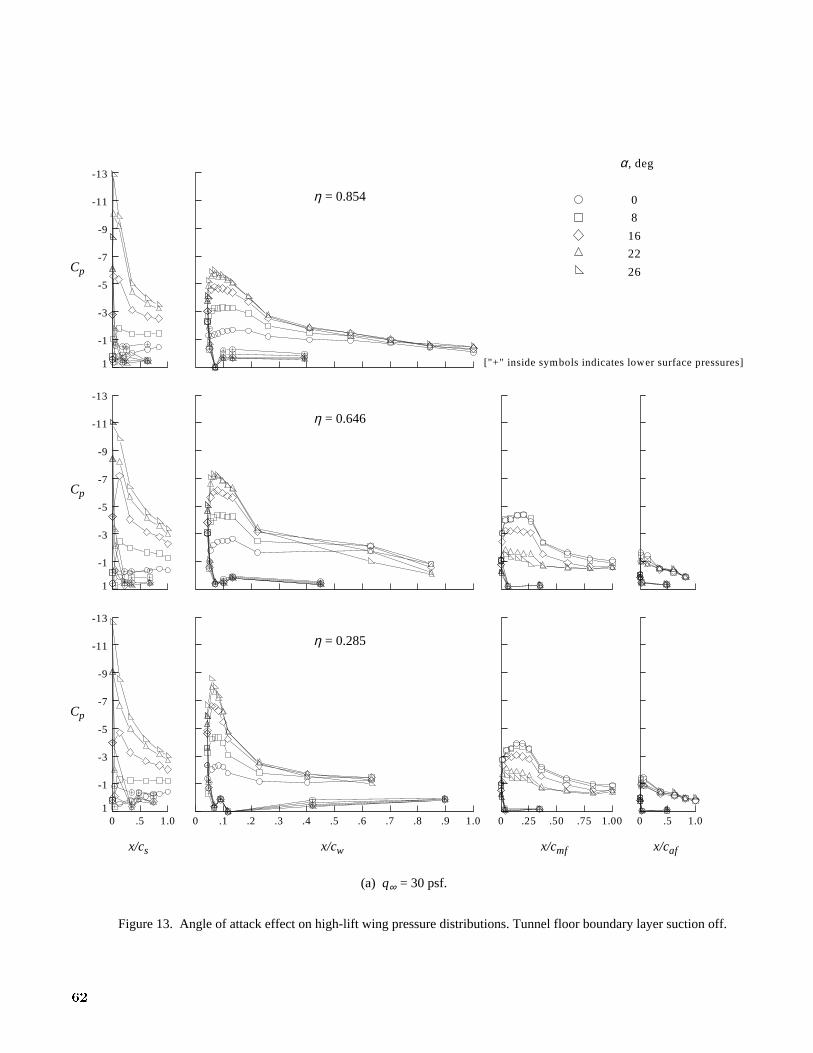
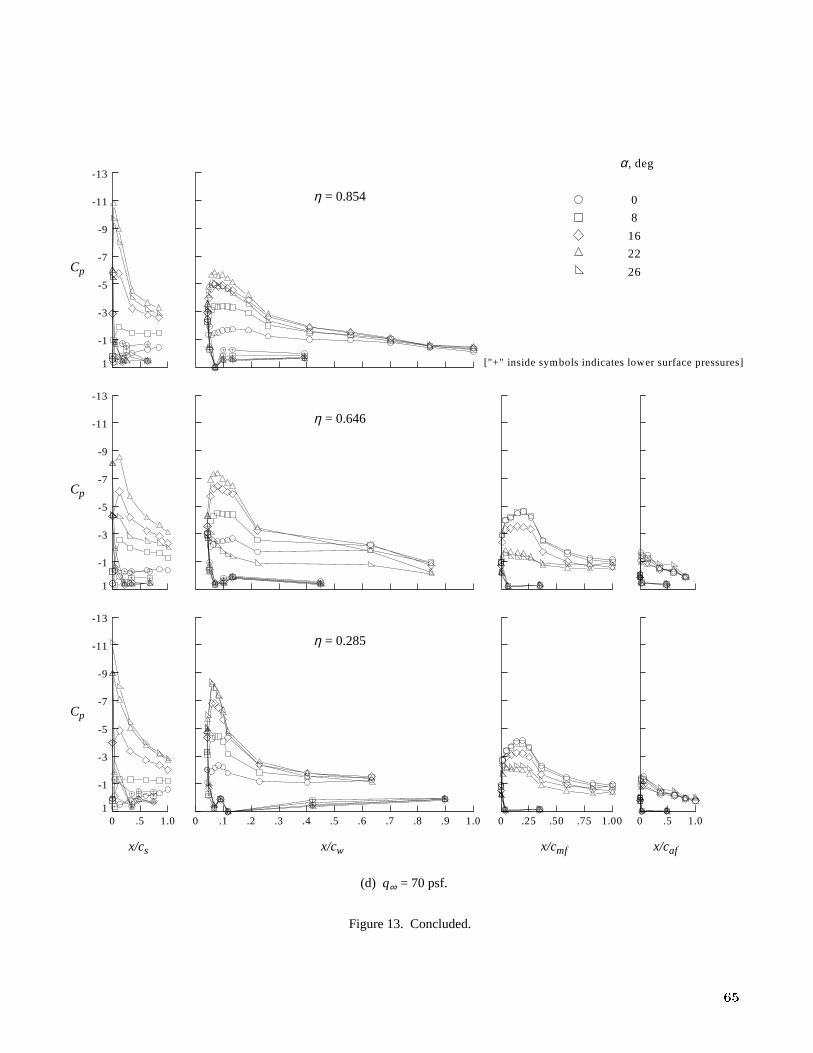
Wing pressure distributions at selected angles ofattack for each test dynamic pressure are presented
in �gures 12 and 13 for the cruise and high-liftwings, respectively. The cruise wing indicated thetypical localized peak pressure coe�cient Cp near theleading edge with gradual pressure recovery fartheralong the upper surface. The pressure coe�cientbecame increasingly more negative with increasedangles of attack up to stall; as expected, wing loadingdecreased at angles greater than the stall angle ofattack. The inboard semispan station � = 0:285had greater wing pressure load than the other twosemispan stations � = 0:646 and 0.854.
Pressure distributions on the high-lift main wingand slat con�guration indicated an increased wingload with increased angle of attack. The leading-edgelocalized peak pressure coe�cients on the main wingwere mitigated by the presence of the slat. The main ap load decreased with increased angle of attack;the aft ap load did not change signi�cantly.
E�ect of tunnel oor boundary layer
removal. The thickness of the tunnel oor boundarylayer (BL) was important to the semispan transportmodel test. Flow along the surface of the fuselage
5
can be a�ected by an excessively thick tunnel oorboundary layer. Therefore, the tunnel oor bound-ary layer thickness with and without the boundarylayer suction system on was measured and the e�ecton transport model aerodynamic characteristics wasassessed. Boundary layer data are presented only forthe ADP and high-lift wing con�guration.
Tunnel oor boundary layer thickness was mea-sured with a total pressure rake at all test airspeeds.The rake was located at the longitudinal station ofthe fuselage nose, which was approximately 1.7 ftdownstream of the suction system. The rake wasalso positioned 7.7 ft laterally away from the modelto minimize ow interference. (See �gs. 1 and 2(a).)
Total pressure measurements obtained with theboundary layer rake were used to calculate velocityratios from the relationship
un
u1=
spt;n� ps;1
q1(n = 1; 2; 3; : : : ; 52)
where n is the total pressure probe location number.Free-stream tunnel parameters were used to non-dimensionalize rake measurements.
As presented in �gure 14, the boundary layerthickness de�ned at un=u1 = 0:99 was approxi-mately 7 in. with the boundary layer suction systemo�. The boundary layer thickness was reduced toapproximately 1 in. with the boundary layer suctionsystem on. No attempt was made to measure thegrowth of the tunnel oor boundary layer along thefull length of the fuselage. Changes in model angleof attack had essentially no e�ect on the tunnel oorboundary layer thickness as indicated in �gure 15.
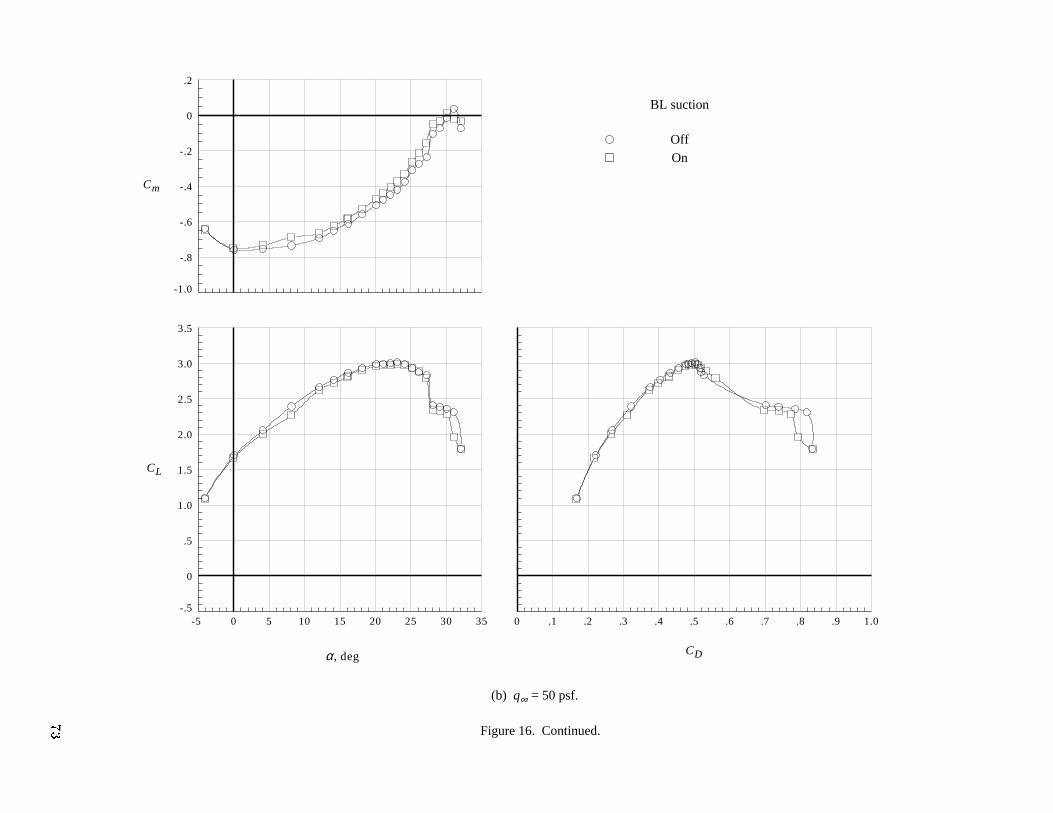
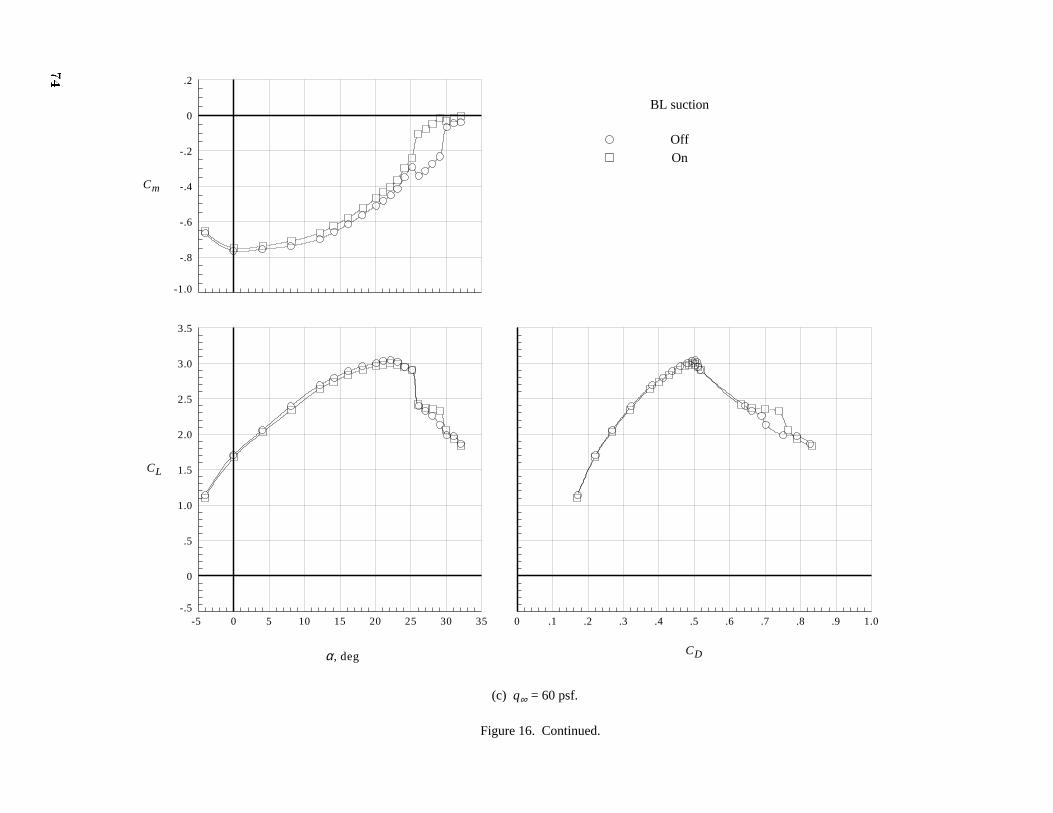
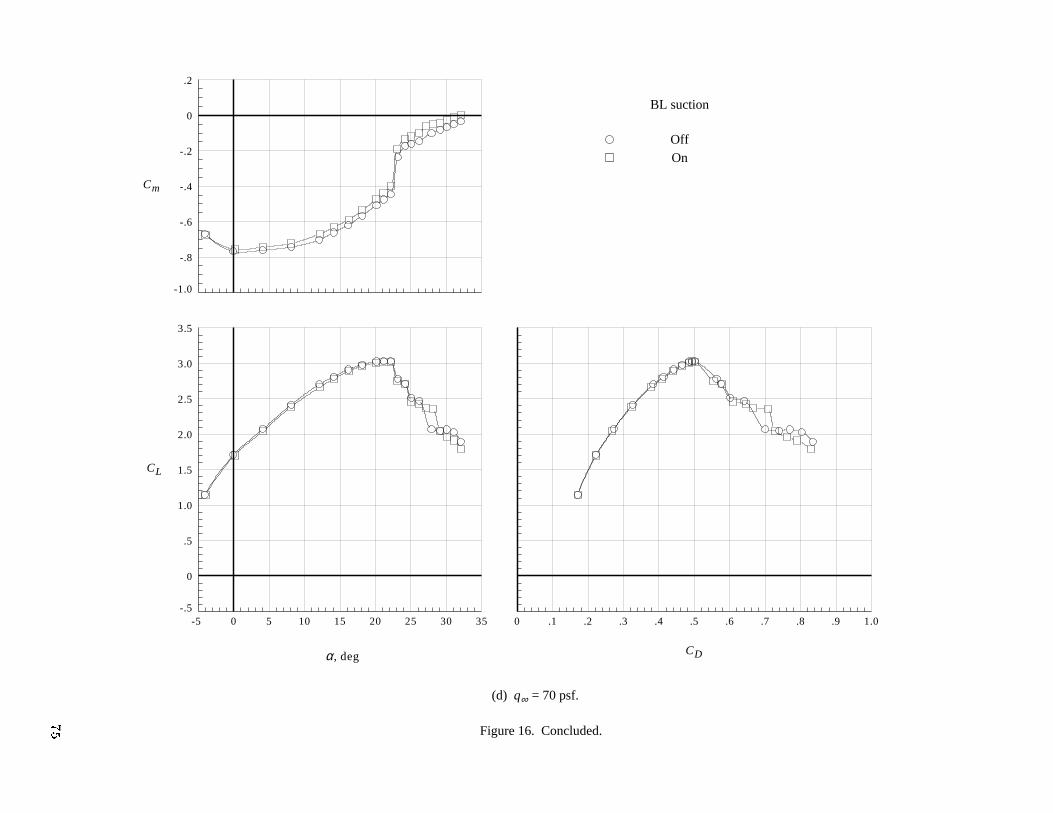
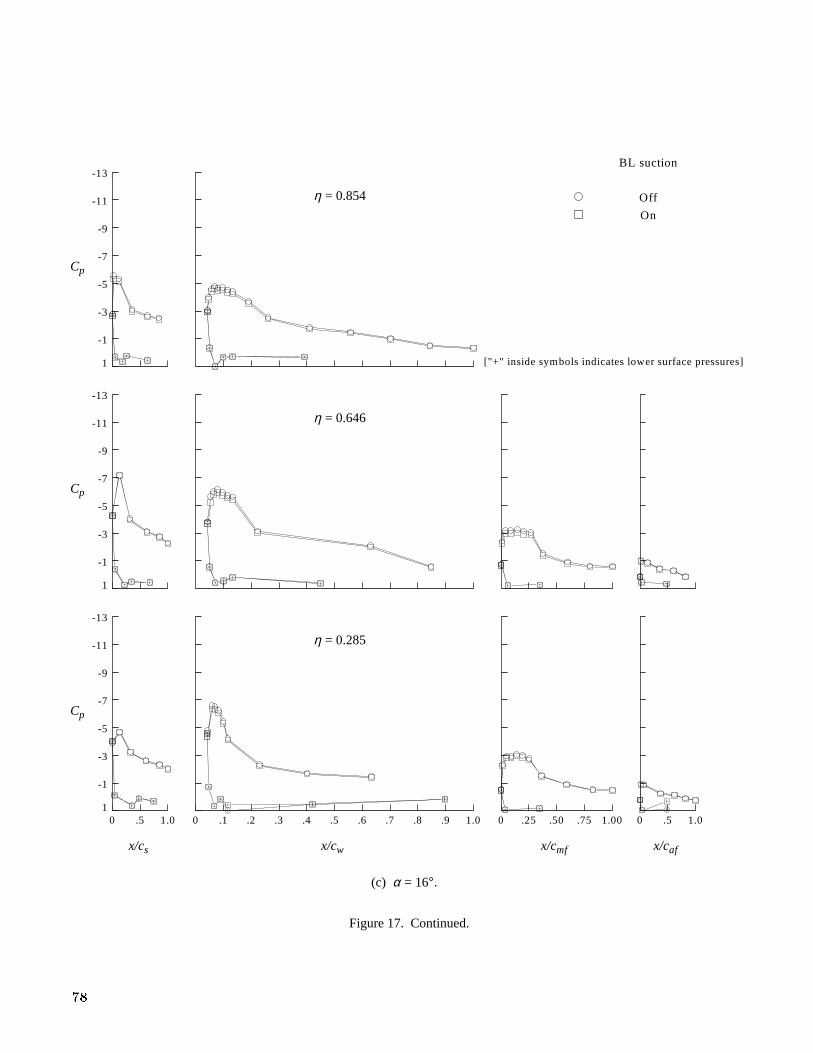
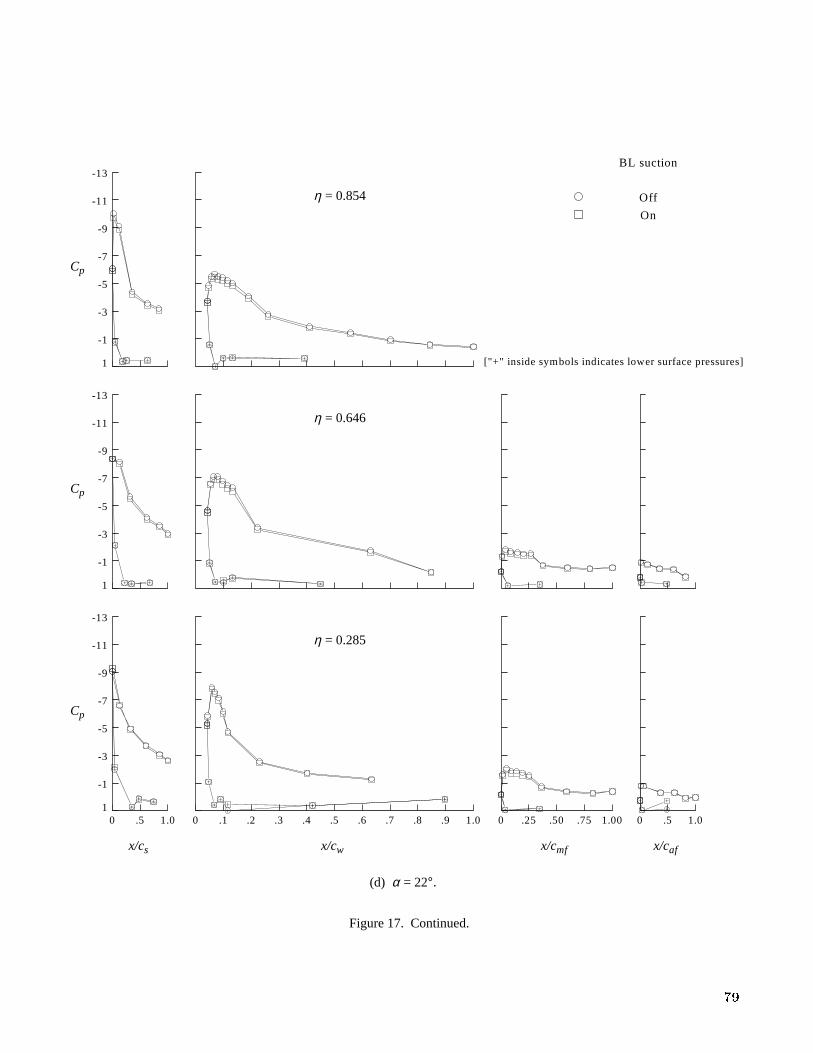
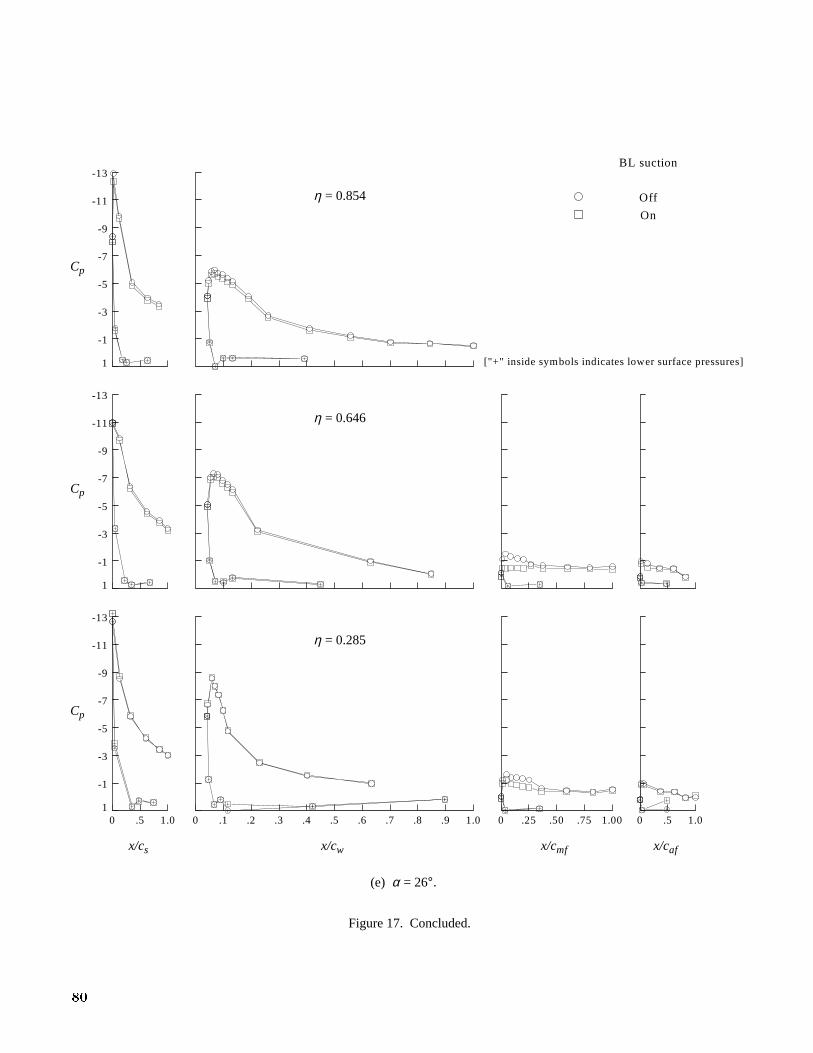
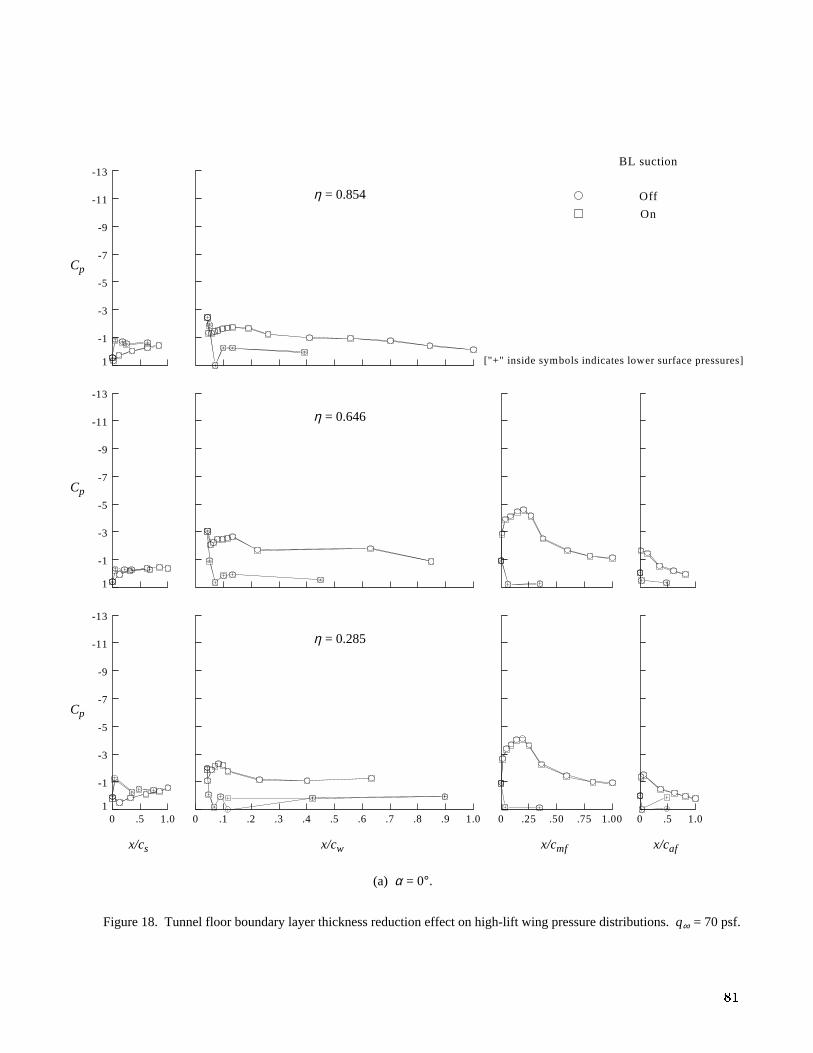
The e�ect of the reduction in boundary layerthickness on the transport model and high-lift wingcon�guration is presented in �gure 16. An un-explainable reduction in lift and an incremental nose-up pitching moment resulted when the tunnel bound-ary layer suction system was turned on. The liftreduction occurred mainly in the intermediate rangeof angle of attack with less e�ect at low and stallangles. Drag was essentially una�ected.
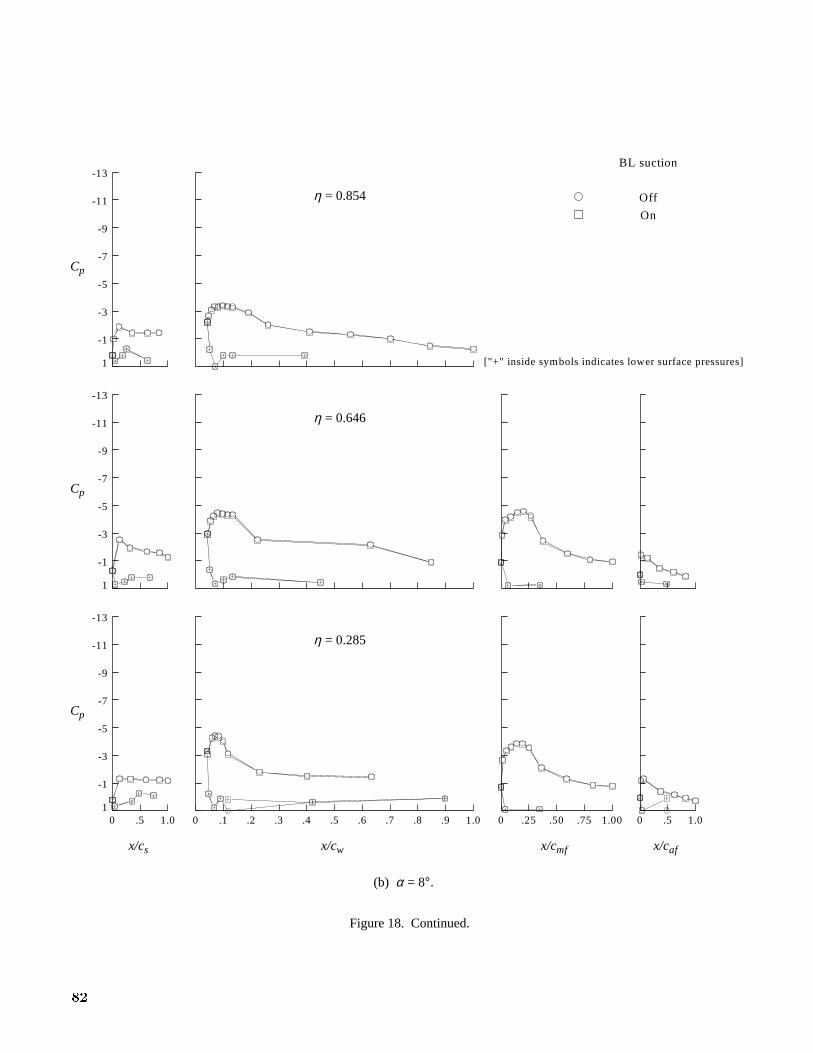
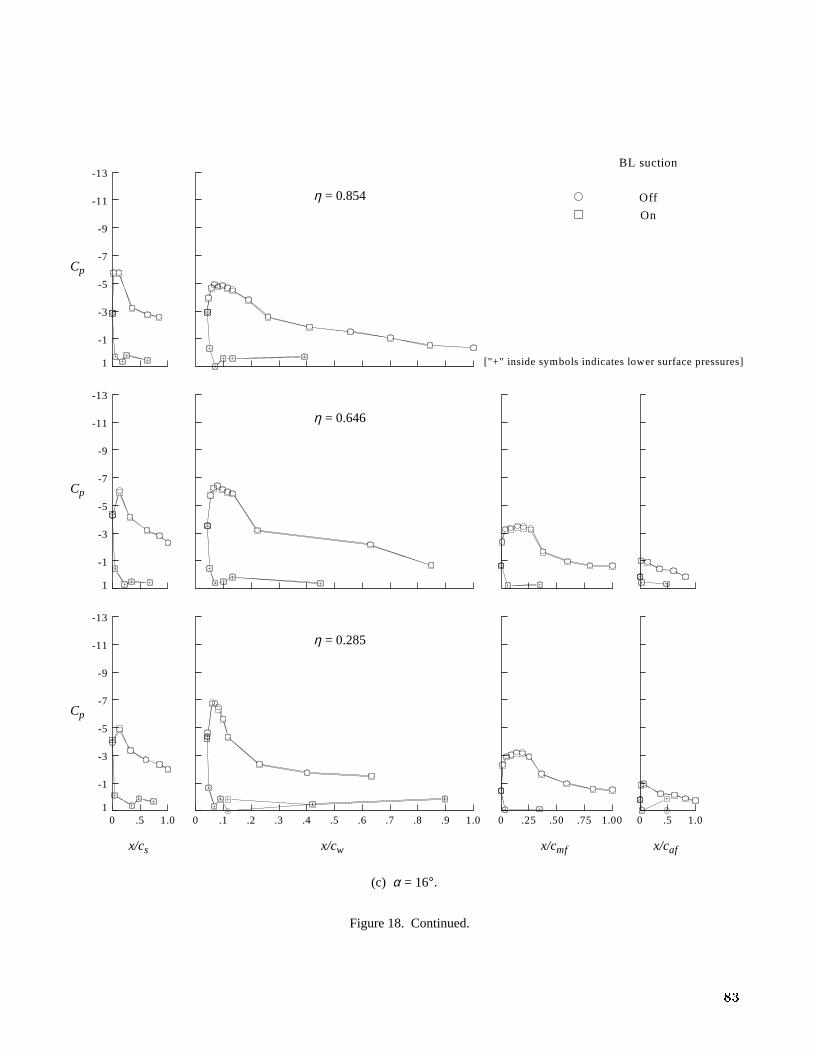
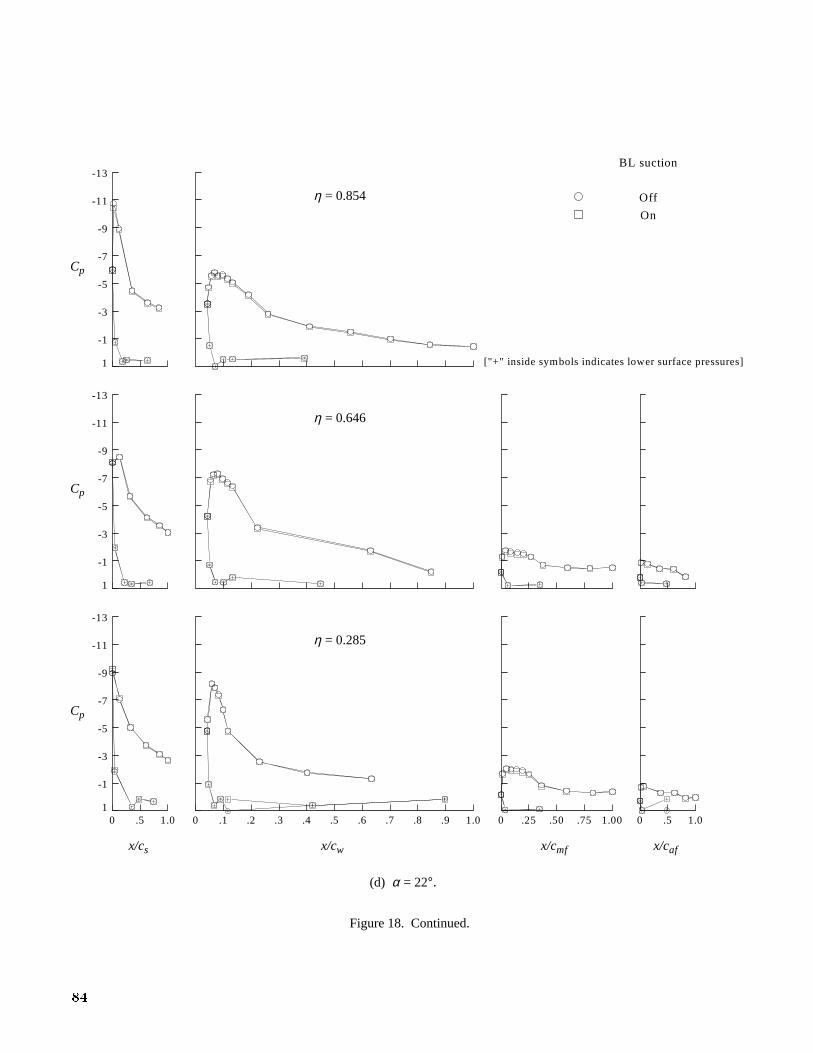
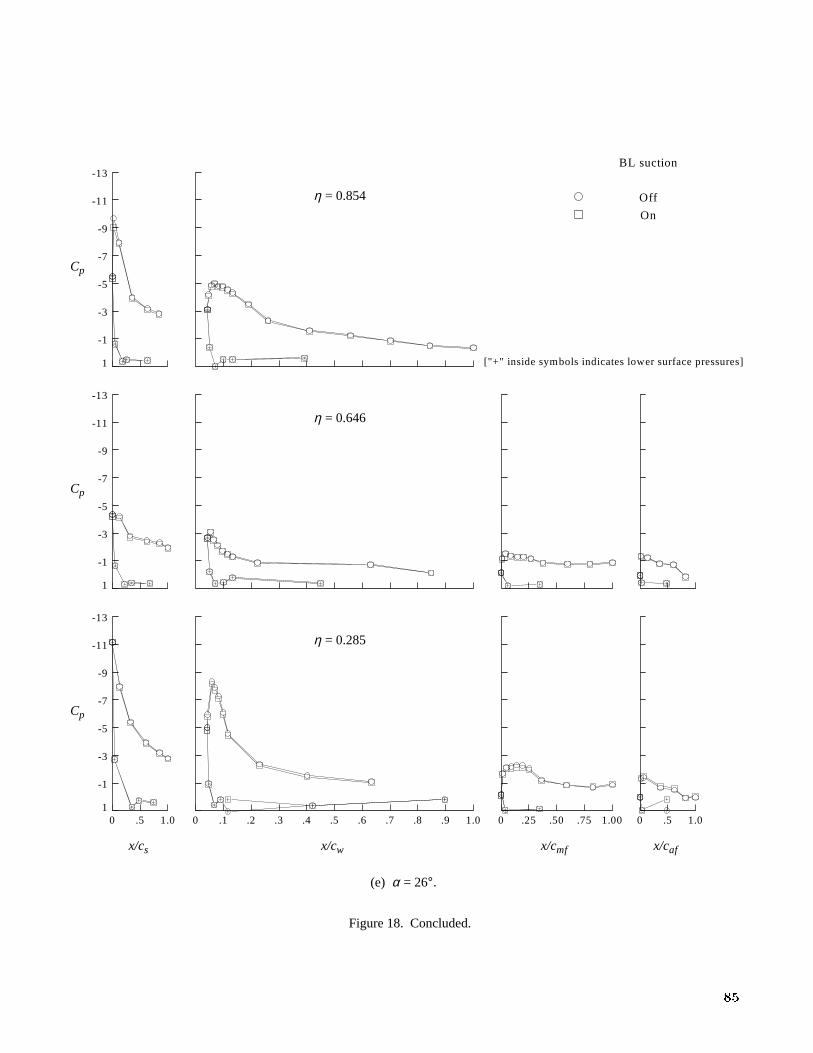
Pressure distributions with the tunnel boundarylayer suction system both o� and on are presentedin �gures 17 and 18 for the lowest and highest tun-nel airspeeds at q1 = 30 and 70 psf, respectively.The reduction in tunnel oor boundary layer thick-ness had no e�ect on wing pressures for the test atq1 = 70 psf and only a slight e�ect for the test atq1 = 30 psf.
Engine and Ground Plane E�ects
The remainder of this report discusses the ADPand ground plane e�ect on the transport modelaerodynamic characteristics. The isolated transportmodel high-lift wing con�guration is used as a base-line reference.
E�ect of ADP. The ADP was installed in closeproximity to the high-lift wing of the semispan trans-port model to simulate a wing-mounted engine in-stallation. (See �gs. 4 and 5.) The gap betweenthe lower surface of the slat and the ADP nacellewas 2.75 in. For the ADP installation tests, tun-nel conditions were based on free-stream velocity inknots. All remaining data presented in this reportwill use velocity in knots to identify free-stream ow.In nearly all tests with the ADP installed, the trans-port model was operated at a geometric inclinationof 0� to the free-stream ow. The exceptions weretwo tests at � � �2� to determine sensitivity to an-gle of attack. Although the geometric angle of themodel was �xed, the actual aerodynamic angle of at-tack di�ered slightly because of corrections for windtunnel wall e�ect.
Figure 19 presents the e�ect of a windmillingADP on the transport model lift coe�cient, drag co-e�cient, and lift-drag ratio data CL, CD, and L=D,respectively, when plotted versus free-stream veloc-ity in knots. The windmilling ADP had no e�ect onthe lift coe�cient and only slightly reduced the dragcoe�cient which increased the lift-drag ratio. As pre-viously discussed, the ADP was mounted separatelyand thus, any e�ects on the transport model weredue exclusively to aerodynamic interference.
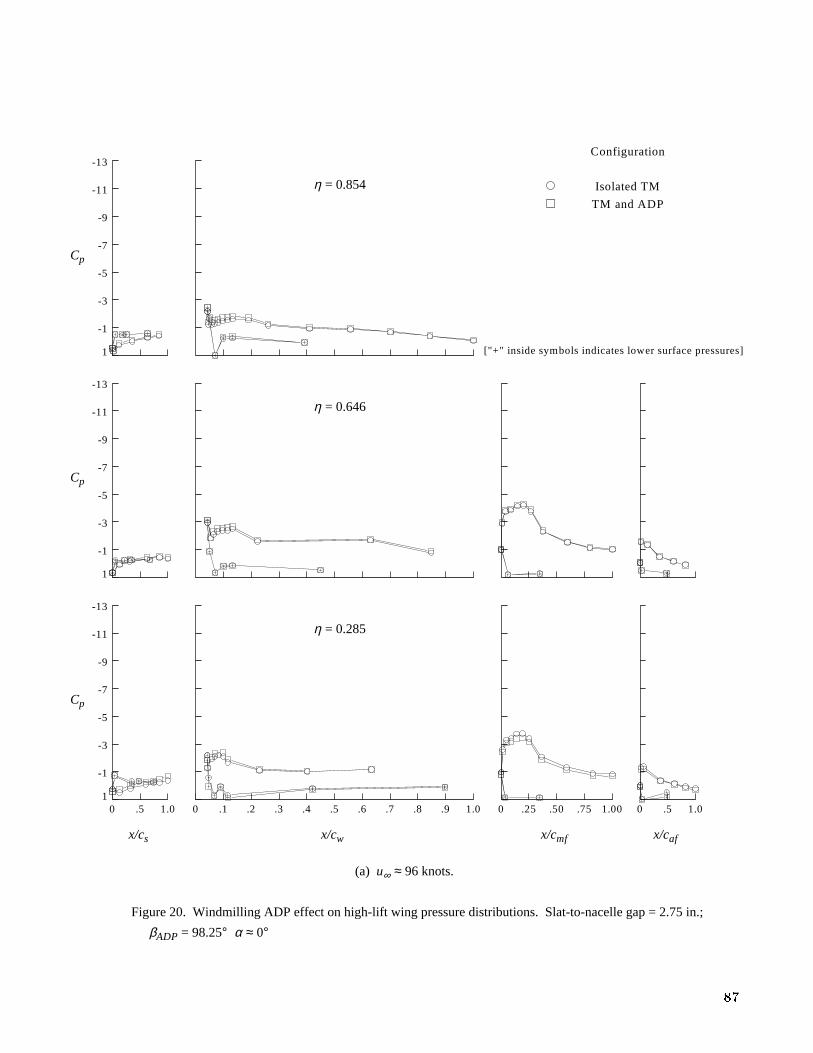
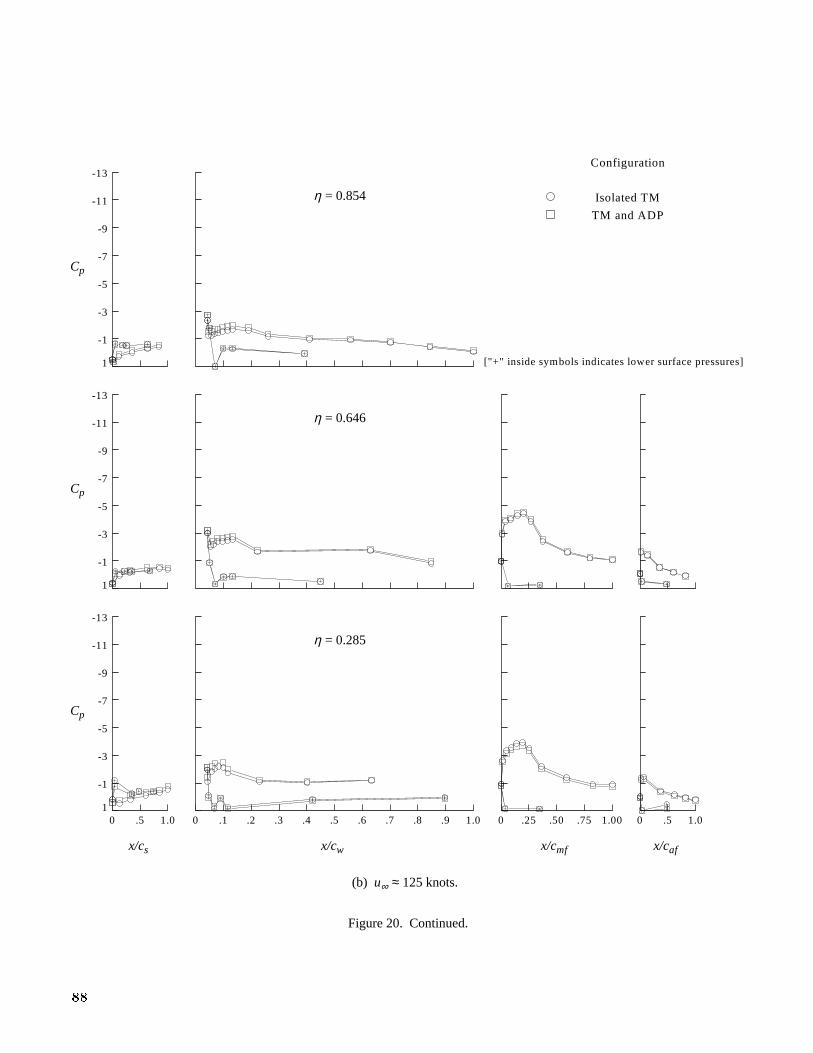
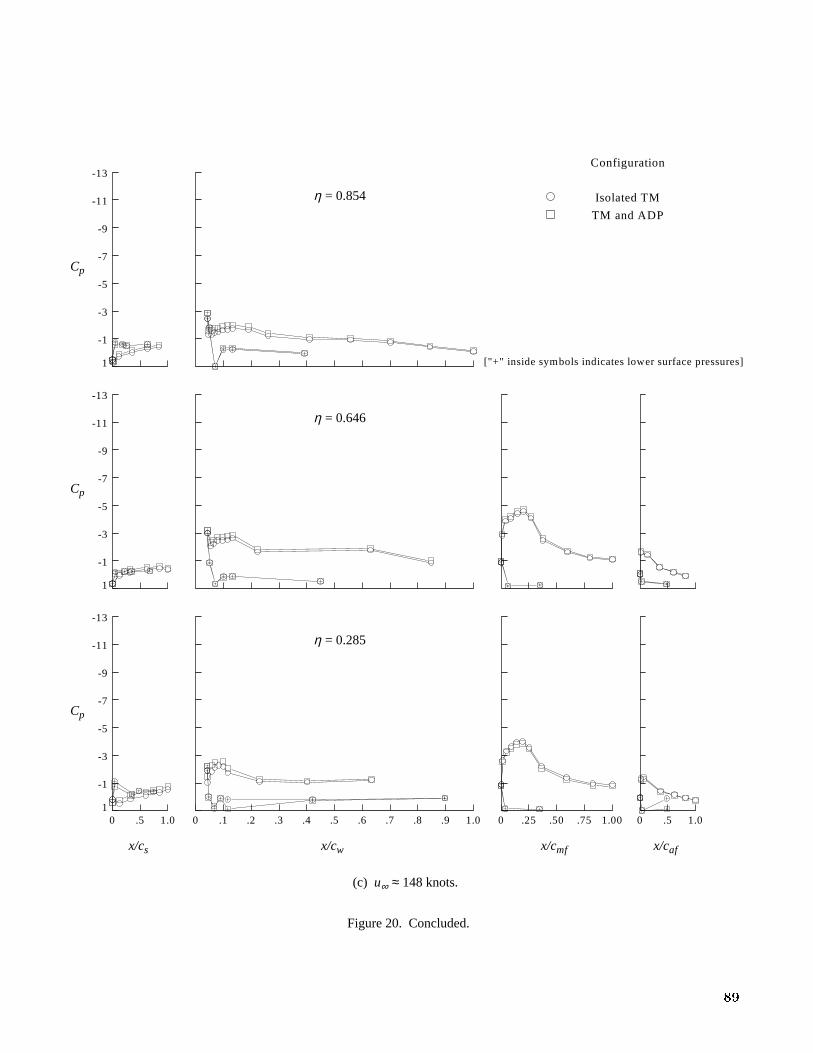
The windmilling ADP e�ect on wing pressuredistributions is presented in �gure 20. The e�ectwas negligible; measurable pressure di�erences werenoted only on the wing upper surface.
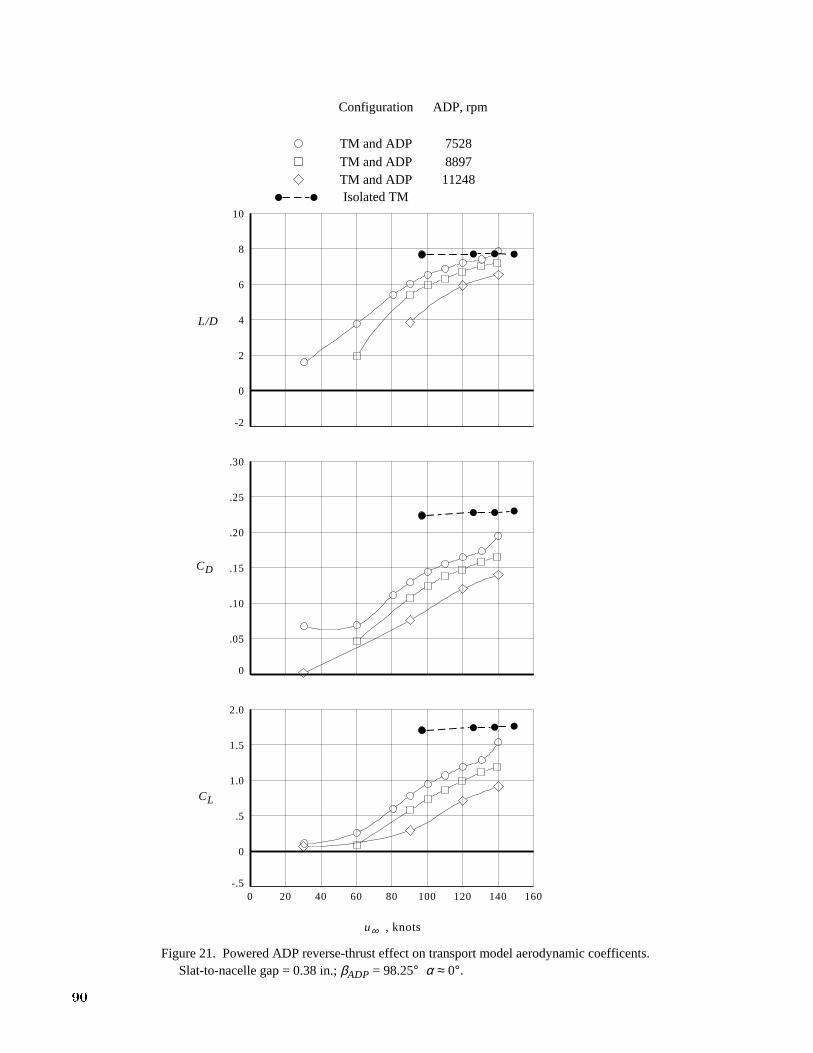
The ADP signi�cantly a�ected the transportmodel aerodynamic coe�cients when powered in re-verse thrust. The results are presented in �gure 21for three ADP rotational speeds and a slat-to-nacellegap of 0.38 in. Two trends are noteworthy in �g-ure 21: (1) as the free-stream velocity increased, thee�ect on transport model aerodynamic coe�cientsdecreased (i.e., the CL, CD, and L=D values for thepowered ADP tests approached isolated transportmodel values) and (2) for a given free-stream velocity,increased ADP rotational speed increased the e�ecton transport model aerodynamic characteristics. Theprimary cause of these e�ects on the transport modelwas almost assuredly the reverse-thrust ow �eld de-veloped by the ADP which blocked the free-stream ow from a portion of the wing.
6
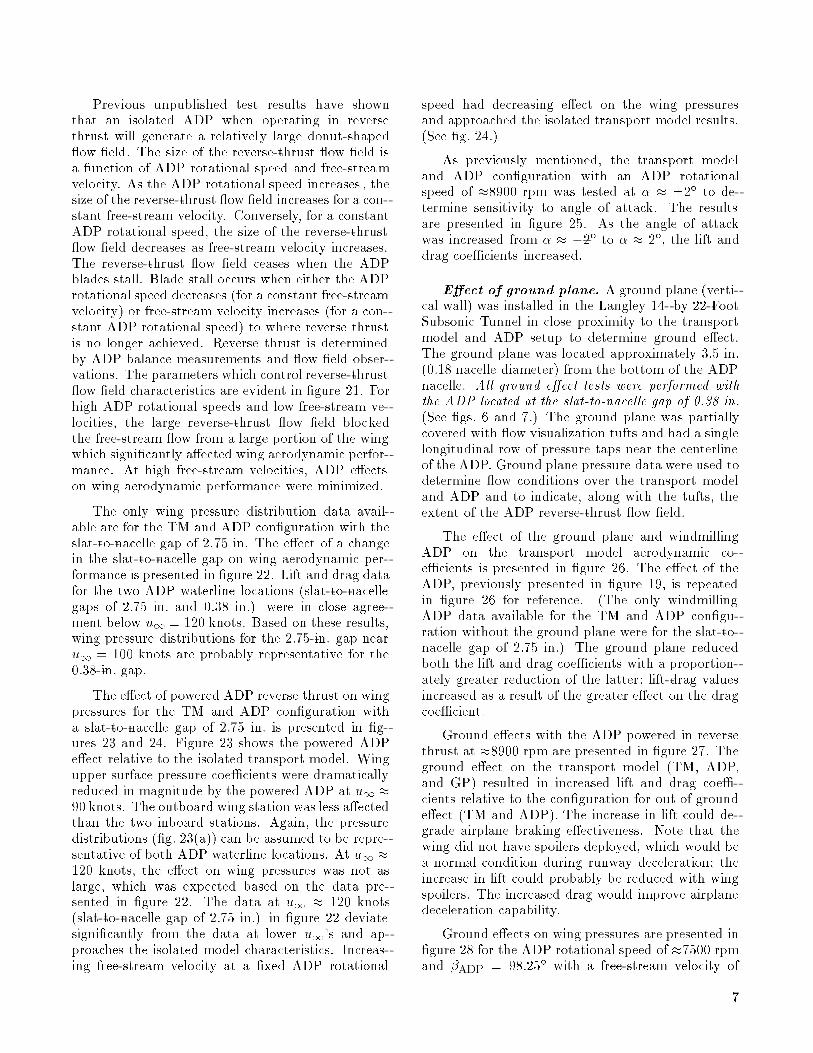
Previous unpublished test results have shownthat an isolated ADP when operating in reversethrust will generate a relatively large donut-shaped ow �eld. The size of the reverse-thrust ow �eld isa function of ADP rotational speed and free-streamvelocity. As the ADP rotational speed increases , thesize of the reverse-thrust ow �eld increases for a con-stant free-stream velocity. Conversely, for a constantADP rotational speed, the size of the reverse-thrust ow �eld decreases as free-stream velocity increases.The reverse-thrust ow �eld ceases when the ADPblades stall. Blade stall occurs when either the ADProtational speed decreases (for a constant free-streamvelocity) or free-stream velocity increases (for a con-stant ADP rotational speed) to where reverse thrustis no longer achieved. Reverse thrust is determinedby ADP balance measurements and ow �eld obser-vations. The parameters which control reverse-thrust ow �eld characteristics are evident in �gure 21. Forhigh ADP rotational speeds and low free-stream ve-locities, the large reverse-thrust ow �eld blockedthe free-stream ow from a large portion of the wingwhich signi�cantly a�ected wing aerodynamic perfor-mance. At high free-stream velocities, ADP e�ectson wing aerodynamic performance were minimized.
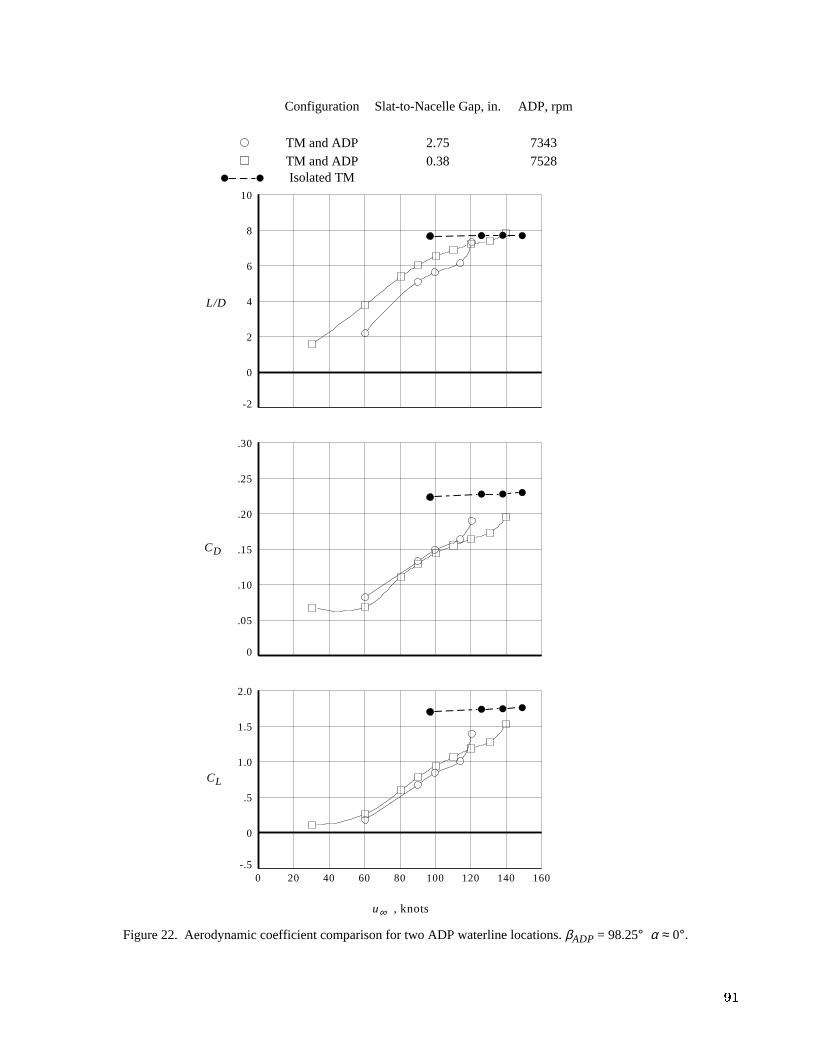
The only wing pressure distribution data avail-able are for the TM and ADP con�guration with theslat-to-nacelle gap of 2.75 in. The e�ect of a changein the slat-to-nacelle gap on wing aerodynamic per-formance is presented in �gure 22. Lift and drag datafor the two ADP waterline locations (slat-to-nacellegaps of 2.75 in. and 0.38 in.) were in close agree-ment below u1 = 120 knots. Based on these results,wing pressure distributions for the 2.75-in. gap nearu1 = 100 knots are probably representative for the0.38-in. gap.
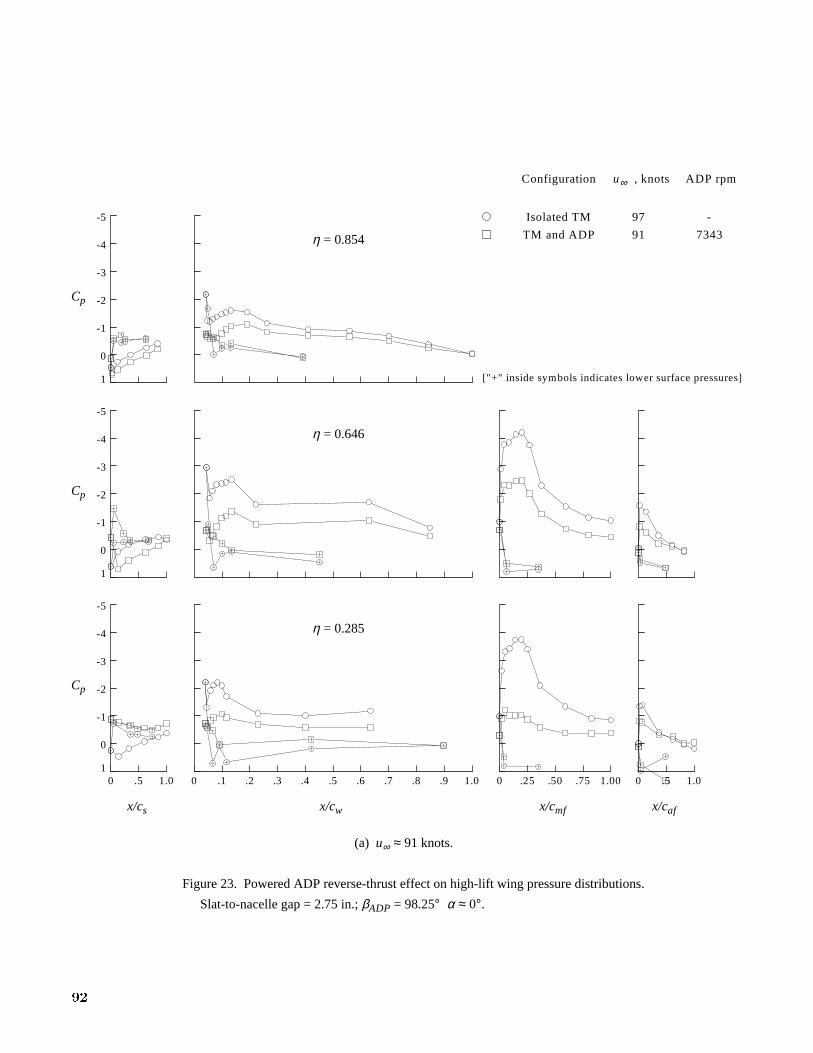
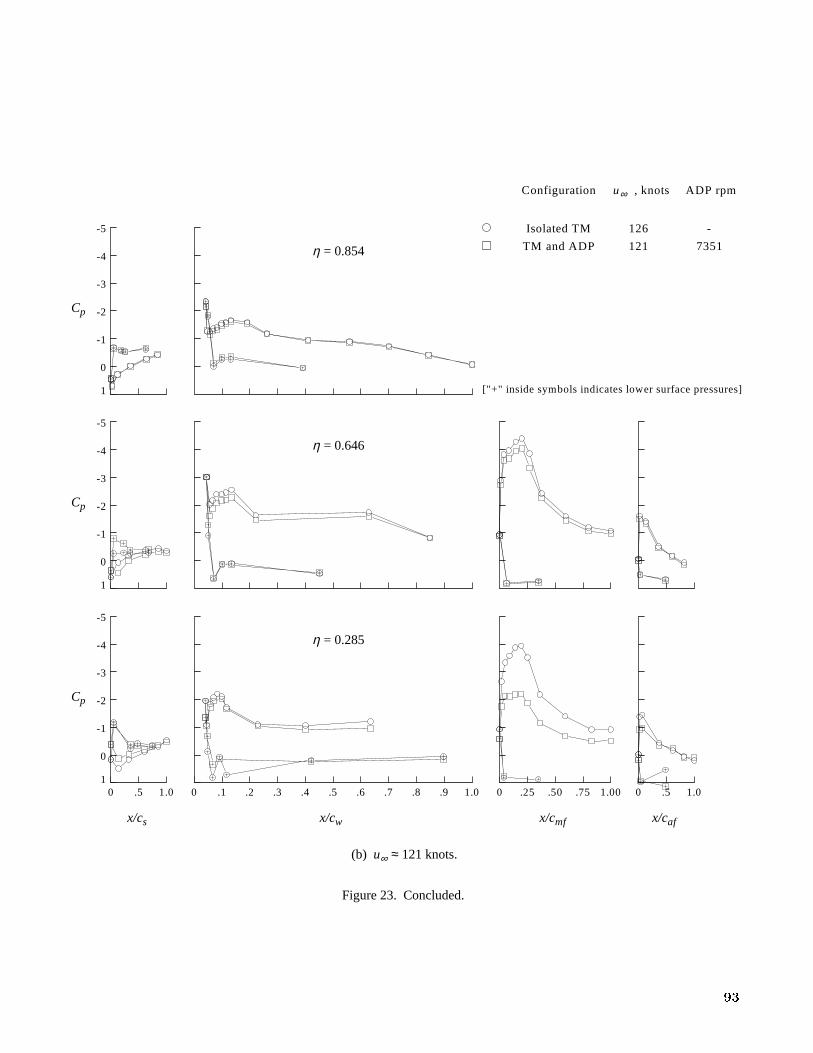
The e�ect of powered ADP reverse thrust on wingpressures for the TM and ADP con�guration witha slat-to-nacelle gap of 2.75 in. is presented in �g-ures 23 and 24. Figure 23 shows the powered ADPe�ect relative to the isolated transport model. Wingupper surface pressure coe�cients were dramaticallyreduced in magnitude by the powered ADP at u1 �90 knots. The outboard wing station was less a�ectedthan the two inboard stations. Again, the pressuredistributions (�g. 23(a)) can be assumed to be repre-sentative of both ADP waterline locations. At u1 �120 knots, the e�ect on wing pressures was not aslarge, which was expected based on the data pre-sented in �gure 22. The data at u1 � 120 knots(slat-to-nacelle gap of 2.75 in.) in �gure 22 deviatesigni�cantly from the data at lower u1's and ap-proaches the isolated model characteristics. Increas-ing free-stream velocity at a �xed ADP rotational
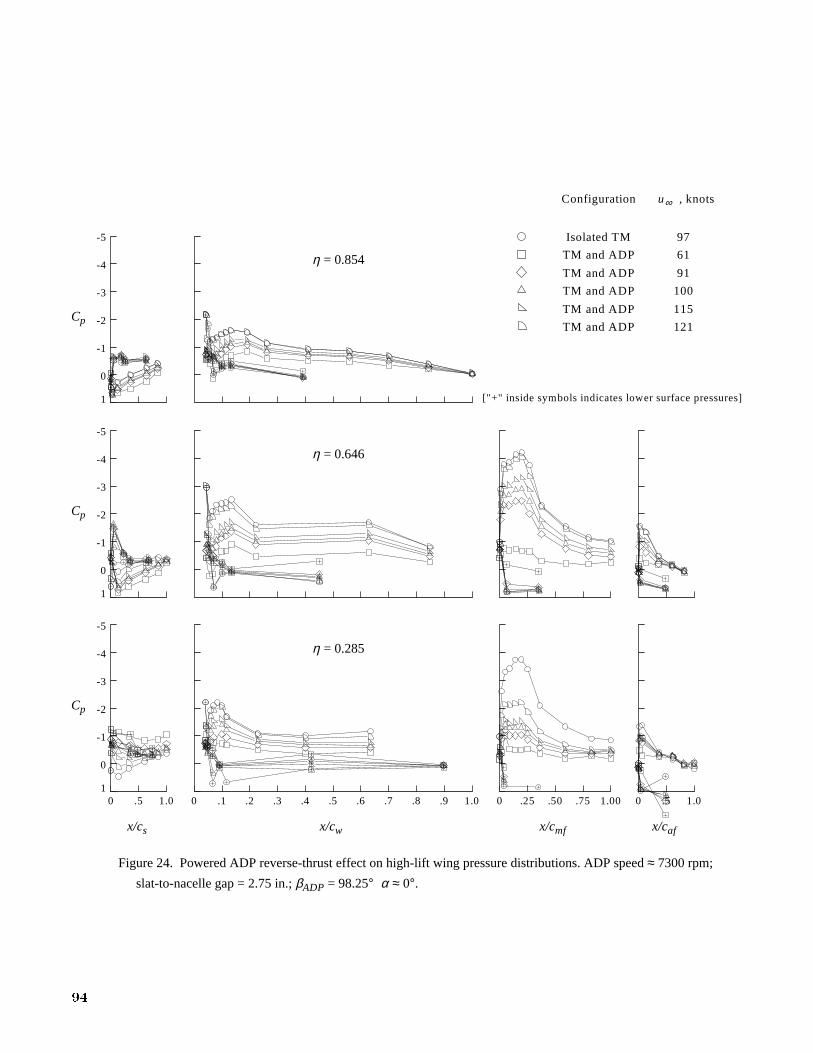
speed had decreasing e�ect on the wing pressuresand approached the isolated transport model results.(See �g. 24.)
As previously mentioned, the transport modeland ADP con�guration with an ADP rotationalspeed of �8900 rpm was tested at � � �2� to de-termine sensitivity to angle of attack. The resultsare presented in �gure 25. As the angle of attackwas increased from � � �2� to � � 2�, the lift anddrag coe�cients increased.
E�ect of ground plane. A ground plane (verti-cal wall) was installed in the Langley 14- by 22-FootSubsonic Tunnel in close proximity to the transportmodel and ADP setup to determine ground e�ect.The ground plane was located approximately 3.5 in.(0.18 nacelle diameter) from the bottom of the ADPnacelle. All ground e�ect tests were performed with
the ADP located at the slat-to-nacelle gap of 0.38 in.
(See �gs. 6 and 7.) The ground plane was partiallycovered with ow visualization tufts and had a singlelongitudinal row of pressure taps near the centerlineof the ADP. Ground plane pressure data were used todetermine ow conditions over the transport modeland ADP and to indicate, along with the tufts, theextent of the ADP reverse-thrust ow �eld.
The e�ect of the ground plane and windmillingADP on the transport model aerodynamic co-e�cients is presented in �gure 26. The e�ect of theADP, previously presented in �gure 19, is repeatedin �gure 26 for reference. (The only windmillingADP data available for the TM and ADP con�gu-ration without the ground plane were for the slat-to-nacelle gap of 2.75 in.) The ground plane reducedboth the lift and drag coe�cients with a proportion-ately greater reduction of the latter; lift-drag valuesincreased as a result of the greater e�ect on the dragcoe�cient.
Ground e�ects with the ADP powered in reversethrust at �8900 rpm are presented in �gure 27. Theground e�ect on the transport model (TM, ADP,and GP) resulted in increased lift and drag coe�-cients relative to the con�guration for out of grounde�ect (TM and ADP). The increase in lift could de-grade airplane braking e�ectiveness. Note that thewing did not have spoilers deployed, which would bea normal condition during runway deceleration; theincrease in lift could probably be reduced with wingspoilers. The increased drag would improve airplanedeceleration capability.
Ground e�ects on wing pressures are presented in�gure 28 for the ADP rotational speed of �7500 rpmand �ADP = 98:25� with a free-stream velocity of
7
�90 knots. The ground e�ect (TM, ADP, and GPcon�guration) resulted in a greater increase in pres-sure coe�cient at the mid-span station � = 0.646than at the other two span stations which indicateda ground-induced buoyancy. Upper surface pressureson the main ap at the inboard station � = 0.285 in-dicated complete ow separation for both tests withthe ADP installed. (As a reminder, the pressure dis-tributions for the TM and ADP con�guration in �g-ure 28 were for the ADP at the 2.75-in. slat-to-nacellegap, which as previously discussed, was assumed tobe representative of the 0.38-in. slat-to-nacelle gap.)
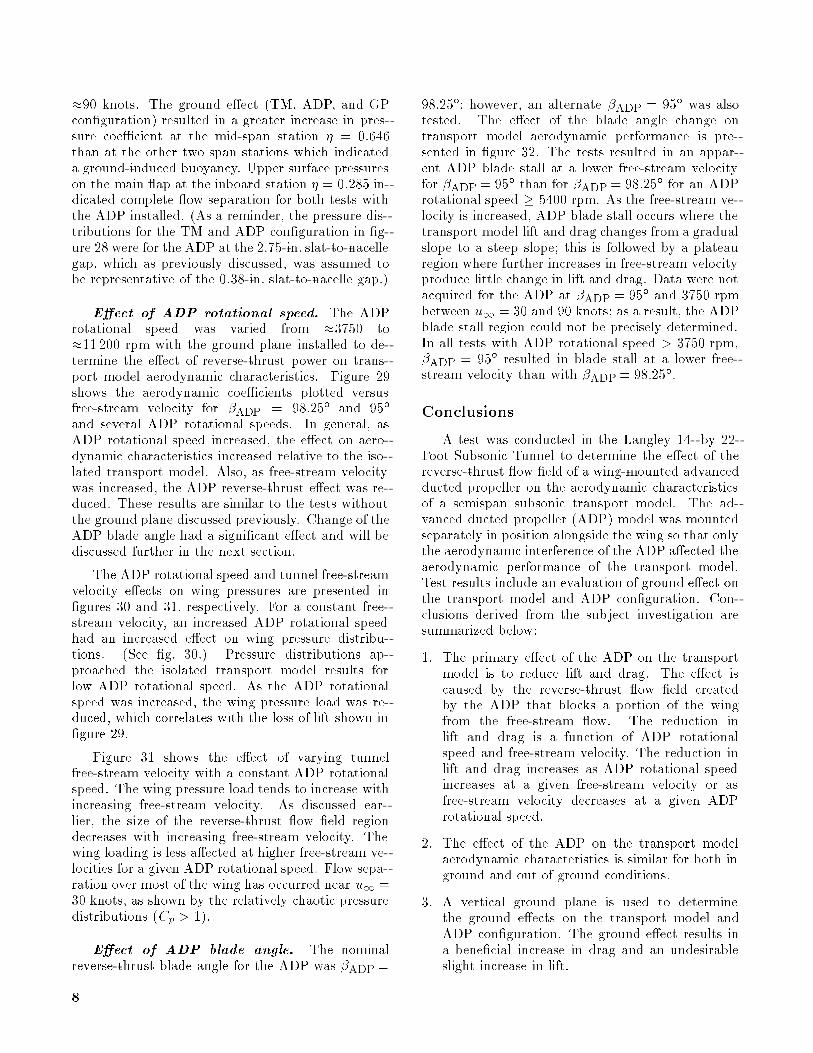
E�ect of ADP rotational speed. The ADProtational speed was varied from �3750 to�11 200 rpm with the ground plane installed to de-termine the e�ect of reverse-thrust power on trans-port model aerodynamic characteristics. Figure 29shows the aerodynamic coe�cients plotted versusfree-stream velocity for �ADP = 98:25� and 95�
and several ADP rotational speeds. In general, asADP rotational speed increased, the e�ect on aero-dynamic characteristics increased relative to the iso-lated transport model. Also, as free-stream velocitywas increased, the ADP reverse-thrust e�ect was re-duced. These results are similar to the tests withoutthe ground plane discussed previously. Change of theADP blade angle had a signi�cant e�ect and will bediscussed further in the next section.
The ADP rotational speed and tunnel free-streamvelocity e�ects on wing pressures are presented in�gures 30 and 31, respectively. For a constant free-stream velocity, an increased ADP rotational speedhad an increased e�ect on wing pressure distribu-tions. (See �g. 30.) Pressure distributions ap-proached the isolated transport model results forlow ADP rotational speed. As the ADP rotationalspeed was increased, the wing pressure load was re-duced, which correlates with the loss of lift shown in�gure 29.
Figure 31 shows the e�ect of varying tunnelfree-stream velocity with a constant ADP rotationalspeed. The wing pressure load tends to increase withincreasing free-stream velocity. As discussed ear-lier, the size of the reverse-thrust ow �eld regiondecreases with increasing free-stream velocity. Thewing loading is less a�ected at higher free-stream ve-locities for a given ADP rotational speed. Flow sepa-ration over most of the wing has occurred near u1 =30 knots, as shown by the relatively chaotic pressuredistributions (Cp > 1).
E�ect of ADP blade angle. The nominalreverse-thrust blade angle for the ADP was �ADP=
98:25�; however, an alternate �ADP = 95� was alsotested. The e�ect of the blade angle change ontransport model aerodynamic performance is pre-sented in �gure 32. The tests resulted in an appar-ent ADP blade stall at a lower free-stream velocityfor �ADP= 95� than for �ADP= 98:25� for an ADProtational speed � 5400 rpm. As the free-stream ve-locity is increased, ADP blade stall occurs where thetransport model lift and drag changes from a gradualslope to a steep slope; this is followed by a plateauregion where further increases in free-stream velocityproduce little change in lift and drag. Data were notacquired for the ADP at �ADP = 95� and 3750 rpmbetween u1 = 30 and 90 knots; as a result, the ADPblade stall region could not be precisely determined.In all tests with ADP rotational speed > 3750 rpm,�ADP = 95� resulted in blade stall at a lower free-stream velocity than with �ADP= 98:25�.
Conclusions
A test was conducted in the Langley 14- by 22-Foot Subsonic Tunnel to determine the e�ect of thereverse-thrust ow �eld of a wing-mounted advancedducted propeller on the aerodynamic characteristicsof a semispan subsonic transport model. The ad-vanced ducted propeller (ADP) model was mountedseparately in position alongside the wing so that onlythe aerodynamic interference of the ADP a�ected theaerodynamic performance of the transport model.Test results include an evaluation of ground e�ect onthe transport model and ADP con�guration. Con-clusions derived from the subject investigation aresummarized below:
1. The primary e�ect of the ADP on the transportmodel is to reduce lift and drag. The e�ect iscaused by the reverse-thrust ow �eld createdby the ADP that blocks a portion of the wingfrom the free-stream ow. The reduction inlift and drag is a function of ADP rotationalspeed and free-stream velocity. The reduction inlift and drag increases as ADP rotational speedincreases at a given free-stream velocity or asfree-stream velocity decreases at a given ADProtational speed.
2. The e�ect of the ADP on the transport modelaerodynamic characteristics is similar for both inground and out of ground conditions.
3. A vertical ground plane is used to determinethe ground e�ects on the transport model andADP con�guration. The ground e�ect results ina bene�cial increase in drag and an undesirableslight increase in lift.
8
The test results form a comprehensive data setthat supports the application of the ADP engine and
airplane concept on the next generation of advanced
subsonic transports. Before this investigation, the
engine application was predicted to have detrimental
ground e�ect characteristics. Ground e�ect test
measurements indicated no critical problems andwere the �rst step in proving the viability of this
engine and airplane con�guration.
NASA Langley Research Center
Hampton, VA 23681-0001
March 14, 1994
9
Appendix
Ground E�ect Test Procedure and
Philosophy
To determine ground e�ect on the semispan sub-sonic transport model, a temporary vertical wall wasdesigned, fabricated, and installed in the test sectionof the Langley 14- by 22-Foot Subsonic Tunnel. Thiswall was positioned in close proximity to the trans-port model and ADP setup and served as a groundplane for the ground e�ect tests.
The procedure and philosophy of the ground ef-fect tests are summarized below:
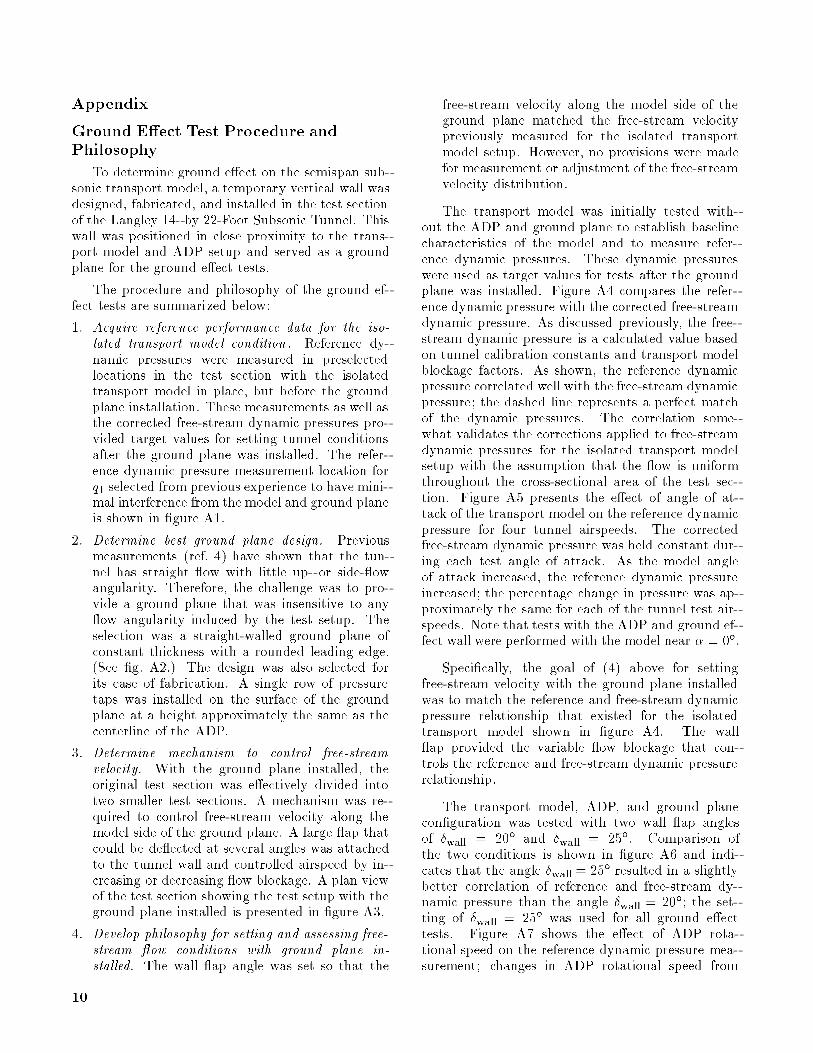
1. Acquire reference performance data for the iso-
lated transport model condition. Reference dy-namic pressures were measured in preselectedlocations in the test section with the isolatedtransport model in place, but before the groundplane installation. These measurements as well asthe corrected free-stream dynamic pressures pro-vided target values for setting tunnel conditionsafter the ground plane was installed. The refer-ence dynamic pressure measurement location forq1 selected from previous experience to have mini-mal interference from the model and ground planeis shown in �gure A1.
2. Determine best ground plane design. Previousmeasurements (ref. 4) have shown that the tun-nel has straight ow with little up- or side- owangularity. Therefore, the challenge was to pro-vide a ground plane that was insensitive to any ow angularity induced by the test setup. Theselection was a straight-walled ground plane ofconstant thickness with a rounded leading edge.(See �g. A2.) The design was also selected forits ease of fabrication. A single row of pressuretaps was installed on the surface of the groundplane at a height approximately the same as thecenterline of the ADP.
3. Determine mechanism to control free-stream
velocity. With the ground plane installed, theoriginal test section was e�ectively divided intotwo smaller test sections. A mechanism was re-quired to control free-stream velocity along themodel side of the ground plane. A large ap thatcould be de ected at several angles was attachedto the tunnel wall and controlled airspeed by in-creasing or decreasing ow blockage. A plan viewof the test section showing the test setup with theground plane installed is presented in �gure A3.
4. Develop philosophy for setting and assessing free-
stream ow conditions with ground plane in-
stalled. The wall ap angle was set so that the
free-stream velocity along the model side of theground plane matched the free-stream velocitypreviously measured for the isolated transportmodel setup. However, no provisions were madefor measurement or adjustment of the free-streamvelocity distribution.
The transport model was initially tested with-out the ADP and ground plane to establish baselinecharacteristics of the model and to measure refer-ence dynamic pressures. These dynamic pressureswere used as target values for tests after the groundplane was installed. Figure A4 compares the refer-ence dynamic pressure with the corrected free-streamdynamic pressure. As discussed previously, the free-stream dynamic pressure is a calculated value basedon tunnel calibration constants and transport modelblockage factors. As shown, the reference dynamicpressure correlated well with the free-stream dynamicpressure; the dashed line represents a perfect matchof the dynamic pressures. The correlation some-what validates the corrections applied to free-streamdynamic pressures for the isolated transport modelsetup with the assumption that the ow is uniformthroughout the cross-sectional area of the test sec-tion. Figure A5 presents the e�ect of angle of at-tack of the transport model on the reference dynamicpressure for four tunnel airspeeds. The correctedfree-stream dynamic pressure was held constant dur-ing each test angle of attack. As the model angleof attack increased, the reference dynamic pressureincreased; the percentage change in pressure was ap-proximately the same for each of the tunnel test air-speeds. Note that tests with the ADP and ground ef-fect wall were performed with the model near � = 0�.
Speci�cally, the goal of (4) above for settingfree-stream velocity with the ground plane installedwas to match the reference and free-stream dynamicpressure relationship that existed for the isolatedtransport model shown in �gure A4. The wall ap provided the variable ow blockage that con-trols the reference and free-stream dynamic pressurerelationship.
The transport model, ADP, and ground planecon�guration was tested with two wall ap anglesof �
wall= 20� and �
wall= 25�. Comparison of
the two conditions is shown in �gure A6 and indi-cates that the angle �
wall= 25� resulted in a slightly
better correlation of reference and free-stream dy-namic pressure than the angle �
wall= 20�; the set-
ting of �wall
= 25� was used for all ground e�ecttests. Figure A7 shows the e�ect of ADP rota-tional speed on the reference dynamic pressure mea-surement; changes in ADP rotational speed from
10
�3750 rpm to �11 200 rpm resulted in negligiblechanges in pressures.
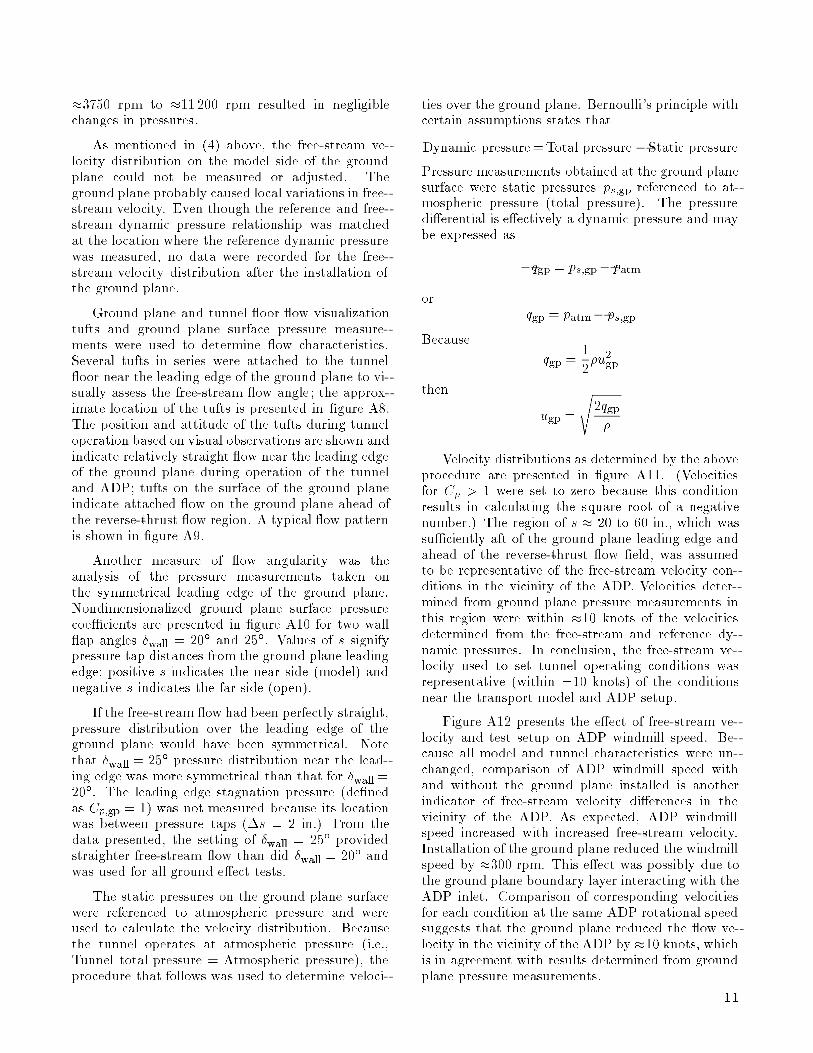
As mentioned in (4) above, the free-stream ve-locity distribution on the model side of the groundplane could not be measured or adjusted. Theground plane probably caused local variations in free-stream velocity. Even though the reference and free-stream dynamic pressure relationship was matchedat the location where the reference dynamic pressurewas measured, no data were recorded for the free-stream velocity distribution after the installation ofthe ground plane.
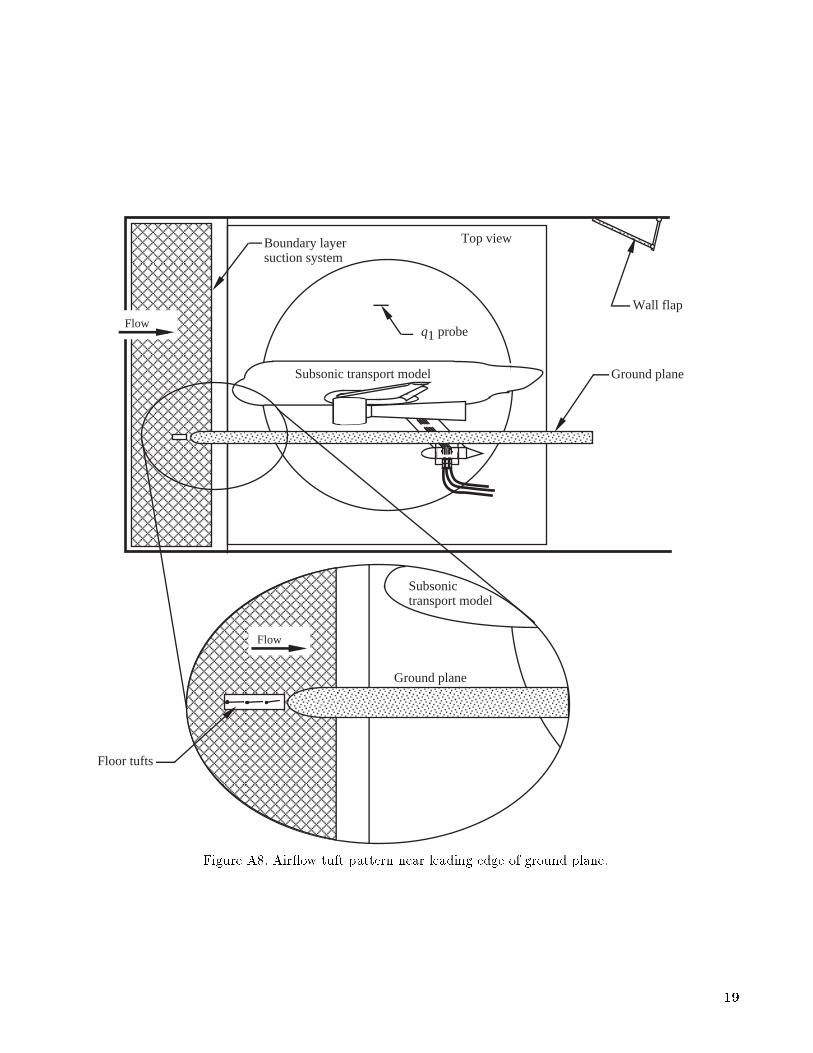
Ground plane and tunnel oor ow visualizationtufts and ground plane surface pressure measure-ments were used to determine ow characteristics.Several tufts in series were attached to the tunnel oor near the leading edge of the ground plane to vi-sually assess the free-stream ow angle; the approx-imate location of the tufts is presented in �gure A8.The position and attitude of the tufts during tunneloperation based on visual observations are shown andindicate relatively straight ow near the leading edgeof the ground plane during operation of the tunneland ADP; tufts on the surface of the ground planeindicate attached ow on the ground plane ahead ofthe reverse-thrust ow region. A typical ow patternis shown in �gure A9.
Another measure of ow angularity was theanalysis of the pressure measurements taken onthe symmetrical leading edge of the ground plane.Nondimensionalized ground plane surface pressurecoe�cients are presented in �gure A10 for two wall ap angles �wall = 20� and 25�. Values of s signifypressure tap distances from the ground plane leadingedge; positive s indicates the near side (model) andnegative s indicates the far side (open).
If the free-stream ow had been perfectly straight,pressure distribution over the leading edge of theground plane would have been symmetrical. Notethat �wall = 25� pressure distribution near the lead-ing edge was more symmetrical than that for �wall =20�. The leading edge stagnation pressure (de�nedas Cp;gp = 1) was not measured because its locationwas between pressure taps (�s = 2 in.) From thedata presented, the setting of �wall = 25� providedstraighter free-stream ow than did �wall = 20� andwas used for all ground e�ect tests.
The static pressures on the ground plane surfacewere referenced to atmospheric pressure and wereused to calculate the velocity distribution. Becausethe tunnel operates at atmospheric pressure (i.e.,Tunnel total pressure = Atmospheric pressure), theprocedure that follows was used to determine veloci-
ties over the ground plane. Bernoulli's principle withcertain assumptions states that
Dynamic pressure =Total pressure �Static pressure
Pressure measurements obtained at the ground planesurface were static pressures ps;gp referenced to at-mospheric pressure (total pressure). The pressuredi�erential is e�ectively a dynamic pressure and maybe expressed as
�qgp = ps;gp� patm
orqgp = patm� ps;gp
Because
qgp =1
2�u2gp
then
ugp =
s2qgp
�
Velocity distributions as determined by the aboveprocedure are presented in �gure A11. (Velocitiesfor Cp > 1 were set to zero because this conditionresults in calculating the square root of a negativenumber.) The region of s � 20 to 60 in., which wassu�ciently aft of the ground plane leading edge andahead of the reverse-thrust ow �eld, was assumedto be representative of the free-stream velocity con-ditions in the vicinity of the ADP. Velocities deter-mined from ground plane pressure measurements inthis region were within �10 knots of the velocitiesdetermined from the free-stream and reference dy-namic pressures. In conclusion, the free-stream ve-locity used to set tunnel operating conditions wasrepresentative (within �10 knots) of the conditionsnear the transport model and ADP setup.
Figure A12 presents the e�ect of free-stream ve-locity and test setup on ADP windmill speed. Be-cause all model and tunnel characteristics were un-changed, comparison of ADP windmill speed withand without the ground plane installed is anotherindicator of free-stream velocity di�erences in thevicinity of the ADP. As expected, ADP windmillspeed increased with increased free-stream velocity.Installation of the ground plane reduced the windmillspeed by �300 rpm. This e�ect was possibly due tothe ground plane boundary layer interacting with theADP inlet. Comparison of corresponding velocitiesfor each condition at the same ADP rotational speedsuggests that the ground plane reduced the ow ve-locity in the vicinity of the ADP by �10 knots, whichis in agreement with results determined from groundplane pressure measurements.
11
References
1. Zimbrick, R. A.; and Colehour, J. L.: Investigation of
Very High Bypass Ratio Engines for Subsonic Transports.
AIAA-88-2953, Aug. 1990.
2. Leavitt, Laurence D.; and Berrier, Bobby L.: Transonic
Propulsion Aerodynamic Research at NASA Langley Re-
search Center. SAE Tech. Paper Ser. 921937, Oct. 1992.
3. Pendergraft, Odis C., Jr.; Ingraldi, Anthony M.; Re,
Richard J.; and Kariya, TimmyT.: InstallationE�ects of
Wing-Mounted Turbofan Nacelle-Pylonson a 1/17-Scale,
Twin-Engine, Low-Wing Transport Model. NASA TP-
3168, 1992.
4. Gentry, Garl L., Jr.; Quinto, P. Frank; Gatlin, Gregory
M.; and Applin, Zachary T.: The Langley 14- by 22-Foot
Subsonic Tunnel: Description,Flow Characteristics,and
Guide for Users. NASA TP-3008, 1990.
5. Rae, William H., Jr.; and Pope, Alan: Low-Speed Wind
Tunnel Testing, 2nd ed. John Wiley & Sons, Inc., 1984.
6. Heyson, Harry H.: Use of Superpositionin Digital Com-
puters To Obtain Wind-Tunnel Interference Factors for
Arbitrary Con�gurations, With Particular Reference to
V/STOL Models. NASA TR R-302, 1969.
25
AAAAAAAAAAAAAAAAAAAAAAAAAAAAAAAAAAAA
Boundary layersuction system
Top view
Flow
AAAAA
AAAAAAAAAAAAAAAA
AAAAAA
Ground plane
Wall flap
Subsonic transport model
AAAAAAAAAAAAAAAAAAAAAAAAAAAAAAAAAAAAAAAAAA
AAAAAAAAAAAAAAAAAAAAAAAAAAAAAAAAAAA
Subsonictransport model
Ground plane
Floor tufts
Flow
AAAAAAAAAAAAAAAAAAAAAAAA
q1 probe
Figure A8. Air ow tuft pattern near leading edge of ground plane.
19
Sid
e of
tra
nspo
rt b
ody
Flow
Pre
ssur
e ta
p st
atio
ns
AD
P c
ente
rlin
e
η
= 0
.854
η
= 0.
646
η =
0.38
7
η
= 0
.285
Sid
e of
tra
nspo
rt b
ody
Flow
Pre
ssur
e ta
p st
atio
ns
AD
P c
ente
rlin
e
η =
0.8
54
η =
0.6
46
η =
0.3
87
η
= 0
.285
(b)
Cru
ise
win
g pl
anfo
rm.
(c)
Hig
h-lif
t win
g pl
anfo
rm.
Figu
re 1
. C
oncl
uded
.
27
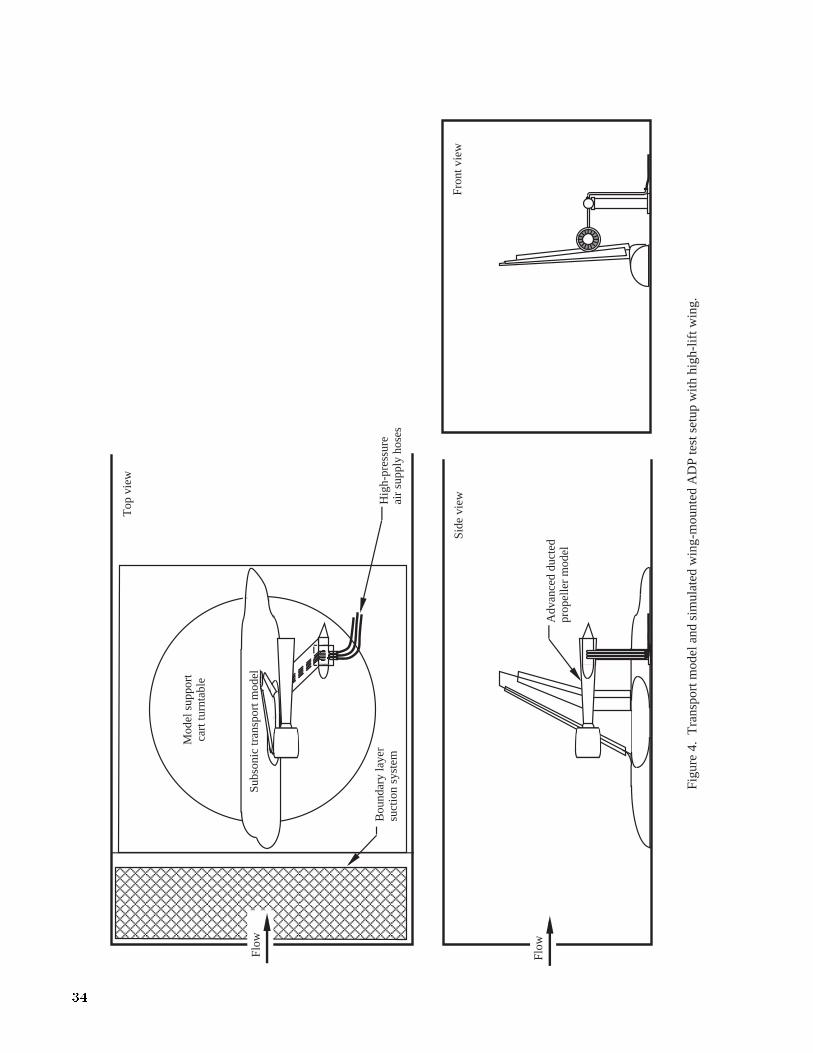
Figu
re 4
. T
rans
port
mod
el a
nd s
imul
ated
win
g-m
ount
ed A
DP
test
set
up w
ith h
igh-
lift w
ing.
AAAAAAAAAAAAAAAAAAAAAAAAAAAAAAAAAAAAAAAAAAAA
Bou
ndar
y la
yer
suct
ion
syst
em
Top
vie
w
Flow
Fron
t vie
w
AAAAAA
Subs
onic
tran
spor
t mod
el
Side
vie
w
Adv
ance
d du
cted
pr
opel
ler
mod
el
Hig
h-pr
essu
reai
r su
pply
hos
es
Mod
el s
uppo
rtca
rt tu
rnta
ble
Flow
34
0 .05 .10 .15 .20 .25 .30 .35 .40 .45 .50 .55 .60 .65 .70 .75 .80 .85 .90 .95 1.00
x/cw
1
-1
-3
-5
-7
-9
-11
Cp
η = 0.285
(a) α = 0°.
Figure 10. Free-stream speed effect on cruise wing pressure distributions. Tunnel floor boundary layer suction off.
1
-1
-3
-5
-7
-9
-11
Cp
η = 0.646
1
-1
-3
-5
-7
-9
-11
Cp
q∞ , psf
30 50 60 70 100
η = 0.854
["+" inside symbols indicates lower surface pressures]
1
-1
-3
-5
-7
-9
-11
Cp
1
-1
-3
-5
-7
-9
-11
Cp
1
-1
-3
-5
-7
-9
-11
Cp
46
0 .05 .10 .15 .20 .25 .30 .35 .40 .45 .50 .55 .60 .65 .70 .75 .80 .85 .90 .95 1.00
x/cw
1
-1
-3
-5
-7
-9
-11
Cp
η = 0.285
(b) α = 4°.
Figure 10. Continued.
1
-1
-3
-5
-7
-9
-11
Cp
η = 0.646
1
-1
-3
-5
-7
-9
-11
Cp
q∞ , psf
30 50 60 70 100
η = 0.854
["+" inside symbols indicates lower surface pressures]
1
-1
-3
-5
-7
-9
-11
Cp
1
-1
-3
-5
-7
-9
-11
Cp
1
-1
-3
-5
-7
-9
-11
Cp
47
0 .05 .10 .15 .20 .25 .30 .35 .40 .45 .50 .55 .60 .65 .70 .75 .80 .85 .90 .95 1.00
x/cw
1
-1
-3
-5
-7
-9
-11
Cp
η = 0.285
(c) α = 8°.
Figure 10. Continued.
1
-1
-3
-5
-7
-9
-11
Cp
η = 0.646
1
-1
-3
-5
-7
-9
-11
Cp
q∞ , psf
30 50 60 70 100
η = 0.854
["+" inside symbols indicates lower surface pressures]
1
-1
-3
-5
-7
-9
-11
Cp
1
-1
-3
-5
-7
-9
-11
Cp
1
-1
-3
-5
-7
-9
-11
Cp
48
0 .05 .10 .15 .20 .25 .30 .35 .40 .45 .50 .55 .60 .65 .70 .75 .80 .85 .90 .95 1.00
x/cw
1
-1
-3
-5
-7
-9
-11
Cp
η = 0.285
(d) α = 12°.
Figure 10. Continued.
1
-1
-3
-5
-7
-9
-11
Cp
η = 0.646
1
-1
-3
-5
-7
-9
-11
Cp
q∞ , psf
30 50 60 70 100
η = 0.854
["+" inside symbols indicates lower surface pressures]
1
-1
-3
-5
-7
-9
-11
Cp
1
-1
-3
-5
-7
-9
-11
Cp
1
-1
-3
-5
-7
-9
-11
Cp
49
0 .05 .10 .15 .20 .25 .30 .35 .40 .45 .50 .55 .60 .65 .70 .75 .80 .85 .90 .95 1.00
x/cw
1
-1
-3
-5
-7
-9
-11
Cp
η = 0.285
(e) α = 14°.
Figure 10. Continued.
1
-1
-3
-5
-7
-9
-11
Cp
η = 0.646
1
-1
-3
-5
-7
-9
-11
Cp
q∞ , psf
30 50 60 70 100
η = 0.854
["+" inside symbols indicates lower surface pressures]
1
-1
-3
-5
-7
-9
-11
Cp
1
-1
-3
-5
-7
-9
-11
Cp
1
-1
-3
-5
-7
-9
-11
Cp
50
0 .05 .10 .15 .20 .25 .30 .35 .40 .45 .50 .55 .60 .65 .70 .75 .80 .85 .90 .95 1.00
x/cw
1
-1
-3
-5
-7
-9
-11
Cp
η = 0.285
(f) α = 16°.
Figure 10. Concluded.
1
-1
-3
-5
-7
-9
-11
Cp
η = 0.646
1
-1
-3
-5
-7
-9
-11
Cp
q∞ , psf
30 50 61 70 100
η = 0.854
["+" inside symbols indicates lower surface pressures]
1
-1
-3
-5
-7
-9
-11
Cp
1
-1
-3
-5
-7
-9
-11
Cp
1
-1
-3
-5
-7
-9
-11
Cp
51
0 .5 1.0
x/cs
1
-1
-3
-5
-7
-9
-11
-13
Cp
0 .1 .2 .3 .4 .5 .6 .7 .8 .9 1.0
x/cw
η = 0.285
0 .25 .50 .75 1.00
x/cmf
0 .5 1.0
x/caf
(a) α = 0°.
Figure 11. Free-stream speed effect on high-lift wing pressure distributions. Tunnel floor boundary layer suction off.
1
-1
-3
-5
-7
-9
-11
-13
Cp
η = 0.646
1
-1
-3
-5
-7
-9
-11
-13
Cp
q∞ , psf
30
50
60
70
η = 0.854
["+" inside symbols indicates lower surface pressures]
52
0 .5 1.0
x/cs
1
-1
-3
-5
-7
-9
-11
-13
Cp
0 .1 .2 .3 .4 .5 .6 .7 .8 .9 1.0
x/cw
η = 0.285
0 .25 .50 .75 1.00
x/cmf
0 .5 1.0
x/caf
(b) α = 8°.
Figure 11. Continued.
1
-1
-3
-5
-7
-9
-11
-13
Cp
η = 0.646
1
-1
-3
-5
-7
-9
-11
-13
Cp
q∞ , psf
30
50
60
70
η = 0.854
["+" inside symbols indicates lower surface pressures]
53
0 .5 1.0
x/cs
1
-1
-3
-5
-7
-9
-11
-13
Cp
0 .1 .2 .3 .4 .5 .6 .7 .8 .9 1.0
x/cw
η = 0.285
0 .25 .50 .75 1.00
x/cmf
0 .5 1.0
x/caf
(c) α = 16°.
Figure 11. Continued.
1
-1
-3
-5
-7
-9
-11
-13
Cp
η = 0.646
1
-1
-3
-5
-7
-9
-11
-13
Cp
q∞ , psf
30
50
60
70
η = 0.854
["+" inside symbols indicates lower surface pressures]
54
0 .5 1.0
x/cs
1
-1
-3
-5
-7
-9
-11
-13
Cp
0 .1 .2 .3 .4 .5 .6 .7 .8 .9 1.0
x/cw
η = 0.285
0 .25 .50 .75 1.00
x/cmf
0 .5 1.0
x/caf
(d) α = 22°.
Figure 11. Continued.
1
-1
-3
-5
-7
-9
-11
-13
Cp
η = 0.646
1
-1
-3
-5
-7
-9
-11
-13
Cp
q∞ , psf
30
50
60
70
η = 0.854
["+" inside symbols indicates lower surface pressures]
55
0 .5 1.0
x/cs
1
-1
-3
-5
-7
-9
-11
-13
Cp
0 .1 .2 .3 .4 .5 .6 .7 .8 .9 1.0
x/cw
η = 0.285
0 .25 .50 .75 1.00
x/cmf
0 .5 1.0
x/caf
(e) α = 26°.
Figure 11. Concluded.
1
-1
-3
-5
-7
-9
-11
-13
Cp
η = 0.646
1
-1
-3
-5
-7
-9
-11
-13
Cp
q∞ , psf
30
50
60
70
η = 0.854
["+" inside symbols indicates lower surface pressures]
56
0 .05 .10 .15 .20 .25 .30 .35 .40 .45 .50 .55 .60 .65 .70 .75 .80 .85 .90 .95 1.00
x/cw
1
-1
-3
-5
-7
-9
-11
Cp
η = 0.285
(a) q∞ = 30 psf.
Figure 12. Angle of attack effect on cruise wing pressure distributions. Tunnel floor boundary layer suction off.
1
-1
-3
-5
-7
-9
-11
Cp
η = 0.646
1
-1
-3
-5
-7
-9
-11
Cp
α, deg
0 4 8 12 14 15
η = 0.854
["+" inside symbols indicates lower surface pressures]
1
-1
-3
-5
-7
-9
-11
Cp
1
-1
-3
-5
-7
-9
-11
Cp
1
-1
-3
-5
-7
-9
-11
Cp
57

0 .05 .10 .15 .20 .25 .30 .35 .40 .45 .50 .55 .60 .65 .70 .75 .80 .85 .90 .95 1.00
x/cw
1
-1
-3
-5
-7
-9
-11
Cp
η = 0.285
(b) q∞ = 50 psf.
Figure 12. Continued.
1
-1
-3
-5
-7
-9
-11
Cp
η = 0.646
1
-1
-3
-5
-7
-9
-11
Cp
α, deg
0 4 8 12 14 16
η = 0.854
["+" inside symbols indicates lower surface pressures]
1
-1
-3
-5
-7
-9
-11
Cp
1
-1
-3
-5
-7
-9
-11
Cp
1
-1
-3
-5
-7
-9
-11
Cp
58

0 .05 .10 .15 .20 .25 .30 .35 .40 .45 .50 .55 .60 .65 .70 .75 .80 .85 .90 .95 1.00
x/cw
1
-1
-3
-5
-7
-9
-11
Cp
η = 0.285
(c) q∞ = 60 psf.
Figure 12. Continued.
1
-1
-3
-5
-7
-9
-11
Cp
η = 0.646
1
-1
-3
-5
-7
-9
-11
Cp
α, deg
0 4 8 12 15 16
η = 0.854
["+" inside symbols indicates lower surface pressures]
1
-1
-3
-5
-7
-9
-11
Cp
1
-1
-3
-5
-7
-9
-11
Cp
1
-1
-3
-5
-7
-9
-11
Cp
59
0 .05 .10 .15 .20 .25 .30 .35 .40 .45 .50 .55 .60 .65 .70 .75 .80 .85 .90 .95 1.00
x/cw
1
-1
-3
-5
-7
-9
-11
Cp
η = 0.285
(d) q∞ = 70 psf.
Figure 12. Continued.
1
-1
-3
-5
-7
-9
-11
Cp
η = 0.646
1
-1
-3
-5
-7
-9
-11
Cp
α, deg
0 4 8 12 15 16
η = 0.854
["+" inside symbols indicates lower surface pressures]
1
-1
-3
-5
-7
-9
-11
Cp
1
-1
-3
-5
-7
-9
-11
Cp
1
-1
-3
-5
-7
-9
-11
Cp
60
0 .05 .10 .15 .20 .25 .30 .35 .40 .45 .50 .55 .60 .65 .70 .75 .80 .85 .90 .95 1.00
x/cw
1
-1
-3
-5
-7
-9
-11
Cp
η = 0.285
(e) q∞ = 100 psf.
Figure 12. Concluded.
1
-1
-3
-5
-7
-9
-11
Cp
η = 0.646
1
-1
-3
-5
-7
-9
-11
Cp
α, deg
0 4 8 12 14 16
η = 0.854
["+" inside symbols indicates lower surface pressures]
1
-1
-3
-5
-7
-9
-11
Cp
1
-1
-3
-5
-7
-9
-11
Cp
1
-1
-3
-5
-7
-9
-11
Cp
61
0 .5 1.0
x/cs
1
-1
-3
-5
-7
-9
-11
-13
Cp
0 .1 .2 .3 .4 .5 .6 .7 .8 .9 1.0
x/cw
η = 0.285
0 .25 .50 .75 1.00
x/cmf
0 .5 1.0
x/caf
(a) q∞ = 30 psf.
Figure 13. Angle of attack effect on high-lift wing pressure distributions. Tunnel floor boundary layer suction off.
1
-1
-3
-5
-7
-9
-11
-13
Cp
η = 0.646
1
-1
-3
-5
-7
-9
-11
-13
Cp
α, deg
0
8
16
22
26
η = 0.854
["+" inside symbols indicates lower surface pressures]
62

0 .5 1.0
x/cs
1
-1
-3
-5
-7
-9
-11
-13
Cp
0 .1 .2 .3 .4 .5 .6 .7 .8 .9 1.0
x/cw
η = 0.285
0 .25 .50 .75 1.00
x/cmf
0 .5 1.0
x/caf
(b) q∞ = 50 psf.
Figure 13. Continued.
1
-1
-3
-5
-7
-9
-11
-13
Cp
η = 0.646
1
-1
-3
-5
-7
-9
-11
-13
Cp
α, deg
0
8
16
22
26
η = 0.854
["+" inside symbols indicates lower surface pressures]
63

0 .5 1.0
x/cs
1
-1
-3
-5
-7
-9
-11
-13
Cp
0 .1 .2 .3 .4 .5 .6 .7 .8 .9 1.0
x/cw
η = 0.285
0 .25 .50 .75 1.00
x/cmf
0 .5 1.0
x/caf
(c) q∞ = 60 psf.
Figure 13. Continued.
1
-1
-3
-5
-7
-9
-11
-13
Cp
η = 0.646
1
-1
-3
-5
-7
-9
-11
-13
Cp
α, deg
0
8
16
22
26
η = 0.854
["+" inside symbols indicates lower surface pressures]
64
0 .5 1.0
x/cs
1
-1
-3
-5
-7
-9
-11
-13
Cp
0 .1 .2 .3 .4 .5 .6 .7 .8 .9 1.0
x/cw
η = 0.285
0 .25 .50 .75 1.00
x/cmf
0 .5 1.0
x/caf
(d) q∞ = 70 psf.
Figure 13. Concluded.
1
-1
-3
-5
-7
-9
-11
-13
Cp
η = 0.646
1
-1
-3
-5
-7
-9
-11
-13
Cp
α, deg
0
8
16
22
26
η = 0.854
["+" inside symbols indicates lower surface pressures]
65

-5 0 5 10 15 20 25 30 35
α, deg
-.5
0
.5
1.0
1.5
2.0
2.5
3.0
3.5
CL
-1.0
-.8
-.6
-.4
-.2
0
.2
Cm
0 .1 .2 .3 .4 .5 .6 .7 .8 .9 1.0
CD
BL suction
OffOn
(a) q∞ = 30 psf.
Figure 16. Tunnel floor boundary layer thickness reduction effect on transport model longitudinal aerodynamic
coefficients with high-lift wing.
72
-5 0 5 10 15 20 25 30 35
α, deg
-.5
0
.5
1.0
1.5
2.0
2.5
3.0
3.5
CL
-1.0
-.8
-.6
-.4
-.2
0
.2
Cm
0 .1 .2 .3 .4 .5 .6 .7 .8 .9 1.0
CD
BL suction
OffOn
(b) q∞ = 50 psf.
Figure 16. Continued.
73
-5 0 5 10 15 20 25 30 35
α, deg
-.5
0
.5
1.0
1.5
2.0
2.5
3.0
3.5
CL
-1.0
-.8
-.6
-.4
-.2
0
.2
Cm
0 .1 .2 .3 .4 .5 .6 .7 .8 .9 1.0
CD
BL suction
OffOn
(c) q∞ = 60 psf.
Figure 16. Continued.
74
-5 0 5 10 15 20 25 30 35
α, deg
-.5
0
.5
1.0
1.5
2.0
2.5
3.0
3.5
CL
-1.0
-.8
-.6
-.4
-.2
0
.2
Cm
0 .1 .2 .3 .4 .5 .6 .7 .8 .9 1.0
CD
BL suction
OffOn
(d) q∞ = 70 psf.
Figure 16. Concluded.
75

0 .5 1.0
x/cs
1
-1
-3
-5
-7
-9
-11
-13
Cp
0 .1 .2 .3 .4 .5 .6 .7 .8 .9 1.0
x/cw
η = 0.285
0 .25 .50 .75 1.00
x/cmf
0 .5 1.0
x/caf
(a) α = 0°.
Figure 17. Tunnel floor boundary layer thickness reduction effect on high-lift wing pressure distributions. q∞ = 30 psf.
1
-1
-3
-5
-7
-9
-11
-13
Cp
η = 0.646
1
-1
-3
-5
-7
-9
-11
-13
Cp
BL suction
Off
On
η = 0.854
["+" inside symbols indicates lower surface pressures]
76

0 .5 1.0
x/cs
1
-1
-3
-5
-7
-9
-11
-13
Cp
0 .1 .2 .3 .4 .5 .6 .7 .8 .9 1.0
x/cw
η = 0.285
0 .25 .50 .75 1.00
x/cmf
0 .5 1.0
x/caf
(b) α = 8°.
Figure 17. Continued.
1
-1
-3
-5
-7
-9
-11
-13
Cp
η = 0.646
1
-1
-3
-5
-7
-9
-11
-13
Cp
BL suction
Off
On
η = 0.854
["+" inside symbols indicates lower surface pressures]
77
0 .5 1.0
x/cs
1
-1
-3
-5
-7
-9
-11
-13
Cp
0 .1 .2 .3 .4 .5 .6 .7 .8 .9 1.0
x/cw
η = 0.285
0 .25 .50 .75 1.00
x/cmf
0 .5 1.0
x/caf
(c) α = 16°.
Figure 17. Continued.
1
-1
-3
-5
-7
-9
-11
-13
Cp
η = 0.646
1
-1
-3
-5
-7
-9
-11
-13
Cp
BL suction
Off
On
η = 0.854
["+" inside symbols indicates lower surface pressures]
78
0 .5 1.0
x/cs
1
-1
-3
-5
-7
-9
-11
-13
Cp
0 .1 .2 .3 .4 .5 .6 .7 .8 .9 1.0
x/cw
η = 0.285
0 .25 .50 .75 1.00
x/cmf
0 .5 1.0
x/caf
(d) α = 22°.
Figure 17. Continued.
1
-1
-3
-5
-7
-9
-11
-13
Cp
η = 0.646
1
-1
-3
-5
-7
-9
-11
-13
Cp
BL suction
Off
On
η = 0.854
["+" inside symbols indicates lower surface pressures]
79
0 .5 1.0
x/cs
1
-1
-3
-5
-7
-9
-11
-13
Cp
0 .1 .2 .3 .4 .5 .6 .7 .8 .9 1.0
x/cw
η = 0.285
0 .25 .50 .75 1.00
x/cmf
0 .5 1.0
x/caf
(e) α = 26°.
Figure 17. Concluded.
1
-1
-3
-5
-7
-9
-11
-13
Cp
η = 0.646
1
-1
-3
-5
-7
-9
-11
-13
Cp
BL suction
Off
On
η = 0.854
["+" inside symbols indicates lower surface pressures]
80
0 .5 1.0
x/cs
1
-1
-3
-5
-7
-9
-11
-13
Cp
0 .1 .2 .3 .4 .5 .6 .7 .8 .9 1.0
x/cw
η = 0.285
0 .25 .50 .75 1.00
x/cmf
0 .5 1.0
x/caf
(a) α = 0°.
Figure 18. Tunnel floor boundary layer thickness reduction effect on high-lift wing pressure distributions. q∞ = 70 psf.
1
-1
-3
-5
-7
-9
-11
-13
Cp
η = 0.646
1
-1
-3
-5
-7
-9
-11
-13
Cp
BL suction
Off
On
η = 0.854
["+" inside symbols indicates lower surface pressures]
81
0 .5 1.0
x/cs
1
-1
-3
-5
-7
-9
-11
-13
Cp
0 .1 .2 .3 .4 .5 .6 .7 .8 .9 1.0
x/cw
η = 0.285
0 .25 .50 .75 1.00
x/cmf
0 .5 1.0
x/caf
(b) α = 8°.
Figure 18. Continued.
1
-1
-3
-5
-7
-9
-11
-13
Cp
η = 0.646
1
-1
-3
-5
-7
-9
-11
-13
Cp
BL suction
Off
On
η = 0.854
["+" inside symbols indicates lower surface pressures]
82
0 .5 1.0
x/cs
1
-1
-3
-5
-7
-9
-11
-13
Cp
0 .1 .2 .3 .4 .5 .6 .7 .8 .9 1.0
x/cw
η = 0.285
0 .25 .50 .75 1.00
x/cmf
0 .5 1.0
x/caf
(c) α = 16°.
Figure 18. Continued.
1
-1
-3
-5
-7
-9
-11
-13
Cp
η = 0.646
1
-1
-3
-5
-7
-9
-11
-13
Cp
BL suction
Off
On
η = 0.854
["+" inside symbols indicates lower surface pressures]
83
0 .5 1.0
x/cs
1
-1
-3
-5
-7
-9
-11
-13
Cp
0 .1 .2 .3 .4 .5 .6 .7 .8 .9 1.0
x/cw
η = 0.285
0 .25 .50 .75 1.00
x/cmf
0 .5 1.0
x/caf
(d) α = 22°.
Figure 18. Continued.
1
-1
-3
-5
-7
-9
-11
-13
Cp
η = 0.646
1
-1
-3
-5
-7
-9
-11
-13
Cp
BL suction
Off
On
η = 0.854
["+" inside symbols indicates lower surface pressures]
84
0 .5 1.0
x/cs
1
-1
-3
-5
-7
-9
-11
-13
Cp
0 .1 .2 .3 .4 .5 .6 .7 .8 .9 1.0
x/cw
η = 0.285
0 .25 .50 .75 1.00
x/cmf
0 .5 1.0
x/caf
(e) α = 26°.
Figure 18. Concluded.
1
-1
-3
-5
-7
-9
-11
-13
Cp
η = 0.646
1
-1
-3
-5
-7
-9
-11
-13
Cp
BL suction
Off
On
η = 0.854
["+" inside symbols indicates lower surface pressures]
85

0 20 40 60 80 100 120 140 160
u∞ , knots
-.5
0
.5
1.0
1.5
2.0
CL
0
.05
.10
.15
.20
.25
.30
CD
-2
0
2
4
6
8
10
L/D
Configuration
TM and ADP
Figure 19. Windmilling ADP effect on transport model aerodynamic cofficients.
Slat-to-nacelle gap = 2.75 in.; βADP = 98.25° α ≈ 0°.
Isolated TM
86
0 .5 1.0
x/cs
1
-1
-3
-5
-7
-9
-11
-13
Cp
0 .1 .2 .3 .4 .5 .6 .7 .8 .9 1.0
x/cw
η = 0.285
0 .25 .50 .75 1.00
x/cmf
0 .5 1.0
x/caf
(a) u∞ ≈ 96 knots.
Figure 20. Windmilling ADP effect on high-lift wing pressure distributions. Slat-to-nacelle gap = 2.75 in.;
βADP = 98.25° α ≈ 0°
1
-1
-3
-5
-7
-9
-11
-13
Cp
η = 0.646
1
-1
-3
-5
-7
-9
-11
-13
Cp
Configuration
Isolated TM
TM and ADP
η = 0.854
["+" inside symbols indicates lower surface pressures]
87
0 .5 1.0
x/cs
1
-1
-3
-5
-7
-9
-11
-13
Cp
0 .1 .2 .3 .4 .5 .6 .7 .8 .9 1.0
x/cw
η = 0.285
0 .25 .50 .75 1.00
x/cmf
0 .5 1.0
x/caf
(b) u∞ ≈ 125 knots.
Figure 20. Continued.
1
-1
-3
-5
-7
-9
-11
-13
Cp
η = 0.646
1
-1
-3
-5
-7
-9
-11
-13
Cp
Configuration
Isolated TM
TM and ADP
η = 0.854
["+" inside symbols indicates lower surface pressures]
88
0 .5 1.0
x/cs
1
-1
-3
-5
-7
-9
-11
-13
Cp
0 .1 .2 .3 .4 .5 .6 .7 .8 .9 1.0
x/cw
η = 0.285
0 .25 .50 .75 1.00
x/cmf
0 .5 1.0
x/caf
(c) u∞ ≈ 148 knots.
Figure 20. Concluded.
1
-1
-3
-5
-7
-9
-11
-13
Cp
η = 0.646
1
-1
-3
-5
-7
-9
-11
-13
Cp
Configuration
Isolated TM
TM and ADP
η = 0.854
["+" inside symbols indicates lower surface pressures]
89
0 20 40 60 80 100 120 140 160
u∞ , knots
-.5
0
.5
1.0
1.5
2.0
CL
0
.05
.10
.15
.20
.25
.30
CD
-2
0
2
4
6
8
10
L/D
Configuration
TM and ADPTM and ADPTM and ADP
ADP, rpm
7528 8897 11248
Figure 21. Powered ADP reverse-thrust effect on transport model aerodynamic coefficents.Slat-to-nacelle gap = 0.38 in.; βADP = 98.25° α ≈ 0°.
Isolated TM
90
0 20 40 60 80 100 120 140 160
u∞ , knots
-.5
0
.5
1.0
1.5
2.0
CL
0
.05
.10
.15
.20
.25
.30
CD
-2
0
2
4
6
8
10
L/D
Configuration
TM and ADPTM and ADP
Slat-to-Nacelle Gap, in.
2.750.38
ADP, rpm
7343 7528
Figure 22. Aerodynamic coefficient comparison for two ADP waterline locations. βADP = 98.25° α ≈ 0°.
Isolated TM
91
0 .5 1.0
x/cs
1
0
-1
-2
-3
-4
-5
Cp
0 .1 .2 .3 .4 .5 .6 .7 .8 .9 1.0
x/cw
η = 0.285
0 .25 .50 .75 1.00
x/cmf
0 .5 1.0
x/caf
(a) u∞ ≈ 91 knots.
Figure 23. Powered ADP reverse-thrust effect on high-lift wing pressure distributions.
Slat-to-nacelle gap = 2.75 in.; βADP = 98.25° α ≈ 0°.
1
0
-1
-2
-3
-4
-5
Cp
η = 0.646
1
0
-1
-2
-3
-4
-5
Cp
Configuration
Isolated TM
TM and ADP
u∞ , knots
97
91
ADP rpm
-
7343 η = 0.854
["+" inside symbols indicates lower surface pressures]
92
0 .5 1.0
x/cs
1
0
-1
-2
-3
-4
-5
Cp
0 .1 .2 .3 .4 .5 .6 .7 .8 .9 1.0
x/cw
η = 0.285
0 .25 .50 .75 1.00
x/cmf
0 .5 1.0
x/caf
(b) u∞ ≈ 121 knots.
Figure 23. Concluded.
1
0
-1
-2
-3
-4
-5
Cp
η = 0.646
1
0
-1
-2
-3
-4
-5
Cp
Configuration
Isolated TM
TM and ADP
u∞ , knots
126
121
ADP rpm
-
7351 η = 0.854
["+" inside symbols indicates lower surface pressures]
93
0 .5 1.0
x/cs
1
0
-1
-2
-3
-4
-5
Cp
0 .1 .2 .3 .4 .5 .6 .7 .8 .9 1.0
x/cw
η = 0.285
0 .25 .50 .75 1.00
x/cmf
0 .5 1.0
x/caf
Figure 24. Powered ADP reverse-thrust effect on high-lift wing pressure distributions. ADP speed ≈ 7300 rpm;
slat-to-nacelle gap = 2.75 in.; βADP = 98.25° α ≈ 0°.
1
0
-1
-2
-3
-4
-5
Cp
η = 0.646
1
0
-1
-2
-3
-4
-5
Cp
Configuration
Isolated TM
TM and ADP
TM and ADP
TM and ADP
TM and ADP
TM and ADP
u∞ , knots
97
61
91
100
115
121
η = 0.854
["+" inside symbols indicates lower surface pressures]
94
0 20 40 60 80 100 120 140 160
u∞ , knots
-.5
0
.5
1.0
1.5
2.0
CL
0
.05
.10
.15
.20
.25
.30
CD
-2
0
2
4
6
8
10
L/D
Configuration
TM and ADPTM and ADPTM and ADP
α, deg
-1.80.52.4
Figure 25. Angle of attack effect on transport model aerodynamic coefficients. Powered ADP;ADP speed ≈ 8900 rpm; slat-to-nacelle gap = 0.38 in.; βADP = 98.25°.
95
0 20 40 60 80 100 120 140 160
u∞ , knots
-.5
0
.5
1.0
1.5
2.0
CL
0
.05
.10
.15
.20
.25
.30
CD
-2
0
2
4
6
8
10
L/D
Configuration
TM and ADPTM, ADP, and GP
Slat-to-Nacelle Gap, in.
2.750.38
Figure 26. Ground plane effect on transport model aerodynamic coefficients. Windmilling ADP;βADP = 98.25° α ≈ 0°
Isolated TM
96
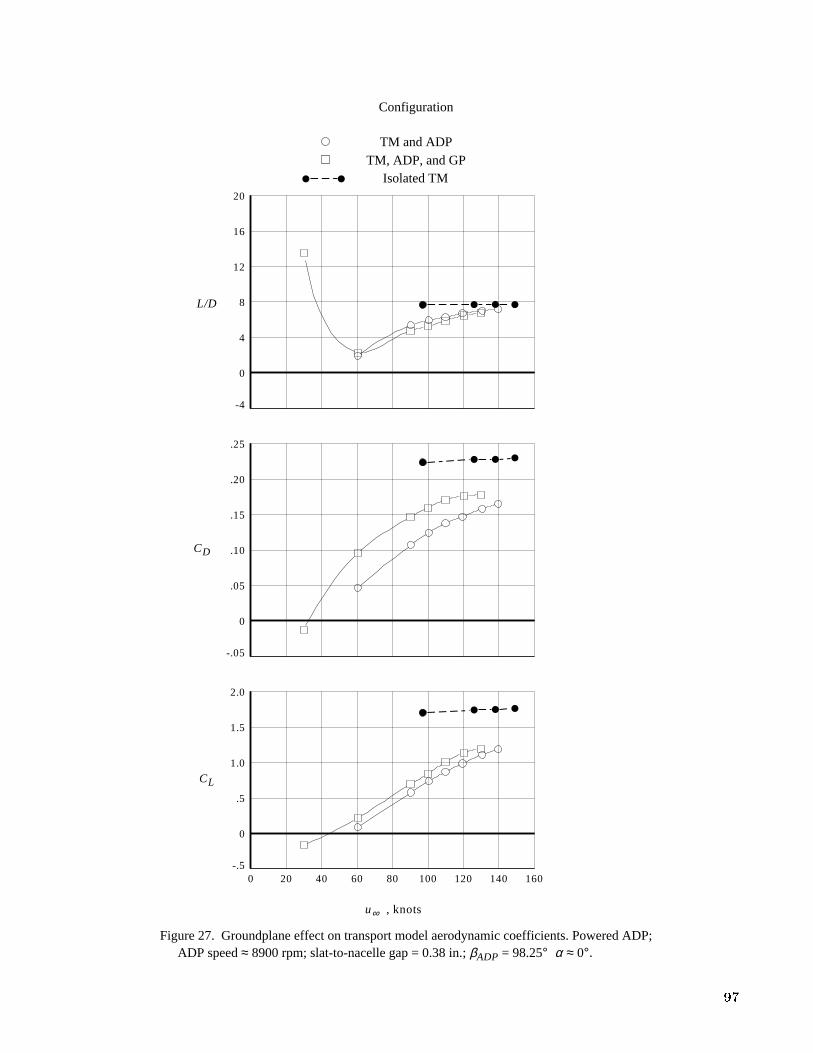
0 20 40 60 80 100 120 140 160
u∞ , knots
-.5
0
.5
1.0
1.5
2.0
CL
-.05
0
.05
.10
.15
.20
.25
CD
-4
0
4
8
12
16
20
L/D
Configuration
TM and ADPTM, ADP, and GP
Figure 27. Groundplane effect on transport model aerodynamic coefficients. Powered ADP;ADP speed ≈ 8900 rpm; slat-to-nacelle gap = 0.38 in.; βADP = 98.25° α ≈ 0°.
Isolated TM
97
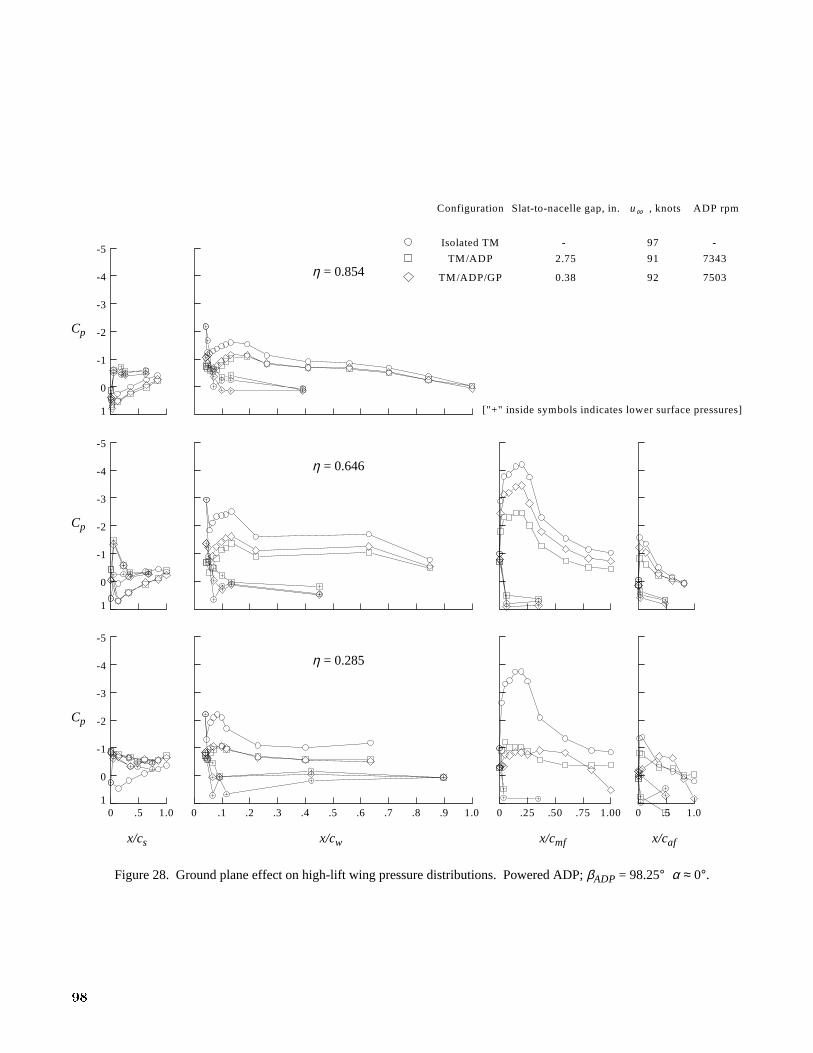
0 .5 1.0
x/cs
1
0
-1
-2
-3
-4
-5
Cp
0 .1 .2 .3 .4 .5 .6 .7 .8 .9 1.0
x/cw
η = 0.285
0 .25 .50 .75 1.00
x/cmf
0 .5 1.0
x/caf
Figure 28. Ground plane effect on high-lift wing pressure distributions. Powered ADP; βADP = 98.25° α ≈ 0°.
1
0
-1
-2
-3
-4
-5
Cp
η = 0.646
1
0
-1
-2
-3
-4
-5
Cp
Configuration
Isolated TM
TM/ADP
TM/ADP/GP
Slat-to-nacelle gap, in.
-
2.75
0.38
u∞ , knots
97
91
92
ADP rpm
-
7343
7503 η = 0.854
["+" inside symbols indicates lower surface pressures]
98

0 20 40 60 80 100 120 140 160
u∞ , knots
-.5
0
.5
1.0
1.5
2.0
CL
-.05
0
.05
.10
.15
.20
.25
CD
-4
0
4
8
12
16
20
L/D
Configuration
TM, ADP, and GP
TM, ADP, and GP
TM, ADP, and GP
TM, ADP, and GP
TM, ADP, and GP
ADP, rpm
3751
5403
7496
8904
10903
(a) βADP = 98.25°.
Figure 29. ADP rotational speed effect on transport model aerodynamic coefficients with groundplane installed.
Slat-to-nacelle gap = 0.38 in.; α ≈ 0°.
Isolated TM
99
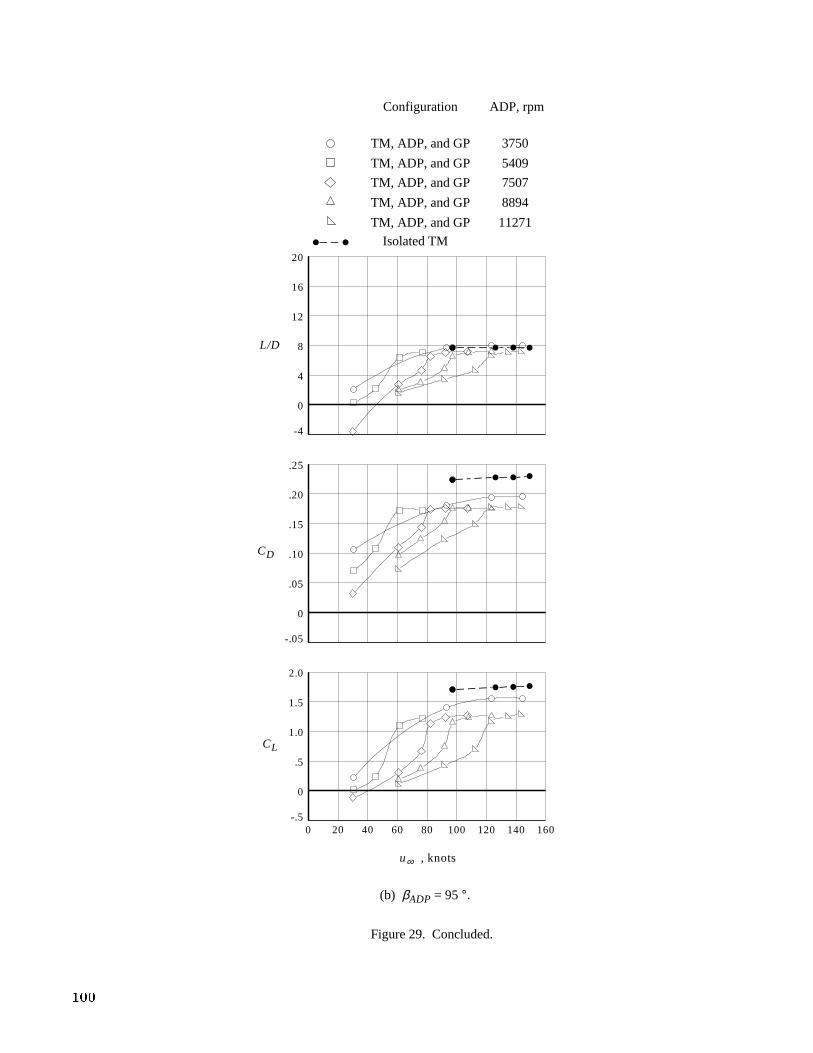
0 20 40 60 80 100 120 140 160
u∞ , knots
-.5
0
.5
1.0
1.5
2.0
CL
-.05
0
.05
.10
.15
.20
.25
CD
-4
0
4
8
12
16
20
L/D
Configuration
TM, ADP, and GP
TM, ADP, and GP
TM, ADP, and GP
TM, ADP, and GP
TM, ADP, and GP
ADP, rpm
3750
5409
7507
8894
11271
(b) βADP = 95 °.
Figure 29. Concluded.
Isolated TM
100
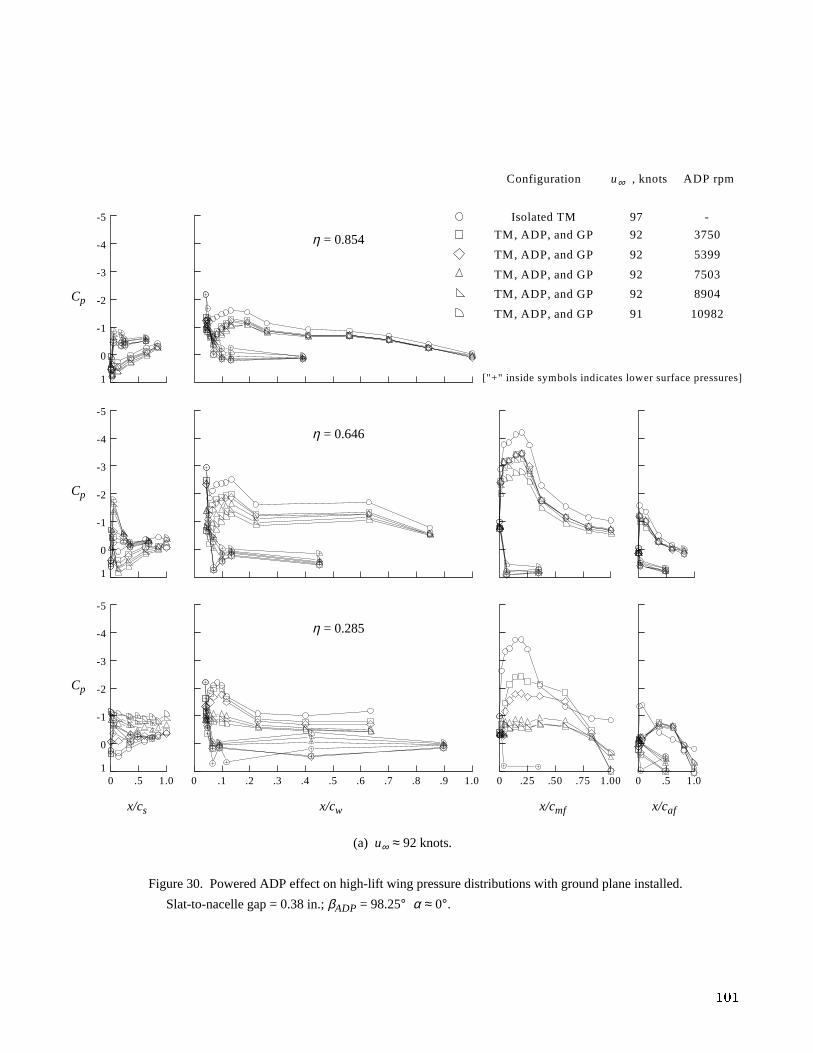
0 .5 1.0
x/cs
1
0
-1
-2
-3
-4
-5
Cp
0 .1 .2 .3 .4 .5 .6 .7 .8 .9 1.0
x/cw
η = 0.285
0 .25 .50 .75 1.00
x/cmf
0 .5 1.0
x/caf
(a) u∞ ≈ 92 knots.
Figure 30. Powered ADP effect on high-lift wing pressure distributions with ground plane installed.
Slat-to-nacelle gap = 0.38 in.; βADP = 98.25° α ≈ 0°.
1
0
-1
-2
-3
-4
-5
Cp
η = 0.646
1
0
-1
-2
-3
-4
-5
Cp
Configuration
Isolated TM
TM, ADP, and GP
TM, ADP, and GP
TM, ADP, and GP
TM, ADP, and GP
TM, ADP, and GP
u∞ , knots
97
92
92
92
92
91
ADP rpm
-
3750
5399
7503
8904
10982
η = 0.854
["+" inside symbols indicates lower surface pressures]
101
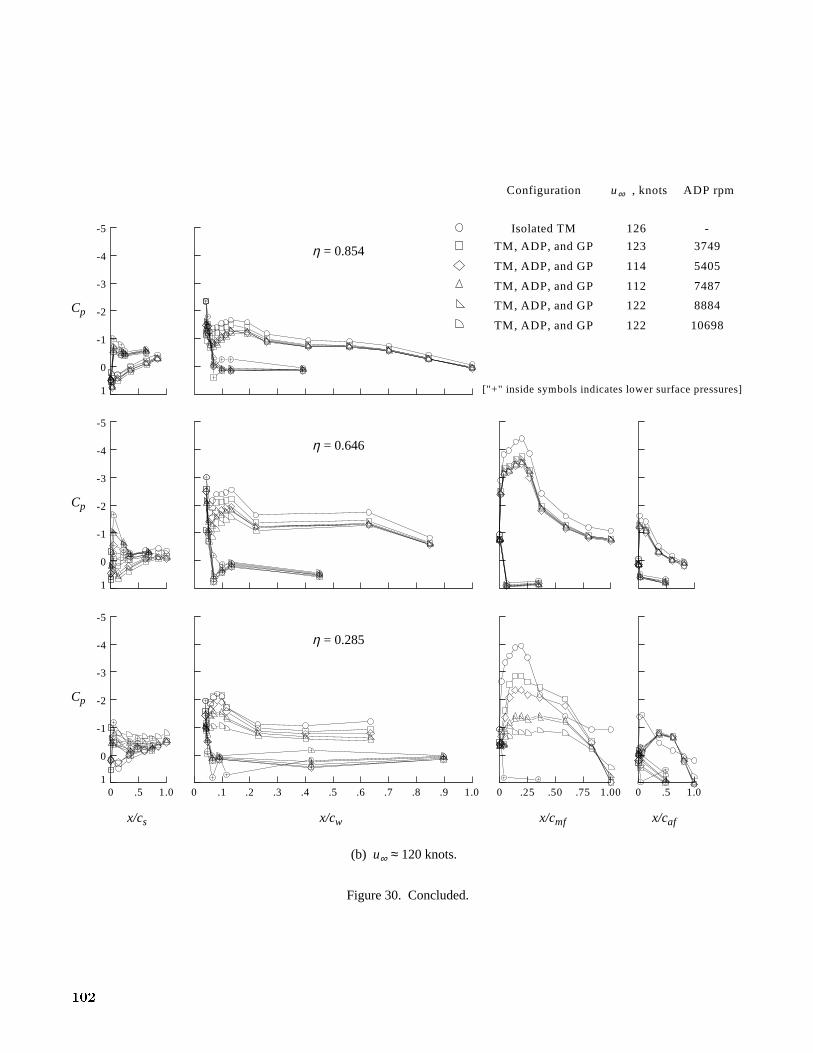
0 .5 1.0
x/cs
1
0
-1
-2
-3
-4
-5
Cp
0 .1 .2 .3 .4 .5 .6 .7 .8 .9 1.0
x/cw
η = 0.285
0 .25 .50 .75 1.00
x/cmf
0 .5 1.0
x/caf
(b) u∞ ≈ 120 knots.
Figure 30. Concluded.
1
0
-1
-2
-3
-4
-5
Cp
η = 0.646
1
0
-1
-2
-3
-4
-5
Cp
Configuration
Isolated TM
TM, ADP, and GP
TM, ADP, and GP
TM, ADP, and GP
TM, ADP, and GP
TM, ADP, and GP
u∞ , knots
126
123
114
112
122
122
ADP rpm
-
3749
5405
7487
8884
10698
η = 0.854
["+" inside symbols indicates lower surface pressures]
102
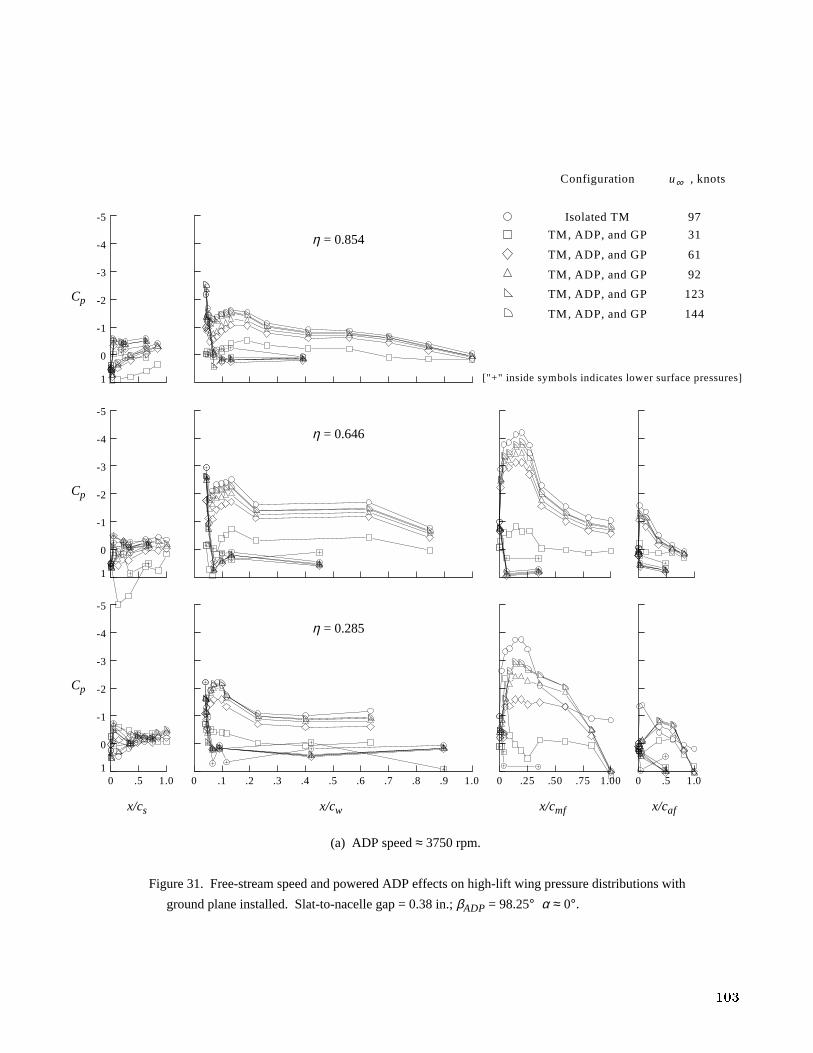
0 .5 1.0
x/cs
1
0
-1
-2
-3
-4
-5
Cp
0 .1 .2 .3 .4 .5 .6 .7 .8 .9 1.0
x/cw
η = 0.285
0 .25 .50 .75 1.00
x/cmf
0 .5 1.0
x/caf
(a) ADP speed ≈ 3750 rpm.
Figure 31. Free-stream speed and powered ADP effects on high-lift wing pressure distributions with
ground plane installed. Slat-to-nacelle gap = 0.38 in.; βADP = 98.25° α ≈ 0°.
1
0
-1
-2
-3
-4
-5
Cp
η = 0.646
1
0
-1
-2
-3
-4
-5
Cp
Configuration
Isolated TM
TM, ADP, and GP
TM, ADP, and GP
TM, ADP, and GP
TM, ADP, and GP
TM, ADP, and GP
u∞ , knots
97
31
61
92
123
144
η = 0.854
["+" inside symbols indicates lower surface pressures]
103
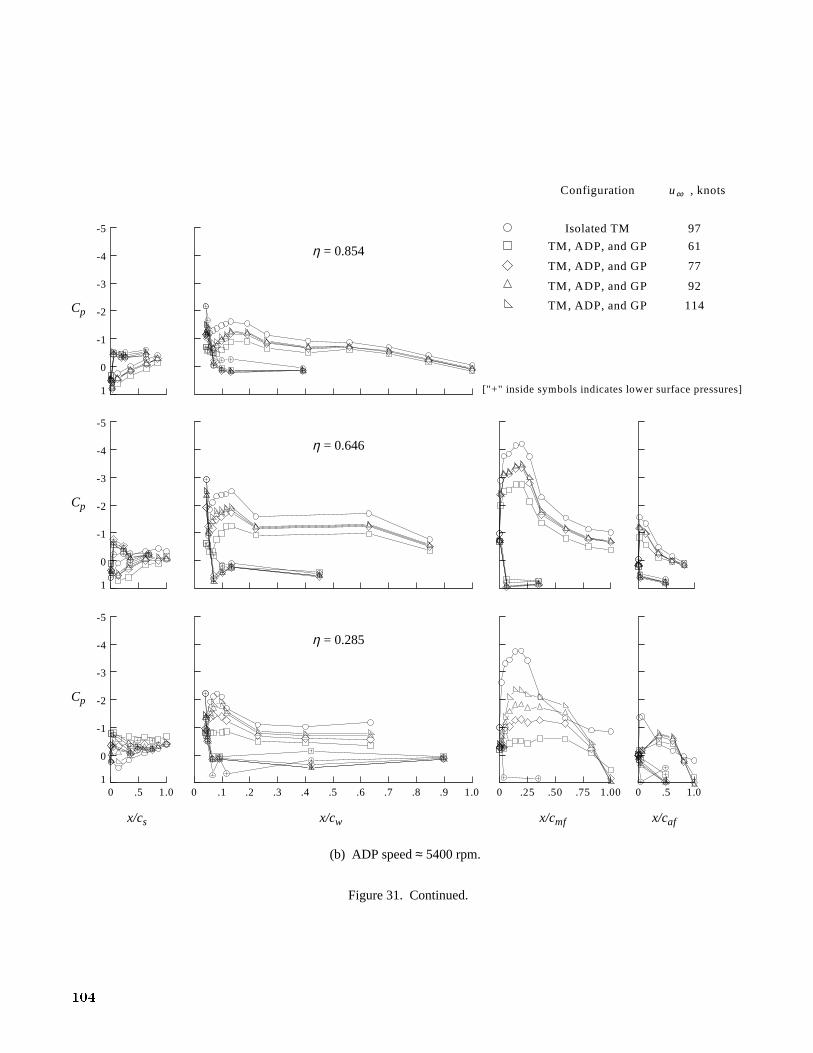
0 .5 1.0
x/cs
1
0
-1
-2
-3
-4
-5
Cp
0 .1 .2 .3 .4 .5 .6 .7 .8 .9 1.0
x/cw
η = 0.285
0 .25 .50 .75 1.00
x/cmf
0 .5 1.0
x/caf
(b) ADP speed ≈ 5400 rpm.
Figure 31. Continued.
1
0
-1
-2
-3
-4
-5
Cp
η = 0.646
1
0
-1
-2
-3
-4
-5
Cp
Configuration
Isolated TM
TM, ADP, and GP
TM, ADP, and GP
TM, ADP, and GP
TM, ADP, and GP
u∞ , knots
97
61
77
92
114
η = 0.854
["+" inside symbols indicates lower surface pressures]
104

0 .5 1.0
x/cs
1
0
-1
-2
-3
-4
-5
Cp
0 .1 .2 .3 .4 .5 .6 .7 .8 .9 1.0
x/cw
η = 0.285
0 .25 .50 .75 1.00
x/cmf
0 .5 1.0
x/caf
(c) ADP speed ≈ 7500 rpm.
Figure 31. Continued.
1
0
-1
-2
-3
-4
-5
Cp
η = 0.646
1
0
-1
-2
-3
-4
-5
Cp
Configuration
Isolated TM
TM, ADP, and GP
TM, ADP, and GP
TM, ADP, and GP
TM, ADP, and GP
TM, ADP, and GP
u∞ , knots
97
29
61
92
102
108
η = 0.854
["+" inside symbols indicates lower surface pressures]
105
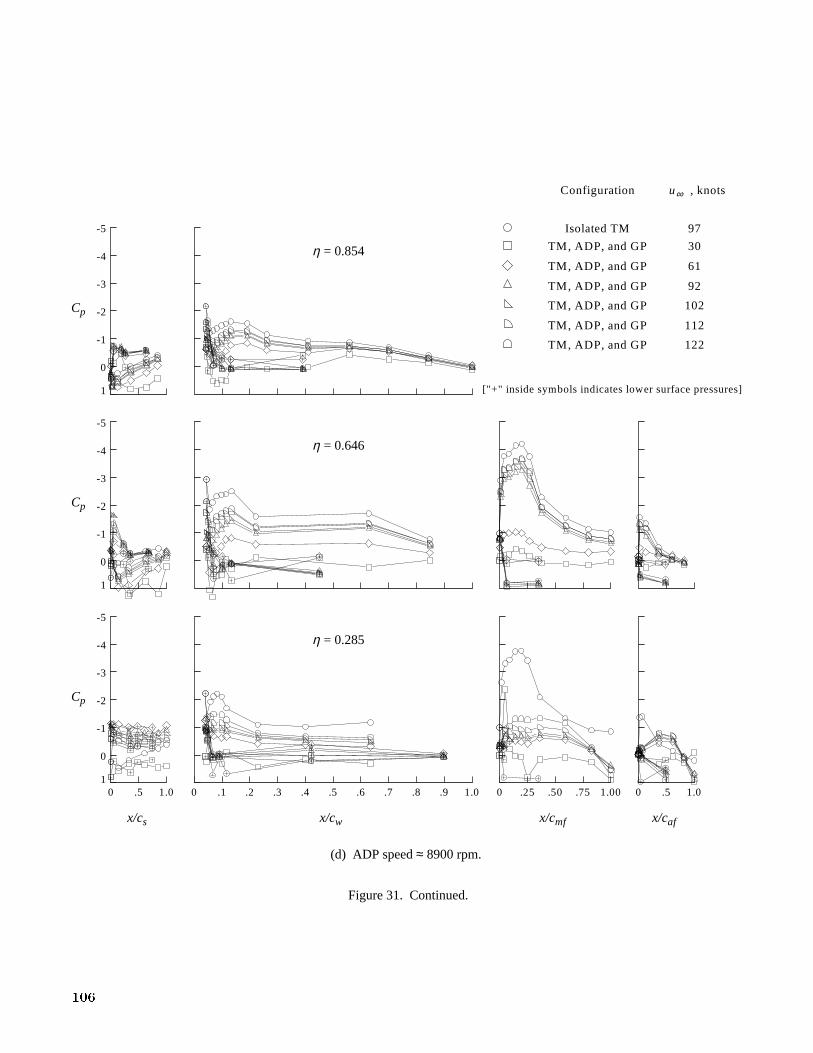
0 .5 1.0
x/cs
1
0
-1
-2
-3
-4
-5
Cp
0 .1 .2 .3 .4 .5 .6 .7 .8 .9 1.0
x/cw
η = 0.285
0 .25 .50 .75 1.00
x/cmf
0 .5 1.0
x/caf
(d) ADP speed ≈ 8900 rpm.
Figure 31. Continued.
1
0
-1
-2
-3
-4
-5
Cp
η = 0.646
1
0
-1
-2
-3
-4
-5
Cp
Configuration
Isolated TM
TM, ADP, and GP
TM, ADP, and GP
TM, ADP, and GP
TM, ADP, and GP
TM, ADP, and GP
TM, ADP, and GP
u∞ , knots
97
30
61
92
102
112
122
η = 0.854
["+" inside symbols indicates lower surface pressures]
106
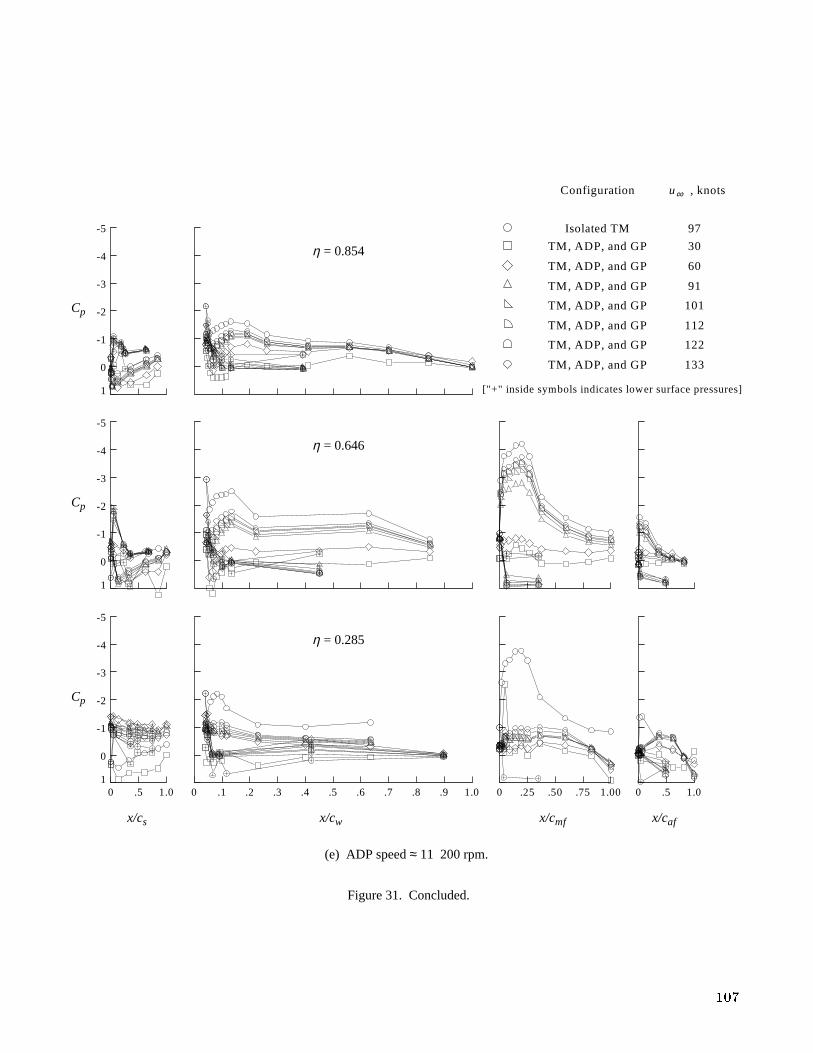
0 .5 1.0
x/cs
1
0
-1
-2
-3
-4
-5
Cp
0 .1 .2 .3 .4 .5 .6 .7 .8 .9 1.0
x/cw
η = 0.285
0 .25 .50 .75 1.00
x/cmf
0 .5 1.0
x/caf
(e) ADP speed ≈ 11 200 rpm.
Figure 31. Concluded.
1
0
-1
-2
-3
-4
-5
Cp
η = 0.646
1
0
-1
-2
-3
-4
-5
Cp
Configuration
Isolated TM
TM, ADP, and GP
TM, ADP, and GP
TM, ADP, and GP
TM, ADP, and GP
TM, ADP, and GP
TM, ADP, and GP
TM, ADP, and GP
u∞ , knots
97
30
60
91
101
112
122
133
η = 0.854
["+" inside symbols indicates lower surface pressures]
107
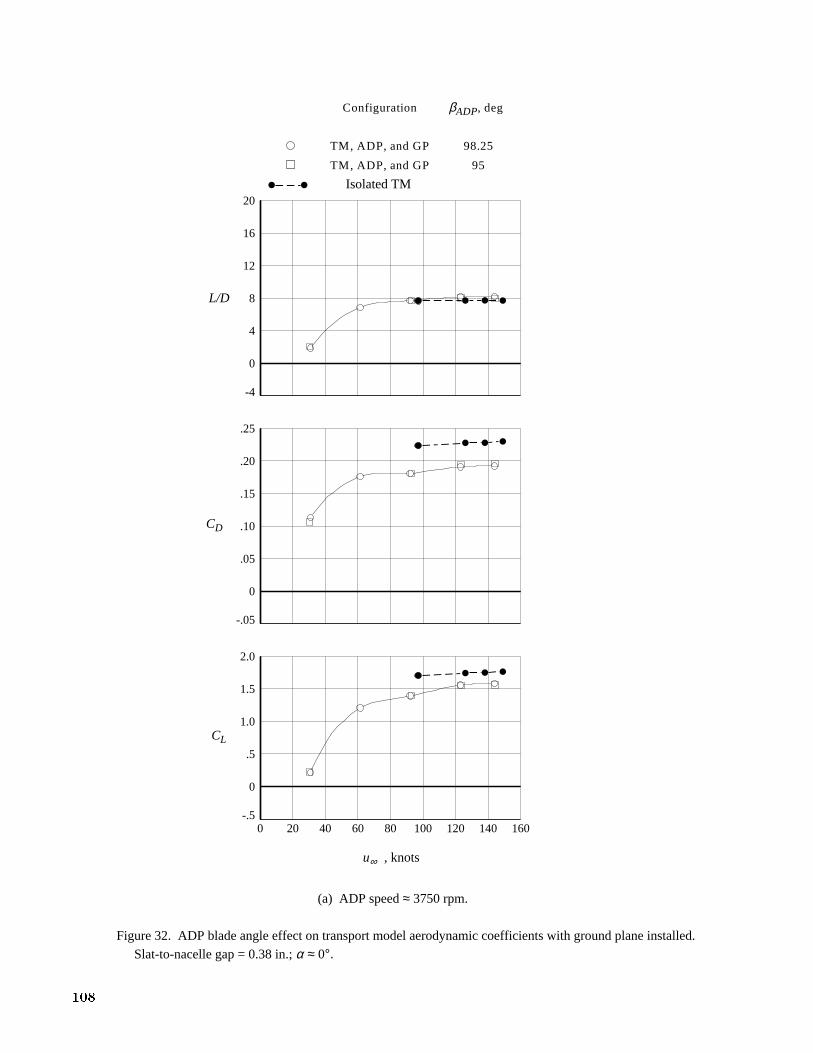
0 20 40 60 80 100 120 140 160
u∞ , knots
-.5
0
.5
1.0
1.5
2.0
CL
-.05
0
.05
.10
.15
.20
.25
CD
-4
0
4
8
12
16
20
L/D
Configuration
TM, ADP, and GP
TM, ADP, and GP
βADP, deg
98.25
95
(a) ADP speed ≈ 3750 rpm.
Figure 32. ADP blade angle effect on transport model aerodynamic coefficients with ground plane installed.
Slat-to-nacelle gap = 0.38 in.; α ≈ 0°.
Isolated TM
108
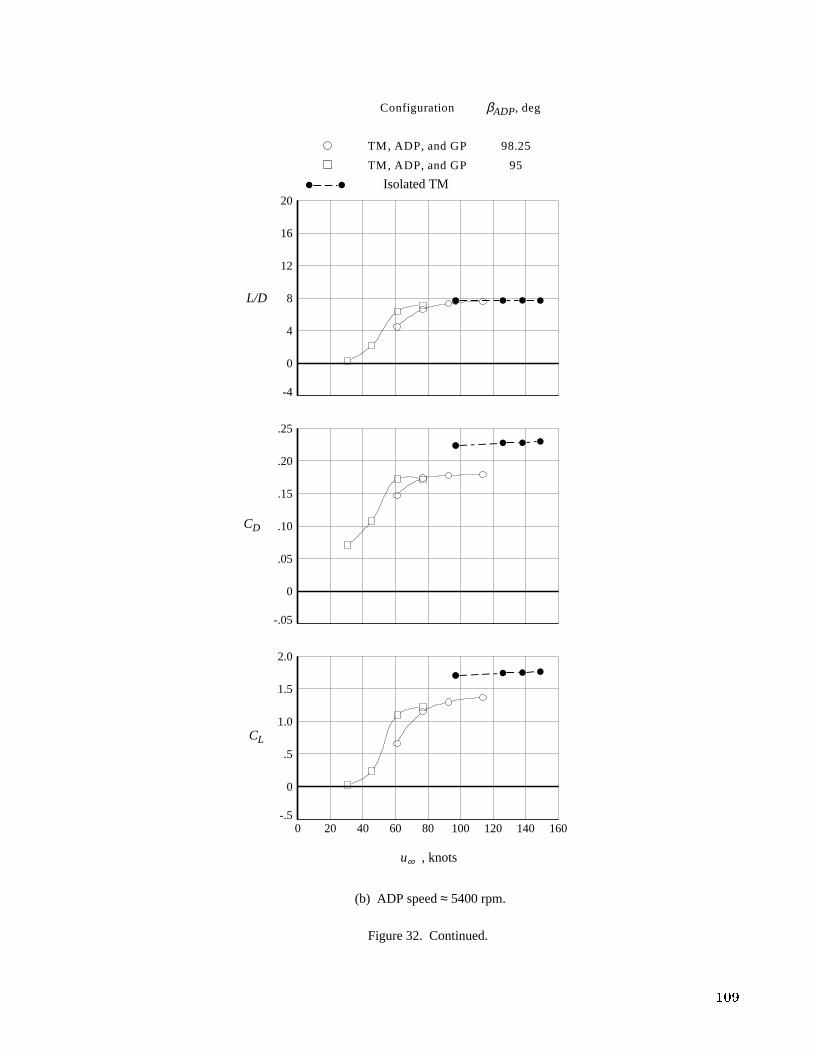
0 20 40 60 80 100 120 140 160
u∞ , knots
-.5
0
.5
1.0
1.5
2.0
CL
-.05
0
.05
.10
.15
.20
.25
CD
-4
0
4
8
12
16
20
L/D
Configuration
TM, ADP, and GP
TM, ADP, and GP
βADP, deg
98.25
95
(b) ADP speed ≈ 5400 rpm.
Figure 32. Continued.
Isolated TM
109
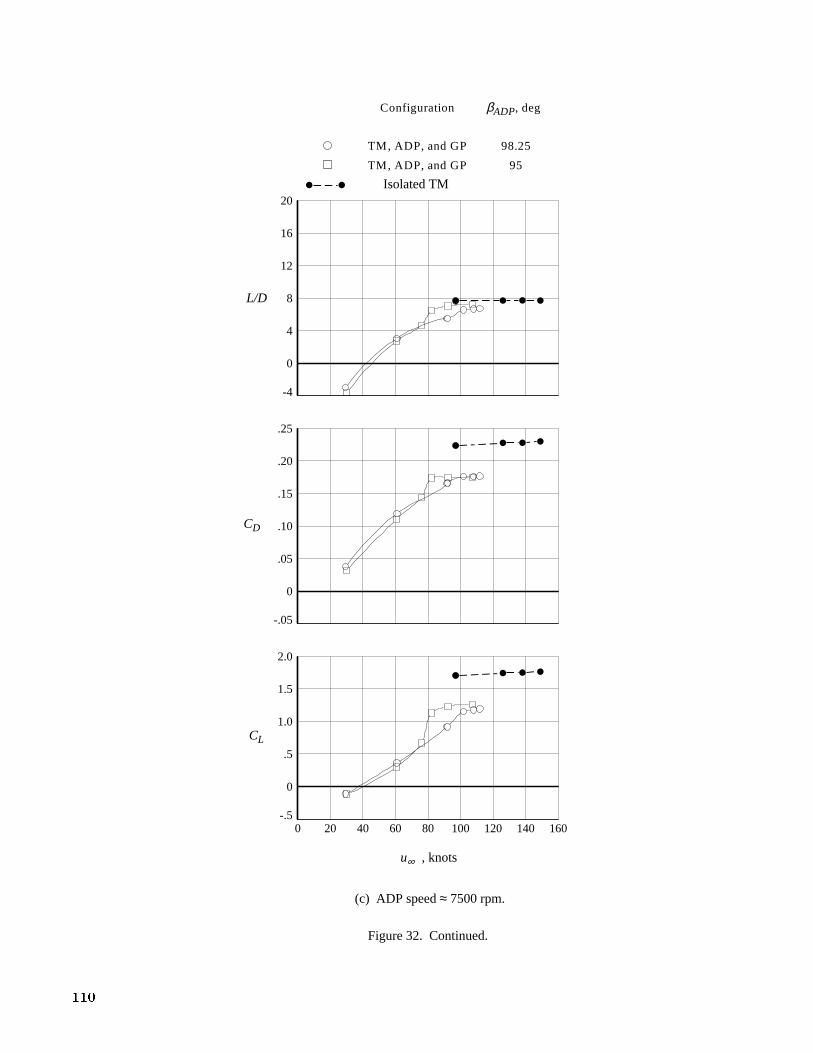
0 20 40 60 80 100 120 140 160
u∞ , knots
-.5
0
.5
1.0
1.5
2.0
CL
-.05
0
.05
.10
.15
.20
.25
CD
-4
0
4
8
12
16
20
L/D
Configuration
TM, ADP, and GP
TM, ADP, and GP
βADP, deg
98.25
95
(c) ADP speed ≈ 7500 rpm.
Figure 32. Continued.
Isolated TM
110
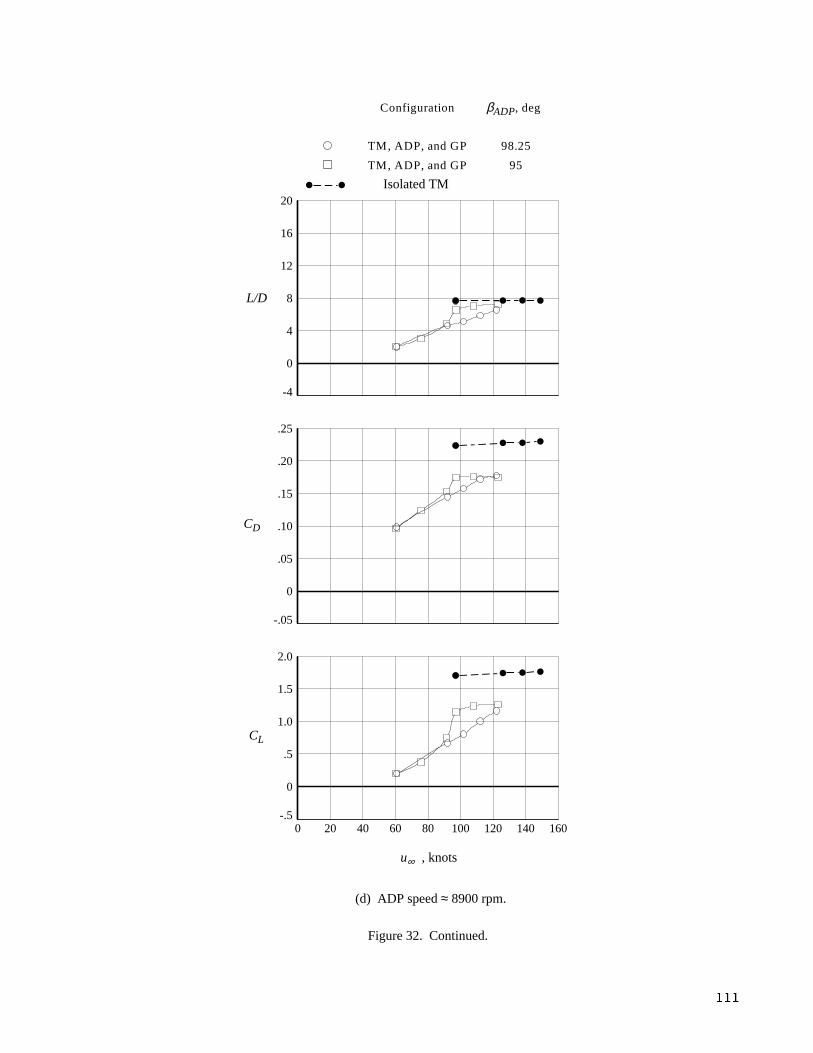
0 20 40 60 80 100 120 140 160
u∞ , knots
-.5
0
.5
1.0
1.5
2.0
CL
-.05
0
.05
.10
.15
.20
.25
CD
-4
0
4
8
12
16
20
L/D
Configuration
TM, ADP, and GP
TM, ADP, and GP
βADP, deg
98.25
95
(d) ADP speed ≈ 8900 rpm.
Figure 32. Continued.
Isolated TM
111
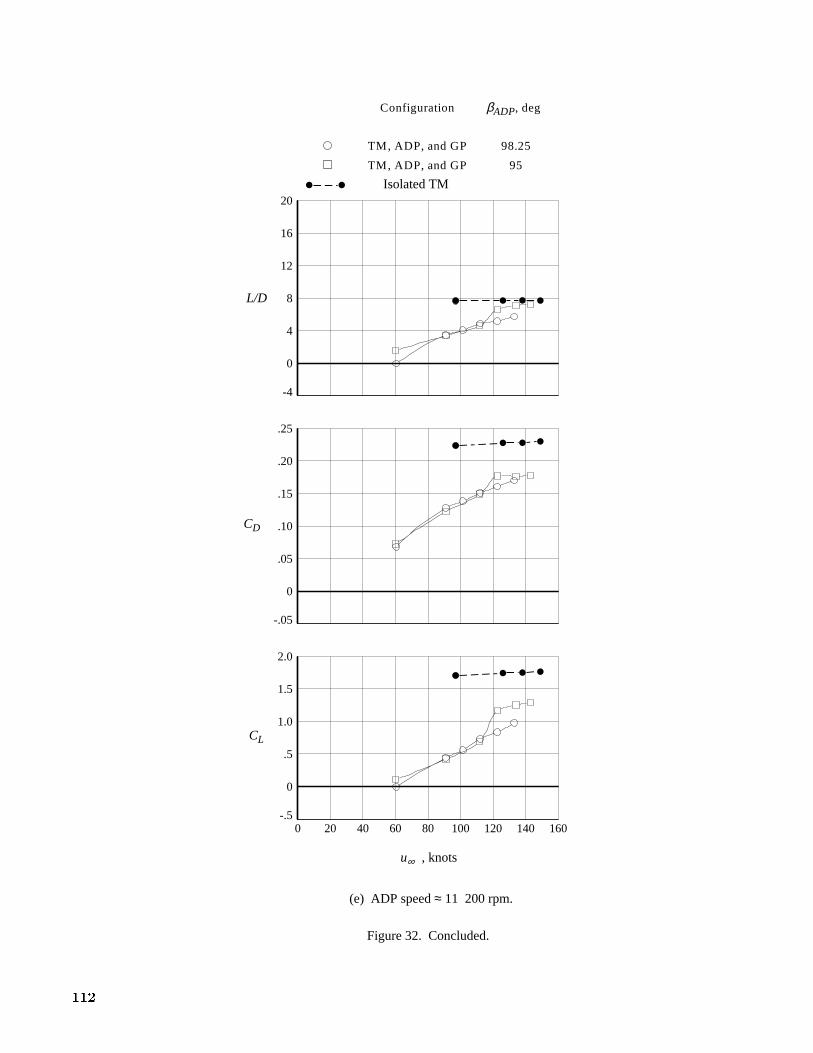
0 20 40 60 80 100 120 140 160
u∞ , knots
-.5
0
.5
1.0
1.5
2.0
CL
-.05
0
.05
.10
.15
.20
.25
CD
-4
0
4
8
12
16
20
L/D
Configuration
TM, ADP, and GP
TM, ADP, and GP
βADP, deg
98.25
95
(e) ADP speed ≈ 11 200 rpm.
Figure 32. Concluded.
Isolated TM
112
(b) Cruise wing planform.
(c) High-lift wing planform.
Figure 1. Concluded.
1
REPORT DOCUMENTATION PAGEForm Approved
OMB No. 0704-0188
Public reporting burden for this collection of information is estimated to average 1 hour per response, including the time for reviewing instructions, searching existing data sources,gathering and maintaining the data needed, and completing and reviewing the collection of information. Send comments regarding this burden estimate or any other aspect of thiscollection of information, including suggestions for reducing this burden, toWashington Headquarters Services, Directorate for Information Operations and Reports, 1215 Je�ersonDavis Highway, Suite 1204, Arlington, VA 22202-4302, and to the O�ce of Management and Budget, Paperwork Reduction Project (0704-0188), Washington, DC 20503.
1. AGENCY USE ONLY(Leave blank) 2. REPORT DATE 3. REPORT TYPE AND DATES COVERED
July 1994 Technical Paper
4. TITLE AND SUBTITLE
Subsonic Aerodynamic Characteristics of Semispan CommercialTransport Model With Wing-Mounted Advanced DuctedPropeller Operating in Reverse Thrust
6. AUTHOR(S)
Zachary T. Applin, Kenneth M. Jones, Brenda E. Gile, andP. Frank Quinto
7. PERFORMING ORGANIZATION NAME(S) AND ADDRESS(ES)
NASA Langley Research CenterHampton, VA 23681-0001
9. SPONSORING/MONITORING AGENCY NAME(S) AND ADDRESS(ES)
National Aeronautics and Space AdministrationWashington, DC 20546-0001
5. FUNDING NUMBERS
WU 535-03-10-02
8. PERFORMING ORGANIZATION
REPORT NUMBER
L-17282
10. SPONSORING/MONITORING
AGENCY REPORT NUMBER
NASA TP-3427
11. SUPPLEMENTARY NOTES
12a. DISTRIBUTION/AVAILABILITY STATEMENT 12b. DISTRIBUTION CODE
Unclassi�ed{Unlimited
Subject Category 02
13. ABSTRACT (Maximum 200 words)
A test was conducted in the Langley 14- by 22-Foot Subsonic Tunnel to determine the e�ect of the reverse-thrust ow �eld of a wing-mounted advanced ducted propeller on the aerodynamic characteristics of a semispansubsonic high-lift transport model. The advanced ducted propeller (ADP) model was mounted separately inposition alongside the wing so that only the aerodynamic interference of the propeller and nacelle a�ected theaerodynamic performance of the transport model. Mach numbers ranged from 0.14 to 0.26; correspondingReynolds numbers ranged from 2.2 to 3.9 � 106. The reverse-thrust ow �eld of the ADP shielded a portionof the wing from the free-stream air ow and reduced both lift and drag. The reduction in lift and drag wasa function of ADP rotational speed and free-stream velocity. Test results included ground e�ects data forthe transport model and ADP con�guration. The ground plane caused a bene�cial increase in drag and anundesirable slight increase in lift. The ADP and transport model performance in ground e�ect was similarto performance trends observed for out of ground e�ect. The test results form a comprehensive data set thatsupports the application of the ADP engine and airplane concept on the next generation of advanced subsonictransports. Before this investigation, the engine application was predicted to have detrimental ground e�ectcharacteristics. Ground e�ect test measurements indicated no critical problems and were the �rst step inproving the viability of this engine and airplane con�guration.
14. SUBJECT TERMS 15. NUMBER OF PAGES
Subsonic transport; High lift; Propulsion integration; Advanced ducted propeller;ADP; Semispan
113
16. PRICE CODE
A0617. SECURITY CLASSIFICATION 18. SECURITY CLASSIFICATION 19. SECURITY CLASSIFICATION 20. LIMITATION
OF REPORT OF THIS PAGE OF ABSTRACT OF ABSTRACT
Unclassi�ed Unclassi�ed Unclassi�ed
NSN 7540-01-280-5500 Standard Form 298(Rev. 2-89)Prescribed by ANSI Std. Z39-18298-102