study on small class teaching in primary schools …€¦ · study on small class teaching in...
TRANSCRIPT

EDUCATION BUREAU
Study on Small Class Teaching in Primary
Schools in Hong Kong
Final Report
December 2009
Maurice Galton and Tony Pell

List of Contents SECTION PAGE Executive Summary i-xi Introduction 1 Background to the Study 2 Research measures used in the Study 7 The Consultant’s visits to the schools 9 Teacher professional development 11 The replication of teachers’ views on small classes 12 Further consideration of the observation data 18 Impact of small classes on the Territory-wide System Assessment (TSA) 26 Factors contributing to school success 30 Relative performance of schools with high proportions of disadvantaged pupils 35 Performance in small classes compared to Reference Schools 41 Reviewing the results of the SCT Study (2004-08) 52 Some general conclusions 60 Recommendations 64 References 70 Appendixes 74

i
Executive Summary
I. The final year of the small class teaching study (SCT) has seen the completion of the fieldwork. During the year the P3 small classes from Cohort 1 (the 2004/05 P1 small class sample) returned to normal size classes in P4 and Cohort 2, having been in small P1 classes during 2005/06 and P2 small classes in 2006/07 returned to P3 normal size classes. A third cohort, who had started in P1 normal size classes in 2006/07 moved on to ‘normal’ classes in P2. It has thus been possible to compare small classes with normal size ones in the same schools over the first three years of the pupils’ primary schooling and to replicate these comparisons in P1 and P2.
II. The study sought to address two broad research questions:
What are the benefits of SCT in the local context?
What teaching strategies, professional support and resources are necessary in order to maximise the benefits of SCT in Hong Kong primary schools?
III. A matched sample of 15 schools (known as the reference schools) was added to the study in 2006/07. P1, P2 and P3 classes in these schools during 2006/07 moved up in 2007/08 to P2, P3 and P4 respectively, thus affording a further set of comparisons. Attainment tests of Chinese, English and mathematics and student questionnaires were administered. The Teacher Questionnaire, which solicited practitioners’ views on the merits of SCT during the second year of the study (2005/06), was repeated. In addition, an analysis of the Territory-wide System Assessment (TSA) scores was undertaken using the 2004 results to draw a matched sample of 37 schools to compare with the ‘experimental’ schools taking part in the SCT study. Comparisons were then made using the 2005, 2006 and 2007 results.
IV. In most years some 700 classes have been tested. This has resulted in approximately 20,000 pupils taking the end of P1 tests in each of the subjects, all of whom were followed for a second year. Nearly 23,500 took the end of the P2 tests in each subject, the majority having entered the study at the beginning of P1. The figure for the number of pupils taking the end of P3 test was 20,500 while just over 11,000 of these pupils continued to the end of P4. Of the total sample who started in P1 classes approximately 53.9% started in small classes, 27.2% came from the control classes in the same schools with the remaining 18.9% being drawn from the reference schools.
V. The consultant completed his visits to the participating schools and made a third visits to the 8 case study schools (the repeat sample). There continued to be considerable variation in the quality of instruction between schools and between teachers. About 25% of observed lessons showed real improvement. The main weakness in the others concerned the inappropriate use of group work. In too many group activities only one pupil at a time was actively engaged while other members watched. This sometimes led to poor behaviour because pupils became distracted.
ii
VI. The Teachers Questionnaire was again administered during 2007/08. If anything, opinions on the perceived benefits of SCT were stronger than on the earlier occasion when the survey was distributed. It was thought impossible to give individuals extra help, cater for slow and gifted learners, match tasks to individual needs, mark pupils’ work during lessons and make use of across-the-age-group peer tutoring in normal classes. Holding extended class discussions, differentiating work by task and doing group work was thought to be difficult but possible when the number of pupils in the class was greater than 25, while setting practical tasks, giving oral feedback, doing pair work, involving pupils in assessing their work and using same-age-group peer tutoring was deemed equally feasible in both small and normal classes. These responses suggest many teachers now accept the project’s stance that most of the common teaching approaches can be used in both small and normal classes, although with more difficulty in the latter situation. As such it marks a change in opinion from the beginning of the study when teachers demanded that they should be informed about ‘SCT methods.’
VII. Teachers were also asked to what help they received in implementing SCT and which of these supports they most valued. Generally, as in the earlier survey, teachers most valued practical help with technology and from outside experts such as educational psychologists and social workers. Next important was the support of the Principal and the curriculum leader. Sharing good practice with colleagues was less valued because any useful knowledge gained could not be put to immediate good use on account of existing workloads.
VIII. Teachers ranked catering for diversity as of greatest concern. Providing extra tuition outside normal lessons and the use of same-age-group peer tutoring continues to be strongly favoured strategies for coping with this problem, but more use is now being made of setting differentiated tasks. As a result grouping practices have become more flexible with pupils placed in either mixed or ability groups according to the task demand.
IX. A cluster analysis of the teacher observation data yielded four distinct teaching approaches. The first of these, named sustained individual and pair enquiry consisted of teachers who asked the highest number of open, challenging questions made more statements of ideas and offered greater amounts of informing feedback. Their interactions with pupils took place either individually or in pairs and were more often sustained into the next 30 second time unit. The second approach, labeled group task monitoring, consisted of teachers who spent much time listening or watching pupils. These teachers issued the highest number of task directions which often involved setting up and organizing work in groups. The third approach, that of whole class instruction, represented a more traditional form of teaching, and consisted of teachers who spent nearly two thirds of the time talking to the whole class without any particular child in focus. A large proportion of this time was spent making statements of fact, giving directions and listening to pupils read in unison. The final approach also employed a high proportion of whole class teaching but the focus was on questioning of all kinds rather than statements. Teachers in this cluster were labeled whole class questioners.

iii
X. Across the three subjects the use of the different approaches tended to be more evenly distributed in small classes suggesting that many teachers were still experimenting with ways of maximizing the advantages of having to cope with fewer pupils. Normal classes were dominated by whole class instruction. English, teachers too favoured this more traditional approach in small classes, while for mathematics in small classes pair work predominated. As pupils moved from P2 to P3 more group work was attempted. When classes were ranked in order of attainment and attitudes at P1 and P2 few difference emerged between the four teaching approaches. In P1 sustained individual and pair enquiry improved learning disposition in Chinese while in mathematics whole class questioning had a similar effect. In P2 pupils taught by whole class questioners in English made most progress. A similar breakdown could not be accomplished with P3 since only Cohort 1 classes were small ones and numbers did not allow an extended analysis of this kind. When the data was aggregated across the three subjects no differences in attainment were found but in P2 classes the use of whole class instruction produced the lowest levels of learning disposition while whole class questioning produced the highest.
XI. A similar analysis was carried out on the pupil observation data. Again 4 types of pupil were identified bearing close similarity to the patterns of behaviour exhibited by pupils in earlier studies of primary classrooms in England. Type 1 pupils were labeled solitary workers. They were on task for almost 95% of the lesson but rarely interacted either with the teacher or their peers. Type 2 were intermittent workers. These pupils also mainly worked on their own but tended to become distracted when the teacher was engaged elsewhere in the classroom. Type 3 were also very industrious workers but were more often part of a group and so were labeled active collaborators. These pupils also concentrated on the task for 90% of the lesson. The final group of pupils with the lowest levels of on-task behaviour were called attention grabbers. They either sought or received more of the teachers’ undivided attention than any other pupil in the class, were more often moving around the classroom and received more praise than other pupils.
XII. When the distribution of pupil types was examined there were few differences between the size of the class or the year. Small classes and P3 classes had more active collaborators. P3 classes also had fewer attention grabbers. No differences emerged in attainment, attitudes or subjects. When the relationship between teaching approach and pupil types was examined whole class instructors had a significant higher proportion of solitary workers. These pupils while on-task were mostly listening to the teacher talking. The lack of any overall significant relationship between teaching and the patterns of pupil behaviour suggests that the latter may be a function of personality and temperament so that some attention grabbers may be shy, anxious introverts who seek constant reassurance from the teacher.
XIII. The impact of being in small classes on the TSA was also investigated. The 2004 results were used to select 37 other schools which were paired with those in the SCT study while also taking account of the social and economic characteristics of the school’s intake. Comparisons were then made between this matched sample, the experimental schools and the reference group. In the

iv
three samples the proportion of pupils achieving basic competence in 2005 was below the average for all Hong Kong schools in all three subjects in P3. By 2006 this situation had been remedied except for English where only the reference schools achieved comparable results with the territory-wide average. In 2007, the first year when the pupils in the experimental schools were in small P3 classes, there was little change compared to 2006 in any subject. Using the 2005 results to predict the 2007 competencies gave only one (mathematics) non-significant positive residual gain in favour of the experimental schools.
XIV. When the scores on the various sub-tests were analysed, no significant differences in favour of the experimental schools occurred in English or mathematics. In 2007 the experimental schools scored significantly below both the matched sample and the reference schools at individual listening in Chinese but did better on the second audio-visual information test. For these sub-tests a ‘light sampling’ procedure was adopted and this adds to the uncertainties in interpreting results. It would seem that main reason for improved scores was the teachers’ greater familiarity with the structure of the assessment since the greatest gains were made in 2006, the third year of the TSA operation.
XV. Some of the factors contributing to school success were examined by comparing the characteristics of the six most successful experimental schools (in terms of combined attitude and attainment profiles) with the four least successful. In the most successful schools Principals were more experienced, held firmer beliefs in the value of SCT for improving pupil attainment and took a more active role in curriculum and teacher learning development. They also placed greater emphasis on parental support and participation which was significantly higher in the more successful schools. There was a tendency for the more successful schools to have a greater proportion of individual and pair sustained enquirers and the less successful ones to have more group task monitors although these differences did not quite reach a statistically significant level.
XVI. The performance of the 5 schools in the experimental sample with relatively high proportions of disadvantaged pupils was examined. There was little difference in the attitudes and motivation of pupils irrespective of whether they were in schools with a high population of disadvantaged pupils or attended schools with a standard mix of pupils. In the first Cohort pupils from the disadvantaged schools held their own in both Chinese and mathematics attainment during the P1 and P2 years but lost ground in P3. In Cohort 2 pupils from the disadvantage schools did slightly better in both these two subjects in P1 and maintained this advantage in Chinese while achieving parity in mathematics during the P2 year. In P3 when Cohort 2 pupils moved back to normal classes those from disadvantaged backgrounds lost ground. Most of the deterioration in performance was due to girls. In English, where the pupils from disadvantaged backgrounds start from a low base, the position worsened year by year. The conclusion reached is that providing pupils from disadvantaged backgrounds are not too far behind on entry to primary school being in a small class is a positive advantage such that they maintain parity with pupils in schools with standard populations during the P1 year, although the magnitude of this effect decreases as pupils move up the school.

v
XVII. Further evidence in support of this conclusion comes when the progress of pupils in normal classes in the disadvantaged schools is compared with normal classes in the rest of the control schools. In both Chinese and mathematics pupils from the schools with a high proportion of disadvantaged pupils did worse in both P1 and P2 compared to the schools with a standard mix of pupils. In P3, however, the pupils from disadvantaged backgrounds caught up which reversed the trend in the small class sample. In English scores continued to deteriorate year by year. Being in a normal class and attending a school with a high proportion of disadvantaged pupils had little effect on either motivation or attitudes when compared to normal classes in the remaining experimental schools.
XVIII. A series of comparisons was carried out between classes from the reference group of schools and those in the SCT study. For attitudes and motivation there was little difference between the various samples in P1 and P2. English is disliked most, mathematics least. In every case attitudes decline year by year. The boys’ decline is sharpest in languages, the girls in mathematics. In the move to P3 the pattern is similar but in mathematics, boys’ attitudes in Cohort 1, which remained in small classes, showed the least decline. However this ground was lost on returning to normal classes in P4.
XIX. Comparing the attainment of pupils as they move through the P1 and P2 years produced similar patterns in both the reference and experimental schools. Any differences were mainly due to the differences at the start of P1 rather than being in a small class. In both school samples and in both languages boys make less progress relative to girls but in mathematics, although both girls and boys had approximately equal scores at the start of P1, they showed greater improvement by the end of P2. The superiority of the reference group at the start of primary school was mainly due to the lower percentage of pupils born in Mainland China. This has consequences in terms of parental support.
XX. In examining the changes from the beginning of P2 to the end of P3 the reference schools enjoyed an initial advantage because the pre-test was taken in September and not June. The reference group then maintained this advantage on the tests at the end of P2. The gender pattern in both experimental schools and reference schools was similar to that in P1 where girls outperformed boys in languages but boys were ahead in mathematics by the end of P3. When Cohorts 1 and 2 were compared the latter has an advantage in P2 and maintained this in P3 although the pupils had returned to normal classes. The final comparison compared Cohort 1’s move through P3 to the end of P4. The gender patterns partially replicated the earlier analyses with girls doing better in languages but girls maintaining parity with boys in mathematics. In Chinese, Cohort 1 pupils closed the gap on the reference schools (both genders) by the end of P3 but fell behind again at the end of P4 when they returned to normal classes. In English pupils in Cohort 1 were behind in every test but in mathematics they caught up the reference group at the end of P3 only to fall behind again at the end of P4. The inference from these results is that the attainment of pupils at the beginning of each school year was the prime determinant of pupils’ progress as they move from P1 to P4. In so far that there are fluctuations in the relative progress in Cohorts 1 and 2, compared to

vi
the reference schools, these are likely to be random and mainly due to the expertise of teachers taking a particular class in any given year.
XXI. This assertion was confirmed by a series of regression analyses in which the start of P1, P2, and P3 scores were used to predict the end of P2, P3 and P4 scores. The start of P1 score predicted 42.4% of the explained variance up to the end of P2, the start of P2 explained 64.3% up to the end of P3, the start of P3 accounted for 75% up to the end of P4 while the end of P3 scores accounted for 79% of the explained variation. In none of these analyses did being a member of a small class result in a statistically significant regression coefficient. As pupils move from year to year other factors such as place of birth and parental support assume less significance. The contribution to a pupil’s predicted score resulting in attendance at a particular school also decreased, for when a multilevel regression analysis was performed, with pupil variables and school as the two levels, schools accounted for some 8% of the variance by the end of P2 and P3 but only 4% by the end of P4. Moving from a small to a normal class in the P4 year causes the aggregated scores of pupils to fall by 1.9%.
XXII. The final analysis compared the 23 data sets collected for each subject over the lifetime of the project. Pupils in Cohort 2 who made more progress during the P1 year than the pupils in normal classes in Cohort 3 regress in P2 and do less well than either these control classes or the pupils in the reference schools. In P3, however, the year of the TSA examination and the year Cohort 2 pupils return to normal classes these pupils, who have experienced small classes for two years, regain lost ground. Cohort 1 pupils outperform pupils in the control classes in P3 but not in P1 or P2 and the return to large classes in the P4 year results in a dip in performance in comparison with both the control and reference school samples.
XXIII. Regression analysis confirmed these trends. The strongest predictor of the end of P2 attainment was the end of P1 score accounting for 67.4% of the explained variation. The start of P1 score contributed a further 3.7%. Using the end of P2 score to predict the P4 score accounts for 70.9% and using the end of P3 score just over 80%. When attainment is omitted from the analysis then only 14.2% of the variance is explained and being in a small class does not contribute to this percentage. Using the multilevel regression model some 5% of the predicted end of P4 performance can be attributed to school differences. Such differences can be attributed in various degrees to factors such as the Principal’s active leadership, the proportion of staff with qualifications in the subject they are teaching, levels of parental support and the socio-economic characteristics of the surrounding neighbourhood from which a school draws its pupils.
XXIV. To see if the advantages of attending a particular school were greater in small classes compared to the controls the analysis was conducted separately for each condition. The P3 score accounted for 81.8% of the explained variance in the predicted P4 scores in the small classes and 77.9% in the controls. Girls obtained a bigger advantage in small classes and the active leadership of the Principal also made a significant contribution. Examining the school contribution, the same schools rarely contribute to both the small and the

vii
control class analysis. One school made a positive contribution in small classes but a negative one in the controls. These results support the view that a major determinant of pupil progress is the expertise of the teacher who takes a particular class at a particular point in time. When all measures of attainment are excluded from the regression analysis 14.2% of the variation in the predicted P4 scores is explained in the control classes and about 8% can be attributed to school differences of the kind set out in the previous paragraph. The corresponding figure for small classes is 27.1%. Thus while there is variation between schools in their effective use of SCT there is an even larger variation within schools. The most likely explanation of these within school differences is the individual teacher’s classroom expertise.
XXV. The above results allow a number of research questions which were posed at the start of the study to receive qualified answers. In all of the analyses undertaken, effect sizes were always small to very small. The central research question asked whether pupils in small classes make better progress than those in normal ones. The answer was a partial yes, in that pupils in Cohort 2 outperformed Cohort 3 in the P1 year. However this advantage was lost in P2 although these pupils regained lost ground during the P3 year by which time they had returned to normal classes. Being in Cohort 1 had no positive effect in either P1 or P2 but these pupils did better in P3 although this advantage was lost when they returned to normal classes in P4. In none of the comparisons did being in a small class bring about improvements in motivation, self esteem and attitudes towards Chinese, English or mathematics. The results are therefore inconclusive and in line with previous studies where class numbers are in the mid twenties.
XXVI. In so far there were gains in any year these seem to fluctuate randomly between the experimental classes, the controls and the reference group. This suggests that a major determinant of pupils’ progress is the expertise of the particular teacher who takes the class in any one year. This view is supported by the regression analyses which show that the end of year score in the previous year increasingly accounted for most of the predicted variance as pupils moved from P1 to P4. Another factor was the TSA test which pupils took in P3. In this year, pupils in both Cohort 1 and 2 made up previously lost ground on the reference classes although those in Cohort 2 were no longer in small classes. The inference here is that there is a certain amount of ‘teaching to the test’ which makes the P3 year results difficult to interpret.
XXVII. The second research question asked whether it is important to have a small class only in P1 or whether the effect of being in a small class for more than a year was additive. Being in a small class in P1 was a clear advantage for Cohort 2 but not Cohort 1, probably because teachers in the first year of the study were adapting to the new conditions. The answer to the second question appears to be a negative one since Cohort 2 did not maintain their advantage in terms of attainment when pupils moved to P2 and although Cohort 1 made attainment gains during the P3 year this is probably had more to do with preparation for the TSA tests. The benefits of being in a small class prior to returning to a normal one were not conclusive. Cohort 1 showed no benefit when moving to P4 but Cohort 2 improved on moving to P3. However, the effect of the TSA

viii
again probably influenced this result. There is no consistent evidence therefore that being in the small class for three years was better than being in one for two.
XXVIII. The third question concerned the relationship between teaching and outcomes in the small classes. This has become particularly relevant given the decision to extend SCT to all public sector primary schools at the start of the 2009/10 academic year. Although four distinct teaching approaches were identified none appeared to offer an outright advantage in terms of attainment although there was some indication that a mix of individual and pair work that encouraged enquiry, combined with the use of whole class questioning improved pupils’ orientation to learning. Working in groups resulted in considerable off task behaviour which suggests that many teachers are still struggling to find ways of implementing this strategy in a satisfactory manner. Normal classes more often adopted a whole class approach where for over two-thirds of the lesson pupils either watched or listened to the teacher. Teachers taking part in the SCT study still appeared to be experimenting with different teaching approaches which, in itself, may account for the limited and inconsistent results in small classes.
XXIX. The fourth question concerned the effect of small classes on pupils from disadvantaged backgrounds. Here, there was evidence to suggest that being in a small class helps disadvantaged boys in particular to catch up in Chinese and maintain parity up to the end of P2. In mathematics the boys gradually outperform the girls and also maintain parity with the rest of the sample until the end of P2 but as with Chinese, any benefit gained from being in a small class is gradually eroded during subsequent P3 year. In a reverse of the general pattern it is the boys rather than the girls who benefit most from reductions in class size. However a condition of making progress is that the pupils must not be too far behind on entry to primary school. Thus in English, where the entry scores of both boys and girls in the schools with a high concentration of disadvantaged pupils were considerably below those of the remaining experimental sample, the gap widened year on year. When attitudes in the core subjects (Chinese, English and mathematics) were examined, both girls and boys scores in the disadvantaged schools showed few differences compared to those from the remaining schools in the experimental sample but girls’ attitudes in all three subjects declined at a faster rate.
XXX. The final question investigated the impact of the various contextual variables such as parental support and the leadership characteristics of the school Principal on the performance of pupils in the small classes. Teaching approaches did not appear to influence attainment except in mathematics where there was a very small effect size in favour of sustained enquiry and where pupils either interacted with the teacher individually or in pairs. Pupils who were taught by teachers using this sustained enquiry approach or where whole class teaching emphasized questioning rather than instruction had marginally better attitudes but again the effect sizes were very small. The effect of these contextual variables diminished as pupils moved up the primary school. Thus the advantage of attending a particular school was greatest in P1, as were the degree of parental support and the active leadership of the Principal. Comparing the most and least successful schools in the SCT study provided a further

ix
distinguishing characteristic. Principals of successful schools supported their teachers by providing non contact time for professional development. In none of the various analyses did the teacher’s training, their experience, level of qualification or their experience of teaching small classes make a significant difference.
XXXI. As teachers’ involvement in the study increased over time different forms of professional support were required. Initially teachers required mentoring to help replicate the existing successful practice of other colleagues. Visits from members of the school support team acting in this capacity were therefore helpful. At the next stage teachers became more interested in curriculum tasks so that workshops by subject experts and visits to other schools to observe other teachers’ classrooms were most valuable. At the point where teachers began to take ownership for changing their classroom practice, rather than seeking prescriptions from outsiders, learning circles became the most important means of professional development.
XXXII. Teachers were generally satisfied with the technical support they received. Their greatest need was more non contact time to engage in professional development activities and to make the necessary resources for group activities. It was often the case that these resources could be obtained from the surrounding environment rather than having to be manufactured. Thus in mathematics pupils could identify and measure various shapes within the classroom rather than have the teacher produces several sets of cardboard rectangles, circles and triangles. More successful schools found ways of providing additional non contact time for professional development.
XXXIII. In summary, although the results in terms of outcomes, both attitudes and attainment were not conclusive, there were many positive findings. First, and most importantly, there was strong evidence from the cluster analysis that teachers were beginning to experiment in the use of different teaching approaches. While teachers in regular classes mostly used whole class instruction, teachers in small classes were asking more challenging questions, making use of pair and group work and engaging individual pupils in more sustained interactions. This has come about because over the period of the study teachers have taken ownership of these changes, having accepted that there is no specific repertoire of prescribed strategies that constitute ‘small class teaching’. Learning circles have played a key part in bringing about this transformation.
XXXIV. Second, as a result of these improvements teachers in small classes have been able to improve the performance of pupils more evenly across the whole ability range whereas in regular classes improvements tend to be concentrated within the more able group. Third, smaller classes appeared to have particular benefits for children in schools with a high proportion of disadvantaged pupils during the initial year of primary schooling. Fourth, teachers have felt more relaxed and enthusiastic when teaching a smaller class and fifth, SCT was shown to work best when Principals took an active part in curriculum development and in the teachers’ professional development. These results suggest that over time, extending SCT to all primary schools will result in substantial benefits providing these encouraging features continue to be developed.

x
XXXV. There are therefore a number of recommendations that follow on from these findings:
Principals need to be encouraged to play a more active part in the implementation of SCT so that they can frame the professional development of their staff around the six principles which underpinned the approach used in this study. Distributed leadership to school curriculum leaders should not therefore be conceived simply as delegation but as a collegial sharing of responsibilities.
Both inter-school sharing across subjects and intra-school sharing around pedagogic issues should be encouraged using the ‘learning circles’ approach which has been employed successfully in the SCT study. Learning circles are important because they focus at any one time on a specific pedagogy, allow teachers to observe and evaluate each others classroom practice and thereby enhance the participants’ sense of professionality. This allows teachers to move from a position where they looked to others to tell them what they should do to become an effective small class practitioner to a point where they are prepared to take responsibility for developing appropriate pedagogies. Support for this initiative should be sought from appropriate members of staff in the University Departments of Education and should be coordinated by a core team. The aim should be to promote teaching for understanding by increased pupil talk and participation through extended whole class discussion, together with the increased use of pair and group work, thus easing the transition from the current emphasis on whole class instruction where pupils spend most of their time watching or listening to the teacher. These initiatives should concentrate initially on improving the quality of questioning during whole class discussion and with the effective use of peer tutoring during pair work where more knowledgeable pupils are able to help slower learners, thereby allowing teachers to provide more individual attention. The more difficult task of implementing collaborative group work should be left till there is evidence that the use of more effective whole class teaching strategies have begun to take root.
In coping with diversity, particularly in schools with a high concentration of disadvantaged pupils where teachers claim that there is a wide spread of ability in many classes, Principals should ensure that those aspects of classroom organisation and pedagogy which international research has shown can bring about significant improvement in pupils’ attainment are in place. These include the development of flexible grouping strategies, so that teachers can sometimes concentrate on slower learners while the more advanced work independently, the use of peer tutoring and the creation of resources which relate as far as possible to the pupils’ daily lives. The biggest improvement would come about, however, if teachers could raise the expectations of these disadvantaged pupils and convince them that it is often lack of effort rather than ability which stops them from making progress. Coping with diversity in schools with high concentration of disadvantaged pupils is particularly important in the years after P1 where the initial gains are eroded. The situation with regard to English, particularly in these disadvantaged schools, needs to be

xi
reviewed in order to overcome the deficit that many of these pupils bring with them on entry and from which they never recover.
Some thought should be given to timetabling. Lessons which encourage greater pupil participation are difficult to manage in a 35 minute session. Many schools have introduced at least one double session per week while others now work to a 45- or 60-minute timetable. If pupils are to be encouraged to participate more actively and to be given more thinking time during discussion then 35 minutes may be too short a time in which to implement such practice effectively.
Principals should be encouraged to allocate teachers to a limited number of year groups so that they have opportunities to teach more than one class in any particular year group. In the SCT study many practitioners only taught a single small class in P1, P2 or P3. They therefore had no opportunity to revise a particular lesson until a year later so that progress was often slow. If ideas from the learning circles are to develop at a reasonable pace then teachers need opportunities to test them out in one lesson, reflect on the outcomes and then make appropriate changes with a parallel class. Having a smaller range of year groups to teach would also cut down on preparation and hence offer possibilities of reducing the existing workload.
University Departments of Education need to consider ways in which the findings from this study could be used to reinforce existing and future initial teacher education programmes on matters such as teaching for understanding, catering for diversity and helping pupils to develop as independent thinkers. In this way these novice teachers, with the support of their University tutors, can act as agents of change. At the level of initial teacher education, courses should perhaps concentrate, initially, on making students more effective ‘whole class’ practitioners leaving more sophisticated teaching approaches such as group work to a later stage of their professional development.


1
1. Introduction 1.1 This final year of the Small Class Teaching (SCT) study has seen the
completion of the fieldwork. As this therefore constitutes the final report in the series, it may be helpful to readers if a brief outline of the main features of the research design together with a short summary of the findings of the previous three interim reports is included. The latter summaries will be placed in the appropriate sections of this report. During the 2007/08 school year the P3 small classes from Cohort 1 (the 2004/05 P1 small class sample) in the 37 experimental schools returned to normal size classes in P4. It is now possible to compare these classes with normal size classes from the same schools who were in P4 during the previous year (2006/07). These latter pupils have been followed since they were in P2 ‘normal’ classes at the start of the study.
1.2 Cohort 2, having been in small P1 classes during 2005/06 and P2 small classes in 2006/07 returned to P3 normal size classes in the 2007/08 school year. In addition, a third cohort, who had started in P1 normal size classes in 2006/07 moved on to ‘normal’ classes in P2. It has thus been possible to compare small classes with normal size ones in the same schools over the first three years of the pupils primary schooling and to replicate these comparisons in P1 and P2 using the second cohort. It has also been possible to measure the effect of three years’ experience of small classes on P4 comparisons (Cohort 1) and two years’ experience of small classes on P3 comparisons (Cohort 2).
1.3 A further matched sample of 15 schools (known as the reference schools) was added to the study in 2006/07. P1, P2 and P3 classes in these schools during 2006/07 moved up in the 2007/08 school year to P2, P3 and P4 respectively, thus affording a further set of comparisons. The complete administrative plan for affording the various comparisons outlined in the previous paragraphs is included at Appendix I. No further observations were carried out during this final year of the study, but the Teacher Questionnaire, which solicited practitioners’ views on the merits of SCT during the second year of the study (2005/06), was repeated. In addition, an analysis of the Territory-wide System Assessment (TSA) scores was undertaken using the 2004 results to draw a matched sample of 37 schools to compare with the ‘experimental’ schools taking part in the SCT study. Comparisons were then made using the 2005, 2006 and 2007 results.
1.4 To summarise this report attempts to answer the following questions:
• Do pupils in small classes make better progress in attainment and improved attitudes and motivation compared to pupils in normal size classes?
• Is it more important to have a small class in P1? Are any attainment and attitude changes cumulative so that pupils with three years experience of small classes do better than those with just two years? Are there any effects of Cohort 1 pupils moving back to regular classes in P4?
• Are any changes in attainment and attitudes associated with particular kinds of teacher and pupil behaviours?
• Do small classes confer additional benefits on schools with an above average number of pupils from disadvantaged backgrounds?

2
What other possible factors such as parental support, school leadership, teachers’ background and opinions influence classroom behaviour and performance in the ‘experimental’ schools participating in the SCT study?
2. Background to the Study 2.1 The SCT study began at a point in time when there was considerable
controversy surrounding the issue of reducing class size. Demographic changes in some areas of Hong Kong SAR led to a fall in the school population with the possibility of teacher redundancies. There was suggestion that rather than lose experienced teachers the opportunity should be taken to reduce the number of pupils in ‘normal’ classes to further enhance the quality of teaching and learning. In response to this appeal the then Education and Manpower Bureau (EMB) commissioned a SCT study. The broad aims of this programme of research were twofold; first to ascertain the benefits of SCT in the local context and second, to determine what teaching strategies, professional support and resources were necessary to maximise the effectiveness of SCT in Hong Kong’s primary schools.
2.2 Not surprisingly, the decision to set up the SCT study was seen by some as a
delaying tactic on the part of the EMB. The research of Blatchford et al (2002, 2003a) in England and that of the Tennessee ‘STAR’ (Student Teacher Achievement Ratios) project (Finn& Achilles 1999) was frequently cited in support of the claim that pupils did better in smaller classes. However, a more complete reading of this and other research suggested that the above conclusion was an over-simplification and that there were valid reasons why further research in the local context was required. A review by Hattie (2005) has summarised the results of some 164 studies and found that the average effect size of small class was 0.12 which is relatively small and according to Hattie represented about 9% improvement on the average pupil’s performance in a large class. In another American study, the Wisconsin Student Achievement Guarantee in Education (SAGE) the estimated effect size due to smaller classes was 0.20 against an overall annual improvement of 1.20 (Molnar et al 1999).
2.3 Hattie goes on to discuss a number of critical comments concerning research
into class size. Hanushek (1999) for example, points out that there was a high attrition rate in the STAR classes so that less than 50% of the students remained in the study by the time they entered the fourth year of schooling, although an analysis which controlled for this factor found it resulted in slightly bigger effect sizes (Nye et al 1999).
2.4 More relevant to the present study was the fact that in both the STAR and
SAGE studies a small class consisted of 15 pupils, whereas in Hong Kong the numbers range from 20 to 25. Blatchford et al (2002) found that significant gains in test scores only occurred when the class size was less than 18 although they argue (Blatchford et al 2003) that classes of less than 25 pupils can still be important, particularly for those pupils from poorer socio-

3
economic background who generally enter school with few academic accomplishments and therefore need to catch up.
2.5 Most studies conclude that the benefits accruing from smaller classes follow
the ‘law of diminishing returns,’ in that the effects are greatest with the youngest classes (Tomlinson 1990; Blatchford et al 2002). Nevertheless, Finn et al (2005) claim there are lasting benefits resulting from early exposure to small classes including better behaviour, increased engagement and higher levels of graduation once the pupils return to regular classes.
2.6 A further argument for setting up the SCT study arises from the fact that most
of the studies reviewed by Hattie (2005) took place in Western countries where regular classes are in the range 25-30. Fuller (1987) found 9 studies which had been conducted in developing countries where the typical regular class consisted of 44 pupils and found no differences were attributable to class size. More recently, an analysis of the TIMSS (Third International Mathematics and Science Study) found only four out of 40 countries where class size made a difference (cited in Hattie 2005). These researchers conclude that effective teachers in these developing countries have created a range of teaching strategies that ensure learning takes place in larger classes and that these techniques may not be so appropriate when the numbers of pupils are reduced somewhat.
2.7 Moreover, the general explanation for the gains in small classes in Western
countries is that there is less disruption and more pupil engagement in learning. Finn et al. (2003) argue that it is mainly the differences in engaged time that differentiate between small and large classes. Averaging the results of various studies there appears to be an improvement of around 13.9% in the ‘on-task’ behaviour of pupils in small classes compared to those in larger ones where the average recorded was 56.6% (ibid: 327). In the UK levels of engaged time typically range from the mid sixties to the low seventies as a percentage of all observations. Clearly it would seem valid to suggest that if teachers spend around a third of their time not teaching, and this figure is reduced by around 10% in smaller classes, then echoing Harnischfeger and Wiley’s (1976) conclusion, time on task is likely to be a major determinant of pupils’ improving progress. In Hong Kong, however, three years of observation has regularly recorded values of engaged time of around 90%, irrespective of where the class is small or of regular size and this seems common to many countries around the Pacific Rim. Moreover, as Bray (2000) has shown, many children in these countries receive after-school coaching which adds to engagement and complicates the analysis further. If Hong Kong pupils can be shown to benefit academically from the experience of smaller classes it is unlikely therefore that Finn et al’s (2003) explanation of increased engagement will suffix in the local context.
2.8 Hattie (2005) considers two further possible explanations of why small classes
might lead to improvements in academic performance (or rather why such classes don’t yield bigger effect sizes). The first of these examines the proposition often put forward by practitioners that in smaller classes more attention can be given to individual pupils. Few studies of class size have

4
included systematic observation of pupils and teachers, a notable exception being that of Blatchford et al (2005) who concluded that more one to one teaching took place in smaller classes with more pupil-teacher initiations. On the other hand Evertson and Folger (1989) found no statistically significant differences between small and large classes in the STAR project although pupils in the smaller classes tended to initiate exchanges with the teacher more often in seeking help. Other studies in Canada (Shapson et al. 1980) and in Australia (Bourke 1986) have also found little differences in teachers’ and pupils’ behaviour patterns across small and regular size classes. These results are not surprising when the mathematics of class size reduction on individualisation is considered. Buckingham (2003) has pointed out from a review of these observational studies that, typically, about 50% of each lesson consists of teachers directly addressing the class. In a typical 40 minute lesson in a class of 40 pupils then each individual would receive 30 seconds attention if the remaining half of the lesson was individualised and the teacher distributed her attention evenly around the class. Reducing the class to 25 pupils would increase the figure to 48 seconds. Thus under the most optimistic set of criteria a pupil would receive one and a half minute’s additional attention during the course of a school day.
2.9 This brings Hattie (2005) to the main reason why so many studies produce
such small differences when small classes are compared to regular size ones. He points to the mass of evidence to suggest that despite a world wide reform movement designed to change the way that ‘teachers teach,’ the dominant pedagogy still consists of mainly of teacher talk (most of it to the whole class) interspersed with some rapid questioning which according to Edwards and Mercer (1989) takes the form of ‘cued elicitations’ (where teachers offer further help in their reply to a pupil’s initial response as a way of guaranteeing a correct answer) followed by short bouts of group or pair work. Yair (2000) estimates that despite various reforms, some well intentioned, about 80% of American teachers continue with this didactic approach, 15% attempt to change but fail, leaving only 5% who are able to innovate successfully. These figures tend to support the historical analysis of teaching since the mid nineteenth century by Cuban and Tyack (1995) which argues that teaching has always been a conservative profession. What is true of teaching in general is therefore also likely to be true of the particular case of class size reduction.
2.10 However, the above conclusion does not necessarily vindicate the arguments
of those who suggest that the money spent on reducing the size of classes could be spent to better advantage elsewhere in the educational system. An international study of teachers’ work lives (Galton & MacBeath 2008) has shown that most practitioners, worldwide, work long hours (including most evenings and weekends) are under considerable personal stress and feel that their family life has deteriorated over the past five years. Hong Kong teachers typically work some 10 hours more per week than do their colleagues in Western countries. Among the factors which could help alleviate this stress most teachers cite a reduction in the size of classes for the obvious reason that it would reduce marking and administration time, the main reason for having to take work home in the evenings and at weekends. However, now that beginning with the 2009/10 school year class sizes will be reduced in most

5
public sector primary schools (following the announcement by the Chief Executive in October 2007) it is surely important that teachers give the research results serious consideration in looking for ways of maximising the advantages of smaller classes.
2.11 Maximising the advantages of smaller classes so that effect sizes improve
must involve changes in the way that teachers teach. This is certainly the premise that has guided the present SCT study. Faced with a lack of specific empirical evidence that distinguishes between less successful small classes and more effective ones it has been necessary to turn to the more general studies of classroom practice; to seek out those aspects of teaching that correlate most positively with pupil attainment. Hattie (2005) takes a similar view and has conducted an analysis of some 500 meta-analyses involving a total of around 300,000 individual research studies. Taking this analysis into account, the SCT study has been guided in its approach by the following six broad pedagogic principles aimed at developing pupils’ understanding:
• A clear statement of the learning objectives which are communicated to
pupils as an ‘advanced organiser’ at the beginning of the lesson and reviewed at the end to assess if students have mastered what has been taught. The aim is to move away from stating objectives in terms of outcomes (e.g. to count to 100 in tens, or to learn the story of the ‘Greedy Cat’) and instead to focus on the purpose of the learning and the processes through which it is to be achieved, using key phrases such as, to understand, to compare, to identify etc. An analysis of this kind helps to focus the teacher’s attention on the most appropriate form of pedagogy for achieving such objectives.
• The use of extended questioning techniques which allows thoughtful
discourse (Brophy 2004) to occur during dialogic whole class discussion (Alexander 2008a). This involves the use of more open questions, and allowing pupils more ‘thinking time’ between answers.
• Increasing pupil participation, particularly during class discussion.
Whenever possible therefore, investigation of pupils’ ideas precedes instruction. Thus in an English lesson on ‘shops’ the teacher might first ask the class about local shops, what they like to buy etc., before putting up flash cards with the sentences, “This is a toy (sweet, cake) shop.”
• Developing a spirit of cooperation between pupils through the use of
group and pair work. For this to result in effective learning it is necessary for pupils to formulate, with the help of the teacher, their own rules for working in groups and to be trained in ways of maintaining group activity and of arriving at decisions through consensus rather than by majority vote (Kutnick et al 2005). An important element in the training is to provide opportunities for groups to evaluate how well they worked together and to think about how they might improve their collaboration on future occasions. This can be undertaken as part of a general class debriefing or by getting pupils to engage in some form of self-evaluation activity.

6
• Providing appropriate feedback which allows pupils to reflect on their
work and if possible to discover errors for themselves and to correct them. This kind of informing feedback is designed to help pupils develop strategies for problem solving and for developing understanding so that eventually they are able to self-regulate their own learning and become what Galton (2007) has termed metacognitively wise. It contrasts with corrective forms of feedback where the teacher identifies the error for the pupil and then demonstrates the correct solution. There is evidence that although corrective feedback is useful when the lesson is focused on what Biggs (1994) and Biggs and Collis (1982) termed surface rather than deep learning, the feedback activities associated with self-regulation (providing cues, reinforcing pupils sense of self-efficacy etc) result in massive effect sizes of the order of 0.90 compared to corrective feedback with more modest values of 0.37 (Hattie and Timperley 2007). In particular, the use of praise for getting a correct answer only results in an effect size of 0.14 so that it is important when praising students to relate it specifically to some particular quality of the pupil’s response and to remember also to praise pupils whose answer may be inappropriate but who nevertheless have made a determined effort to arrive at an acceptable solution. Praise for effort can have a powerful motivational effect.
• Creating a framework for assessment for learning which follows the ideas
developed by Black and Wiliam (1998). In this approach tests and worksheets are not the sole means by which teachers determine whether a pupil has mastered a topic. When moving from teaching for transmission to teaching for understanding (Good and Brophy 2002) it is equally important to probe the thought processes of pupils as they carry out the set task. Thus debriefing students, listening to their explanations, getting students to identify when they need help etc. are all important assessment tools and link closely with the kinds of informative feedback discussed previously (Black et al. 2003).
2.12 It is important to stress that these are but guiding principles. How the teacher
puts these principles into practice will vary according to the specific contexts operating in the particular classroom such as the physical circumstances, the qualities of the pupils etc. This is in accordance with Gage’s (1978) definition of pedagogy as the science of the art of teaching. The principles of effective teaching derive from our knowledge of how human beings learn but the art of teaching, putting these principles into practice is built on teachers’ experience; what is usually termed craft knowledge. Thus Hong Kong teachers in this study have developed several ways of increasing pupil participation, quite unlike those seen in Western classrooms including a practice known as ‘daily talk’ where the teacher and pupils greet each other at the start of the lesson using the target language that was taught on the previous occasion.
2.13 In concluding this section therefore it should by now be clear that the initial request by teachers that the then EMB provide a prescriptive list of approved SCT methods was a distraction from the task that lay ahead of all involved in the SCT study. The principles of effective teaching are the same in classes of all sizes. The advantage of a smaller class is that it is easier to put these

7
principles into practice and to monitor their effect on pupils. The task of the then EMB school support team has been to work alongside teachers in developing ways that enable these principles of teaching to operate within the local culture.
3. Research measures used in the Study 3.1 The design of the study was such that it involved three levels of analysis; that
of the school, the class and the pupil. An overview of the various research instruments used is shown in Table 3.1.
Table 3.1 Overview of the measures used in the SCT Study
School Level Class level Pupil Level Population characteristics
• Parents’ survey • Head’s survey • Year Group • Subject
Teacher characteristics • Gender • Experience • Qualifications • Training • Subject specialism • Survey of opinions
Class size Observation
• Questions asked • Statements made • Feedback given • Whole class • Groups/pairs • Individual • Sustained
Pupil characteristics • Gender • Age • Place of birth • S.E.S.
Outcome measures
• Attainment • Attitudes • Motivation • Self-esteem
Observations
• Time on task • Pupil-pupil talk • Pupil-teacher talk • Target’s setting
3.2 At school level a questionnaire was administered to the parents of both P1 cohorts and to parents from the reference schools. It asked for information about such matters as place of birth of their children, level of education, type of employment, salary, accommodation and also explored the ways that they supported their children’s learning outside school (extra tuition, helping with homework, making educational visits etc.). In each administration response rates were high (around 90%) and, not surprisingly the degree of support given to a child outside school was highly correlated with family background and income. A factor analysis provided an overall measure of parental support with an internal consistency of 0.70. The scale had 11 items with loadings greater than 0.65 principally concerning the educational level of parents, their joint income, and the home resources available to support the child’s learning, the frequency of educational visits and the parents’ involvement in school

8
activities. Headteachers were also given a questionnaire, similar to the ones used to investigate teachers’ opinions about class size but which also explored the strategy for implementing SCT in the particular school.
3.3 At class level, background data on the teachers’ qualifications and training was collected from official records. Teachers’ opinions about SCT were solicited using a questionnaire based on earlier studies by Bennett (1996) and Blatchford (2003). This was first administered in 2005/06 and repeated in the 2007/08 school year. For the second administration a number of items were added that attempted to explore how far teachers felt that some of the practices developed for use in smaller classes were also applicable in normal size ones. In each of the first 3 years of the study a sample of teachers (around 100 in any year) were observed using a modified version of the two original ORACLE (Observational Research and Classroom Evaluation) Project systematic observation instruments (Galton et al 1980). This codes teachers’ and pupils’ behaviour at 30 second intervals during the lesson. Members of the then EMB research team were trained to use the instrument by the consultant. A detailed version of the observation schedule is contained in the Appendix II.
3.4 At pupil level details of the pupils’ background were again obtained from official records. Attainment tests were specially constructed by the then EMB. In Chinese and English there were sections on listening, reading and writing. Items were mainly of a multiple choice variety. The pupils’ attitudes to Chinese, English and mathematics and the motivation and self-esteem measures were based on instruments used by Galton et al (2003) in studies of pupils transferring from primary to secondary school in England. Despite initial fears of using ‘Likert’ type 5 point scale questionnaires with younger pupils (For the start and end of P1 a 3-point scale was adopted and the number of questions reduced) the scales had high internal consistency (α> 0.90 in most cases) and showed remarkable stability from year to year. An exception in P1 was the motivation scale (Cronbach α =0.65) so that motivation and self esteem were merged into a single scale and this practice was retained in subsequent year groups for the sake of continuity. Observations on pupils were also carried out at the same time that the data on teachers was collected. In each class a stratified sample (3 boys and 3 girls) of six ‘target’ pupils was randomly selected for observation.
3.5 The quantity of data available for analysis was considerable. In most years some 700 classes were tested. This resulted in approximately 20,000 pupils taking the end of P1 tests in each of the subjects, all of whom were followed for a second year. Nearly 23,500 took the end of the P2 tests in each subject, the majority having entered the study at the beginning of P1. The corresponding figure for the number of pupils taking the end of P3 test was 20,500 while just over 11,000 of these pupils continued to the end of P4. Of the total sample who started in P1 classes, approximately 53.9% started in small classes, 27.2% came from the control classes in the same schools with the remaining 18.9% being drawn from the reference schools. Full details of the numbers of pupils involved in the various tests can be found later in a later section of this report (Table 12.1).

9
4. The Consultant’s visit to the schools
4.1 By the end of 2006/07 academic year the consultant had visited all but one school in the SCT study and observed approximately equal numbers of Chinese, mathematics and English classes. This was in addition to the systematic observations carried out by members of the then EMB research team. In the first year of the study it was decided that the consultant should also make an annual visit to 8 of the 37 experimental schools in attempt to monitor changes over the lifetime of the study. These eight so called ‘sample schools’ were selected mainly on the basis of their relative academic performance during the first year of the study supplemented by advice from the school support team who had detailed knowledge of the schools in question. The final visit to the sample schools took place in November 2007 when the remaining unseen school was also visited.
4.2 In the event it was only possible to follow the progress of relatively few teachers over the three year period. This was because some Principals adopted a policy of giving as many of the staff as possible experience of small classes so that a teacher observed in one year would have moved back to teaching normal classes in subsequent years. In other cases moves to different year groups also reduced the opportunities of seeing the same teachers on more than one occasion. For these reasons it was difficult to form a considered judgement about the changes in classroom practice that may have taken place over the lifetime of the project.
4.3 The general impression gained, which was confirmed by the more detailed systematic observation during the course of the study, was that there was considerable variation across schools and between teachers within the same school. In one mathematics lesson, for example, P2 groups of pupils in a small class were asked to classify different objects according to their shape (circle, square, rectangle etc). The groups worked badly because only one pupil explored the characteristics of the object at a time (rolling or sliding) while others had to watch. This led to excessive noise and a tendency to grab at the objects in order to get a turn. In reporting back it became clear that pupils had not understood the purpose of the lesson so the teacher then demonstrated what they should have done.
4.4 In the previous year the same teacher had been observed teaching the concept of ‘reversibility’ to another small P2 class. Although this was the first time, according to the teacher, that they had encountered this idea no attempt was made to explore with the use of counters or other objects, the difference between ten lots of 5 and 5 lots of ten etc. Instead, pupils worked in pairs on a worksheet consisting of a series of simple calculations with one pupil working out one arrangement (e.g. 5 x 2) and writing the answer on the worksheet while the other watched. The second pupil then did the alternative calculation (e.g. 2 x 5). Again the fact that pupils had to wait for a turn led to a certain degree of disruption. When reporting back pupils again showed they had little understanding of what they had been asked to do or why they had been required to do it.

10
4.5 This teacher seemed to have benefited little from the advice given by the school support team. She had not established rules for working collaboratively, did not debrief the class about how well (or badly) they had worked together. Although it was established early on in the study that writing and similar tasks were best done individually with results then shared, thus avoiding some pupils having little to do in the groups, this teacher persisted with the opposite approach. At interview she appeared to have very low expectations of these pupils claiming as a reason for not instituting peer tutoring that all but two pupils in the class were still at beginning P1 level.
4.6 In contrast in a P1 English class with 27 pupils the teachers used a pencil box to teach the target language, “This is my ruler,” and “These are my pencils” etc. This was done through class discussion. Each pupil then prepared worksheet on which they had to choose a name for the child portrayed in the pictures. They then played a game, in pairs, using cards with pictures of pens, pencils, ruler etc. One pupil had to select a card and asks, “Is this your/Are these your ruler/pencils etc?” as appropriate and the other then replied using the correct construction which the first pupil checked from the card. Then each pupil consolidated this learning by drawing a circle around the correct construction on their worksheet. The pair then swapped roles. At the end of the lesson pairs of pupils came out to the front of the class and acted out the sequence.
4.7 This lesson was in sharp contrast to the one seen in the previous year where a small P3 class spent most of their time constructing a birthday card in groups mainly by cutting out pictures from magazines and sticking them onto the card. Since only one of the groups was actively mounting a picture at any one point in time most of the class had found themselves with little to do but sit and watch for long periods. In the second year of observation, however, this teacher was much more concerned to utilise time profitably. Thus it took time for the teacher to distribute the packs of cards to the pairs of pupils but while she was doing this the class sang a song in unison about what was in their pencil cases, thus again reinforcing the initial learning. Overall, many of the suggestions made by the school support team had been taken up. The rules for group work were clearly displayed, the target language was situated within a familiar context (i.e. the pupils’ pencil cases) so that the spoken words were more meaningful and during pair work both pupils were fully involved, while writing tasks were undertaken individually.
4.8 A rough estimate would suggest that only about 25% of the lessons that were seen achieved this standard. As on previous visits lessons were rated on a five point scale in terms of the six principles. Last year’s overall rating in the 8 repeat sample schools averaged between 2.0 and 2.5. This year the corresponding figure was 2.75. The main weaknesses in the other lessons, as it was in 2006/07, mainly concerned inappropriate use of groups, particularly in cases where only one pupil at a time had an active role so that the remaining members sat and watched. This situation usually led to inattention and sometimes misbehaviour on the part of the passive pupils. Part of the problem of group work was that in a 35 minute lesson there was little time for debriefing pupils and evaluating how well they had worked. In some schools

11
teachers normally used groups in ‘double’ lessons but felt it necessary to attempt a group task because the consultant was present. Thus what was seen may on occasions have represented atypical practice.
4.9 There were however other factors which distinguished between poor and satisfactory lessons. In the latter case nearly all the teachers had attended the learning circles and said at interview that they had benefited considerably as a result of the experience, because as one teacher remarked working with colleagues from other schools had, “made me rethink my practice.” One factor associated with the less satisfactory lessons was the low expectations of some teachers had of the pupils, as exemplified in the earlier example of the P2 mathematics lesson on reversibility. This negative view of the pupils’ ability was frequently used to justify rigid adherence to the textbook so that often the work set was not sufficiently challenging with a consequence that pupils lost interest, thus appearing to confirm the teacher’s assessment that “these children were unable to concentrate” for any length of time.
5. Teacher professional development
5.1 In the 2007/08 school year most of the efforts by the school support team have been devoted to the schools joining the scheme for schools with a high proportion of disadvantaged pupils. Teachers from the study schools, along with those from the scheme, did attend a half-day seminar in December in 2007 when the consultant reported on the results from the third year of fieldwork and gave a presentation on maximising the benefits of SCT to cater for pupils’ learning diversity.
5.2 Throughout the lifetime of the study the school support team have provided substantial professional support to the participating schools. In the 2004/05 school year this mainly consisted of workshops on joint lesson planning and on the principles and practice of cooperative learning and individual school visits to clarify issues and to identify the various kinds of support required. In the spring of 2005 a group of teachers from participating schools visited small classes in Shanghai. In 2005/06 there was a shift of strategy away from formal seminars towards the development of learning circles in which teachers played a more active part, although a number of on-site workshops were delivered at the request of schools and the study tour to Shanghai schools was repeated in April 2006. During the year 8 learning circles were established in which 26 schools participated. In 2006/07 this programme was extended and a variation of the learning circles format, collaborative lesson planning circles introduced where teachers planned lessons jointly, observed each other’s teaching and then evaluated the results. By the end of the year there were 15 learning circles and 15 lesson planning circles were in existence. Outside expert facilitators were brought in to support the work of these circles on topics chosen by the teachers. In addition to these activities members of the school support team continued individual school visits to discuss progress and assess needs.

12
6. The replication of teachers’ views on small classes
6.1 The teachers’ questionnaire was first administered in 2005/06. The exercise was repeated during the course of the 2007/08 school year, the purpose being to see how far the experience of working with small classes had changed opinions. A number of additional questions were added which were designed to explore how far teachers had accepted the view put forward by the school support team that there was no special SCT method but that the implementation of these effective practices was more difficult in normal classes. The extra questions therefore asked if certain teaching approaches were equally possible in large and small classes, and if so, whether using them with a large class presented certain difficulties.
6.2 Most of responses from the earlier administration reflected the pattern reported in previous surveys of teacher opinion on class size. There was almost uniform agreement that when with a small class teachers felt more comfortable, enthusiastic and relaxed. Indeed, what might be termed professional comfort (combining the scores on these items depicting positive feelings about one’s teaching) has increased significantly for small classes since the first administration (mean = 4.87 in 2006 compared to 5.14 in 2008) whereas the level has fallen slightly when teaching normal classes (mean = 3.93 in 2006 but 3.75 in 2008). However, there is some evidence to suggest that these views tend to be held irrespective of the experience of teaching smaller classes because when the scores of teachers with no experience of teaching a small class were compared with those of their colleagues who had taught at least one small class no significant differences emerged.
6.3 In 2006, when teachers’ opinions were first surveyed, most respondents strongly believed that in small classes pupils received more individual attention, were able to establish more satisfactory relationships with teachers and were consequently better motivated. It was also thought that small classes made it easier for teachers to identify individual pupil differences and offer remedial help, thereby raising standards. The only advantage perceived for larger classes was that it provided more opportunities for pupils to make a greater number of friends. In their responses Hong Kong teachers closely resembled their English colleagues who filled in similar questionnaires for Bennett (1996) and Blatchford (2003).
6.4 Despite having the evidence of few differences between the attention received by pupils in small and normal classes and little difference in pupil motivation, respondents to the second administration presented similar views to those set out in the previous paragraph concerning the perceived advantages of having a smaller class. When the items on this section of the questionnaire were subject to factor analysis two scales emerged. The first of these might be described as a pupil impact factor. This consisted of items dealing with the pupils’ self-confidence, motivation, and standards of work, amount of individual attention received, relationships with teachers and other pupils and the likelihood of being bullied (score reversed). The second factor concerned the impact on classroom practice, and covered such aspects as planning and preparation time,

13
choice of curriculum content and teaching approach, the amount of time available for assessment, reflection, liaison with colleagues and parents as well as aspects of discipline and classroom control (including the flexible use of space and freedom of movement). Table 6.1 shows the mean difference in scores of a sub-sample of teachers who completed the questionnaire on the two administrations. On both factors a low score (scale 1 to 5) indicates that teachers felt that increasing class size has an adverse effect. There was a negligible shift in opinion over the two-year interval. Older, more experienced teachers believed that increasing class size had a bigger impact on pupils while female teachers (the majority) felt its consequences on classroom practice were more adverse.
Table 6.1 Effects of increasing class size
Factor 2006 2008
Mean s.d. N Mean s.d. N
Pupil impact 1.29 0.65 420 1.24 0.57 420
Classroom practice 1.87 0.59 436 1.85 0.44 436
6.5 As explained earlier, the 2008 sample of teachers was also asked whether it was possible, if more difficult, to carry out certain activities in normal classes as well as small ones. The majority of the respondents felt that six out of the 14 tasks were inappropriate in normal classes. It was thought impossible to cater for slow learners, match tasks to individuals, give individuals extra help, cater for gifted pupils, mark pupils’ work during class and use across-the-age-group peer tutoring. All these items reflect the widely held view that smaller classes allow individual pupils to receive more attention.
6.6 Three items were thought possible in normal as well as small classes although more difficult in the former. These were the ability to differentiate by task, to hold class discussions and do group work. Finally, a majority of teachers felt that the following 5 activities were equally appropriate in both small and normal classes. These consisted of setting practical tasks, giving oral feedback, doing pair work, involving pupils in their own assessment and making use of within-the-age-group peer tutoring. These findings do suggest that a majority of teachers do now recognise that apart from catering for individual differences most of the common teaching approaches can be used in both small and normal classes, although with a degree of difficulty in some cases. As such it marks a shift of opinion from the start of the study when many teachers demanded that they should be informed about ‘SCT methods.’
6.7 In the 2006 administration some questions were included which were not solely concerned with the effects of class size. The first of these asked respondents to identify those aspects of support that had the greatest impact on teaching and learning and the degree of help received in relation to these various inputs. Table 6.2 contrasts differences between the value placed on each aspect of support and the extent of the help actually received for both the 2006 and 2008 administrations. Each aspect of support is placed in rank order according to its mean rating. For the 2008 administration school sharing was

14
divided into between and within school activity and an item on peer observation added.
6.8 As in 2006, teachers in this latest survey place the highest value on practical assistance in technical matters (particularly in computing) and from social workers and educational psychologists when dealing with special educational needs (SEN) pupils. It would seem that most schools offer this support. Next in rank order is the leadership provided by the Principal and the curriculum coordinator together with the opportunities it affords for joint planning. Again the value placed on these supports appears to be matched by the help received. What does emerge in the 2008 responses is a sharper differentiation between the kinds of activities designed to promote improvements in teaching and learning (as for example learning circles) and the value placed upon such supports. In 2006 inter-school sharing was not highly valued but was ranked second in the amount of help received. In the 2008 returns it is clear that most of this activity involves sharing with colleagues in the same school.
Table 6.2 Relative importance of support for impact on teaching and learning
Teacher supports 2006 2008 valued received valued received
Technical support 1 1 1= 1 Professional support 2 4 1= 3 Curriculum leadership 3 6 4 4 Principal leadership 4 5 3 5 Specialised teaching 5 8 5 9 Collaborative planning 6 7 6 7 Professional development 7 3 7 6 Split-class teaching in languages and /or maths 8 10 9 12 Inter-school sharing 9 2 11 8 Clerical support 10 9 8 10 Teaching assistants 11 11 13 13 Intra-school sharing 10 2 Peer observation 12 11
6.9 This discrepancy in the 2006 findings between what teachers were offered and what they valued was explored by the consultant during subsequent school visits. It emerged from these conversations that teachers did not underrate the importance of these exchanges with other colleagues, but that they did not value them because they were unable to capitalise on the benefits for a number of reasons. First, there were too many initiatives, hence their plea to be allowed to specialise in their major subject and with a smaller range of year groups so that they could concentrate their efforts on the small class initiative. Second, it was often the case that curriculum leaders tended to concentrate on

15
matters of content and on preparation of resources rather than explore different teaching approaches. Teachers attending the learning circles became frustrated because they were unable to share their experiences with other teachers on their return and began to question the time and effort involved.
6.10 If anything, judging by the 2008 returns this situation has not improved. Intra- and inter-school sharing and peer observation are perceived to be of little value despite research evidence that creating communities of practice is one of the most effective ways of bringing about changes in classroom pedagogy Louis and Marks (1998); Watkins (2005); Stoll and Louis (2007). It would appear that while school Principals are providing opportunities for teachers to share experiences the results of such exchanges bring few perceived benefits to the participants. Principals and curriculum leaders will therefore need to rethink the nature of the support they provide for such activities. They will also need to persuade teachers that there is value in sharing their experiences with colleagues from other disciplines, since many of the classroom practices which need changing, if SCT is to maximise its potential, are not subject specific.
6.11 In their conversations with the consultant most teachers raised the issue of learner diversity. Respondents to the questionnaire were asked about the most effective strategies for coping with classes where there was a wide range of ability. Table 6.3 compares the results from the two administrations. In the 2008 version of the questionnaire same age group peer tutoring was distinguished from across age group tuition. It would appear that there has been a shift in strategy over the two year interval. While providing extra tuition in breaks or after school continues to be the most favoured strategy it is now the most frequently used one (now ranked first compared to a third in 2006). This is coupled with the use of differentiated tasks (up from fourth ranked to second) coupled with the use of same age peer tutoring and work in groups. The question did not ask respondents to distinguish between different kinds of group organisation, but the impression gained during the consultant’s visits to schools was that teachers are operating more flexibly using a mix of homogeneous and heterogeneous groupings according to the demands of the task.
Table 6.3 Ranking of strategies for coping with learner diversity
Coping strategies 2006 2008 valued used valued used
Extra tuition for the less able 1 3 1 1 Peer tutoring (same age group) 2= 1 5 3 Peer tutoring (across age groups) 7 7 Taking pupils from class for remedial work 2= 6 2 5 Group work 4 2 4 4 Providing differentiated tasks 5 4 3 2 Use of teaching assistant 6 8 6 9 Co-teaching with a colleague 7 7 8 8 Self learning corner in the classroom 8 5 9 6
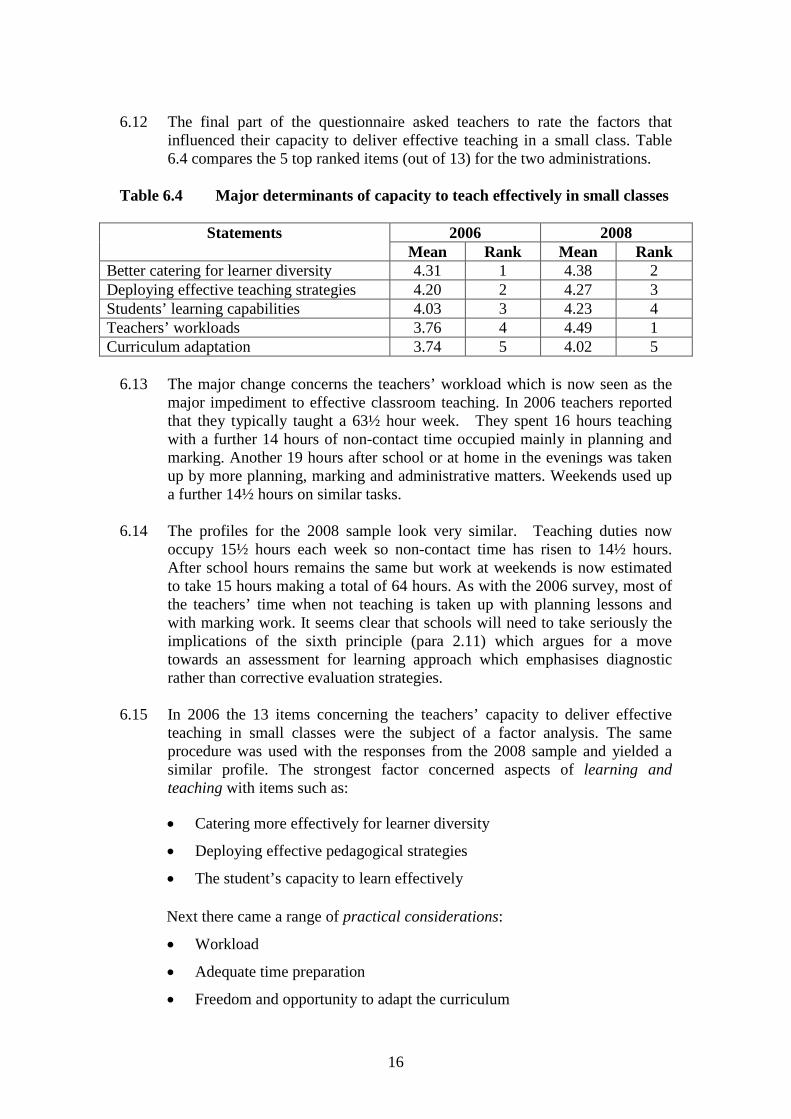
16
6.12 The final part of the questionnaire asked teachers to rate the factors that
influenced their capacity to deliver effective teaching in a small class. Table 6.4 compares the 5 top ranked items (out of 13) for the two administrations.
Table 6.4 Major determinants of capacity to teach effectively in small classes
Statements 2006 2008 Mean Rank Mean Rank
Better catering for learner diversity 4.31 1 4.38 2 Deploying effective teaching strategies 4.20 2 4.27 3 Students’ learning capabilities 4.03 3 4.23 4 Teachers’ workloads 3.76 4 4.49 1 Curriculum adaptation 3.74 5 4.02 5
6.13 The major change concerns the teachers’ workload which is now seen as the
major impediment to effective classroom teaching. In 2006 teachers reported that they typically taught a 63½ hour week. They spent 16 hours teaching with a further 14 hours of non-contact time occupied mainly in planning and marking. Another 19 hours after school or at home in the evenings was taken up by more planning, marking and administrative matters. Weekends used up a further 14½ hours on similar tasks.
6.14 The profiles for the 2008 sample look very similar. Teaching duties now
occupy 15½ hours each week so non-contact time has risen to 14½ hours. After school hours remains the same but work at weekends is now estimated to take 15 hours making a total of 64 hours. As with the 2006 survey, most of the teachers’ time when not teaching is taken up with planning lessons and with marking work. It seems clear that schools will need to take seriously the implications of the sixth principle (para 2.11) which argues for a move towards an assessment for learning approach which emphasises diagnostic rather than corrective evaluation strategies.
6.15 In 2006 the 13 items concerning the teachers’ capacity to deliver effective
teaching in small classes were the subject of a factor analysis. The same procedure was used with the responses from the 2008 sample and yielded a similar profile. The strongest factor concerned aspects of learning and teaching with items such as:
• Catering more effectively for learner diversity
• Deploying effective pedagogical strategies
• The student’s capacity to learn effectively
Next there came a range of practical considerations:
• Workload
• Adequate time preparation
• Freedom and opportunity to adapt the curriculum
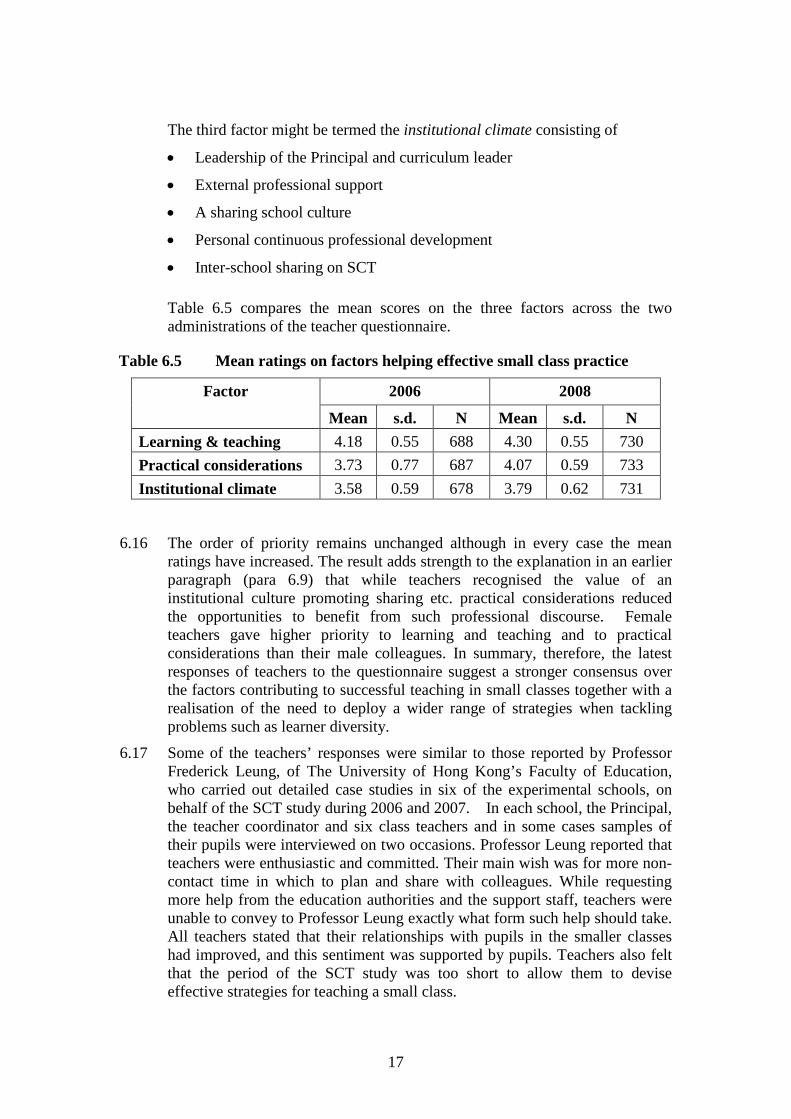
17
The third factor might be termed the institutional climate consisting of
• Leadership of the Principal and curriculum leader
• External professional support
• A sharing school culture
• Personal continuous professional development
• Inter-school sharing on SCT
Table 6.5 compares the mean scores on the three factors across the two administrations of the teacher questionnaire.
Table 6.5 Mean ratings on factors helping effective small class practice
Factor 2006 2008
Mean s.d. N Mean s.d. N Learning & teaching 4.18 0.55 688 4.30 0.55 730 Practical considerations 3.73 0.77 687 4.07 0.59 733 Institutional climate 3.58 0.59 678 3.79 0.62 731
6.16 The order of priority remains unchanged although in every case the mean ratings have increased. The result adds strength to the explanation in an earlier paragraph (para 6.9) that while teachers recognised the value of an institutional culture promoting sharing etc. practical considerations reduced the opportunities to benefit from such professional discourse. Female teachers gave higher priority to learning and teaching and to practical considerations than their male colleagues. In summary, therefore, the latest responses of teachers to the questionnaire suggest a stronger consensus over the factors contributing to successful teaching in small classes together with a realisation of the need to deploy a wider range of strategies when tackling problems such as learner diversity.
6.17 Some of the teachers’ responses were similar to those reported by Professor Frederick Leung, of The University of Hong Kong’s Faculty of Education, who carried out detailed case studies in six of the experimental schools, on behalf of the SCT study during 2006 and 2007. In each school, the Principal, the teacher coordinator and six class teachers and in some cases samples of their pupils were interviewed on two occasions. Professor Leung reported that teachers were enthusiastic and committed. Their main wish was for more non-contact time in which to plan and share with colleagues. While requesting more help from the education authorities and the support staff, teachers were unable to convey to Professor Leung exactly what form such help should take. All teachers stated that their relationships with pupils in the smaller classes had improved, and this sentiment was supported by pupils. Teachers also felt that the period of the SCT study was too short to allow them to devise effective strategies for teaching a small class.

18
6.18 The Principals also endorsed the value of SCT arguing that it improved pupil motivation and had particular advantages for slow learners, but like the teachers they were also unable to explain to Professor Leung what aspects of SCT brought about these benefits. Principals saw their role mainly as ‘managing the logistics’ and being resource providers although they claimed to offer moral support to their participating staff. While they demanded more training for staff they also said that staff were too busy to attend the existing programmes of professional development.
6.19 The teacher coordinators reported that they had found it difficult, at first, to implement their role because some teachers strongly defended their subject autonomy and didn’t wish to join with colleagues from other specialisms. They also felt that they lacked sufficient knowledge to be able to fulfil their coordinating role without additional external support and welcomed any opportunities to meet with similar colleagues from other schools to discuss common problems and ideas. In summary, therefore, Dr Leung’s report suggests that most participants interviewed were at a transition stage where they were still uncertain of what was involved in implementing successful SCT and partly wished that someone in authority would offer them a prescription that they could follow. It is therefore heartening to be able to report from the responses to the 2008 teacher survey that many respondents appeared to have moved on from this position and now recognised that there never was, or could be, an available magic prescription for SCT which they could bolt on to their existing practice.
7. Further consideration of the observation data 7.1 Three years of systematic observation have identified only a few significant
differences in teaching approach between small and normal size classes. Where variations exist these are mostly a consequence of changes in year group (more factual questions in P1; more challenging ones in P3) or have to do with subject differences (pupils are more often listened to when reading in English while in mathematics they are listened to when offering explanations). In all years there has been little variation in the amount of individual help that pupils receive when they are the sole focus of the teacher’s attention. The main difference concerns the manner in which such attention is received. In smaller classes individual attention (mainly when part of a group or whole class) is given in bursts and is more likely to be sustained over the 30 second time unit between successive observations. In normal classes such attention consists of brief exchanges. The inference here is that in the smaller classes there is a possibility that more insightful discourse may occur. In a small scale study of English classrooms Hargreaves, Galton and Pell (1998) found that more complex discourse, built around sustained teacher-pupil interactions, was the main difference between small and large classrooms.
7.2 As discussed earlier in the present report (paras 2.7 and 2.8) this finding is in
accord with the results from most other studies of class size reduction, even where the numbers of pupils in a class are around 15. Mathematically, reducing the class size from the high 30s to the low 20s affords the possibility of only limited increases in individual attention, particularly in the present

19
study where over 60% of most lessons consist of whole class teaching during which time the teacher is talking and no individual pupil is the focus of his or her attention.
7.3 However, there is a further factor that helps to minimise any significant
variations between small and normal classes. So far, in the study comparisons have been made in terms of mean differences. This takes little account of the variation that undoubtedly exists between individual teachers (apart from using the standard deviation to determine the level of statistical significance and the subsequent effect size). Using mean scores runs the risk that the high level of interaction of one teacher on a certain category of behaviour is cancelled out by the low level of activity of another, thus masking real differences in teaching behaviour.
7.4 An alternative approach is to use a statistical technique known as ‘cluster
analysis’. This is a procedure for placing individuals in groups such that the variation between members of any group is less than the variation between different groups. In the present study therefore we can use the technique to group teachers (and pupils) who have similar interaction patterns. In all, data from 395 classrooms were available for analysis. In a minority of cases a teacher who taught a P1 class was also observed when teaching P2 or P3 classes. However because the previous analysis showed that the main variations across the interaction categories was a function of the different year groups, the class rather than the individual was chosen as the unit of analysis.
7.5 Table 7.1 shows the characteristics of the 4 cluster solutions. Type 1 teachers
are mainly identified by the relatively high amounts of attention they give to individual pupils (both boys and girls). They tend to prefer pair work and have the highest levels of sustained conversation of the four types. They are second only to Type 4 teachers in asking open-ended questions and highest on statements of ideas. Feedback tends to be of the informing rather than the correcting kind. These teachers might therefore be describes as individual and pair sustained enquirers.
Table 7.1 Characteristics of the four teacher types1
Observation categories Mean % of all observations Effect size Type 1
(N=119) Type 2 (N=73)
Type 3 (N=119)
Type 4 (N=84)
Questions Which recall facts 3.90 4.89 3.31 7.14 M offer closed solutions 8.95 7.35 13.95 13.61 M offer open ideas 5.14 3.06 2.44 5.79 M refer to task supervision 2.86 3.70 1.09 3.73 M refer to routine activity 1.19 0.46 0.28 0.75 S All questions 22.03 19.46 21.07 31.03 M
1 In some categories rounding off the figures to two places of decimals may mean that the totals do not add exactly to 100.00.

20
Observation categories Mean % of all observations Effect size Type 1
(N=119) Type 2 (N=73)
Type 3 (N=119)
Type 4 (N=84)
Statements of fact 10.65 9.37 15.93 9.84 M of ideas 4.11 0.78 1.57 1.83 M of task direction 16.12 25.86 15.33 19.01 L of correcting feedback 5.72 6.07 6.39 4.60 None of informing feedback 6.40 4.34 2.78 4.21 M of behaviour feedback 4.78 2.47 4.51 4.07 S of routine directions 5.78 4.47 5.30 8.85 M All statements 53.55 53.36 51.81 52.40 None Listening/watching pupils report or explain 11.27 12.06 9.87 7.20 S Read 5.57 2.28 10.44 5.14 M in silence (monitoring) 8.83 12.93 6.81 4.50 M All listening/watching 25.87 27.27 27.11 16.85 M Audience individual boy 5.75 1.69 1.21 1.98 L individual girl 2.61 0.82 0.64 0.52 M boy for group 2.58 9.50 2.19 2.42 L girl for group 1.79 9.18 1.12 2.48 L boy for class 12.62 7.12 13.65 11.87 M girl for class 9.38 4.02 9.58 9.15 M Pair 8.38 0.50 1.51 2.10 L whole group (no one in focus) 8.20 20.41 6.67 8.49 L whole class (no one in focus) 48.69 46.74 63.42 60.99 L Sustained 15.96 9.51 10.40 11.67 S Effect size: S=small; M=medium & L=large where 0.2<S <0.5 <M<0.8 <L (Cohen 1988) 7.6 Type 2 teachers favour the use of group work. They have the lowest level of
questioning overall but the highest percentage of task direction statements, presumably to do with setting up the groups. They spend most time either listening to pupils report or explain or else monitoring the pupils’ activity. They might be described group task monitors. Both Type 3 and Type 4 teachers favour whole class teaching. Whereas Type 4 teachers are distinguished by high levels of questioning across all five categories stated in Table 7.1. Type 3 teachers have high levels of statement of fact and of correcting feedback. When listening to pupils it is mostly to hear them read rather than silently monitoring pupils while they work. We might thus describe Type 3 teachers as whole class instructors while Type 4 practitioners might more aptly be named whole class questioners.
7.7 In Table 7.2 the proportions of these teacher types in small and normal classes are examined. The analysis is shown separately for the 3 year groups given the possibility that as pupils advance through primary school the teaching approach changes. In general, there tends to be a mix of teaching approaches in the small classes, particularly in the P1 year. In normal classes, however, one type tends to dominate in the different year groups. Thus 60% of teachers

21
in P1 normal classes are whole class instructors while in P2 nearly half (46%) are whole class questioners and 54% of P3 normal classes use a mixture of individual and pair work to promote sustained enquiry. These findings suggest that when teaching small classes many teachers were still experimenting with different approaches, even after three years, while in normal classes there seems to be a progression from direct instruction in P1 to more interactive class teaching in P2, while in P3 pupils are given more responsibility for managing their learning so that the teacher’s support becomes more individualised. A further finding which is common to all clusters emerges from Table 7.1 is that irrespective of whether a pupils is the focus of the teacher’s attention individually, as part of a group or as part of a class, it is boys who in every case receive more attention than girls.
Table 7.2 % of teaching types in small & normal classes in P1 to P3 years Teacher types P1 classes P2 classes P3 classes
small normal small normal small Normal Individual and pair sustained enquirers
31 21 41 15 17 54
Group task monitors 21 6 14 15 31 5 Whole class instructors 23 60 23 23 34 28 Whole class questioners 25 13 23 46 17 5 Number of teachers 181 48 44 13 70 39 7.8 It is also possible to investigate the links between specific subjects and
teaching types. This is done in Table 7.3. Here because of small numbers it is not possible to conduct the analysis across the three year groups so the results are an aggregate of P1, P2 and P3. For normal classes whole class instruction is a favoured teaching approach used across all subjects although for English individual instruction and pair work also form strong elements of typical practice. In small classes, however, there is more variation. In Chinese there is evidence of the increasing use of group work and in mathematics a switch to individual and pair work with an emphasis on challenging questions rather than factual statements. English shows some change although individual enquirers and class instructors appear to remain the dominant teaching approach. These findings support the comments based on the consultant’s school visits in the first two years of the study, where it was suggested that English teaching, in particular, had tended to regress in the use of whole class instruction. Both Tables 7.2 and 7.3 suggest a willingness among practitioners to experiment in the use of different teaching methods when faced with a smaller class. Further analysis shows a shift away from group task monitoring towards more challenging individual and pair work among teachers with the greatest experience of SCT during the three years in which observations were made.

22
Table 7.3 % of teaching types in the three core subjects Teacher types Chinese English Mathematics
small normal small normal small Normal Individual and pair sustained enquirers
20 28 29 42 37 24
Group task monitors 27 10 12 0 25 11 Whole class instructors 26 48 35 40 18 40 Whole class questioners 27 14 24 18 20 25 Number of teachers 94 29 101 38 96 37 7.9 A similar analysis can be carried out with the pupil observations. Again four
substantial clusters emerged. Because of the large number of categories only those discriminating between the clusters which help to identify the pupil types are shown in Table 7.4. They bear a remarkable similarity to pupils in English primary classrooms who were first identified in the ORACLE (Observational Learning and Classroom Learning Evaluation) study and subsequently replicated in a repeat of the original research two decades later (Galton et al. 1980, 1999). Type I were described as solitary workers because they are on task for almost the entire lesson even when the teacher is engaged with other pupils elsewhere in the classroom. Although they sit in groups for nearly 70% of the time they work on their own. Their contact with the teacher mainly involves being part of his/her audience when nobody in the class is in focus. Such pupils were first identified by McClelland (1963) in North American science classes and were described at the time as ‘undeflected workers’. McClelland likened these students to human cannonballs because they remained on course, despite the vagaries of the teaching. In the SCT study they form 43.8% of the observed sample.
7.10 Type 2 pupils (22.4% of the sample) were labelled intermittent workers in the
ORACLE study. These pupils have the highest levels of distraction. There is a slight emphasis on sitting in pairs and the data suggests that while these pupil work when the teacher is present they can easily be distracted when the teacher is either elsewhere, monitoring class activity or when these pupils are part of the teacher’s audience when sitting as a class at the front of the room.
Table 7.4 Characteristics of the four pupil types
Observation categories Mean % of all observations Effect
size Type 1 (N=690)
Type 2 (N=353)
Type 3 (N=368)
Type 4 (N=165)
Target pupil activity Target’s behaviour On-task 94.49 73.37 90.24 65.45 L Distracted/partially distracted 5.07 23.23 8.10 19.39 M

23
Observation categories Mean % of all observations Effect size Type 1
(N=690) Type 2
(N=353) Type 3
(N=368) Type 4
(N=165) Target pupil’s location In base 99.31 98.44 97.76 78.48 L Out of base 0.40 0.99 1.77 19.09 L Teacher’s activity Elsewhere in the classroom 66.59 45.54 69.84 60.91 S Monitoring 2.72 22.80 6.66 6.52 M Seating Alone 0.15 24.72 5.77 6.82 L Pair 0.15 24.72 5.77 6.82 S Group 69.35 45.05 73.03 60.76 S At front of class 17.14 8.92 4.01 20.91 S Mode of working Individual 59.24 60.34 15.29 40.61 L Pair 2.39 2.90 21.81 6.21 M Group 16.27 5.45 52.38 30.76 L Class 22.10 31.23 10.53 22.42 S Target pupil-adult activity Target’s role Seeks interaction with adult 0.98 1.84 1.49 10.61 M Part of teacher audience 71.38 72.59 21.67 46.36 L Content Task work/supervision 71.59 72.31 26.09 41.21 L Feedback on work: praise 1.09 0.92 1.36 7.27 M Setting T gives individual attention 0.00 2.27 1.49 4.55 S T interacts with whole class 65.80 61.40 13.25 39.39 L Target-peer activity Target’s role Target initiates contact 4.57 3.68 25.53 9.24 L Target responds to contact 7.14 4.32 33.45 14.39 S Target sustains interaction 0.00 0.00 2.92 5.45 M Mode of contact Speaking-listening 7.97 5.67 43.86 18.94 L Task2 Same 12.32 7.22 62.50 25.45 L Different 0.04 1.27 0.75 5.78 M
Effect size: S=small; M=medium & L=large where 0.2<S <0.5 <M<0.8 <L (Cohen 1988) 7.11 The third type of pupils was called active collaborators in the ORACLE study.
They make up 23.4% of the observed Hong Kong sample and are working on their task for over 90% of the lesson, even when the teacher is engaged elsewhere in the classroom. They generally sit and work in groups where they both initiate and respond to other pupils working on the same task. In many
2 Task here refers only to situations where the target pupil is interacting with either one or more peers. The totals do not add up to 100% since such interactions are only a proportion of the target’s behaviour.

24
ways these pupils are similar to the solitary workers, the main difference being that they tend to operate in collaborative settings rather than on their own. Finally the fourth type of pupil, originally labelled attention seekers, in the ORACLE study are perhaps more aptly described as attention grabbers because they not only seek but also more often succeed in obtaining the teacher’s undivided attention. They have the lowest levels of on-task behaviour and tend to be frequently out of their base area, either because they are required to sit at the front of the class or they are perhaps seeking assistance or, more likely, given the relatively high levels of distraction chatting to another group. Such conversations tend to be sustained. These pupils more often attempt to seek the teacher’s presence or else succeed in gaining his/her attention. We might hypothesise that some of these pupils are perhaps in need of reassurance since the teacher’s feedback often consists of praise. These attention grabbers form 10.5% of the sample.
7.12 There are no significant ability variations across the four types of pupil and
neither do the proportions vary between the three subject domains. There are however gender differences. Of the 690 solitary workers 378 or 54.8% were girls whereas among the attention grabbers 98 of the 165 of this type of pupil (59.4%) were boys. Table 7.5 looks at the distribution of the various pupil types between small and normal classes and between year groups.
Table 7.5 % of pupil types broken down by class size and year group
Solitary workers
Intermittent workers
Active collaborators
Attention grabbers
N
Class Small 43.2 21.2 25.2** 10.4 1177 Normal 45.4 25.8 18.0 10.8 399 Year P1 44.0 24.6 20.2 11.2 913 P2 41.9 20.7 23.3 14.1 227 P3 44.3 18.6 30.0** 7.1* 436
** = P< 0.01: * = p<0.05 (small effect size) 7.13 The main difference between the small and normal classes lies in the increase
in number of active collaborators in the former. As pupils move from P1 to P3 the percentage of this type of pupil also increases (significant at the 1% level) while the number of attention grabbers decreases (significant at the 5% level). Most of the changes occur in P3. When the percentages in the P3 year are broken down by class size it emerges that the increase in active collaborators arises from a decrease in both the intermittent workers (down from 28.2% to 13.2%) and the attention grabbers (down from 11.5% to 4.6%). These are the groups with the highest levels of off task behaviour. In both cases the level of significance reaches 1% and result in medium effect sizes.
7.14 It is also possible to examine the relationship between teaching and pupil types
and this is shown in Table 7.6. Only the profile of the whole class instructors differs from the overall distribution giving rise to a small effect size at the 1% significance level. The fact that these class instructors have a higher

25
proportion of pupils ‘on task’ may, however, be no guarantee that it necessarily results in increased understanding, since when the teacher is addressing the class and these pupils are listening there may some who are uncomprehending. The fact that, overall, pupil classification appears independent of teaching approach (at least in terms of this typology) suggests that the different pattern of behaviour exhibited by certain pupils may partly be a function of their personality. It might, for example, be that the attention grabbers consist mainly of pupils who are shy, anxious introverts who need to seek constant reassurance.
Table 7.6 Variation of % of pupil profiles by teacher types
Pupil Type Teacher type N
Individual and pair sustained enquirers
Group task
monitors
Whole class
instructors
Whole class
questioners
Solitary workers 36 42 53** 42 690
Intermittent workers 25 19 21 22 353
Active Collaborators 26 32 17 23 368
Attention Grabbers 13 7 9 12 165
Total Percentage 100 100 100 100 1576
N 528 240 498 310 ** =p<0.01 (small size effect)
7.15 It is also possible to examine the relative effectiveness of the different
teaching approaches in small classes as they manifest themselves in the descriptions of the various teacher types. This possible for P1 and P2 classes in each of the subjects since only Cohort 1 were in small classes in P3 and numbers of teachers in the various cells then becomes impossibly small. For each analysis the scores of the pupils (both attitudes and attainment) were converted to percentages, ranked and divided into four quartiles. For each teacher type the top, bottom and combined middle range percentages were then aggregated.
7.16 At P1 none of the four teacher types’ pupils make significantly more progress
in attainment in all the three subjects but there are some differences in respect of attitudes. When Chinese ‘learning disposition’ scores (combined attitude and motivation) were analysed then pupils in the top third range who were taught by type 1 teachers (individual and pair enquirers) had significantly higher scores (p<0.05; large effect size). In English, however there were no significant differences for either attainment or attitude but in mathematics it was the type 4 teachers (whole class questionnaires) whose pupils in the top third range exhibited the strongest mathematics learning disposition.

26
7.17 At P2 there were no differences either in Chinese attitudes or attainment but in English, the pupils of whole class questioners (type 4) who were in the top third range did best overall in attitudes and attainment (p<0.01; large effect size). Interestingly among the English small classes in P2 there were no type 2 (group task monitors) teachers. In mathematics at P2 there were neither attitude nor attainment difference across all four teacher types. A similar analysis could not be conducted for P3 since only Cohort 1 classes were small ones and numbers did not allow an extended analysis of this kind.
7.18 The reason for so few significant effects probably lies in the small numbers of
classes involved. There were 69 P1 and 41 P2 teachers of small classes. By the time these were sub-divided between three subjects and four teacher types the range of pupils in any combination of category (subject x type) ranged from 1 to 10. In an effort to improve numbers in each cell the aggregated score in both attainment and learning disposition were also analysed. No differences in attainment emerged but the P2 pupils of Type 3 (whole class instructors) had the poorest learning disposition while those of the whole class questioners (type 4) had the best (p<0.05; large effect size).
7.19 In summary, the main conclusion to emerge from this analysis is that while in
normal classes most teachers stuck to the whole class instructor mode, within the small classes there continued to be a degree of experimentation across the remaining three approaches. This in part may account for the inconsistency in the attitudes and attainment differences since teachers had not yet decided in their own minds which activities were suited to the use of a particular approach. In the use of group work, for example there was still a high proportion of disengaged pupils, a fact confirmed by the observations of the consultant on his school visits. Looking at ways of devising group tasks so that more pupils participated for a greater part of the time was clearly an issue which teachers were still having to grapple with.
8. Impact of small classes on the Territory-wide System Assessment (TSA) 8.1 By the 2006/07 school year pupils from Cohort 1 had been in small classes for
three consecutive years. This provided an opportunity to make further comparison on the impact of SCT using the TSA measures which pupils complete during their P3 year. Two kinds of comparison are possible. The first of these investigate the proportion of pupils that achieve a level of basic competence in Chinese, English and mathematics. The second comparison uses the mean scores on the sub-tests measuring various TSA skills. Some of these comparisons can be problematic in that for certain skills, particularly those involving speaking and listening a ‘light sampling’ approach is used so that not all of the pupils in a school’s P3 year group will take a particular test. This introduces the possibility of random sampling errors.
8.2 For the analysis three groups were used. The first of these consisted of the 37
‘experimental’ schools taking part in the SCT study. The second group comprised of the 15 reference schools and the third group were matched against the characteristics of the ‘experimental’ schools. In each case the 2004 TSA score of a school with similar population characteristics was matched

27
with an experimental school to give 37 pairs. The 2006 TSA scores also provided further background data on which to evaluate the performance of the three groups of school on the 2007 assessment. Figure 8.1 looks at the % achieving basic competence in mathematics in the 3 groups of schools over the period 2005-07, together with the overall result for all schools in the territory. In 2005 the schools in the study had the lowest proportion of P3 pupils reaching basic competence (83.1%) compared to the average total across all schools in the territory (88.6). In the 2006 assessment, however, both the experimental schools and the matched sample had significantly improved their profile (1% level small effect size) with 89.4% and 89.2% of pupils reaching basic competence compared to 88.2% in all schools. For 2007, the first year P3 pupils were in small classes there was a slight regression although all three groups of schools achieved higher scores than the territory wide average. The experimental schools and the matched sample achieved similar results (88.1% and 88.9% respectively) against an average for all schools of 88.6%. On these figures, therefore, it would seem that the explanation for the improvement is likely to be the growing familiarity with the test itself rather than the size of the class. This would have made it possible for teachers to coach the pupils more effectively in 2006 and to maintain this improvement in 2007.
78808284868890
% reaching BCL
2005 2006 2007
Fig 8.1 TSA comparisons in mathematics
study schoolsreferance schoolsmatched schools all schools
8.3 The mathematics data was then analysed for a variety of different skills. This gave four scores each for number, measures, shape and space and data handling yielding 16 comparisons overall. In no case did the analysis yield a significant difference between the three school samples in any of the three years. As a final check residual gains for the experimental schools and the combined matched and reference schools were estimated using the 2005 scores to predict the 2006 and 2007 ones. These are shown in Table 8.1.
Table 8.1 Residual gains in mathematics basic competence using 2005 scores
to predict scores for 2006 & 2007
Sample 2006 2007 Mean s.d. N Mean s.d. N
Experimental schools 0.154 6.506 36 0.670 6.354 36 Matched + reference schools -0.098 6.518 57 -0.423 7.502 57 Total 0.000 6.479 93 0.000 7.064 93

28
8.4 Although the trend is for the smaller classes to have positive residuals
compared to the control schools this is partly due to the higher base achieved by the reference schools in 2005. None of the differences are statistically significant (below the 5% level) and result in negligible effect sizes (0.04 in 2006 and 0.14 in 2007). This comes about because the standard deviations are comparatively large indicating that there is a wide variation across schools within the experimental and control groups.
8.5 Figure 8.2 repeats the above analysis for Chinese. The overall pattern is
similar to that in mathematics, in that the major improvements take place in 2006. However in this case the matched schools make significantly more progress than those in the SCT study (1% level; small effect size) but this difference is not maintained in 2007 when SCT pupils were in small classes. Table 8.2 shows the residual gains for the Chinese results.
80
82
84
86
88
% reaching BCL
2005 2006 2007
Fig 8.2 TSA comparisons in Chinese
study schoolsreferance schoolsmatched schools all schools
The mean residual change scores tell a similar story. The improvements in 2006 yield a small size effect (0.20) in favour of the control schools (matched + reference combined) but the difference just fails to reach statistical significance. With the 2007 figures the gap has been reduced, although the experimental schools still produce a negative mean gain indicating that they do less well than the 2005 scores would predict. Again, the magnitude of the standard error indicates that there is considerable variation between schools in both groups of schools (experimental and controls).
Table 8.2 Residual gains in Chinese basic competence using 2005 scores to predict scores for 2006 & 2007
Sample 2006 2007
Mean s.d. N Mean s.d. N Experimental schools -0.691 6.863 36 -0.267 7.505 36 Matched + reference schools 0.436 5.741 57 0.169 7.502 57 Total 0.000 6.188 93 0.000 7.064 93
When the scores on the skills sub tests are examined there were no significant differences in listening, reading, writing, group speaking or the first of the two tests which assessed the pupils’ ability to interpret audio-visual information. But for individual speaking the 2007 mean for the experimental schools was

29
significantly below that of both the reference and matched schools (5% level) yielding a medium effect size (Mean = 14.76 experimental schools; 15.44 controls). For the second audio-visual information test there was a significant interaction effect between the experimental and the matched schools (5% level). The matched schools did better in the 2006 round of testing (Mean = 6.44 for matched sample; mean = 6.18 for experimental schools) but by 2007 the position was reversed (Mean = 11.09 for experimental schools; mean =10.70 for matched sample). Because these measures use ‘light sampling’ to test a proportion of the class such differences, which in any case are comparatively small, should therefore be treated with caution.
8.6 The final set of TSA comparisons is for English and these results are displayed in Figure 8.3. Although the pattern is similar to that of the other two subjects, in that the major improvement takes place in the 2006 year, there is more variation in the proportion of pupils reaching basic competence initially. In the experimental schools only 72.7% of pupils in the matched sample of schools attained basic competence set against the territory wide average score of 79%. In the experimental schools the corresponding figure was 74.5%.
70727476788082
% reaching BCL
2005 2006 2007
Fig 8.3 TSA comparisons in English
study schoolsreferance schoolsmatched schools all schools
By 2006, however, the matched sample had caught up with the experimental schools (76.1% and 76.8% respectively) and by 2007 had moved slightly ahead (78% against 76.6%) and in doing so had nearly closed the gap with the reference school sample (78.7%). These differences, however are not statistically significant, a result which is confirmed in Table 8.3 where the residual gains are presented. In neither case do the residual gains difference for 2006 or 2007 between the experimental schools and their controls reach significance although in both cases the study schools do less well than predicted by their 2005 basic competence levels. The standard deviations again indicate considerable variation across schools. In none of the skill sub-tests (listening, reading, writing, reading aloud or describing a picture) do significant differences emerge.
Table 8.3 Residual gains in English basic competence using 2005 scores to
predict scores for 2006 & 2007
Sample 2006 2007 Mean s.d. N Mean s.d. N
Experimental schools -0.594 10.45 36 -0.734 10.25 36 Matched + reference schools 0.375 10.80 57 0.464 9.752 57 Total 0.000 10.64 93 0.000 9.910 93

30
8.7 In summary, therefore, being in a small class for three years appears to have no significant effect on basic competence levels. There would appear to be two factors contributing to this result. The first of these concerns the improvements in 2006 which can probably be attributed to the fact that teachers were able to prepare pupils more effectively as a result of the knowledge and experience gained from the 2005 administration. The second (and more salient factor) was the wide variation in individual school scores within both the experimental sample and the control groups. As a consequence the within group variations considerably exceeded any between group variance. This result merely replicates previous comparisons where for measures of either attitudes or attainment the difference between schools was a stronger indicator of pupil progress than class size. It would seem important therefore to look at ways in which schools in the SCT study sample varied in an attempt to identify those characteristics which contributed to their success.
9. Factors contributing to school success 9.1 Throughout the course of the study small classes in some schools have done
better than others, although from year to year the most successful and weakest schools have not always been the same. This suggests that an even bigger factor in pupil progress arises from the combination of the teacher (some are more effective) than others and the mix of pupils in the class (their prior attainment, home background, etc). Nevertheless school effects in the small classes do have some influence and it therefore seems worthwhile to identify the variables which appear to correlate with a school’s success. Accordingly, an aggregated score based on attainment means in the three core subjects and a combination of attitudes and motivation scores was constructed for each school using the data from the small classes. This yielded six ‘very successful’ or ‘high achieving’ and four ‘very weak’ or ‘low achieving’ schools.
9.2 The data from the Principals’ questionnaire were presented previously.
There, a distinction emerged between those school leaders who saw their role as establishing goals and expectations and providing necessary resources but then delegating responsibility for teaching and the curriculum to middle managers and those who took a more active part in promoting and participating in curriculum development and the teachers’ professional learning. A recent meta analysis of leadership dimensions (Robinson 2007) has also identified these three factors along with two others (regular evaluation of the curriculum and teaching, and an orderly and supportive environment) as having the greatest effect on student outcomes. But of the five leadership dimensions the greatest effect was when school leaders actively participated in curriculum development, undertook visits to the classroom and engaged in formal and informal professional development sessions. This produced a large effect size (0.84) compared to the other four dimensions where the range varied from 0.27 (orderly and supportive environment) to 0.42 (regular evaluations).
9.3 The corresponding scale to Robinson’s (2007) strongest leadership dimension,
active participation in curriculum and teacher learning development, was labelled in the SCT study curriculum development leadership. Besides the

31
active participation of the school Principal this included the provision of various kinds of support for the staff members’ professional development (mainly through inter- and intra-school sharing and the availability of specialist help from outside agencies) and the creation of a collegial culture. Table 9.1 examines the mean scores on this scale for Principals from the six high and four low achieving schools.
Table 9.1 Principals rating as an Active Curriculum Development Leader
School Mean s.d. N
High Achieving 4.67* 0.52 6 Low Achieving 4.00 0.01 4
* = p<0.05 large effect size 9.4 It can be seen that the Principals of the high achieving schools rated this kind
of leadership more highly. Another factor which also correlated with being a successful school was the Principal’s experience. In the more successful schools Principals had been in post for, on average, 11 years and 10 months compared to colleagues in the less successful schools where the average was six years. Principals in more successful schools were also more concerned about the effects of large classes on effective links with parents, presumably because they saw such liaison as important. Finally, a further scale emerged concerning the Principal’s beliefs about the perceived benefits of smaller classes. This included improvements in pedagogy, ability to deal with the needs of the less able pupils, better relationships between teachers and their classes and improved teamwork among staff. High scores on the scale indicated that the Principal held strong beliefs about the positive impact of small classes. This scale consisted of 33 items and had an internal consistency (Cronbach alpha) of 0.91. In the event, however, only 27 Principals supplied a full set of responses, four of these being among the six most successful schools. The two remaining successful schools were among the top quartile with a mean greater than 4.0 on the 5 point scale. Of the four least successful schools, two were in the bottom quartile with a mean rating below 3.87 while the other two both had mean ratings of 3.97. Although the latter trend is not as clear cut as in Table 9.1 there is some support for the view that a strong conviction about the value of small classes, length of experience in post and, in particular, active involvement in the schools’ curriculum development (including the development of teaching and learning strategies) all contributed to successful implementation of SCT.
9.5 A further factor which appeared to differentiate between successful and
unsuccessful schools was the additional support that teachers received in the form of help from a classroom assistant. The comparison is shown in Table 9.2. While the vast majority of teachers received no help, 24 of the 148 teachers in the successful schools (16.2%) had the services of a teaching assistant for varying periods each week compared to 13.0% in less successful schools. However, when these figures were investigated further, 20 of the 24 of these classroom practitioners were teachers of English. The likely inference, therefore, is that these high achieving schools belonged to the Primary Literacy Programme where classroom assistance was made available and the

32
extra help provided in the more successful schools was not due to additional support by the Principal for SCT.
Table 9.2 Availability of teaching assistants (TAs)
Periods with a TA
each week High Achieving
schools Low Achieving
schools Total number of
teachers 0 124 40 164 1 2 2 4 2 18 1 19 3 0 2 3 4 2 1 3 6 1 0 1 12 1 0 1 148* 46 194
* = p<0.05 small effect size
9.6 When teacher variables are examined there were no differences in
qualifications or in the average length of teaching experience between the most and least successful schools. Some of the teachers in the extreme successful and unsuccessful schools were also part of the observation sample and were therefore classified into the various teacher types described in section 7 of this report. Table 9.3 shows the breakdown of the various teaching types. Although the trend is for the more successful schools to have a greater proportion of individual and pair sustained enquirers and the less successful ones to have more group task monitors these differences are not statistically significant. Overall, the combined profile in the most successful and least successful schools does not differ appreciably from that in Table 7.1 where the total sample of all the teachers who participated in the observation study is presented. Here, in the schools at the extreme ends of the attainment range, 33 of the 110 teachers (30%) are individual and pair sustained enquirers compared to 30.1% in the whole sample and 22 (20%) are group task monitors (18.2% in the whole sample). Successful and unsuccessful schools have a smaller proportion of whole class instructors (26.4 % as against 30.1% overall) and therefore slightly more whole class questioners (23.6% as against 21.3%) but none of these differences reach significance level.
Table 9.3 % of teaching types in high and low achieving schools
Teacher types High achieving schools
Low achieving schools
Total sample
N % N % N % Individual and pair sustained enquirers
26 36.1 7 18.4 119 30.1
Group task monitors 11 15.3 11 29.0 73 18.5 Whole class instructors 20 27.8 9 23.7 119 30.1 Whole class questioners 15 20.8 11 28.9 84 21.3 Total 72 100.0 38 100.0 395 100.0

33
9.7 A similar analysis can be conducted for pupils. This is shown in Table 9.4.
Comparing the overall totals with the proportion of pupils types across the whole sample (Table 7.6) it can be seen that there are more solitary workers (52.3% to 43.8%) and fewer attention grabbers or seekers (5.8% to 10.5%) and this comes about mainly because in the low attaining schools nearly three-quarters of pupils (71.9%) are of the solitary worker type compared to 42.6% in the high achieving schools. As a result, there are considerably more intermittent workers (high=28.4%; low=8.3%) and more active collaborators (high=22.3%; low=15.6%) in the high achieving schools, although the figure for the active collaborators is not statistically significant. This result would appear counter-intuitive as both theory and empirical research (Carroll, 1963, Block, 1971, Harnischfeger & Wiley, 1978) predict that time on task is one of the major determinants of learning. One possible explanation is that the solitary worker category masks two different kinds of pupils. From the profiles in Table 7.4 solitary workers are more often working on the own when seated in a group (69.35%) or seated in front of the class listening to the teacher (17.14%). In the latter case pupils while attending to the teacher’s words may not understand what is being said and it may be that a higher proportion of this kind of solitary worker exists among the classes in the low achieving schools. This would contrast with pupils who while actively engaged when working alone were able to complete the task and gain increased understanding as a result. Alternatively, it may be that the major factor in determining pupil progress lie outside the classroom behaviour in factors such as teacher competence, home background, parental support and so forth. This would explain why the more successful schools appear to be able to tolerate a higher proportion of pupils with a poorer work ethic, the intermittent workers.
Table 9.4 % of pupil types in high and low achieving schools
Pupil types High achieving schools
Low achieving schools
Total
N % N % N % Solitary workers 84 42.6 69 71.9 153 52.2 Intermittent workers 56 28.4 8 8.3 64 21.9 Active collaborators 44 22.3 15 15.6 59 20.1 Attention grabbers 13 6.7 4 4.2 17 5.8 197 100.0 96 100.0 293 100.0
9.8 There is some support for the latter view in that there is a significant
difference between the high and low achieving schools in the proportion of children born in Mainland China. In Cohort 1, two-thirds of pupils (66.1%) attending low achieving schools were born in Hong Kong, whereas the corresponding figure for the most successful schools was 86.4%. In Cohort 2 the corresponding figures were 65.2% and 85.5% respectively. Across all schools taking part in the SCT study the percentage of children born outside Hong Kong was just under 20%. These differences are statistically significant (1% level) and give rise to a small effect size. It follows from the earlier analyses that place of birth is closely linked with social economic factors and

34
also with the degree of support that parents give to their children in their studies after school. In the first year of the study a parental support index was constructed which included such information as educational level achieved by both parents, family income, home resources available for learning (space, computer use, internet availability etc.) library use and frequency of outside educational visits. Table 9.5 displays the results for both Cohort 1 and 2.
Table 9.5 Parental support in high and low achieving schools
School Cohort 1 Cohort 2 Parental
support index mean
s.d. N Parental support index
mean
s.d. N
High achieving
28.35** 5.33 647 25.59** 4.74 611
Low achieving
24.45 5.82 168 22.16 4.16 113
** = p<0.01 (medium effect size) For both cohorts parental support is significantly greater in the high achieving schools (1% level). Furthermore, pupils entering the high achieving schools are more likely to have experienced kindergarten education. In the more successful schools 99% of pupils had attended kindergarten compared to 80% in the least successful schools.
9.9 The final part of the analysis in this section concerns the relationship between
the teachers’ main specialism and the subject that they were teaching in the small classes. In all schools across three years (P1 to P3) the trend is for just over a third of teachers who were trained in Chinese to find themselves mainly teaching mathematics (34.6%). Given the research evidence pointing to the strong links between a teacher’s subject expertise and pupil attainment, it is therefore somewhat surprising that 39.9% of teachers trained in mathematics end up mainly teaching either Chinese or English. In the more successful schools however the trend is not so marked and only 26% of Chinese trained teachers are required to teach mathematics, although 39% of mathematics trained teachers mainly teach the other two subjects (viz. Chinese and English). In the group of less successful schools, however, 50% of Chinese trained teachers teach mathematics while 42.8 % of mathematics teachers teach either Chinese or English (although these percentages are based on low numbers). Overall, these differences are significant (5% level) and yield a small effect size. Returning to the puzzling features of Table 9.4 these poorly qualified mathematics teachers may be able to sustain effective control and hence have a high proportion of the pupils on task (i.e. more solitary and fewer intermittent workers) but their lack of subject knowledge may result in pupils failing to gain sufficient understanding.
9.10 In summary, therefore the more successful schools tend to have more
experienced Principals who have stronger expectations as to the possibilities of SCT seeing it, in particular, as a means for promoting improved attainment and motivation, for coping with pupil diversity and for fostering better relationships between teachers and pupils. This, in turn, leads to these
35
principals taking a more active role in curriculum development and in the professional development activities concerned with improving the effectiveness of SCT. They are more likely to deploy resources in school to provide additional non contact time for teachers to participate in intra- and inter-school activities. Whether by reputation or location these successful schools attract more Hong Kong born children which results in higher attendance at kindergarten and greater parental participation in school activities coupled with a higher level of support for these pupils outside school, whether it involves completing homework, undertaking educational visits or borrowing books from the library. These schools also succeed in attracting more specialist mathematics teachers and therefore have fewer teachers with a mainly Chinese initial training qualification teaching the subject. The above factors combined seem to exert a greater influence on a school’s performance than do the other variables considered such as class size and teaching approach. Although there is a trend indicating that in the classes of the more successful schools there are more sustained cognitively challenging interactions between the teachers and individual pupils and a preference for working in pairs rather than groups, these differences fail to reach statistical significance. The least successful schools, in fact, succeed in having more pupils ‘on task’ but this engagement doesn’t appear to be matched by equivalent levels of knowledge and understanding.
10. Relative performance of schools with high proportions of disadvantaged
pupils 10.1 Within the SCT study there were 5 schools with a high proportion of
disadvantaged students. These schools tended to have a higher proportion of children born in Mainland China and as such fewer children who attended kindergarten and lower average scores on the index of parental support. In this section the hypothesis, often present in the literature (Finn & Achilles, 1999) that such children benefit more from placement in a small class is examined. Cohort 1 spent 3 years in small classes so it is possible to examine the trends in P1, P2 and P3 classes. Cohort 2 looks at the trends in P1 and P2 by way of replication.
10.2 Table 10.1 examines the differences in attainment for Cohort 1 over the 3 year
period when they were in small classes. At the beginning of P1 there were no differences between the disadvantaged schools and the rest of the experimental schools (standard populations) in Chinese and mathematics but in English the pupils with disadvantaged backgrounds were significantly behind (1% level) although the effect size is small. This disadvantage was maintained in each year up to the end of P3. In Chinese and mathematics, pupils from disadvantaged backgrounds maintained parity with the rest of the experimental sample until the end of P2. However, by the end of P3 there was tentative evidence that the deficit shown in English had begun to spread to the other subjects since the differences in both Chinese and mathematics are significant at the 5% level although, again, the effect size is very small. Confirmation of this trend is provided by the residual gains using the total scores on all three

36
subjects. In P1 the residual gain for the disadvantaged schools is -1.80 against +0.21 for the remaining schools in the sample (5% significance level, although with a very small effect size). From the end of P1 to the end of P2 the corresponding figures are -0.43 and +0.05 which is not a statistically significant difference. But in the following year to the end of P3 the difference is again significant at the 5% level. (-1.01 compared to +0.15 but with a very small effect size). In the P1 year there are no gender effects but by the end of P2 girls’ performance in English in the disadvantaged schools had deteriorated to the extent that the deficiency now has a medium effect size. In P3, girls performance in Chinese in the disadvantaged schools was significantly below that of girls in the normal schools (1% significance, small effect size) while boys in the two types of schools scored similarly. In P4 the deficiency of the disadvantaged schools in English persisted, and as predicted from P3 mathematics scores, the disadvantaged schools had now fallen behind significantly. Both boys and girls showed similar trends in mathematics but although effect sizes were small, they were higher for the girls implying a sharper difference. The trend in Chinese evident in P3 has been reversed and scores in the two types of school are similar. Whether this has any connection with the return to normal classes is hypothetical.
Table 10.1 Cohort 1 comparison in attainment of ‘standard’ and ‘disadvantaged’ schools
Period of test
Type of school
Chinese English Mathematics Mean s.d. N Mean s.d. N Mean s.d. N
Start of P1
Standard 23.77 7.43 3417 21.70** 8.45 3417 20.35 7.22 3417 Disadvantaged 23.48 7.92 405 20.30 8.18 405 20.65 6.80 405
End of P1
Standard 36.43 19.00 3385 52.73** 22.39 3385 43.69 24.62 3403 Disadvantaged 34.69 19.97 414 47.08 22.16 417 41.70 25.84 417
End of P2
Standard 51.41 18.20 3406 58.29** 23.81 3420 53.51 20.68 3407 Disadvantaged 52.12 19.94 483 48.67 23.23 479 52.66 20.04 485
End of P3
Standard 47.98˚ 18.39 3259 34.05** 22.09 3245 59.79˚ 21.47 3255 Disadvantaged 45.85 18.83 470 27.17 19.50 473 57.42 22.85 474
End of P4
Standard 51.31 17.18 3147 40.83** 22.74 3161 51.29** 21.17 3150 Disadvantaged 51.88 17.26 454 33.16 20.11 456 47.37 21.25 458
**p<0.01; *p<0.05 small effect sizes ˚p<0.05 very small (negligible effect size)
10.3 Cohort 2 was taught in small classes up to the end of the P2 year. This allows
a partial replication of the results for Cohort 1 and the results are presented in Table 10.2. As with Cohort 1 the disadvantaged schools had a higher proportion of mainland born children with all the attendant consequences. However in the P1 year, although the trend in English replicates the finding from Cohort 1, the pupils from disadvantaged backgrounds out-perform their peers in the remaining experimental schools on the end of year tests in both Chinese and mathematics. Although the mean in Chinese for disadvantaged pupils on entry is the same as that of their peers in the remaining experimental schools at the end of P1 the former have gained a small advantage (p<0.01 but very small effect size). In mathematics the pre-test mean of the disadvantaged pupils is below that in the other experimental schools but by the end of P1

37
there is a significant gain (5% level) in favour of the disadvantaged schools although the effect size is again very small. This is confirmed when the residual gains for the combined scores are calculated. That for the disadvantaged schools is +2.07 against a value of -0.27 for the remaining schools in the SCT study sample (statistically significant at the 1% level but small effect size). This difference comes about because boys in the disadvantaged schools do exceptionally well.
10.4 By the end of P2, however, these advantages have disappeared. There are no
significant differences between the two groups of schools in Chinese and mathematics while in English the poor performance of the disadvantaged pupils relative to their peers in the remaining schools continues. When the combined scores are calculated the mean residual gain for the disadvantaged schools is now -1.61 against a value of +0.232 for the remaining schools. This change mainly comes about because of the deterioration of the girls’ performance, thus replicating the pattern that emerged with Cohort 1. The passage through P3 for Cohort 2 reflects the findings with Cohort 1 for Chinese and English, but having returned to normal classes the disadvantaged schools mathematics scores fell significantly below those of the normal schools. It should be noted that the same effect occurred with Cohort 1 in P4, again when classes returned to normal. However, the dip in both cohorts in the disadvantaged schools on returning to regular classes was larger than for the other SCT schools. The inference can therefore be made that without spending this time in small classes the gap between the disadvantaged schools and the rest would have been even bigger. From this it may be concluded that smaller classes enhance the mathematics performance in schools with high proportions of disadvantaged pupils. The effect is more noticeable with girls although it is also present with boys to a lesser degree.
Table 10.2 Cohort 2 comparison in attainment of ‘standard’ and ‘disadvantaged’ schools
Period of test
Type of school
Chinese English Mathematics Mean s.d. N Mean s.d. N Mean s.d. N
Start of P1
Standard 64.75 25.84 2836 53.66** 27.51 2836 56.25 22.22 2836 Disadvantaged 64.74 25.84 375 48.50 26.37 375 54.58 20.99 375
End of P1
Standard 37.99 19.91 2829 52.36** 23.43 2822 44.64 24.57 2813 Disadvantaged 40.22˚ 20.27 368 48.16 22.55 388 47.49˚ 23.67 388
End of P2
Standard 52.21 19.39 2672 53.83** 24.11 2654 54.18 21.72 2665 Disadvantaged 53.45 21.16 376 48.67 22.87 374 54.40 22.48 379
End of P3
Standard 49.17 18.75 2895 34.65** 22.62 2902 60.66** 21.82 2871 Disadvantaged 49.20 19.57 458 28.04 20.00 454 56.96 22.70 459
**p<0.01 small effect size ˚p<0.05 very small effect size
10.5 Thus over the two Cohorts pupils in the disadvantaged schools initially hold
their own or do slightly better than pupils in the remaining ‘standard’ schools in Chinese and mathematics by the end of the P1 year, although the effect sizes are very small. By the time pupils enter the P3 year however the advantage has moved towards the remaining experimental schools. In both

38
Cohorts the small classes in the disadvantaged schools favours boys rather than girls and it is mostly the deterioration in the latter group’s performance that reduced the advantages gained in P1. In English, however, pupils in the disadvantaged schools are handicapped on entry to primary school as their initial P1 scores are significantly below those of pupils in the remaining schools. The position worsens as these pupils move through P2 and P3. However, it can be reasonably argued that if these pupils from disadvantaged schools had remained in normal size classes then the deficit in English and perhaps also in Chinese and mathematics would have been even greater. This thesis can be tested by examining the differences in the control classes.
10.6 Examining differences within the control groups of all 37 experimental
schools does not allow the progress of the same pupils to be followed over three years. P2 pupils in the control classes were tested in 2004/05, moved to P3 in 2005/06 and P4 in 2006/07. P1 pupils in Cohort 3 were not tested until 2006/07 and moved to P2 in the 2007/08 school year but these pupils had a possible advantage in that some of the teachers had, by that point in time, considerable experience of small classes in the intervening years. Hence it is difficult to interpret result so only the P2, P3 and P4 comparisons are shown in Table 10.3.
Table 10.3 Comparison of P2, P3 & P4 attainment in ‘standard’ and
‘disadvantaged’ control groups
Period of test
Type of school
Chinese English Mathematics Mean s.d. N Mean s.d. N Mean s.d. N
Start of P2
Standard 54.50 20.02 3839 64.85* 21.36 3799 60.23 23.24 3829 Disadvantaged 52.40 20.23 437 58.84 19.31 443 59.94 22.57 439
End of P2
Standard 54.00* 18.21 3864 59.42** 23.44 3854 51.43˚ 20.56 3858 Disadvantaged 50.82 19.05 456 49.31 23.31 457 49.23 20.99 453
End of P3
Standard 46.42 17.01 3185 31.85** 21.07 3207 60.66 20.57 3262 Disadvantaged 45.23 17.24 424 26.32 19.32 427 58.45 20.40 428
End of P4
Standard 54.90 17.67 3487 41.58** 23.33 3480 52.30 21.12 3487 Disadvantaged 53.26 17.97 422 34.54 21.59 421 50.91 21.72 50.91
**p<0.01; *p<0.05 small effect sizes ˚p<0.05 very small effect size
By the end of the P2 year the disadvantaged schools all trail the other experimental schools. The difference for English is greatest (1% significance level); that for mathematics the smallest (5% level) although because of the large standard deviations the effect sizes are small. By the end of P3, however, the disadvantaged schools have caught up in Chinese, have almost done the same in mathematics but in English the position has continued to deteriorate. As with the previous comparison with small classes it is the relatively poor performance of girls, particularly, in mathematics that produces the results. Disadvantaged boys, match the overall performance of their peers in the remaining schools and the difference between their scores and those of the girls results in a large effect size. When the three scores are combined the

39
residual gain for the shift from P2 to P3 is +0.74 for the disadvantaged schools against -0.11 for the remaining schools with standard populations of pupils.
10.7 By the end of P4 while both boys and girls in the disadvantaged schools continue to score significantly below the remaining schools in English (1% level but small size effect) they maintain parity in both Chinese and mathematics, although in the latter subject girls in the disadvantaged schools again underachieve. Partly because of this factor and the poor English performance, when the residual gains from P3 to P4 are calculated using the combined scores on all three subjects, the value for the disadvantaged schools is negative (-0.83) against +0.11 for the remaining sample. Although this difference is statistically significant (5% level) it yields an extremely small effect size.
10.8 The data in Table 10.3 offers an interesting contrast to the earlier comparison
involving smaller classes. Apart from English where the performance in the disadvantaged schools continues to deteriorate more sharply in every year irrespective of class size, the pattern appears to be asymmetrical. In normal size classes the disadvantaged schools start with a deficit in P2 which is presumably carried over from P1 and at the end of the year this gap in performance has been enhanced. But by the end of the P3 year the difference has been eliminated in Chinese for both genders and in mathematics for boys although not for girls. In P1, English again being the exception to the rule, small classes appear to give disadvantaged schools a better start which is maintained into P2 but then falls away in P3. This effect can be seen by examining the year-to-year residual gain scores. In Cohort 1 the P2 residual gain (using the aggregated score across the three subjects) for the small class sample was -0.43 for the disadvantaged schools and +0.05 for the remainder. In the sample of normal size classes the corresponding figures are -2.71 and +0.31 respectively. But by the end of P3 whereas the values in the small classes were -1.01 and +0.15 those in the normal ones were in favour of the disadvantaged schools with values +0.74 and -0.11 respectively. Thus on the basis of this analysis smaller classes do allow pupils in disadvantaged schools to catch up in P1, provided the initial attainment of pupils in these schools is not too far behind as it tends to be in English. But any advantage gained has been lost by the end of P3 where as the earlier analysis of the TSA scores also suggested differences between small and normal size classes become relatively insignificant.
10.9 A similar analysis can be carried out using the attitude and motivation
measures. In Cohort 1 these were first measured at the end of the P1 year. Figure 10.1 shows the comparisons between the remaining 32 schools with standard population distributions and the disadvantaged schools. While the motivation and self esteem of pupils in the disadvantaged schools was significantly lower at the end of P1 (1% level very small effect size) the difference had largely disappeared by the end of P2 and this was also true of P3 (although the scale used in Figure 10.1 tends to magnify small differences). Girls’ motivation and self esteem declined more sharply than did that of the boys. With subject attitudes only English at the end of P1 showed a significant difference (5% level). At the end of P2 and P3, however, both Chinese and

40
mathematics scores were significantly lower in the disadvantaged schools mainly due to a faster decline in boys’ dispositions. Effect sizes in all cases were very small. Combining all four measures into a single learning orientation score yielded a residual gain from P1 to P2 of -0.03 for the disadvantaged schools while that for the remaining schools in the SCT study sample is zero. Between P2 and P3 the corresponding figures were -1.0 (disadvantaged) and +0.16 (remainder) which although statistically significant at the 5% level only yields a very small effect size.
60
65
70
75
80
85
90
% max score
Mot (D) Mot (S) Chi (D) Chi (S) Eng (D) Eng (S) Math (D) Math (S)
Figure 10.1 Attitudes of Cohort 1 (disadvantaged (D) v standard (S) schools)
P1P2P3
10.10 For Cohort 2 data was collected from the beginning of the P1 year so that comparisons could be made through P1 and P2 while the pupils were in small classes. By the end of the P1 year English scores in the disadvantaged schools were higher, mainly due to the boys’ contributions. Boys had the lowest attitudes towards English at the start of P1 but had caught up by the end of the year. By the end of P2 the trend for English has been maintained but the attitudes to Chinese have become negative in disadvantaged schools mainly because the girls’ attitudes decreased faster than those of the boys. These differences were all significant at the 1% level although with small effect size coefficients in all cases. Examining the residuals using the combined learning orientation measure showed very little change overall. For the P1 year the value for the disadvantaged schools was -0.01 against zero for the remainder. For the change during the P2 year the corresponding figures were -0.02 and zero respectively. Thus taking the two cohorts together the smaller classes would appear to have a minimal effect on pupils’ motivation and self esteem or on the attitudes to the three core subjects. When gender differences are examined therefore the results lead to an interesting, if tentative conclusion. Although generally boys have poorer attitudes towards English, being in a small class in a disadvantaged school brings a slight improvement. In Chinese disadvantaged classes, although the attitudes of boys decline, those of the girls drop at a faster rate, which is again contrary to the usual trend. These attitude shifts coupled with the slight improvements in boys’ attainment suggest that small classes are benefiting these disadvantaged male pupils although in every case the effect sizes are small.

41
60
65
70
75
80
85
90
% max score
Mot (D) Mot (S) Chi (D) Chi (S) Eng (D) Eng (S) Math (D) Math (S)
Figure 10.2 Attitudes of Cohort 2 (disadvantaged (D) v standard (S) schools) start P1end P1end P2
11. Performance in small classes compared to Reference Schools
11.1 The reference classes (P1, P2 and P3) were first tested in September 2006. The date was chosen so that the initial measure, the P1 pre-test could match the timing of the administration for the second Cohort of P1 classes whose pre-test also took place in September. This however resulted in the pre-tests for both P2 and P3 (the end of P1 and P2 tests) being out of sequence with both cohorts in the SCT study, since these latter pupils took the post tests in the June of each year. For attitudes, this discrepancy has little impact since it can be demonstrated that there was almost no change in pupils’ disposition over the three month period, June till September. For attainment however the time interval can be more critical. For this reason the classes tested in 2006/07 have been followed during the 2007/08 school year when P1 moved to P2, P2 to P3 and so forth. This means that there are two values for the end of the year P1 test, three values for the end of the P2 test, two values for the end of P3 test and one for the end of the P4 year test. Where there are more than one set of test scores available, the data in one case will have been collected in September.
11.2 Three comparisons are therefore possible. The first is between the P1 classes of the reference schools and Cohort 2 to the point where the pupils reach the end of the P2 year. The second compares the move through P2 to the end of P3 but this time scores are available for both Cohort 1 and Cohort 2 of the experimental sample, although in P3 Cohort 2 have returned to normal size classes. Finally there is the comparison between the reference schools and Cohort 1 as the pupils move through P3 to P4. The results for the combined motivation and self-esteem and subject attitude measures for the first set of comparisons are set out in Figure 11.1. It can readily be seen that the patterns in each case were very similar; a slow decline from year to year. As in previous reports attitudes to English are the poorest and those of mathematics the strongest. None of the differences are statistically significant.

42
60
70
80
90
% max score
Mot(sct)
Mot(ref)
Chi(sct)
Chi(ref)
Eng(sct)
Eng(ref)
Math(sct)
Math(ref)
Figure 11.1 Attitude and motivation scores Cohort 2 v reference schools (P1 through P2)
start P1end P1end P2
11.3 There were however gender differences, albeit most with small or very small effect sizes. Girls had higher motivation scores in both the reference school and Cohort 2 classes and the same is true of Chinese. In the latter case, the sharpest falls took place over the course of the P1 year. In English girls have more positive attitudes to the subject but now the major change (both boys and girls) occurred during P2. As with previous comparisons mathematics had the strongest positive attitudes of all three subjects but, nonetheless, there was a steady decline over the two years. Here girls’ scores drop off more sharply than boys, particularly during the P2 year.
11.4 The pattern was very similar when the P2 reference classes, first tested in September 2006 were compared with a combined Cohort 1 and 2 small class sample having first ascertained that the scores in the two cohorts did not differ significantly. These results are shown in Figure 11.2. Across the various measures, the fact that pupils in the reference classes took the P2 pre-test (the end of P1 test) in September and not, as was the case for the small classes, in June means that the initial scores of the reference classes were a little below those in the combined experimental sample. The biggest difference was in English which actually reached the 1% (small effect size) significance level. By the end of P2 and again at the end of P3 the differences between the two samples were negligible. Girls again scored higher on the combined self esteem and motivation scale, in Chinese and English but not in mathematics. In the latter subject, the scores of boys from Cohort 1, who remained in small classes, were significantly higher (1% level) than either their peers in the reference classes or those in Cohort 2 who had returned to normal size classes, although the effect size was very small.

43
60
70
80
90
% max score
Mot(sct)
Mot(ref)
Chi(sct)
Chi(ref)
Eng(sct)
Eng(ref)
Math(sct)
Math(ref)
Figure 11.2 Attitude and motivation scores Cohort 1 & 2 v reference schools (P2 through P3)
end P1end P2end P3
11.5 The third comparison traces the P3 reference classes who took the end of P2 test in September 2006 as they move through P4. These classes are contrasted with small classes in Cohort 1 who also moved back to normal size classes in the 2007/08 school year. The results are shown in Figure 11.3. Apart from the fact that due to the later administration the P3 pre-test scores (end of P2 test) of the reference schools tend to be lower than those of their peers in Cohort 1 the overall pattern is very similar to that in the previous two figures. Girls maintain their superiority over boys in motivation and self esteem. In Chinese, although girls outscored boys, the gap closed in P4 where the dip in attitude over the year was sharper for girls while the boy’s scores underwent little change over the course of the year. Returning to a normal class would appear more unsettling for girls although the effect size is again very small. English is again the least liked of the three subjects. By the time Cohort 1 move back to normal classes in P4 there were no differences between these pupils and the reference group. Girls again scored higher than the boys on each test administration.
11.6 Attitudes to mathematics remain steady over P3 but drop in P4 so that the reference group and the pupils from Cohort 1 have almost identical scores by the end of the fourth year. On returning to normal classes in P4 the Cohort 1 girls’ decline was such that there was a significant difference (1% level) between their scores and those of their male peers. In summary, therefore, these results when taken together suggest that being in a smaller class has very little effect on pupils’ motivation, self esteem or their attitudes towards Chinese, English and mathematics. Not only with year to year comparisons was there little difference between the experimental samples and the reference schools, but the advantage of being in a small class for two or three years had little impact on mathematics attitudes on the return to normal sized classes in P4 since by the end of that year the respective scores of the two groups of schools were practically identical in every case.

44
50
60
70
80
90
% max score
Mot(sct)
Mot(ref)
Chi(sct)
Chi(ref)
Eng(sct)
Eng(ref)
Math(sct)
Math(ref)
Figure 11.3 Attitude and motivation scores Cohort 1 v reference schools (P3 through P4)
end P2end P3end P4
11.7 The overall trend, including gender effects, can be illustrated through use of the combined learning disposition score (an aggregated score from all four attitude and motivation measures). In several cases more than one score was available (e.g. two end of P2 scores in the reference groups from different samples) and these were also averaged. The gender variations come through clearly with girls having more positive dispositions on entry and in each successive year. Any small differences between the reference classes and those in the experimental classes have disappeared by the time pupils are completing P4. Overall, attitudes have declined from a high starting point by around 20 percentage points over the four years of the study.
Figure 11.4 Boys' and Girls' Learning Disposition (at entry to end of P4)
60
70
80
90
Entry P1 P2 P3 P4
% m
axim
um s
core
Boy (ref)Boy (sct)Girl (ref)Girl (sct)

45
11.8 There are a number of other factors which have the potential to influence attitudes. In the phase covering entry to primary school up to the end of P2, neither the birthplace of the pupils (Mainland born v Hong Kong born), their attendance at kindergarten, nor their identification as pupils with SEN influences attitudes in both reference school and experimental classes. However, in the move from P2 to P3 overall learning disposition does correlate with some of the above variables. Mainland born pupils, placed in smaller classes score higher than their peers in the reference schools. Even when some of these pupils move back to normal class in P3 they maintain this positive disposition (1% significance level; small effect size). Kindergarten exerts little effect but SEN pupils who remain in small classes during the P3 year have a better learning disposition. In the move from P3 to P4 neither place of birth nor attendance at kindergarten influences pupils’ attitudes. Furthermore, the SEN pupils of Cohort 1, when they move back to normal classes in P4 appear to lose out, since their scores on the learning disposition scale no longer differ from the equivalent group of pupils in the reference group. The analysis suggests, therefore, that smaller classes do result in more positive attitudes among pupils who have been identified with SEN.
11.9 An equivalent analysis can also be conducted using the scores on the attainment tests. From the point of entry to the end of P2 the straightforward comparison is between the reference schools and Cohort 2. The various mean scores for boys and girls are shown in Table 11.1. In both samples the patterns are remarkably similar. For all three subjects, the start of P1 scores, taken in mid September, are higher for the reference schools for both boys and girls. In Chinese the girls outscore the boys in every year in both reference schools and in Cohort 2 (p<0.01). In English the reference schools display the same pattern but in Cohort 2 the initial scores of both boys and girls are equal, although by the end of P1 and again by the end of P2 girls’ scores are significantly higher (1% level). In all cases the effect sizes are relatively small but increase over time.
Table 11.1 Comparison of Attainment: P1 to P2 (Reference v Cohort 2)
Sample Gender Start of P1 End of P1 End of P2 N Mean s.d. Mean s.d. Mean s.d.
Chinese Cohort 2 Boys 63.09 25.74 34.46 19.64 49.50 20.00 1560
Reference 67.65 24.66 37.35 19.75 53.45 19.45 1224 Cohort 2 Girls 68.59 24.50 41.89 19.65 56.31 18.27 1244
Reference 71.79 24.09 42.87 20.11 59.16 18.15 1068 English Cohort 2 Boys 52.87 27.50 50.44 23.47 49.55 24.48 1569
Reference 58.34 27.05 50.73 23.79 54.39 25.00 1233 Cohort 2 Girls 55.09 26.74 55.64 22.01 58.34 22.09 1236
Reference 62.56 25.08 58.24 22.35 64.23 22.11 1066 Maths Cohort 2 Boys 56.31 22.05 45.56 25.24 55.46 22.96 1592
Reference 61.51 21.94 47.75 27.01 59.02 22.67 1234 Cohort 2 Girls 56.94 21.60 45.54 22.72 53.03 20.12 1259
Reference 61.59 20.85 48.82 24.29 57.16 20.20 1089

46
11.10 Mathematics shows a different pattern. In both the reference schools and Cohort 2 there are no significant differences between the boys’ and the girls’ scores at the start and end of P1. By the end of P2, however boys are doing better in both samples (1% level: small effect size). Comparing the two samples shows that in all three subjects reference schools tend to maintain their initial advantage suggesting that it is the difference in the initial samples rather than variables such as the size of the class that accounts for this variation. This interpretation is confirmed when the residual gains of the combined scores are calculated using the start of P1 scores to predict the end of P2 attainment. For boys in Cohort 2 the value of the residual is -1.473 while the figure for the reference group comes to -0.682. The corresponding figures for girls are 0.857 and 1.936 respectively. None of these differences are statistically significant supporting the view that the move to small classes has little effect in comparison to the initial differences between pupils on entry to primary school.
11.11 The source of these initial differences can be partially identified by exploring the data obtained from the Parents’ Questionnaire. In the Reference schools 15% of the intake were mainland born compared to 20.5% in Cohort 2. Only 3.8 of pupils in the Reference schools had not attended a kindergarten while in Cohort 2 the figure was 6.9%. Again the Reference Schools with only 11.2% of SEN pupils have an advantage over schools in Cohort 2 where the proportion of SEN pupils was 17%.
11.12 In both samples the Hong Kong born pupils have poorer scores on entry but whereas this discrepancy is also found in P2 in the Reference school sample mainland pupils in Cohort 2 have caught up by the end of the P2 year. Lack of kindergarten experience again results in lower initial scores. Here although these pupils catch up by the end of P2, irrespective of whether they belong to the Reference group or Cohort 2 the improvement of the latter pupils is greater because they start for an initial lower base. This can be seen in the residual gain scores from the start of P1 to the end of P2. For the reference schools the value is 2.829 while for Cohort 2 it is 4.620.
11.13 For the comparison of scorers from the start of P2 till the end of P3 the timing of the testing was the same for both Cohorts 1 and 2 but for the reference group the end of P1 test was administered in September and not June and in some cases the tests were administered in different years. A further difference was that in P3 Cohort 2 pupils had returned to normal classes. The data is set out in Table 11.2. Mean values and numbers of pupils in Cohort 2 may differ slightly from those in Table 11.1 as not all pupils with scores in P2 also had a score in P3 either because they may have moved away from the neighbourhood during the intervening year or were away at the time of testing. The differences however are relatively slight and have little impact on the overall analysis. For Chinese girls outperform boys in both P2 and P3 in all three samples. Notwithstanding their higher score on the end of P1 test because it was taken in September and not June, the reference group continues to outperform both Cohort 1 and 2 on subsequent tests (p<0.01, small effect size). The differences are greatest when the comparison is with Cohort 1.

47
Cohort 2 has a higher mean score at the end of the P1 year than Cohort 2 (p<0.01, small effect size) and this difference is maintained up to the end of P3 although the effect size is negligible. Being in a small class for three rather than two years appears, therefore, to bring little benefit.
Table 11.2 Comparison of Attainment: P2 to P3 (Reference v Cohorts 1 & 2)
Sample Gender End of P1 End of P2 End of P3 N Mean s.d. Mean s.d. Mean s.d.
Chinese Cohort1 Boys 34.23 18.27 48.54 18.15 44.70 18.44 1721 Cohort 2 37.07 19.54 50.24 19.71 46.98 19.01 1524
Reference 40.53 19.50 51.85 19.31 48.54 19.11 1194 Cohort 1 Girls 39.58 19.48 55.68 17.62 51.84 17.68 1565 Cohort 2 41.98 19.57 56.38 18.30 52.67 17.72 1201
Reference 47.15 20.07 59.02 18.03 55.54 17.72 1151 English Cohort 1 Boys 49.66 22.46 53.82 24.28 29.31 21.10 1745 Cohort 2 50.63 23.34 50.07 24.21 30.87 22.05 1537
Reference 52.10 23.62 50.54 24.91 31.95 23.83 1195 Cohort 1 Girls 55.80 21.39 63.52 21.58 39.41 21.77 1554 Cohort 2 55.66 22.09 58.51 21.95 39.15 21.63 1189
Reference 58.42 22.09 59.83 22.09 40.87 23.31 1150 Maths Cohort 1 Boys 43.52 25.36 54.28 21.76 60.05 22.46 1739 Cohort 2 46.34 25.19 56.13 22.52 61.05 22.51 1546
Reference 51.65 25.28 56.82 22.51 60.83 22.28 1188 Cohort 1 Girls 44.76 23.51 52.59 19.65 59.59 20.37 1568 Cohort 2 45.91 22.57 53.31 19.76 59.43 20.41 1206
Reference 53.79 23.26 56.57 20.12 61.66 20.54 1143
11.14 In English girls again always obtain higher scores than boys in all three samples (significance level 1% but small effect sizes). Attainment differences at the end of P1 favour the Reference group (because of later testing) but by the end of the P2 year it is Cohort 1 pupils that are ahead. But this advantage is not maintained in P3 so that the additional year in the small class appears to offer no significant advantage. In mathematics, as in previous comparisons, gender effects are less pronounced. There are significant differences (1% level) for boys in P2 (Cohort 1 and Cohort 2) and in P3 (Cohort 2) but the effect size is very small in each case. Both Cohorts 1 and 2 are behind the reference group at the end of P1 and P2 but have caught up at the end of P3. Moving back to a normal class in P3 appears to have no noticeable effect on Cohort 2’s performance.
11.15 When the results are broken down by place of birth and attendance at kindergarten there are few significant results. Smaller classes tend to reduce the differential between Hong Kong born and Mainland born children but have little noticeable effect on improving the scores of pupils who did not have an

48
opportunity to attend kindergarten. This suggests that home background is the more important of these contextual variables.
11.16 The final comparison is between the Reference group and Cohort 1 when pupils move from P3 to P4. Here again the timing of the end of P2 testing differed, that for the Reference school pupils taking place in mid September while Cohort 1 were tested in June. Table 11.3 displays the data. Again, in Chinese, the pattern whereby girls outperform boys is continued into P4 irrespective of whether the pupils belong to the reference group or to Cohort 1. As expected the reference group scores at the end of P2 are higher for both genders (due to the later administration of the test) but by the end of P3 girls’ scores do not differ significantly (5% for boys in favour of reference group but negligible effect size). However, in P4 when all the pupils are in normal classes the Reference group regains the advantage (1% level; small effect size both genders).
Table 11.3 Comparison of Attainment: P3 to P4 (Reference v Cohort 1)
Sample Gender End of P2 End of P3 End of P4 N Mean s.d. Mean s.d. Mean s.d.
Chinese Cohort 1 Boys 48.65 18.17 44.69 18.40 47.49 17.42 1803
Reference 51.97 17.79 46.39 18.78 50.42 17.56 1186 Cohort 1 Girls 55.47 17.42 51.62 17.67 55.72 15.85 1645
Reference 58.92 17.01 52.77 17.54 57.91 16.10 1137 English Cohort 1 Boys 53.08 24.24 28.73 20.90 34.62 22.11 1819
Reference 55.78 24.22 31.74 22.91 37.99 23.36 1181 Cohort 1 Girls 62.58 21.75 38.58 21.74 45.84 21.56 1640
Reference 65.57 21.75 42.00 23.53 48.43 22.20 1138 Maths Cohort 1 Boys 54.22 21.66 59.72 22.57 50.78 22.29 1818
Reference 57.86 21.21 62.18 22.17 54.73 21.20 1165 Cohort 1 Girls 53.05 19.29 59.80 20.08 51.16 19.80 1643
Reference 56.45 19.91 62.49 20.28 54.27 20.33 1128 Aggregated attainment (combined Chinese, English and mathematics scores) Cohort 1 Boys 52.58 18,69 44.64 17.99 44.62 18.22 1661
Reference 55.35 18.71 46.99 18.90 47.83 18.45 1085 Cohort 1 Girls 57.28 16.84 50.24 17.39 51.12 16.62 1539
Reference 60.37 17.09 52.40 18.01 53.63 17.18 1053
11.17 In English the Reference group not only outperforms Cohort 1 (both genders) on the end of P2 (as expected) but continues to do so at the end of P3 and P4. In all cases the effect sizes are very small and again the move back to normal size classes in P4 has a negligible effect on Cohort 1 scores. In mathematics there is only one gender difference and that is for the end of P2 testing in Cohort 1. Although as with the languages, the Reference group has higher end of P1 scores because of the delay in administration Cohort 1 has caught up by the end of P3. However, once the Cohort 1 pupils move to normal classes in

49
P4 the Reference group open up the gap again (1% significance level; small to very small effect size). Thus the inference is that being in a small class in P3 does have some benefit but that this does not carry over once the pupils return to the normal classes in P4. This can perhaps be seen more easily when the aggregated attainment scores are examined. In P3 Cohort 1 has lowered the gap between both boys and girls scores but by P4 the reference group has regained its advantage. While therefore being in a small class in P3 appears to bestow some advantage there exists also the possibility that another reason for the improvement lies in the extended efforts being made to achieve success in the TSA examinations.
11.18 Although being in a small class appeared to benefit pupils when they were in P1 and to a certain extent P2 it is being a Hong Kong born pupil that now reappears in P3 and P4 as a significant variable (1% level; small effect size). The effect of having attended kindergarten cannot be ascertained since this question was not included on the Parent questionnaire when it was given to the parents of P1 pupils. Being in a small class in P3 appears to give a slight advantage to SEN pupils since they reduce the gap that previously existed with similar pupils in the reference group at the end of the P2 year, but again the effect sizes are extremely small.
11.19 In Table 11. 4 residual gains, calculated using the aggregated scores, are used in support of the above findings. In all cases the girls’ residuals are positive, the boys are negative except when end of P3 scores are used to predict end of P4 attainment. This marks the point in time when Cohort 1 returns to normal classes and both boys and girls in the reference groups make greater progress. Clearly, having been in a small class for three years does not carry an advantage on return to normal classes in P4. As demonstrated previously (para 11.17) when pupils move to P3, experimental classes retain a slight advantage but when the end of P2 scores are used to predict P4 attainment boys and girls in the reference schools both outperform their peers in the experimental sample. This supports the view that any advantage of being in a small class initially declines from year to year. The differences between the experimental and reference classes for boys and the end of year P2 to the end of P3 scores for girls are statistically significant (1% level) in favour of the experimental classes but the effect sizes are extremely small and indicate no practical difference.
Table 11.4 Residual gains in the Experimental and Reference classes (aggregated scores)
Sample Gender P2 to P3 P2 to P4 P3 toP4 Mean s.d. Mean s.d. Mean s.d.
Experimental Boys -0.258 8.77 -0.941 7.64 -1.098 8.20 Reference -0.896 9.11 -0.160 7.97 0.040 8.81
Experimental Girls 0.872 8.51 0.597 7.06 0.508 7.75 Reference 0.145 8.49 0.776 7.20 1.051 7.69
Gender effects significant at 1% level in all cases (very small effect sizes)

50
11.20 For all three comparisons (P1 to P2; P2 to P3 and P3 to P4) regression analysis was also employed to determine the magnitude of various effects using the combined aggregated scores. Pupil data for each of the participating schools (experimental and reference) was entered into a regression analysis in attempt to assess the contribution to end of P2, P3 and P4 aggregated attainment of the following variables: gender, school attended, parental support, being in a small or normal class, being classified as SEN, learning orientation, and, successively, aggregated attainment either at the start of P1, P2 or P3 as appropriate. Two regression equations were constructed. The first used a simple linear regression model while the second adopted a multilevel approach with pupil characteristics as the first and schools as the second level variable.
11.21 From the start of P1 to the end of P2 the initial attainment accounted for 42.4% of the total explained variance. Being classified as SEN reduced a pupil’s score (unstandardised regression coefficient = -9.59) and accounted for a further 3% in variation. Parental support then contributed a further 2%. 17 of the schools contributed a further 4.2% to the total variation but being in a small class did not feature. Having a positive orientation to learning and being a girl jointly contribute a further 0.5% to the total variation. Of the 4 schools making a significant negative contribution to the end of P2 score 3 were from the reference schools. Thirteen schools made a positive contribution of which 7 came from the experimental sample. When the analysis was repeated, this time using a multi-level regression model to estimate the contribution of schools to the overall equation then the variation attributable to the various pupil contributions was 162.0 (standard error 4.23) and that for schools 12.47 (standard error 3.14). Thus some 8% of the observed pupil performance can be attributed to differences between schools while the major contributions remain that of initial attainment, attendance at kindergarten and parental support followed to a lesser degree by the learning orientation at the end of P2 and being a girl pupil. The multilevel analysis therefore confirms the findings of the simple regression model. In so far that it has been shown that school differences are always larger than those between the small and normal class samples, it would appear that the variation between schools can mainly be attributed to difference in intake.
11.22 A similar analysis was conducted tracing pupil progress from the beginning of P2 to the end of P3. The simple linear aggression shows that the strongest variable accounting for the end of P3 attainment is the end of P1 score which accounts for 64.3% of the total explained variation. Being in a small classes or place of birth makes no significant contribution to the P3 score, while being classified as SEN, parental contribution and the end of P3 orientation to learning scores contributes a further 1.4%, 0.9% and 0.4%, respectively, to the explained variation. Twenty-seven schools make a significant contribution to simple regression equation predicting the end of P3 attainment. Of these, 15 make a positive contribution and 12 of these are experimental schools. Of the 12 negative contributions 6 belong to experimental sample. If instead of end of P1 score the end of P2 score is used as the predictor of P3 attainment then this variable alone accounts for 75.9% of the explained variation leaving little remaining variance to distribute between the other variables. There are small but positive associations with parental support and overall attitudes but being

51
in a small P3 class makes a negative contribution of 1.43% to end of year attainment score. When the multi-level model is employed, again using end of P1 attainment as the predictor, the pupil contribution to the total variation is 95.77 (standard error 1.84) while schools account for 8.10 (standard error 1.78). Thus around 8% of pupil performance at the end of P3 can be attributed to differences between schools.
11.23 The third analysis examines the variables associated with the end of P4 test scores. Using the linear regression model it appears that the end of P2 attainment accounts for 75% of the total variation. The fact that the reference schools didn’t take the test until mid September after beginning the P3 year probably contributes to the magnitude of this effect. Other factors such as end of P4 learning orientation and being a girl contribute approximately a further 1% to the explained variance. 20 of the schools then contribute a further 1% (half positively and half negatively). Four of the 10 positive contributions and 8 of the negative ones come from schools in the experimental sample. Now, however, neither attendance in a small class, parental support or place of birth contributes. If the analysis is repeated this time using the end of P3 scores as the predictor of P4 attainment then the effect of moving back to normal classes in Cohort 1 can be studied. Now, the end of P3 scores contributes 79% of the variance. Moving from the small to the normal class causes the combined score of pupils to fall by about 1.9% so that pupils’ experience of three years of SCT does not provide a sustained advantage. When multilevel regression analysis is performed using end of P2 scores to predict P4 attainment then the pupil contribution to the total variation is 72.70 (standard error 1.69) while the schools effect contributes 3.49 (standard error 0.90). Thus some 4% of pupils’ performance at the end of P4 can be attributed to school differences.
11.24 In summary, the picture that emerges from these regression analyses is that the pupils’ initial ability at intake is a major determinant of pupils’ progress and this is influenced by various factors such as place of birth, parent support and attendance at kindergarten. Thus differences in post –test attainment between schools are largely explained by difference in their intake of pupils. Being in a small class does not have a significant effect but moving back to a normal class has a negative influence. As pupils move from P1 to P4 the contribution made by schools diminishes and the pre-test measure accounts for an increased proportion of variation in the pupils’ post test scores. Starting with the start of P1 year scores it was found that these accounted for 42.4% of the variation in the scores at the end of P2. When this end of P2 score was used to predict attainment at the end of P3 the corresponding figure was 75.9% and when this P3 score was used to predict end of P4 scores it accounted for 79% of the explained variance. However a degree of caution needs to be employed when interpreting these results. First the data from the reference schools comes from different samples of pupils. Second the timing of the pre-test varied so that in some cases the scores of the pupils in the experimental sample were collected some three months before those of the reference schools. Nevertheless, the main conclusion to emerge would appear to be that irrespective of whether pupils are in large or small classes the main factor contributing to progress is the quality of the teaching. What matters most in

52
determining the score that a pupil achieves at the end of any year is the score that pupil achieved at the end of the previous year and this must be attributed, at least in part, to the degree of expertise possessed by different teachers.
12. Reviewing the results of the SCT Study (2004-2008)
12.1 At the conclusion of the SCT study it would seem appropriate to attempt some overall synthesis of the results that have been gathered over four school years, particularly those that measure pupils’ attainment. Since its inception, the study has had to cope continually with problems which arose from the initial research design. Ideally, from a research perspective to compare small and large classes would have required two samples; one with large and one with small classes. Schools allotted small classes would have been chosen at random with some initial stratification to take account of key variables such as proportion of disadvantaged pupils, the band level etc. Pupils would then have tested on entry to P1 in the September and then again in June at the end of each year up to the completion of P4.
12.2 In practice aided and government schools were invited to apply for participation in the Study via a circular memorandum dated 14 May 2004. The selection criteria were: (a) schools’ readiness in trying out SCT, based on their knowledge and experience in curriculum development, participation in teaching pedagogy related initiatives/projects, teachers’ commitment, etc.; (b) prospect of stable and adequate P1 intake throughout the period of the Study, and (c) availability of classrooms to accommodate the additional classes. The circular memorandum also indicated that in the event the number of schools which satisfied the above criteria exceeded the quota of 40, priority would be given to schools which had a sizable number of students who were in need of stronger school support. Since the number of eligible schools fell short of the target number, it was not necessary to apply this additional criterion.
12.3 Given the circumstances stated in para 12.2, a compromise design was therefore employed whereby the small and the control classes came from the same schools all of whom volunteered to participate. This decision gave rise to several important limitations. First it meant that the equivalent classes from the experimental and control cohorts had to be tested in different years. Thus P1 small classes were tested in 2004/05 (Cohort 1) and 2005/06 (Cohort 2) but P1 controls (Cohort 3) were not tested until 2006/07. Second, only Cohort 1 pupils could be followed up to the end of P4 without extending the study. To make comparisons, therefore, required different samples of pupils to provide controls in P1, P2, P3 and P4. The P2 normal classes could then be followed through P3 up to the end of P4 while pupils from Cohort 3 could be followed up to the end of P2.
12.4 This would have mattered less if the subsequent scores used as post-tests could have been adjusted for intake. But since the tests had to be created at the same time that the study began it was only possible to test Cohort 1 small classes in October 2004 and the P2 and P3 control classes in December 2004. It was not until the 2006/07 school year that a straightforward comparison of

53
performance in P1 classes could be made over the same time interval (Cohort 2 v Cohort 3). When this was done it was in the small classes that the pupils made greater academic progress although the effect size was in every case small. Irrespective of whether the pupil was a boy or a girl or the nature of the subject (except mathematics for girls) pupils in the small classes did better than those from the controls.
12.5 When the various comparisons were undertaken in the P2, P3 and P4 classes the advantages of the Cohort 2 small classes in P1 appeared to decrease over time. The fact that the P1 gains were not replicated in Cohort 1 restricts the degree of confidence that can be placed in this finding, although it is reasonable to assume that the schools and P1 teachers in the 2004/05 school year would still have been adjusting to the changed circumstances and therefore less likely to have been able to take full advantage of the class size reductions. However, a significant difference between the small classes and those in the control group emerged when the effects across different ability bands was examined. It appeared that teachers in small classes were able to improve the performance of pupils more evenly while in some cases teachers in the larger classes improve overall performance by boosting that of the more able pupils at the expense of the children in the bottom third of the class. In all cases although these differences were statistically significant they again gave rise to only very small effect sizes; the equivalent to one to two months additional schooling. However, such results were confounded in that in some cases the same teachers taught the small and normal classes.
12.6 Mainly for this latter reason an additional group of ‘reference schools’ were added. Again, however, there were problems in the timing of testing and the fact that three different samples of pupils representing P1, P2 and P3 had to be used in order to follow their progress in the subsequent year. The decision to conduct the pre-test in September at the beginning of the school year was the logical one but again this meant that in some cases, when comparing P2 or P3 classes, the pre-test (end of P1 or P2 test) had been administered to the small class pupils in the previous June.
12.7 In seeking to carry out a review of these results over the four year period two approaches can be taken. First, only the results where the comparisons are across similar time intervals could be used. The disadvantage of proceeding in this way is that it would eliminate some results. The second approach is to consider all the results obtained at the end of each school year and to attempt to estimate the effect of administering the test at different points in time. Table 12.1 sets out the means and standard deviations for the various test administrations from the end of P2 until the end of P3. Dates in italics indicate the move back to normal classes.
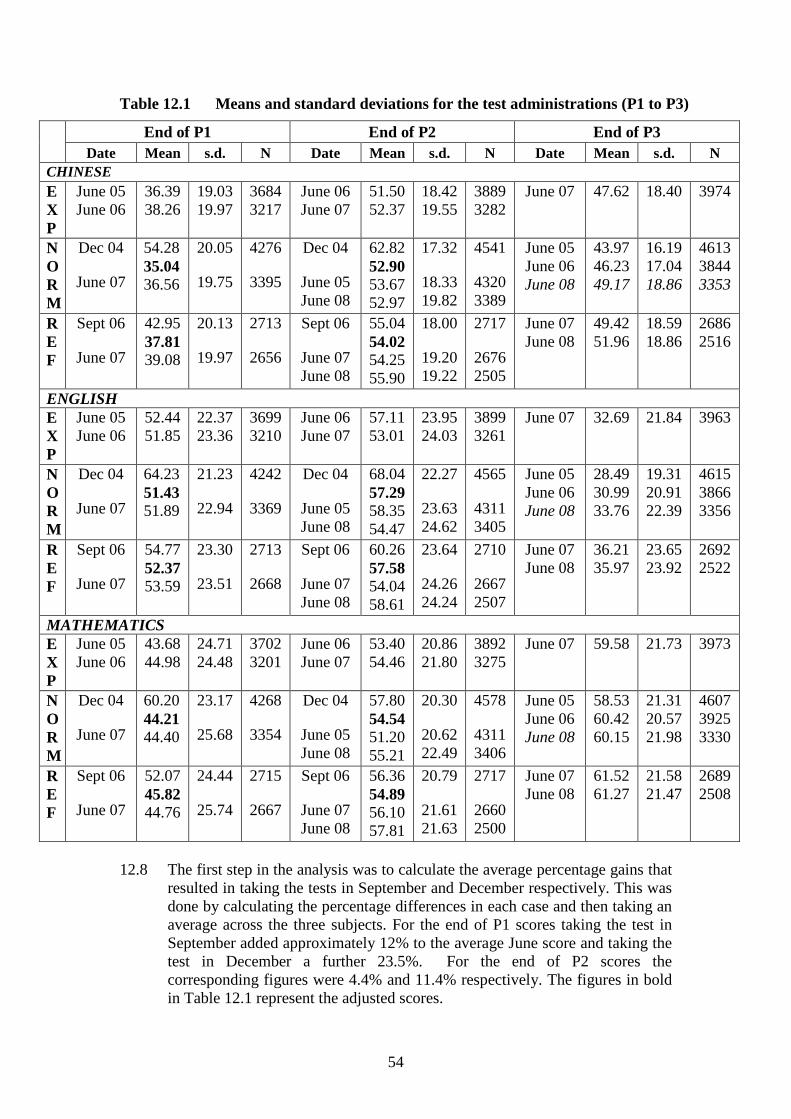
54
Table 12.1 Means and standard deviations for the test administrations (P1 to P3)
End of P1 End of P2 End of P3 Date Mean s.d. N Date Mean s.d. N Date Mean s.d. N
CHINESE EXP
June 05 June 06
36.3938.26
19.0319.97
36843217
June 06 June 07
51.5052.37
18.4219.55
38893282
June 07 47.62 18.40 3974
NORM
Dec 04
June 07
54.2835.0436.56
20.05
19.75
4276
3395
Dec 04
June 05 June 08
62.8252.9053.6752.97
17.32
18.3319.82
4541
43203389
June 05 June 06 June 08
43.9746.2349.17
16.1917.0418.86
461338443353
REF
Sept 06
June 07
42.9537.8139.08
20.13
19.97
2713
2656
Sept 06
June 07 June 08
55.0454.0254.2555.90
18.00
19.2019.22
2717
26762505
June 07 June 08
49.4251.96
18.5918.86
26862516
ENGLISH EXP
June 05 June 06
52.4451.85
22.3723.36
36993210
June 06 June 07
57.1153.01
23.9524.03
38993261
June 07 32.69 21.84 3963
NORM
Dec 04
June 07
64.2351.4351.89
21.23
22.94
4242
3369
Dec 04
June 05 June 08
68.0457.2958.3554.47
22.27
23.6324.62
4565
43113405
June 05 June 06 June 08
28.4930.9933.76
19.3120.9122.39
461538663356
REF
Sept 06
June 07
54.7752.3753.59
23.30
23.51
2713
2668
Sept 06
June 07 June 08
60.2657.5854.0458.61
23.64
24.2624.24
2710
26672507
June 07 June 08
36.2135.97
23.6523.92
26922522
MATHEMATICS EXP
June 05 June 06
43.6844.98
24.7124.48
37023201
June 06 June 07
53.4054.46
20.8621.80
38923275
June 07 59.58 21.73 3973
NORM
Dec 04
June 07
60.2044.2144.40
23.17
25.68
4268
3354
Dec 04
June 05 June 08
57.8054.5451.2055.21
20.30
20.6222.49
4578
43113406
June 05 June 06 June 08
58.5360.4260.15
21.3120.5721.98
460739253330
REF
Sept 06
June 07
52.0745.8244.76
24.44
25.74
2715
2667
Sept 06
June 07 June 08
56.3654.8956.1057.81
20.79
21.6121.63
2717
26602500
June 07 June 08
61.5261.27
21.5821.47
26892508
12.8 The first step in the analysis was to calculate the average percentage gains that
resulted in taking the tests in September and December respectively. This was done by calculating the percentage differences in each case and then taking an average across the three subjects. For the end of P1 scores taking the test in September added approximately 12% to the average June score and taking the test in December a further 23.5%. For the end of P2 scores the corresponding figures were 4.4% and 11.4% respectively. The figures in bold in Table 12.1 represent the adjusted scores.

55
12.9 The standard deviations in Table 12.1 were then pooled to give a standard error of approximately 0.50. To reach statistical significance at the 5% level any difference between pairs of means in the table should therefore be greater than 1.96 while a value greater than 2.58 would indicate the a result which was significant at the 1% level. Examining differences between Cohort 1 and Cohort 2 at the end of P1 and P2 shows only one significant difference; that in English at the end of P2. At the end of P3, when Cohort 2 returned to normal classes, there are no significant differences with Cohort 1 across any of the subjects. For the comparisons with the control and reference classes there are no clear trends. In so far as significant differences do occur they appear to represent random fluctuations possibly due either to variations in the intake to P1 or, more likely because of the quality of teaching. In every case, all of the significant differences between pairs of means result in extremely small effect sizes.
12.10 There are also three end of P4 comparisons. The P2 control classes of 2004/05 took the end of P4 test in June 2007 while, Cohort 1 having returned to normal classes, together with the reference classes took the same test in June 2008. In Chinese the means were 54.72 (control) 51.42 (Cohort 1) and 54.04 (reference group). The score of Cohort 1 pupils is significantly lower than that of both other samples (1% level but very small effect size). Moving back to normal classes in P4 appears to have a negative effect. In English the corresponding means were 40.11 (control) 38.35 (Cohort 1) and 42.75 (reference group) respectively. Here, although the trend is similar to that for Chinese only the performance of pupils in the reference group is significant (1% level; small effect size). In mathematics, however, Cohort 1 pupils do outscore the control sample (52.26 against 50.88) although the result is not statistically significant. The pupils in the reference group do even better with a mean of 54.39. This is a significant improvement over Cohort 1 pupils’ performance (5%) and of control pupils (1%) although again these are only small effect sizes.
12.11 Confirmation of these trends can be seen in Table 12.2 where the end of P3 scores are used to predict the P4 score. It can be seen that in every case, Cohort 1 does less well than expected in comparison to the control group from the same schools (Chinese and English) and compared to the reference group in mathematics, although the magnitude of the differences in the latter subject are not as great as is the case of the two languages. The return of Cohort 1 to normal classes, having spent the previous three years in small ones, appears therefore to have retarded rather than enhanced pupils’ progress.
Table 12.2 End of P3 to end of P4 residual gains for each subject
Sample Chinese English Mathematics Mean s.d. N Mean s.d. N Mean s.d. N
Cohort 1 -1.892 11.31 3754 -1.285 12.56 3757 -0.849 12.82 3758 Control 2.34** 11.63 3624 1.995** 13.58 3638 0.394 12.96 3676
Reference -0.583 11.72 2365 -1.030 12.79 2363 0.747** 13.04 2333 **p<0.01; small to very small effect size

56
12.12 It has previously been shown that compared to Cohort 3 and the reference
group pupils in small classes in Cohort 2 did better on all three attainment tests at the end of P1. In the 2007/08 school year, Cohort 3 and the P1 reference class have both been followed into P2. It is thus possible to determine whether the progress made by Cohort 2 pupils in P1 continues in the following year. The residual gains for the three samples (Cohort 2, Cohort 3 and reference group) are shown in Table 12.3. In each case pupils in Cohort 2 small classes do less well than expected at the end of P2 when compared to pupils in normal classes. Thus the advantage gained by Cohort 2 at the end of P1 is eroded in the following year.
Table 12.3 Start of P1 to end of P2 residual gains for each subject
Sample Chinese English Mathematics Mean s.d. N Mean s.d. N Mean s.d. N
Cohort 2 -1.219 13.0
280
-1.339 16.7
280
-0.795 14.2
2851 Cohort 3 0.305 12.9
301
-0.713 17.0
300
0.210 14.6
2998
Reference 1.090*
13.2
229
1.860*
16.9
229
0.706*
14.1
2323 **p<0.01; small to very small effect size
12.13 It is also possible to deduce the effect on pupils in Cohort 2 when they move back to normal classes by using end of P2 scores to predict the P3 results. This time there are four comparison groups. The control class who took the end of P2 test in June 2005, Cohort 1 who took it in June 2006, Cohort 2 who took it in the June of the following year (2007) and the reference group who also took it in the same year. The residual gains for each subject are shown in Table 12.4. Here the results illustrate the difficulty of providing straightforward answers to some of the questions posed at the start of this report given the complexity of the research design. Compared to Cohort 3 pupils in the small classes appeared to regress during the P2 year. However when the comparison involves different samples the situation of pupils in Cohort 2 appears to have improved during the P3 year. In both languages pupils in Cohort 2, on returning to a large class make significant progress (1% level) compared to the pupils in the control groups and Cohort 1. In mathematics, however, Cohort 2 pupils make significantly less progress (1% level) that might have been predicted from their P3 score in comparison with the control group and the reference group has the lowest mean residual gain. Thus there is no overall consistency suggesting, once again, that what matters more than the size of the class is the expertise and experience of the teacher.
Table 12.4 End of P2 to end of P3 residual gains for each subject
Sample Chinese English Mathematics Mean s.d. N Mean s.d. N Mean s.d. N
Cohort 1 0.433 12.0
364
-0.842 13.9
364
-0.405 13.5
3457 Cohort 2 1.164 12.3
299
2.927 14.0
302
-0.866 13.1
2868
Control -2.692 11.3
354
-4.115 14.2
356
1.980*
12.5
3181 Reference 1.880*
12.3
238
3.755*
14.3
238
-1.320 13.4
2366
**p<0.01; small to very small effect size

57
12.14 A simple regression analysis was also undertaken using aggregated scores across the three subjects to predict the end of P2 scores. The predictive variables included the start and end of P1 scores, pupil gender, SEN classification, learning orientation at the end of P2, class membership (small or normal) and school. The strongest influence on end of P2 attainment was found to be the end of P1 scores. These accounted for 67.4% of the total variance explained by the regression equation. Scores on the P1 pre-test on entry to primary school contribute another 3.7%. Being classified SEN (unstandardised regression coefficient -6.24) lowers end of P2 score while end of P2 orientation to learning and being a girl (regression coefficients 1.08 and 0.70 respectively) make small positive contributions. Along with the above variables, 23 schools with significant regression coefficients contribute to explaining a further 2.7% of the total variation, 12 making a positive contribution to the end of P2 predicted score. Of these, 7 are reference schools. This is balanced out by the fact that of the 11 making a negative contribution, 7 are also reference schools.
12.15 Repeating the analysis using multilevel regression (pupil characteristics and schools as the two levels) confirms the results of the simple regression model. The contribution of the various pupil characteristics to the total predicted variance is 95.55 (standard error = 1.47) while the school contribution is 5.42 (standard error = 1.92). Thus around 5% of pupils’ end of P2 test performance can be attributed to differences between schools. Of the pupil characteristics with significant regression coefficients, start and end of P1 scores, end of P2 learning orientation and being a girl all featured in the simple regression analysis. The only addition using the multilevel model was membership of Cohort 3 confirming that the advantaged gained by Cohort 2 pupils in P1 had been eroded by the end of P2.
12.16 A similar analysis can be used to chart the progress of Cohort 1 pupils as they move through P2 to P4. This combines the P2 control classes who took the end of P2 test in June 2005 and completed the P4 year in June 2007 and Cohort 1 SCT ‘experimental’ classes who followed the same pathway from June 2006 to June 2008. The end of P2 scores are the largest predictor of P4 attainment (unstandardised regression coefficient = 0.83) accounting for 70.9% of the explained variance. The pupils’ orientation to learning at the end of P4 accounts for just over another 1% of this variation. Being a girl, having a Principal who has strong beliefs in the value of SCT and is experienced also contributes positively but being in Cohort 1 reduces the pupils’ P4 mean score by 1.8%. This reflects the adverse effect of returning to large classes. 17 schools have significant regression coefficients of which 6 make negative contributions to the P4 scores. The school contribution to the explained variance was again tested using the multi-level regression model. The pupil contribution now has 4 significant regression coefficients consisting of the end of P2 scores, end of P4 orientation to learning, being a girl and membership of Cohort 1, the latter making a negative contribution (unstandardised regression coefficient = -2.08). These measures contribute 81.49 to the total variation (standard error = 1.55) while schools contribute 4.15 (standard error = 1.19) so that approximately 5% of the pupil attainment at the end of P4 is attributable to schools.

58
12.17 It is also of some interest to conduct the same analysis separately for the experimental school and the controls to see if schools’ contribution differs when classes are smaller. Table 12.5 displays the comparison using the aggregated scores from the Chinese, English and mathematics tests. In both cases the end of P3 test is the main predictor of P4 attainment followed by the end of P2 test. These two variables account for 81.8% of the explained variance in the experimental sample and 77.9% in the controls. Girls appear to gain a bigger advantage in the small classes and the active leadership of the Principal also makes a contribution. In the control classes, Principals who have either a negative (bottom quartile in ratings) or a positive view (top quartile in ratings) of the value of small classes feature in the regression equation. Presumably, a Principal with somewhat negative views of SCT accepts the existing conditions in normal classrooms and encourages staff to cope as best they can. Principals with positive views may be more likely devise strategies which compensate for larger classes, such as deploying existing resources (including teachers) more effectively to take account of individual circumstance with a particular class. For example they may employ a non-specialist teacher in a certain subject because of his or her expertise in coping with certain pupils with behavioural problems and this may, in part, explain the findings in para 9.9.
12.18 In the experimental sample 10 schools have significant unstandardised regression coefficients while in the control group there are 13. The relative contributions can be determined using the multilevel regression model where for the experimental sample just over 4% of the predicted P4 attainment is attributable to schools against just over 11% for the control group. Again, using the multilevel model adds little to the simpler regression analysis. Looking at the individual schools involved it is interesting to note that only three schools feature in both the analysis of the experimental and the control samples. These are Schools 34 and 15 who contribute positively to the predicted P4 score. But School 16 makes a negative contribution when classes are small but a positive one when they are normal. What this seems to suggest is that it is the teacher’s expertise that has much the biggest influence, irrespective of whether the class is of small or normal size.
Table 12.5 Significant predictors of end of P4 attainment (Cohort 1 v Control)
Small Class sample Control sample Significant
variable Regression coefficient
Square multiple
correlation
Significant variable
Regression coefficient
Square multiple
correlation Constant -2.176 Constant -11.099 P3 end test 0.513 0.768 P3 end test 0.604 0.761 P2 end test 0.317 0.818 P2 end test 0.196 0.779 Being a girl 1.452 0.820 P4 attitudes 2.889 0.790 P1 end test 0.085 0.822 P1 end test 0.146 0.794 P4 attitudes 1.162 0.824 School 17 10.300 0.798 School 34 4.614 0.826 School 10 -1.778 0.801 School 15 2.222 0.827 School 27 7.088 0.804 + Leadership 1.661 0.829 School 34 6.095 0.806 School 19 -4.010 0.829 School 15 2.050 0.807

59
Small Class sample Control sample
Significant variable
Regression coefficient
Square multiple
correlation
Significant variable
Regression coefficient
Square multiple
correlation School 10 -2.865 0.830 School 9 5.453 0.809 School 2 -2.855 0.831 Being a girl 1.476 0.811 School 16 -3.208 0.832 School 26 4.006 0.812 School 7 -3.718 0.832 School 16 2.740 0.813 School 36 -2.394 0.833 School 35 3.603 0.814 School 33 -1.918 0.833. - SCT view 3.047 0.815 School 23 -2.210 0.834 + SCT view 2.032 0.816 School 11 5.424 0.816 School 24 -3.516 0.817 School 31 -2.993 0.818 School 3 -4.448 0.818 12.19 As a final check the regression equations were modified first to exclude the
contribution of the end of P3 scores, then those of P2 and finally the end of P1 when predicting P4 attainment. In the control group removing P3 scores reduces the proportion of explained variance accounted for from 81.8% to 75.5% while also removing the end of P2 scores reduces the figure to 69.3%. When no attainment data are included the figure drops to 14.2%. In the experimental group excluding P3 attainment reduces the total variance accounted for from 83.4% to 78.5%. When the end of P2 scores are excluded from the regression equation the figure is reduced to 48.9% and with no attainment measure the figure reduces to 27.1%. Ten schools contribute about 3.5% to this variation (14 in the control group contributing 8%). In the control group being one of the schools with a high proportion of disadvantaged pupils enters the regression equation (unstandardised regression coefficient = -7.537) confirming the earlier analysis that being in a smaller class in these schools makes a positive contribution to pupils’ P4 attainment. In the experimental sample when no attainment measure is included in the regression equation it is being SEN which contributes 17.2 % of the total explained variation with parental support contributing a further 3.3%.
12.20 These results support the conclusions of earlier analyses. Whether pupils are in a small or a normal class what matters most is their prior attainment at the end of the year. Small classes may compensate, in part, for prior attainment on entry to primary school, particularly for pupils with disadvantaged backgrounds to the extent that they have matched the performance of children in classes with standard populations of pupils by the end of P1. However, any such advantages are gradually eroded year by year so that by the end of P4 on returning to normal classes they fall behind. School differences tend to be greater in normal classes, although the same schools do not always feature in top and bottom quartiles in successive years. This points to differential intakes at the start of primary schools and the greater expertise of some teachers as pupils move from class to class.

60
13. Some general conclusions
13.1 At the beginning of this final report a number of questions were posed. The first of these was central to the study since it asked whether pupils in small classes made better progress in attainment and improved attitudes and motivation than children in normal classes. The answer would appear to be yes in P1 but not to the same extent subsequently. In P1 classes both boys and girls in Cohort 2 did better than either those in Cohort 3 normal classes or their peers in the reference groups but in P2 classes the situation was less clear cut where the regression analysis indicated that the pupils in Cohort 3 were advantaged. With attitudes and motivation there were no significant differences between the samples. In each year of the study, as pupils progressed from P1 to P4 both attitudes and motivation declined although starting in P1 at a high level.
13.2 Beyond P2, where differences in attainment occurred they did not appear to favour any one group systematically. In P3, as the TSA analysis confirmed the major effect appeared to be ‘teaching for the test’ which boosted pupil’s scores irrespective of whether pupils were in small or large classes. In the analysis of the sequence from the entering P1 to the end of P4 the contribution of the immediate preceding year was the major determinant in predicting pupil progress. Whereas, initially, parental background, the school attended, the pupils orientation to learning and the Principal’s leadership made a modest contribution to the P2 scores by the end of P4 the final P3 scores were accounting for between 75% and 80% of the total variation. The implication of these findings is that what counts most is the quality of the teaching.
13.3 The above conclusion means that the second question, which asked if the results of being in a small class for more than one year were additive, must receive a tentative negative response. By the time pupils return to normal classes and complete P3 (Cohort 2) and P4 (Cohort 1) the advantages have either been reduced or eliminated and in the case of Cohort 1 moving back to the normal class in P4 marks a dip in progress relative to pupils who have remained in normal classes since entry to primary school. The finding that in Cohort 2 the class size effect is greatest during the first year in primary school but declines thereafter is a feature of other research, notably Blatchford et al. (2003). This result suggests, as do other studies, that the benefits of small classes are greatest during the first year of primary school. However, unlike some other studies, notably that of the Tennessee STAR project, there was little to be gained (in terms of achievement) in continuing in the small class for three or even two years. This result needs to be seen in the context that the classes in the present study ranged from 20 to 25 pupils compared to those in the STAR project where numbers were around 15. It also needs to be recognised, as the cluster analysis demonstrated, that teachers were still experimenting in the use of different teaching approaches so that results could be expected to vary. Finally the move to normal size classes in P4 appeared to have negative consequences in that pupils who switched back made less progress in P4 than did pupils who had been taught in regular classes since entry to primary school.

61
13.4 These results must, however, be treated with caution for the reasons advanced earlier in the report. Most importantly, previous research where the results have been of greater significance have compared classes of around 15 pupils with those that in some cases were in the mid thirties. The previous research does suggest that although there are some benefits when classes are in the range 20-25 these are not as clear cut. In the present study some Cohort 3 classes were only marginally greater than the small class limit of 25, either because of declining rolls or because school Principals, having experienced small classes, juggled with existing resources in the attempt to continue to keep numbers as small as possible in the initial years of primary schooling. Thus in some cases the comparisons may not have afforded a sufficient difference in class composition to yield medium to large effect sizes.
13.5 The third question dealt with the impact of pupil and teacher behaviours on pupils’ attainment and attitudes. Here the results were again not clear cut. Four different teaching approaches were identified but there was no consistent relationship with different kinds of pupil behaviour. This suggested that the various pupil types were more a matter of individual temperament or personality rather than a consequence of a particular teaching approach. The analysis of differences between small and normal classes indicated that while teachers in the latter classes were mostly wedded to whole class instruction with the smallest proportion of active pupil participation, their colleagues in small classes were much more experimental in their choice of approach. Insofar as there were differences in attainment and attitude it was the transition from instructors to whole class questioning which resulted in several positive differences, particularly improvements in pupils’ disposition towards learning.
13.6 Type 2 teachers (group task monitors) as might be expected had the highest percentage of pupils labelled active collaborators. These pupils have some of the highest levels of distraction suggesting that teachers have yet to master the effective use of collaborative group activities. This view is supported by the informal observation carried out during the consultant’s visits to schools as typified by the earlier description of the mathematics lessons (paras 4.3 and 4.4). Group work was often used for tasks with relatively trivial academic outcomes and where ground rules for working effectively were seldom reinforced as the theory suggests they should be. At this present stage of development pair work would seem the better option.
13.7 The question of whether smaller classes were of particular value in schools having a high proportion of disadvantage students was also considered. In both Chinese and mathematics P1 pupils from the ‘disadvantaged’ schools hold their own while in Cohort 2 they do better than the remaining sample of experimental schools. In English, the deficit on entry, largely due to the high proportion of Mainland born children, the disadvantaged schools never make up lost ground. As was true of the results in general, however, any advantage at the end of P1 is eroded by the time pupils have completed their P3 year. Unlike the comparisons between the small and normal classes where girls in Chinese and English generally do better, in the disadvantaged schools it is the boys who show most improvement initially and whose attitudes, although they decline year by year do so more slowly than do the girls’ dispositions.

62
13.8 The final set of questions examined other possible variables which might contribute to successful SCT. These contributions however were relatively small and their influence diminished as pupils moved through the primary school. Schools contributed a maximum of around 8% to the variation in scores in P1 and around 6% by the time pupils reached the end of the P4 year. Two of the strongest components of this school contribution were the degree of parental support and the active leadership of the Principal. The influence of parental support lessened as pupils moved from P1 to P4. When an analysis was undertaken which compared the most successful and least successful schools in the experimental sample it was more frequently the case that the mathematics lesson in the least successful schools would be taught by a teacher who had not taken the subject as his or her major/elective.
13.9 Very little evidence emerged from the analysis of different teaching approaches to suggest that one rather than another had a major effect on pupils’ academic progress. But teachers had begun to switch away from whole class instruction towards a mix of sustained individual and pair work with an emphasis on sustained enquiry, group work and more whole class discussion. Of these three alternative approaches that of cooperative group work appeared less successful in keeping all pupils fully occupied ‘on task.’ Teachers too often had pupils working on activities in groups where each participant had to await his or her turn to measure or write. In these circumstances the non-active pupils were often distracted when they were supposed to be listening or watching attentively. This problem can only be overcome if pupils have been trained to work in groups and if the ‘rules of group work’ are continually reinforced in briefing and debriefing sessions.
13.10 Teachers need different kinds of professional support at different stages. Initially when beginning to teach small classes the most useful support is from a mentor who can demonstrate certain easily replicated strategies, such as the use of daily talk to increase pupil participation. Once teachers have passed through this initiation stage they need support from outside consultants who can offer various examples of different approaches when teaching certain kinds of topic. The emphasis here should be on the planning rather than the generic pedagogy since at this consolidation stage teachers are extremely task orientated. Visiting other teachers’ classrooms and trying out each other’s practical ideas can also be very beneficial. The third stage, which so far only a few teachers that the consultant has observed and interviewed appear to have reached, is one of re-orientation where the emphasis is on the pedagogy which emerges out of the six principles. Learning circles appear to be the ideal mechanism for promoting this professional dialogue and the use of video to act as a stimulus for these discussions is a crucial element. That is not to say that learning circles are only suitable for teachers at the re-orientation stage; they can also be used for planning and for discussions about curriculum tasks. However, it is the highly reflective teachers who are likely to draw the most benefits from the ‘communities of learning’ that learning circles represent.
13.11 Because small classes are designed to increase pupil participation in the learning it is often the case that additional practical resource materials are required. Teachers in Hong Kong work longer hours than those in the West.

63
The most useful support for the teacher is therefore time; time to plan and to share with colleagues, time to supplement the textbook and its accompanying resources by materials which place the learning in contexts which are meaningful for pupils. The increased use of group and pair work also demands additional resources to support such activities. Principals therefore have to look for ways of helping to find time for teachers to engage in this kind of preparation. Offering more non contact time for professional development activities, having fewer but longer teaching periods and allowing teachers to specialize in certain levels so that they teach more than one class in a year group are all ways of reducing demands on teachers’ time. Whether, in the long term, a bank of resources, available through the individual schools’ intranet, should be created is a question for further consideration. At one extreme, as has happened in the UK, weaker teachers simply use the resource materials as an alternative textbook while in the hand of more imaginative practitioners the resources are adapted and added to. Schools’ collection of video extracts which illustrate the use of the six principles should certainly be of value both for inter and intra school discussions. Teachers can also help themselves by remembering that the school environment is often a useful resource so that in mathematics, for example, there are plenty of examples in the classroom and the school which illustrate, circles, rectangles and triangles. Pupils can also be a valuable resource in bringing examples from home which can be used to illuminate various lessons.
13.12 The above results do not suggest that smaller classes with between 20 and 25 pupils are of themselves a solution to some of the problems identified during the course of the study. They do not provide a solution to declining attitudes and motivation which are a global phenomenon in the more developed countries; as pupils move up the primary school their interest in core areas of the curriculum decline and the decline is greatest among pupils of higher ability. In Hong Kong this is true of Chinese suggesting that able pupils find the teaching and content of present lessons less than stimulating. Neither do small classes appear to deal with another global issue, that of boys’ underachievement, although in Hong Kong boys continue to outperform girls in mathematics. English for boys, particularly those born in the Mainland, presents formidable problems.
13.13 Nevertheless, teachers in the SCT study have, on the evidence, presented attempts to develop an array of alternative teaching strategies designed to maximise the potential of smaller classes. The very fact that they were engaged in finding ways of using such techniques such as group work and pair work in the context of Hong Kong classrooms may, in part, explain why gains in attainment, where they occurred, produced only small effect sizes. Research suggests that successful classroom innovation can rarely be achieved in less than five years. Yet despite limited success nearly all teachers in the study said that when faced with a smaller class they experienced less stress and a greater degree of professional comfort. This was true of both the first and second administration of the teachers’ questionnaire, even though during the intervening three years their workload appeared to increase slightly. Many will feel that these feelings alone provide sufficient justification for the extension of small classes to all schools in the near future.

64
14. Recommendations
14.1 A number of suggestions and recommendations have already been made for extending the work of the project in ways that would facilitate the effective introduction of SCT in all primary schools. The results which have emerged during this final year of fieldwork have if anything reinforced this earlier advice. It is clear that many teachers are still struggling to implement the kinds of classroom practice embodied in the principles set out in para 2.11 of this report. The effectiveness of these principles in bringing about improvements in pupils’ learning has been demonstrated empirically and much of this evidence has been summarised by Hattie (2005) and Hattie and Timperley (2007). But behind these pedagogic strategies there are also a series of propositions based upon cognitive theories of learning. These are briefly described at Appendix III.
14.2 There is strong evidence that one of main reasons why it is so difficult to implement pedagogic change of any kind is that teachers do not have a grasp of the underlying theories which support the use of certain teaching approaches. Often the terms used to describe some aspect of teaching are unclear and promote confusion rather than understanding; interactive whole class teaching being a case in point (Alexander 2008b:31-34). Without sufficient understanding teachers find it difficult to apply such principles in ways that suit the contexts of a particular classroom (Timperley et al. 20-07). The result is that when faced with a problem there is a tendency to abandon the new innovative approach and revert to previously well tried methods (Desforges 2003). This is what appeared to have happened in the English classrooms of the experimental schools where the experimentation in the first year was replaced in the second year by practices which were very similar to those used by teachers in normal classes in the control group. Gaining clear understanding of the theoretical principles governing the proposed changes in practice is what Coburn (2003) in a review of innovations which have successfully ‘gone to scale’ refers to as depth.
14.3 Yet teachers when questioned about professional development often say that what they value most are practical suggestions rather than theory. Thus they will happily respond to a workshop which explores ways of getting children to brainstorm ideas or to create mind maps without understanding that both these techniques embody theories of learning out of which comes a principle that exploration should generally precede instruction. Hong Kong teachers are no different from their colleagues elsewhere in that their responses to the teachers’ questionnaire in the present study tended to put the highest premium on practical support rather than on sharing ideas. Teachers in the case studies, for example, said that they found ‘hands on sessions’ more useful than the seminars.
14.4 The situation has become more difficult because of the nature of the leadership that most school Principals now offer. In the past two decades, for the best of motives, authorities all over the globe have moved to give schools greater autonomy. As a result Principals have taken on a vast array of administrative

65
duties that often find them working up to 70 hours a week during the school term (Galton and MacBeath 2008). One result of ‘devolved management’ to schools has been for headteachers to spend less and less time on curriculum matters (including the monitoring of teaching) and increasingly delegate such tasks to curriculum leaders. In this way distributed leadership has been transformed into delegated leadership. According to MacBeath (2008) today’s school leaders are often “more concerned with accounting than learning, with control than with teaching , with compliance than with risk-taking and with public relations than with the quality of student experience,” and Y. C. Cheng writing in the same volume, with his experience of Hong Kong schools, echoes some of these sentiments (Cheng 2008).
14.5 The shift to scale will not succeed in developing effective SCT unless ways can be found to encourage Principals to take a more active part in curriculum development. It is one of the messages of this present study where in the analysis of the most and least successful project schools active leadership was one of the identified factors. MacBeath (2008) describes this process as Leadership for Learning and cites (McLaughlin & Talbert 2001) in arguing that it requires a kind of collegiality which challenges rather than reinforces existing practice and which is based on the idea of learning as a cultural and social as well as a cognitive activity. In this sense learning is viewed as a collaborative, communicative and cooperative experience and, as such, it involves everyone; senior managers, teachers, support staff, pupils and parents. Only the school Principal is in a position to develop and encourage this learning culture throughout the school.
14.6 A second approach to introducing some understanding of the principles governing the development of expertise in SCT is to develop the kinds of professional development which embody the idea of communities of practice (Louis and Marks (1998); Watkins (2005); Stoll and Louis (2007). In the SCT study the learning circles have been an outstanding success and have done more than anything to wean teachers away from the idea that there is a repertoire of pedagogic skills that are unique to SCT. Thus a sensible future approach would be to adopt a mixture of professional development seminars, mainly for Principals and curriculum leaders and to continue to support the development of an increasing number of learning circles.
14.7 Some discussions of the above suggestions have already taken place with the school support team and others associated with the SCT study. Doubts were expressed as to whether the school support team had the time or the necessary theoretical background to support a large number of learning circles. An alternative therefore would be to base this activity within various University Education Departments. If this were to happen it would be important to ensure that staff who acted as mentors to the learning circles had gained familiarity with the guiding principles of the SCT study and were happy to endorse these even where different circles undertook different starting points by exploring issues of diversity rather than cooperative learning.
14.8 Indeed, the results of the past four years suggest, with hindsight, that there may have been some advantage in the learning circles if less emphasis had been placed initially on cooperative group work, even though this was the

66
stated priority of the participating teachers. This not only created the impression among the teachers outside the learning circles that this was what required to be done in small classes but it has also proved more difficult to adapt the principles and practices of cooperative learning into the context of the Hong Kong classroom, particularly in English where teachers often lacked sufficient confidence to depart from the textbook format. What evidence emerges from the analysis of teacher types suggest that a transition from whole class instruction to whole class ‘dialogic’ discourse, using a greater variety of questions, may be a better starting point. When this is coupled with the greater use of pair and individual enquiry, where there are more sustained interactions between teachers and pupils, mainly in the form of listening to the pupils’ explanations, there seems the likelihood of making more progress. Although little emerged from the attempt to link the teacher types with pupil progress it was these two teaching approaches (individual and pair sustained enquirers and whole class questioners) which appeared to improve pupils’ attitudes and motivation. Coupled with this finding was the result that pupils’ dispositions to learning regularly featured as a predictor of end of year attainment in the various regression analyses.
14.9 On the matter of pupil diversity, which teachers saw as a difficult problem, Principals should do their best to ensure that certain measures, which research has shown help teachers to cope with a wide range of ability, are in place. Among these are flexible forms of classroom organisation that allow teachers to change the structure and function of groups so that at times they can concentrate on slower learners while other pupils work independently. The use of peer tutoring is another worthwhile strategy. Pupils who find learning difficult also need to have work situated in contexts that are, as far as possible, meaningful in terms of their everyday lives. This implies less use of textbooks.
14.10 In their responses to the questionnaire teachers expressed considerable satisfaction with the technical support they received. However, there are some ways that the technical support could be enhanced. Visualisers proved particular useful in the plenary sessions after group work because they allowed pupils to present their results while facing the class. In other classes pupils were forced to hold up pieces of paper (or attach them to the black board with bluetak) which meant that when reading their results pupils had their backs to their classmates. Since pupils were often reluctant to speak out so that classmates could hear them this practice added to the communication difficulties. A more radical suggestion would be to bring back computers into the classroom rather than situate them in a dedicated laboratory. The internet has become a vital resource and the availability of wireless connections and cheaper laptops makes this a feasible option. As argued in para 13.11 teachers’ time is a key resource and marking pupils’ work and various other assessment tasks alone account for the difference in hours worked by primary teachers in England and those in Hong Kong. The sixth principle incorporating the ideas of ‘Assessment for Learning’ is designed to place less emphasis on assessment through homework using worksheets or questions from the textbook. At interviews, however, teachers often justified existing practice by saying that parent pressure made it difficult to reduce the amount of homework. It is clear that many parents have not understood the implications of the ‘Learning to

67
Learn’ reforms and judge the teachers effectiveness on the speed at which homework is set and marked. More is said in a later paragraph on freeing up teachers’ time but it seems clear that more needs to be done for parents to be re-educated as to the implications of SCT for the way that pupils learn.
14.11 Cordingley and Bell (2007:11) were previously quoted in summarising several systematic reviews on going from the pilot stage to full-scale implementation of an initiative. In the context of the above paragraphs it is worth repeating their main conclusion in which they identify a number of key factors which are an essential pre-requisite of successful pedagogic change. Added to their list are some comments (in italics) which relate specifically to the SCT study in Hong Kong.
Monitoring and evaluation systems that are inbuilt from the start and which focus on key elements, in this case the desired changes in classroom processes rather than concentrating solely outcomes. A simplified form of our observation system (attached at Appendix II) could be used for this purpose as well as Brophy’s 10 key features of teaching for understanding at Appendix III and schools’ collection of video extracts which illustrate the use of the six principles could also be used as starting point for discussion in the within- or between-school learning circles.
Active participation by the leadership. Not only should leaders set the goals and distribute resources, but they should involve themselves in both the monitoring and the discussions of how best to modify the innovation to suit the particular circumstances of the school. In this way leaders are better able to understand the difficulties experienced by teachers during the process of innovation and provide suitable advice and support. Professional development seminars should concentrate on Principals and curriculum leaders in developing the notion of leadership for learning, introducing the six key principles supporting SCT and providing the learning theory which underpins these principles. The study has demonstrated that communities of practice discussed earlier (para 6.10) are a vital ingredient in bringing about pedagogic change. The learning circles exemplify all that is best in this approach but for them to be successful teachers need to be provided with adequate time for sharing and reflection with colleagues and to feel that their Principal is exercising leadership in learning as well as being the organiser and provider of necessary resources. That is why active participation by Principals in such communities is important.
Networking and collaboration between schools in a spirit of co-construction where all participants identify and build on what they know and can do already as against a ‘best leading the rest’ approach. Each local group of schools should be encouraged to set up learning circles both within school and between schools so that one feeds off the other. These Circles should concentrate first on improving the quality of whole class discussion and the use of pair work rather than concentrating on more difficult to implement pedagogies such as collaborative group work.

68
A core team able to supply specialist support as required and to offer coaching where it is deemed necessary. Specialist coaching, should always aim to make secure the knowledge, beliefs and moral purposes that underpins the reform and to develop understanding of key principles (Joyce and Showers 2003), otherwise what is mastered will not be sustained. Members of the core team should be a mix of people with curriculum knowledge but also there should be some with an understanding of the psychological principles of learning and their consequences for teaching. In this way subject didactics, the use of certain teaching procedures such as, for example, brainstorming in science or mind mapping in mathematics, can be related to the principles set out at Appendix III. The core team could be supplemented by colleagues from University Departments of Education. Those chosen should understand the rationale behind the guiding principles of the SCT study and be willing to accept these as a working framework.
Dissemination of practices, materials and other resources. Learning circles within and between schools, being an effective means for professional exchange, should be encouraged to share materials and experiences.
14.12 A further recommendation concerns the use of the teachers’ time. The teacher questionnaire results show that workloads have slightly increased. This is one reason why learning circles have not had a greater impact because once back in their school teachers find it difficult to engage with colleagues about their reflections. Another reason is that teachers teach too many year groups and so have too few opportunities to improve on an idea by being able to teach the same lesson to a parallel class in the immediate future. It is this restriction that lies behind the request by many teachers in the SCT study to specialise by concentrating their teaching on fewer year groups. As far as possible, teachers should specialise in teaching lower or upper primary pupils with opportunities to teach more than one class in any age group.
14.13 Teachers also felt that 35 minute periods were too short to include worthwhile discussions as well as instruction. While many schools have some double periods in which teachers can do group work etc. others have introduced 45 minute periods with more possibilities for pupil participation. School Principals should review the school timetable to enable teachers to plan and implement lessons which allow greater amounts of pupil activity and communication.
14.14 Finally there is the question of Initial Teacher Education. While it is well recognised that novice teachers often become immersed in the particular school culture in which they do their practicum and adopt the practice of the school mentor, there is still a need to prepare them for teaching small classes in primary schools since these will soon be the norm. In some ways these novices with the support of their University tutors can act as agents of change. University Departments of Education therefore need to consider ways in which the findings from this study could be used to reinforce existing and future programmes on matters such as teaching for understanding, catering for diversity and helping pupils to develop as independent thinkers.

69
14.15 This final report must conclude with some words of thanks. First to the members of the Education Bureau (the senior and junior officers, members of the school support team) who have helped and encouraged me throughout this study. Second, members of the steering committee for cogent advice and, finally, and most of all, to the Principals and teachers in the participating Hong Kong schools who have shown such interest in the study and have been so welcoming on my visits to their schools and classrooms. I have learnt much from the experience of seeing lessons in Chinese and in mathematics as well as in English. I have greatly admired the dedication of these practitioners to the wellbeing of their pupils. As teachers, we all get our inspiration and willingness to ‘go the extra mile’ from those ‘magic moments’ when a pupil’s eyes light up at the point where ignorance is supplanted by genuine understanding. Sadly in recent years, particularly in the West, these magic moments have become fewer because of the emphasis placed on a narrow curriculum and on a notion of accountability which relies on frequent assessments and regular target setting. It is my hope that, over time, the implementation of SCT in Hong Kong primary schools will eventually encourage a more active, creative approach to learning and this will result in many more magic moments.

70
References Alexander, R (2008a) Towards Dialogic Teaching: rethinking classroom talk (4th Edition) Thirsk, North Yorkshire: Dialogos UK Ltd.
Alexander, R. (2008b) Essays in Pedagogy, London: Routledge.
Bennett, N. (1996) Class size in primary schools: perceptions of head teachers, chairs of governors, teachers and parents, British Educational Research Journal, 22 (1) 33-55 Biggs, J. (1994) What are Effective schools? Lessons from East to West, Australian Educational Researcher, 21: 19-40. Biggs, J. and Collis, K. (1982) Evaluating the Quality of Learning: The SOLO (Structure of Observed Learning Outcome) San Diego California: Academic Press Black, P. and Wiliam, D. (1998) Assessment and Classroom Learning, Assessment in Education, 5 (1): 7-75. Black, P., Harrison, C., Lee, C., Marshall, B. and Wiliam, D. (2003) Assessment for Learning: Putting it into practice, Maidenhead: Open University Press. Blatchford, P., Bassett, P. and Brown, P. (2005) Teachers’ and pupils’ behaviour in large and small classes: A systematic observation study of pupils aged 10 and 11, Journal of Educational Psychology, 97 (3): 454-467. Blatchford, P., Bassett, P., Goldstein, H. and Martin, C. (2003) Are class size differences related to educational progress and classroom processes? Findings from the Institute of Education class size study of children aged 5-7 years, British Educational Research Journal, 29 (5): 709-730. Blatchford, P. (2003) The Class Size Debate: Is small better? Maidenhead, UK: Open University Press. Blatchford, P., Goldstein, H., Martin, C. and Browne, W. (2002) A study of class size effects in English school reception year classes, British Educational Research Journal, 28 (2): 169-185
Bourke, S. (1986) How smaller is better: Some relationships between class size, teaching practices and student achievement, American Educational Research Journal, 23 (4): 558-571.
Bray, M. (2000) Double-Shift Schooling: Design and Operation for Cost-Effectiveness, Paris: International Institute for Educational Planning/UNESCO.
Brophy, J. (2004) Motivating Students to Learn, 2nd Edition, Mahwah, New Jersey: Lawrence Erlbaum
Buckingham, J. (2003) Class size and teacher quality, Educational Research for Policy and Practice, 2: 71-86.
Cheng, Y.C. (2008) New Learning and School Leadership: Paradigm Shift Towards the Third Wave, in J. MacBeath and Y.C. Cheng [Eds] Leadership for Learning: International Perspectives, London: Sense Publishers

71
Coburn, C. (2003) ‘Rethinking Scale: Moving beyond numbers to deep and lasting change, Educational Researcher, 32 (6): 3-12.
Cordingley, P. and Bell, M. (2007) Transferring Learning and Taking Innovation to Scale, An Innovation Unit Think Piece (www.innovation-unit.co.uk)
Cuban, L. & Tyack, D. (1995) Tinkering towards Utopia: A century of public school reform, Cambridge, MA: Harvard University Press.
Cohen, J. (1988) Statistical power analysis for the behavioral sciences. Hillsdale, New Jersey: Earlbaum,
Desforges, C. (2003) ‘On learning and teaching’ in Learning Texts, Nottingham: National College for School Leadership (NCSL) at [www.ncsl.org.uk.]
Edwards, D. and Mercer, N. (1987) Common Knowledge and the development of understanding in the classroom, London: Routledge.
Evertson, C and Folger, J. (1989) Small class-large class; What do teachers do differently? Presentation at the American Educational Research Association (AERA) Annual Meeting, San Francisco.
Finn, J., Gerber, S. and Boyd-Zaharias, J. (2005) Small classes in the early grades, academic achievement and graduating from High School, Educational Psychology, 94 : 214-233. Finn, J. and Achilles, C. (1999) Tennessee’s class size study: Findings, implications, misconceptions, Educational Evaluation and Policy Analysis, 21 (2): 97-109.
Finn, J., Pannozzo, G. and Achilles, C. (2003) ‘The Why’s of Class Size: Student behaviour in small classes, Review of Educational Research, 73 (3): 321-68.
Fuller, B. (1987) What school factors raise achievement in the third world? Review of Educational Research, 57 (3): 255-292.
Gage, N. (1978) The Scientific Basis for the Art of Teaching, New York: Teachers College Press.
Galton, M. (2007) Learning and Teaching in the Primary Classroom, London: Sage Publications.
Galton, M. and MacBeath, J. (2008) Teachers under Pressure? London: Sage Publications
Galton, M, Gray, J & Rudduck, J (2003) Transfer and Transitions in the Middle Years of Schooling (7-14) Continuities and Discontinuities in Learning, Research Report RR443, Nottingham: DfEE Publications
Galton, M., Hargreaves, L., Comber, C. and Wall, D. (1999) Inside the Primary Classroom: 20 years On, London: Routledge.
Galton, M., Simon, B. and Croll, P. (1980) Inside the Primary Classroom. London: Routledge & Kegan Paul
Good, T. and Brophy, J (2002) Looking in Classroom, 9th Edition, Boston: Allyn & Bacon
Hanushek, E. (1999) Some findings from an independent investigation of the Tennessee STAR experiment and from other investigations of class size effects, Educational Evaluation and Policy Analysis, 21 (2): 143-163.

72
Hargreaves, L., Galton, M. and Pell, A. (1998) The effects of changes in class size on teacher-pupil interactions, International Journal of Educational Research, 29 (5): 779-795.
Harnischfeger, A and Wiley, D (1978) ‘Conceptual Issues in models of School learning,’ Curriculum Studies, 10 (3): 215-31.
Hattie, J. (2005) The paradox of reducing class size and improving learning outcomes, International Journal of Educational Research, 43 (6) 387-425.
Hattie, J. and Timperley, H (2007) The Power of Feedback, Revue of Educational Research, 77 (1):81-112.
Joyce, B. and Showers, B. (2003) Student Achievement through Staff Development, 3rd Edition, London: Longman.
Kutnick, P., Sebba, J., Blatchford, P., Galton, M. and Thorp, J. with MacIntyre, H. and Berdondini, L. (2005) The Effects of Pupil Grouping: Literature Review, Research Report 688, Nottingham: DfES Publications.
Louis, K. and Marks, H. (1998) Does professional community affect the classroom? Teachers’ work and student experiences in restructured schools, American Journal of Education,106 (40): 532-75.
MacBeath, J. (2008) Leadership for Learning: exploring Similarity and Living with Difference, in J. MacBeath and Y.C. Cheng [Eds] Leadership for Learning: International Perspectives, London: Sense Publishers
McClelland, D. (1963) On the Psychodynamics of Creative Physical Scientists in Gruber, M. et al., (eds) Contemporary Approaches to Creative Thinking, New York: Atherton.
McLaughlin, M. and Talbert, J. (2001) Professional Communities and the work of high school teaching, Chicago, Ill: University of Chicago Press. Molnar, A. , Smith, P., Zahorik, J., Palmer, A., Halbach, A. and Ehrle, K. (1999) Evaluating the SAGE programme: A pilot programme in targeted pupil-teacher reductions in Wisconsin, Educational Evaluation and Policy Analysis, 21 (2): 143-163. Nye, B., Hedges, L. and Konstantopoulos, S (1999) The long term effect of small classes on academic achievement: The results of the Tennessee class size experiment, Educational Evaluation and Policy Analysis, 21 (2): 127-142. Robinson, V. (2007) School Leadership and Student outcomes: Identifying what works and why, Australian Council for Educational Leaders (ACEL) Monograph No. 41, PO Box 4268, Winmalee, NSW, Australia. Shapson, S., Wright, E., Easom, G and Fitzgerald, J. (1980) An experimental study of the effects of class size, American Educational Research Journal, 17 (2):141-152.
Stoll, L. and Louis, K. [Eds] (2007) Professional Learning Communities: Divergence, Depth and Difficulties, Maidenhead: Open University Press.

73
Timperley, H., Wilson, A., Barrar, H. and Fung, I (2007) Teacher Professional Learning and Development: Best Evidence Synthesis Iteration, Wellington, NZ: Ministry of Education.
Tomlinson, T. (1990) Class size and public policy: The plot thickens, Contemporary Education, 62 (1): 17-23.
Watkins, C. (2005) Classrooms as Learning Communities: What’s in it for schools? London: Routledge.
Yair, G. (2000) ‘Educational Battlefields in America: The tug of war over students’ engagement with instruction’, Sociology of Education, 73 (2): 247-269.

74
Appendix I
Administration Plan for Tests/Student Questionnaires
2004/05school year
P1(Pre-P1 test in mid Oct 04 P1-end test/Q in June 05)
P2(P1-end test in early Dec 04
P2-end test in June 05)
P3(P2-end test in early Dec 04
P3-end test in June 05)
2005/06school year
P1(Pre-P1 test/Q in mid Sept 05
P1-end test/Q in June 06)
P2(P2-end test/Q in June 06)
P3(P3-end test/Q in June 06)
2006/07school year
P1(Pre-P1 test/Q in mid Sept 06
P1-end test/Q in June 07)
P2(P2-end test/Q in June 07)
P3(P3-end test/Q in June 07)
P4(P4-end test/Q in June 07)
2007/08school year
P2(P2-end test/Q in June 08)
P3(P3-end test/Q in June 08)
P4(P4-end test/Q in June 08)
Note: Solid-line boxes represent the experimental groups in small class. Double-solid-line boxes represent the experimental groups to continue their study in regular class at P3/P4. Dotted-line boxes represent the control groups, i.e. the cohorts of pupils not in small class.
2006/07school year
#P1(Pre-P1 test/Q in mid Sept 06
P1-end test/Q in June 07)
#P2(P1-end test/Q in mid Sept 06
P2-end test/Q in June 07)
#P3(P2-end test/Q in mid Sept 06
P3-end test/Q in June 07)
2007/08school year
#P2(P2-end test/Q in June 08)
#P3(P3-end test/Q in June 08)
#P4(P4-end test/Q in June 08)
37 Experimental Schools
15 Reference Schools# 15 reference schools will be included to provide an external reference for comparing the growth of students' academicperformance in P1 to P4 in schools of regular class size.

75
Appendix II
TEACHER OBSERVATION RECORD School : ………………………….…….… Yr: …………… Class:……….…. Date: …………………….… Name of Tchr: …………………………… Tchr: m1/f2 Curric area: Eng1 Math2 Chin3 Class Size: ………………… Pupils grouped by: achvmt: mixed1 same2 / friendship3 / gender4 Other Adults: Team tchr1 Net tchr2 Tchg Asst3 Other4 ……………...……
Conversation categories (I/a column) I/a L/w Au Time QUESTIONS (pupil answers by) 0.30 1 recalls facts 1.00 2 offers idea/solution (closed: one correct answer) 1.30 3 offers idea/solution (open: several possible answers) 2.00 4 refers to task supervision (how task is progressing etc) 2.30 5 refers to routine matter (clearing up, behaviour etc) 3.00 STATEMENTS 3.30 6 of fact (including demonstration, blackboard) 4.00 7 of ideas 4.30 8 of task directions (tells pupil/s what to do) 5.00 9 of correcting feedback (corrects work) Turn Overleaf for Pp Observation
10 of informing feedback (discusses work, pupils' ideas) 0.30 11 of behavioural feedback (comments on pupils' behaviour) 1.00 12 of routine directions (tidying up, collect homework etc) 1.30 2.00
Listening and watching categories (L/w column) 2.30 1 listening to pupil report or explain 3.00 2 listening to pupil read from book/text etc 3.30 3 silently watching pupil/s working 4.00 4.30
Teacher’s audience (Au column) 5.00 1 individual boy pupil Turn Overleaf for Pp Observation
2 individual girl pupil 0.30 3 boy for group 1.00 4 girl for group 1.30 5 boy for class 2.00 6 girl for class 2.30 7 pair 3.00 8 whole group 3.30 9 whole class 4.00 10 sustained into next time unit 4.30 5.00 Remarks:

76
PUPIL OBSERVATION RECORD
PLEASE TURN OVERLEAF FOR TEACHER OBSERVATION
(1) Target’s Name: ……………………………… Target’s Class No.: …………… STRN: ………………… Gender: M/F Ability: H/L TARGET PUPIL ACTIVITY TARGET-ADULT ACTIVITY TARGET-PEER ACTIVITY 1
Tgt’s beh 2 Tgt’s loc
3 Tchr’s activity
4 Seating
5 Mode of Working
6 Tgt’s role
7 Adult
8 Content
9 Setting
10 Tgt’s role
11 Mode
12 Task
13 Gender Time
1 0.30
2 1.00
3 1.30
4 2.00
(2) Target’s Name: ……………………………… Target’s Class No.: …………… STRN: ………………… Gender: M/F Ability: H/L
TARGET PUPIL ACTIVITY TARGET-ADULT ACTIVITY TARGET-PEER ACTIVITY 1
Tgt’s beh 2 Tgt’s loc
3 Tchr’s activity
4 Seating
5 Mode of Working
6 Tgt’s role
7 Adult
8 Content
9 Setting
10 Tgt’s role
11 Mode
12 Task
13 Gender Time
1 0.30
2 1.00
3 1.30
4 2.00
PLEASE TURN OVERLEAF FOR TEACHER OBSERVATION
(3) Target’s Name: ……………………………… Target’s Class No.: …………… STRN: ………………… Gender: M/F Ability: H/L
TARGET PUPIL ACTIVITY TARGET-ADULT ACTIVITY TARGET-PEER ACTIVITY 1
Tgt’s beh 2 Tgt’s loc
3 Tchr’s activity
4 Seating
5 Mode of Working
6 Tgt’s role
7 Adult
8 Content
9 Setting
10 Tgt’s role
11 Mode
12 Task
13 Gender Time
1 0.30
2 1.00
3 1.30
4 2.00
(4) Target’s Name: ……………………………… Target’s Class No.: …………… STRN: ………………… Gender: M/F Ability: H/L
TARGET PUPIL ACTIVITY TARGET-ADULT ACTIVITY TARGET-PEER ACTIVITY 1
Tgt’s beh 2 Tgt’s loc
3 Tchr’s activity
4 Seating
5 Mode of Working
6 Tgt’s role
7 Adult
8 Content
9 Setting
10 Tgt’s role
11 Mode
12 Task
13 Gender Time
1 0.30
2 1.00
3 1.30
4 2.00
PLEASE TURN OVERLEAF FOR TEACHER OBSERVATION
TARGET PUPIL ACTIVITY
1. TARGET’S BEHAVIOUR 2. TARGET’S LOCATION 3. TEACHER’S ACTIVITY 4. SEATING 5. MODE OF WORKING
1 ON TASK 2 ROUTINE 3 DISTRACTED 4 PARTIAL 5 OTHER
1 IN 2 OUT 3 MOBILE
1 T PRESENT 2 T ELSE 3 T MONITOR 4 T HOUSESKEEPING
1 ALONE 2 PAIR 3 GROUP 4 FLOOR/FRONT 5 CHANGE/MOVE
1 INDIVIDUAL 2 PAIR 3 GROUP 4 CLASS
TARGET-ADULT ACTIVITY
6. TARGET’S ROLE 7. ADULT INVOLVED 8. CONTENT 9. SETTING
1 INITIATE 2 STAR 3 PART
1 TEACHER 2 CLASS ASSIST 3 NET 4 OTHER
1 TASK WORK 2 ROUTINE 3 FBACK EFF 4 FBACK + /-
1 TGT IND ATTENTION 2 IND for GROUP 3 IND for CLASS 4 GROUP 5 CLASS
TARGET-PEER ACTIVITY
10. TARGET’S ROLE
11. MODE OF CONTACT 12. TASK 13. GENDER
1 BEGINS 2 RESPONDS 3 TRIES 4 IGNORES 5 SUSTAINS
1 VERBAL 2 OTHER
1 SAME 2 DIFFERENT
1 SS 2 OS 3 SEVERAL

77
TARGET PUPIL ACTIVITY Category Item Definition
1. Target’s Behaviour 1 ON TASK 2 ROUTINE 3 DISTRACTED 4 PARTIAL 5 OTHER
Fully engaged on task Fully engaged on routine work ( e.g. tidying, sharpening pencil, etc) Totally distracted Partially on-task Other behaviour (e.g. Waiting for adult’s attention, watching adult/s interact with others)
2. Target’s Location 1 IN 2 OUT 3 MOBILE
Target in base Target out of base but not moving Target moving around classroom
3. Teacher’s Activity 1 T PRESENT 2 T ELSE 3 T MONITOR 4 T HOUSEKEEP
Teacher presents with target through proximity or interaction. Teacher is interacting with other pupils / whole class. Teacher watches pupil/s. Teacher is housekeeping (tidying, handing out books/paper/materials).
4. Seating (physical arrangement) - what the teaching is expecting the target to do
1 ALONE 2 PAIR 3 GROUP 4 FLOOR/FRONT 5 CHANGE/MOVE
Target sits at desk/table alone. Target sits in pairs at desk/table. Target sits in a group at tables/desks. Target sits/stands at front of class on floor/chairs etc. Target changes seating pattern (e.g. from alone to pair or moves around with permission)
5. Mode of Working – how the teacher is expecting the target to work
1 INDIVIDUAL 2 PAIR 3 GROUP 4 CLASS
Target is expected to work on his own. Target is expected to work in pair. Target is expected to work in group. Target is expected to work with the whole class.
TARGET- ADULT ACTIVITY Category Item Definition
6. Target’s Role
1 INITIATE 2 STAR 3 PART
Target attempts to interact with teacher/adult. Target is the focus of the teacher/adult’s attention. Target is part of the teacher/adult audience.
7. Adult Involved
1 TCHR 2 CLASS ASST 3 NET 4 OTHER
Teacher involved Classroom assistant involved Native English teacher involved Other adult involved (headteacher/ SEN teacher)
8. Content 1 TASK WORK 2 ROUTINE 3 FBACK EFFORT 4 FBACK CORR
Interaction concerns task work/supervision Interaction concerns classroom management/control Interaction gives feedback which refers to effort Interaction gives feedback on work 4+ =praise; 4- = criticism
9. Setting 1 TGT IND ATT 2 IND for GROUP 3 IND for CLASS 4 GROUP 5 CLASS
Teacher/Adult gives target individual attention (group/class not required to attend). Teacher/Adult gives individual attention but group required to attend. Teacher/Adult gives individual attention but class required to attend. Teacher/Adult interacts with group with no child in focus. Teacher/Adult interacts with class with no child in focus.
TARGET-PEER ACTIVITY Category Item Definition
10. Target’s Role
1 BEGINS 2 RESPONDS 3 TRIES 4 IGNORGES 5 SUSTAINS
Target begins new contact with pupil/s. Target responds to attempted contact by pupil/s. Target unsuccessfully attempts to make contact with pupil/s. Target ignores attempted contact by pupil/s. Target sustains contact into next time unit.
11. Mode of Contact
1 VERBAL 2 OTHER
Interaction involves speaking. Interaction involves physical contact (touching), gesture (nodding) or materials (sharing colouring pencils) but no speaking.
12. Task 1 SAME 2 DIFFERENT
Other pupil/s working on same task as target Other pupil/s working on different task as target
13. Gender 1 SS 2 OS 3 SEVERAL
Target interacts with pupil of same sex. Target interacts with pupil of opposite sex. Target interacts with more than one pupil.

78
Learning for TeachingAppendix III
3
In Section 2 of this report the six key principles of classroom practice, which have been used to guide the school support team’s approach to maximising the advantages of smaller classes, were enumerated. Support for these principles was found from the empirical evidence drawn from various meta analysis which have been summarised by Hattie (2005) and Hattie & Timperley (2007). However, these ideas also rest on certain assumptions about how pupils learn because any theory of learning carries with it implications for teaching (Simon 1981, (2008a). Thus in defining pedagogy as the science of the art of teaching Gage (1978) argues that the science of teaching derives from ideas about learning, while the art of teaching consists of the teachers’ attempts to put these ideas into practice in a variety of different classroom contexts. The latter is what we generally refer to as the teachers’ craft knowledge. Charles Deforges, an ex-primary teacher and leading researcher on these matters, observes that schools would be even more successful in developing these principles that Simon called for nearly three decades ago, if we could all learn to “share and use the knowledge we have about learning”. Deforges accepts that there is a vast body of knowledge of learning which emerges from the everyday practice of teachers, but he observes that this knowledge is difficult to get at and therefore difficult to share. Thus we cannot base our ideas about pedagogy solely on teachers’ craft knowledge. But Desforges also observes that there is a small but strong body of scientific knowledge about learning to be gleaned from psychological research. However, he argues that while this knowledge is easy to get it is difficult to apply. He therefore suggests that the trick we need to perform is to bring the practical knowledge of teachers and the theoretical knowledge of researchers together in order to promote advanced teaching practices (Deforges 2003:14). One of the earliest attempts to link different theories of learning to particular teaching approaches was undertaken by Joyce and Weil (1972). These authors devoted specific chapters to various interpretations of learning, and then illustrated their use from transcripts of actual lessons in which teachers either deliberately or intuitively made use of these particular ideas. Joyce and Weil make the point at the outset of the book that attempts to compare one teaching method with another or to fashion one overall general teaching method have a chequered history. Comparative studies generally show, these authors claimed, “that differences between different approaches are for specific objectives” and they go on to say “that although the results are very difficult to interpret the evidence to date gives little encouragement to those who would hope that we have identified a single reliable multi-purpose teaching strategy as the best approach.”(Joyce and Weil, 1972:8). Because researchers have developed a multitude of different ways of representing the processes that we describe as learning, Joyce and Weil begin by defining what they term a number of families of models. Although these different families are not mutually exclusive, they do represent distinct approaches to learning and teaching according to Joyce and Weil. There are, for example, models based on theories
3 The appendix is based on extracts from Chapters 3 and 4 in Galton, M. (2007) Learning and Teaching in the Primary Classroom, London: Sage Publications.

79
about information processing or behaviour, others which draw upon ideas about social interaction, and models which tend to emphasise the development of personal understanding and self-actualisation. The task of linking these families of models with a specific repertoire of teaching activities results in a series of networks that are extremely complex. For example in the information processing category are listed seven alternative/complementary approaches, in the social interaction five, and in the personal models a further five. Recognising that such a degree of complexity was likely to limit the take up of these ideas a simpler version was created (Joyce et al., 1997). However, it still remains a complex and rather formidable task for teachers to master the intricacies of all the different combinations. Ways of knowing For the above reasons Galton (2007) has argued that a more useful starting point, from a practitioner’s point of view, might be to consider the kinds of knowledge demands which different tasks make upon the learner, and then to select an appropriate model of learning from the many which seeks the inculcation, accumulation or development of this particular kind of knowledge. The starting point of this analysis is a simple three part typology, which was constructed by Patricia Alexander and her colleagues, and was based on a synthesis of a number of articles in educational journals concerning the different ways that the authors wrote about knowledge when referring to learning, (Alexander et al 1991). These researchers argued most knowledge acquisition involved procedural, conceptual or metacognitive knowledge. Procedural knowledge is defined as more than ‘knowing what’ or the acquisition of new facts or new skills (usually called declarative knowledge). It also involves knowing how,’ that is the ability not only to locate new information but also in which circumstances to make use of it (conditional knowledge). In today’s primary classroom, where the use of the world-wide web is fairly commonplace, the ability to locate information, restructure it for a particular purpose, and then to use it to illustrate a point or principle would encompass this kind of procedural knowledge. Conceptual knowledge, Alexander et al’s second over-arching category, concerns the knowledge of ideas, the way they function and the conditions in which they should be used. The term refers, by implication, to complex and often non-linear knowledge structures, unlike some simple mathematics or science concepts where the different parts constitute the definition of a whole (e.g. simple fractions or states of matter). A key process in the acquisition of conceptual knowledge is the capacity to recognise instances of belonging and not belonging to a given class which defines the concept, as in the ability to understand what constitutes a mammal and what one does about creatures such as whales. Because there are often a potentially large number of characteristics which can be used to define any classification we often create sub-categories which Alexander et al. (1991) term domain knowledge. Concepts which are central to a specialised field of study then become part of discipline knowledge. The final component of conceptual knowledge is the ability to convey these ideas to others. This involves knowledge about the use of appropriate language (discourse knowledge). Within the framework of a given discipline, it is also necessary to use a form of words that allows meaning to be conveyed as propositional statements. This has to be done in ways which make use of knowledge of the language registers that are appropriate for a given audience. Alexander et al. (1991) defines knowledge of the

80
available and relevant styles of spoken and written communication as syntactic and rhetorical knowledge respectively. The third part of the typology, metacognitive knowledge concerns the capacity to be aware of one’s cognitive processes and an ability to regulate or manage this process unaided. According to Pintrich (2002:219) metacognitive knowledge involves “knowledge about cognition in general as well as awareness of and knowledge about one’s own cognition.” In recent years, the renewed interest by psychologists into this aspect of learning stems from the key part such knowledge plays in “helping students become responsible for their own cognition and thinking.” Pintrich makes the point that this interest is common to most theoretical approaches to learning and development:
“From neo-Piagetian models, to Vygotskian and cultural or situated learning models, regardless of their theoretical perspectives researchers agree that with development students become more aware of their own thinking as well as more knowledgeable about cognition in general. Furthermore, as they act on this awareness the tend to learn better…The labels for this general development tend to vary from theory to theory, but they include the development of metacognitive knowledge, metacognitive awareness, self-awareness, self-reflection and self-regulation.” (Pintrich 2002: 219)
Metacognition also involves what Shulman (1986; 1987) has called strategic knowledge, or the ability to recognise what is an acceptable form of cognitive processing within a given domain or discipline and what does not conform to these rules. In science, for example, to test a given proposition we may need to design an experiment that controls for other interfering variables in the form of a fair test. Alexander et al. (1991) argue that beside strategic knowledge (i.e. knowledge of appropriate and legitimate strategies) there must also be self-knowledge. This form of knowledge concerns the learner’s capacity to regulate their cognitive processing and involves an ability to recognise errors and to monitor one’s thinking. These various strands of the typology can be presented in diagrammatic form by way of a summary of Alexander et al’s (1991) schema.
A Typology of Knowledge Acquisition
Types of Knowledge
Procedural (Knowing what +
Knowing how)
Conceptual (Development of ideas: their
function & use)
Metacognitive (Self- regulation of cognitive
processes)
Declarative knowledge
+
Conditional Knowledge
Domain knowledge Discipline knowledge
+
Discourse knowledge = syntactic + rhetorical
knowledge
Strategic knowledge
+
Self- knowledge

81
A framework for learning? During this process of acquiring these three different types of knowledge there must be a shift in the way that information is processed. At the core of this transformation, according to Bereiter (1991) is a distinction between learning as an additive process and learning as reorganisation. This view is in some ways very similar to the model of learning put forward by Bennett et al. (1984) in their attempt to determine how well primary teachers matched tasks to their pupils’ immediate needs. Among various categories these researchers distinguished between tasks that were designed to provide pupils with new knowledge in incremental steps and those that taught them to restructure existing knowledge so that problems could be examined in new ways or pupils could discover rules or ideas for themselves. Within Alexander et al’s (1991) typology, which to a degree appears also to be a hierarchy, children move from a point where they acquire knowledge that is already known by others, to a point where they can order that knowledge within particular frameworks, to a further point where they can, without too much assistance, interrogate their own thought processes in creating their personal frameworks or restructuring existing ones. It is in this sense therefore that pupils eventually become “metacognitively wise.” Alexander (this time Robin), (2001: 344) is unhappy with some of Patricia Alexander’s definitions. He criticises, in particular, the use of procedural knowledge as a ‘catch all’ term. He prefers to separate knowledge acquisition (declarative knowledge) from knowledge of routines, which can be defined as knowing where to gain such knowledge and how best to use it (conditional knowledge). One of the reasons why Robin Alexander is keen to sub divide procedural knowledge is because his interest in classroom discourse leads him to emphasise the importance of Edwards and Mercer’s (1987) distinction between principled and ritual knowledge. Edwards and Mercer point out that one purpose of teaching rules and relationships is to lead pupils to an understanding of certain principles (the way certain kinds of knowledge are organised) which belongs to the second of Patricia Alexander’s typology categories of knowledge as conceptualisation. But learning a rule can also lead to merely repetitive performance in which the rules or procedures are memorised but cannot be applied in novel settings in a way that would support deeper understanding. Desforges (2003: 20) illustrates this by a story of a teacher who taught vocabulary by writing words and their definitions on the board and then getting the children to memorise everything that he had written. In the next lesson, as a practice/extension task, the class were asked to make up a sentence using the new vocabulary. One of the words on the list was ‘stimulate’ which the teacher had defined as to ‘stir up.’ One pupil wrote as her sentence, ‘Mother stimulated the soup.’ There is obviously a case to be made for sometimes learning rules as a series of rituals such as, for example, learning the 10 times table. One of the key differences noted by the author when sitting in P1 classes in Hong Kong in comparison with UK classrooms is the extensive time taken over learning definitions and rules in the first years of formal schooling. In one classroom, for example, a whole 60 minute lesson was devoted to identifying the key characteristics which define rectangles. Children were encouraged to bring various empty packages (fruit juice cartons, washing powder etc.) from home, draw around the outlines and identify the rectangular shapes. The next lesson investigated the special case of the square, the next irregular rectangular shapes. In another class, the children played a variety of number games designed to create fluency in counting and manipulating numerals from one to ten.

82
Hong Kong pupils top the international league tables in mathematics, yet from an English perspective these lessons appeared to ‘over-teach’ these topics. Similar examples to the Hong Kong approach can be found in some continental European countries. In Switzerland, for example, children entering the primary school after the age of six and a quarter spend much of the first year mastering the decimal number system in performing the four basic arithmetic operations (addition, subtraction etc.). The evidence suggests that this initial extended concentration on manipulating numbers, much of it through rapid oral question and answer sessions, pays off later on where 11 year old Swiss pupils were observed successfully completing tasks that are generally set for Year 14 in England (Prais 1997). There is, of course, no way of knowing how an individual pupil perceives rules and procedures other than when he or she comes to use them. We know from the study of experts, and by definition experts must be metacognitively wise, that they have a principled understanding of rules whereas the less competent performer generally has a ritualised one Berliner (1994). Competent performers typically go through a recitation of the rules and by a process of trial and error attempt to find the one which applies in a given case. Experts, on the other hand, seek to reconceptualise the problem in ways which allow them to identify the most appropriate rule to apply. The latter process is much faster and explains why Grand Masters at chess can take on and often beat the computer. Thus making the distinction between principled and ritualised knowledge, while useful in the analysis of discourse and for helping teachers to think about the way a task should be structured, doesn’t in practice require changes in Patricia Alexander et al’s (1991) typology provided, as is implied by these writers, that the three categories are viewed as part of a continuum. This is because, for Patricia Alexander, the acquisition of declarative knowledge involving rules or routines are a means to an end (that end being to make pupils metacognitively wise) so that her main concerns are with principled rather than ritual knowledge. Further, from the point of view of developing an appropriate pedagogy for teaching rules and routines it matters little whether the desired outcome is to promoting Bereiter’s (1991) ‘additive learning’ (as with learning the ten times table) or learning as ‘reorganisation’ (as with teaching vocabulary definitions of words such as stimulate to use in sentences) since the principles of instruction are much the same. Learning as information processing That being said, there seems a remarkable degree of agreement, as Desforges (2003) has claimed, concerning the implications for teaching what Patricia Alexander et al. (1991) term procedural knowledge. At its simplest, learning can be conceived as a series of outcomes which result in an enduring change in knowledge or skill as a result from exposure to some experience. These outcomes are then committed to memory. Bredo (1997) has claimed that this kind of learning is underpinned by behaviourist theories, because it envisages the knowledge to be acquired can be broken down into small steps and a degree of reinforcement can then be provided at various points along the way whenever success has been achieved. Such learning is also said to be associationist because one important technique for retaining this new knowledge in the memory is to build up chains whereby certain stimuli produce specific responses. Watkins (2003) describes this process as “learning is being taught” or LBT for short.

83
More generally the kinds of processes used to acquire this form of learning can be encompassed within a general model known as information processing. According to Meadows (1993, p 213) the term is a collective noun for a series of explanations about how children use certain cognitive processes in order to process information that they acquire. The early theorists such as Atkinson and Shiffrin (1968) suggested a parallel existed with computer hardware and computer software in their account of the memory system and distinguished between the memory structure, which is analogous to the computer hardware, and the manner in which the memory is controlled which is analogous to the software. Successful learning therefore depends ultimately on the speed of operation and the memory capacity. According to this simple model, the mind like a digital computer has both short and long term memory stores and a central processing unit. The unit exercises executive control by utilising specific procedures and routines when solving particular problems. Many of these problems in computing are solved by a process of approximation and iteration. With the latter procedure, the first solution is arrived at by guesswork, perhaps on the basis of previous experience. This guess is then used for the initial calculation and the result fed back into the programme to provide a better solution. The result of this second calculation is again put back into the system and the process goes on till very little improvement can be detected in successive iterations. This process of successive iteration clearly has parallels with the view of thinking adopted by Bennett et al (1984) which they termed restructuring and tuning. Central to the theory is the idea of rehearsal (or practice) Meadows 1993:213) which enables information to be retained in the working memory (analogous to the central processor) for longer periods of time, and makes it more likely that it will be retained in the long-term memory store for subsequent retrieval. Classroom studies by Alton-Lee & Nuthall (1992) and Nuthall (2000, 2004) have supported and developed these ideas regarding the function of the working memory. He and his research partner, Adrienne Alton-Lee, a former primary teacher, found that information that was relevant for successfully answering multiple-choice test items correctly was unlikely to be retained for more than two days, unless linked to other representations already in the working memory or which again entered the memory on the subsequent day. These researchers also found that pupils could generate simple constructs when there was an appropriate mix in the working memory consisting of a combination of specific information, generalisations, visual stimuli, word meanings and skills. In any one instance, the most effective combination depended on the task demand so that a test question asking pupils to write down the temperature recorded on an accompanying picture of a thermometer was more likely to be answered correctly if the pupil had experience of carrying out the practical procedure of measuring temperature. This brief account is a relatively simple presentation of the main ideas behind the information processing models of cognition, but nevertheless sufficient to meet the aim of establishing some general principles of teaching based on this working model of how pupils learn. As Meadows (1993: 223) argues, while the models work well for “tasks which require conscious effort and strategic thought,” they are less helpful in explaining tasks which children in the nursery appear to perform spontaneously (e.g. building a tower out of rectangular blocks). Perhaps more crucially in the search for suitable working theories of learning, information processing fails to account for, what might be termed ‘instantaneous restructuring,’ where one’s ideas are
84
transformed in a moment of inspiration rather than through the process of iteration discussed earlier. Learning as constructing and reconstructing knowledge This leads to the second possible working theory of learning based on the idea of constructivism. Whereas the computer analogy tends to see the take-up of information as a somewhat passive activity, at least initially, the constructivist approach regards the process as an interactive one. According to Piaget, for example, new information interacts with what we already know in two main ways. First, the new information is modified so that the brain can assimilate what we all ready know and second, what we know already is modified to accommodate this new information. Thus in the earlier example of classification the pupil may well include a whale within the category of mammals because of similarities in the way its offspring are produced and reared, while ignoring the other characteristics that would associate it more closely with fish and other water creatures. Once, however, these latter characteristics are taken into account it becomes necessary for the pupil to modify the original conception of what constitutes a mammal, because of the cognitive conflict that arises when all the salient features of the whale are identified. This kind of learning has been described as an active process of sense making. According to Conner (2004) “learning is determined by what goes on in children’s heads and with how they make sense of the world. They do this by relating experience to existing organised concepts and principles which vary with each individual’s past experience”. In this approach the process of gaining new knowledge (or applying that new knowledge to different contexts) is seen as actively constructing and then reconstructing one’s ideas. The process involves relating these new experiences to existing concepts which in turn are conditioned by previous experience. Watkins (2003) taking a similar approach also describes this kind of learning as individual sense making or LIS for short. In contrast to LBT there is therefore no assumption at the outset that the learner is essentially a blank canvas or an empty container into which new knowledge must the programmed. Instead, the starting point is a belief that each individual has partial understanding of the world which s/he brings to every new experience. Thus in one lesson on evaporation for a class of 10 year olds the author placed a full glass of water onto a hot radiator at the start of the school day. By the afternoon some of the water had disappeared. To the question, “Where has the water gone?” the pupils offered a variety of answers among which were, “You drank it Sir!” “The glass has got bigger.” and “Some of the water has escaped into the air.” In this situation, therefore, the teacher needs to find a starting point that takes account of individual pupil differences, unlike the simple information processing model where a definition of evaporation would be presented to the class either verbally or more probably by means of a demonstration. One metaphor which has been used to describe the role of the teacher within this constructivist framework is that of ‘teacher as a gardener’ since primary teachers are very fond of horticultural metaphors (Cortazzi 1991). Successful gardeners are skilled at planting seeds in suitable soil and aiding propagation by a combination of judicious watering and the application of fertiliser. In the same way teachers are seen to foster this process of construction and reconstruction by providing the necessary stimulating environment (soil conditions) offering well thought-out

85
interventions (judicious watering) and engaging in supportive feedback by way of encouragement (fertiliser application). Critics of the LIS (Learning as Individual Sense making) model argue that an important defect is its lack of attention to cultural influences (Daniels 2001). If the critics ask, the process simply involves an individual attempting to make sense of the surrounding world why is it that the concepts that pupils with similar cultural backgrounds acquire have so much in common? For example, the notion of creativity in western countries places a high value on the uniqueness of what is produced, whereas in Pacific Rim countries it pays greater attention on striving for perfection. In one school visited by the author in Hong Kong, for example, the head teacher was a master calligrapher who enjoyed great esteem as an artist. His sole life’s work as an artist consisted of repeated attempts to reproduce a perfect reproduction of the earliest manuscripts of the basic one-thousand characters that constitute the main source of all written communication in the Chinese language. Socio-cultural contexts in learning The answer to the above question, according to Bredo (1997) is that all learning is situated within a specific context. In this approach learning is seen as a form of apprenticeship whereby the learner engages in the process of cognitive development within a community as a way of gradually gaining acceptance as a full member of that community (Brown and Campione 1990; Lave and Wenger 1999). It extends the notion of reconstruction and construction but in a social context, so that the learner instead of being stimulated solely by the interaction with the environment now does so mainly by engaging in discourse with others who are more knowledgeable (Watkins 2003). For this reason it is often referred to as social constructivism. One of the best examples of this kind of learning occurs in the training of teachers. There would be few practitioners who would argue that they learnt more from their college courses than they did in working alongside their colleagues during teaching practice. Watkins (2003:14) terms this form of learning as ‘building knowledge as part of doing things with others’ (LBKO). The theory that underpins learning as LBKO is derived mainly from the work of the Russian psychologist, Vygotsky. At the heart of this theory, according to Wood (1998:10) is the role of instruction in human development. One of the best known of Vygotsky’s concepts is the zone of proximal development (ZPD) which he defined as “the gap which exists for an individual child between what he is able to do alone and what he can achieve with help from one more knowledgeable or skilled than himself” (Wood 1998:26). This leads to a definition of readiness which Wood defines as “the capacity to learn with help.” This contrasts with the position commonly attributed to Piaget, which conceives of readiness as largely dependent on an individual’s current stage of development that varies from child to child. Robin Alexander (2001: 425) takes a similar view to that of Wood, quoting Vygotsky’s maxim that “the only good teaching is that which outpaces development.” He prefers a different translation of the ZPD which replaces the word, proximal by either next or potential, because this emphasises the importance of teachers having high expectations when helping children through the zone (Alexander 2008b:11). More importantly, in the search for simple but useful working models of learning that can be used to fashion certain principles of teaching Smith (1999: 159) argues that

86
that most viewpoints [whether individual (LIS) or socially constructivist LBKO)] would agree to the following propositions:
1. Construction is undertaken by learners not teachers, 2. Learners’ constructions make use of available beliefs and expectations in
grappling for new ones, 3. Teaching can provide the opportunity for, not the guarantee of, even the
transmission of knowledge, and 4. Construction always involves socio-cultural construction.
Shayer (1997) agrees that for the purpose of devising an effective strategy of intervention in the classroom, as a means of promoting cognitive acceleration in pupils, it makes little sense to distinguish between these different constructivist approaches. Brown and Palincsar (1986 pp 34-5) also argue that it is a mistake to see Piaget’s ideas about child development in direct opposition to that of Vygotsky. They suggest that the two theories are different ends of a continuum and in support of this view they represent the process of learning as ‘theory change’. Some changes can be brought about by supportive (social) interaction while others can arise out of a situation where new experience conflicts with our existing knowledge producing the necessary degree of cognitive conflict. In a nice and apt description they make the point that at one extreme, that of the social interactionist, we hold conversations with others whereas at the other extreme of the continuum, that of the lone scientist, we have similar conversations with ourselves. The essential point, however, is that the nature of the discourse is the same or similar in both cases (Brown and Campione 1994). Thus in seeking to create a simple working model of learning as a process of construction and reconstruction it seems that there is much to be said for combining Watkins’ (2003) two categories, Learning as Individual Sense making (LIS) and Learning through building knowledge as part of doing things with others (LBKO). Learning as developing expertise When talking about learning, particularly when referring to ways that demonstrate their pupils’ increased understanding, teachers use a variety of descriptions (Entwistle and Smith 2002). They talk about pupils “internalising knowledge and skills,” “working out the rules or patterns,” “making concrete versus abstract representations” and “organising ideas and reasoning”. Primary teachers, however, more often talk about pupils as “independent learners” or “independent thinkers” and this seems to imply something more than the ability to argue with oneself as suggested by Brown and Palincsar (1986). Patricia Alexander (2004:10) contends that the study of expertise (and by definition experts must be independent thinkers) in the academic context is a neglected area of research. She argues that the acquisition of knowledge is a core objective for education and that a key aspect in this process is the ways in which individuals move away from a reliance on others for the acquisition of knowledge to a process where they can “discover it for themselves”. However, the research into expertise which took place in the 1970s and 1980s was primarily dominated by the notion of ‘artificial intelligence.’ The researchers sought to determine the characteristics of expert problem solvers so that these features could be programmed into ‘intelligent machines’ or used to train non-experts. This has limited the application of this research to school settings, partly because in the work on artificial intelligence most attention has been paid to differences between novices and experts and not with process by which one makes the journey from one extreme to another. Alexander (2004:12) argues that since students will rarely leave school

87
at eighteen as experts in any subject domain it is the process of transformation into experts through the stages of acclimation, competence and proficiency that are most relevant to teachers. At the acclimation stage pupils begin to grasp the elements of strategic knowledge (Shulman 1986) which help constitute a domain (the forms of legitimate knowledge, what counts as evidence, ways of establishing the validity of a proposition etc). But because these pupils lack the ability to distinguish between accurate and inaccurate (or relevant and tangential) information they are hampered in their thinking which therefore operates at a surface level. At the competence stage pupils’ domain knowledge is more comprehensive and principled and a mixture of surface and deep level strategies are used. The final transformation towards proficiency and expertise is marked by a shift away from these “surface level” thinking strategies towards those which are of a “deep processing kind” and a capacity to engage in problem finding as well as problem solving. This stress on the importance of situating the development of expertise within he different knowledge domains recognises that academic disciplines are at the centre of formal schooling and that any working theory needs to relate to this ‘unique socio-cultural context’ (Sternberg 2003). However cognitive processes by which this expert knowledge is acquired and gradually honed are common and concern what in her earlier writing Patricia Alexander et al (1991) defined as metacognitive knowledge. To become an independent thinker requires an individual to have knowledge of their own cognitive processes. There are two essential parts to this knowledge, one which concerns the development of a repertoire of strategies that can be used when confronted with a problem, and the other which consists of control mechanism that can decide which strategies are likely to lead to success and which to failure. In scientific hypothesising, for example, Alexander et al (1991) argue that there is a need to develop mechanisms for evaluating different guesses, predicting the best solutions and for developing ways of testing these predictions. It follows from the previous paragraphs that there is a specific role for teachers in helping children to become “metacognitively wise”. Indeed, Robin Alexander (1995: 31) has suggested that one of the key problems that can arise in primary schools when teachers seek to turn children into independent thinkers is the adoption of the maxim that “we mustn’t teach, we must let them learn”. Alexander objects strongly to this position.
“Underlying this [is a] simple confusion of teaching with telling which can be readily sorted out. Once this is done there is a genuine pedagogical issue the degree of the teacher’s mediation in the child’s learning. I use mediation in the most neutral term available but of course the linguistic minefield here is a pretty extensive one and many of the other words of common currency carry strong adverse loading – direction, intervention, pushing, interfering, forcing, intruding. The competing imperatives therefore are clear and acute. While ideology dictates a teacher’s role of facilitator and encourager, common sense (not to mention recent classroom research) indicates the benefit for children of powerful interventions by teachers, especially the kind which generate cognitive challenge.”
There are some researchers, who while agreeing with Alexander’s proposition that it is important for teachers to present their pupils with situations which challenge existing thinking frameworks, would by inference suggest that the teachers’ role in developing expertise is limited. This is because they view experts as people who are born and not made. Thus both Gardner (1995) in respect to art and music and Noice and Noice (1997) with regard to acting consider natural inherited talent to be the main

88
determinant of expert performance. Both these writers argue that talent is a key to determining the final level of accomplishment and also in developing and sustaining interest. However, there are others who contest this proposition, notably Ericsson (1996) who suggests that “much of the popular evidence for talent and explicable creativity is based on accounts that cannot be subjected to scientific analysis.” In support of the proposition that expert performers can be studied as “an empirical phenomenon” he cites numerous studies from various domains such as athletics, chess and music to argue that motivation to practice for extended periods and a capacity to acquire from experience the ability “to circumvent some basic information-processing limits” by enhanced “anticipation based on predictive advanced cues” is the key determinant (Ericsson 1996, p 43). In applying the discussion to the development of expertise in teaching, Berliner (2002) takes up a position similar to Ericsson and cites Glaser (1996) to argue that about two dozen propositions about expertise are defensible. Among these are the following:
1. Expertise is specific to domains. This concurs with Patricia Alexander’s (2004) proposition that rather than teaching children generalised skills it is important to teach them to think as scientists, historians, creative writers etc. Even where generalised skills are taught (e.g. concept mapping) it is important to make use these in different subject domains so as to ensure transfer from one domain to another.
2. Expertise does not develop linearly. At certain times plateaux occur that indicate shifts in the child’s understanding and the stabilisation of certain automatic procedures.
3. Experts structure knowledge more effectively and represent problems in qualitatively different ways to non-expert thinkers. In general their representations are both deeper and richer and they are able to recognise meaningful patterns much faster than others.
4. Experts are also able to impose meaning when confronted by different stimuli. As such they are to be regarded as “top down processors” whereas non-experts are often misled by the ambiguity imposed by different stimuli and are likely to be bottom up processors. Experts develop automaticity in their behaviour to allow conscious processing of more complex information. They also develop self-regulatory processes (or executive control) as they engage in these activities.
Linking learning with teaching These above views of learning lead to different models of pedagogy, one which supports the notion of transmission of knowledge and the other which supports the application of that knowledge in ways that demonstrate understanding (Good and Brophy 2002). Acquisition of procedural skills therefore differs from what is generally meant by the term understanding. Unfortunately, as Howard Gardener and Box-Mansilla (1994:199) observe, “while most observers would endorse the goal of teaching for understanding there have been only scattered attempts to find what is meant by this phrase.” Leach and Moon (1999) suggest that teachers tend to regard attempts to teach for understanding as a means of engaging students, sustaining their interest in continuing enquiry and leading them to see larger connections. For Brophy (2004:40)

89
“Students who learn content with understanding not only learn the content itself but appreciate the reasons for learning it and retain it in a form that makes it usable when needed.”
Furthermore, rather than contrast these two approaches in ways that forced earlier generations of teachers to polarise their choice of pedagogy between traditional and progressive teaching, Good and Brophy argue that it makes more sense to regard the two approaches as being complementary, since without the necessarily procedural knowledge and skills pupils will find it difficult to engage in the kind of higher order cognitive activity out of which understanding and metacognition develops. As used by Brophy, understanding is contrasted with the mastery of content by memorisation through drill and practice. It therefore encompasses the acquisition of skills and procedures in the first strand of Patricia Alexander et al’s (1991) typology. Teaching as transmission As we saw earlier, some of the ideas involving information processing have developed by using the analogy of the mind as a digital computer with its central processing unit, its short-term working memory and its long-term storage facility. The human short-term memory is very limited in the number of chunks of information it can hold at any one time. Our success in transferring it to our long-term memory store in a way which allows us to retrieve it from time to time depends on our ability to use certain routines. These routines enable us to encode the information and provide opportunities for repeated rehearsal of these procedures. It has been shown that only about 40 per cent of material presented in an hour long lecture is remembered immediately afterwards. After one week this drops to around 17% unless we take steps to slow down the rate of loss. Although in the first years of primary school children tend to use repetition as the main way of retaining information, other more effective strategies (which do more than retain the information in the short-term memory for a few extra seconds) begin to develop by the time children have moved to P4. More pertinent to the teaching of primary school pupils is the work of the late Grahame Nuthall and his collaborator Adrienne Alton-Leigh which was referred to in an earlier paragraph. These researchers spent time observing the teaching of certain New Zealand curriculum units in a number of schools. Pupils were pre-tested and then tested immediately after the class session, as soon as the unit had ended. They were then again tested and interviewed 12 months after the unit was originally taught to see how much of it they had remembered. Thus these researchers were able to distinguish between knowledge that was already known before the unit was taught and knowledge that was acquired as a result of the teaching (incorrect answer on pre-test but correct answer on post-test). In a similar fashion the researchers could also determine what was not learnt during the unit (incorrect answers on both pre- and post test) and what knowledge was retained over time (correct on both the immediate post-test and again 12 months later). Nuthall and Alton-Leigh (1993) found that, typically, item-relevant information or experiences would be retained in the student’s working memory for no longer than two days, unless it could attach itself to other bits of item-relevant information that was already in the working memory, or that had been retrieved from long-term memory during that or the subsequent day. This suggests that a crucial element of the particular pedagogy required when teaching for transmission will concern itself not only with the introduction of new knowledge (the

90
analogy is with the initial programming of a computer) but also with the repeated use of that knowledge either in the form of homework or by recapitulation at the start of the next lesson. Such procedures are incorporated into a teaching approach known as “direct instruction” (Denham and Lieberman 1986). This approach is not to be confused with the term ‘direct teaching’ which had been used by earlier researchers (Anderson 1939, Flanders 1964) to distinguish between teachers who spent most of the lesson lecturing students when imparting information or giving task instructions. This contrasts with ‘indirect teaching’ which involved teachers in questioning pupils and accepting and using their ideas with a degree of warmth and enthusiasm. Direct instruction arose from attempts to put the theoretical concept of ‘mastery learning’ into practice (Carroll (1963; Block 1971; Bloom 1976) wished to challenge the conventional view of ability (as measured by intelligence tests) as something fixed and largely predetermined so that only some children were capable of learning certain things. Carroll argued that, in principle, any pupil could be taught anything if allowed sufficient time to learn. He expressed this principle in the proposition that the degree of learning was directly proportional to the ratio of time actually spent by a pupil on a task, divided by the time needed by the pupil to master the demands of that task. Harnischfeger and Wiley (1976) have indicated a number of key components in relation to the time spent on the task. First, successful teachers were accurate in their diagnosis of the pupil performance levels in that they did not teach subject matter which was already known or which was too advanced. Second, high levels of pupil teacher interaction took place concerning the presentation of information, monitoring work and giving feedback about performance. Such interactions usually took place in a class setting. Third, teachers spent time discussing the structure of the lesson prior to introducing new material. Fourth, teachers endorsed a value system which emphasised academic goals and encouraged students to take responsibility in helping each other and in sharing material. These components and the instructional processes outlined in the previous paragraphs can be combined to provide a summary of the direct instruction approach (Rosenshine 1979).
KEY STEPS IN DIRECT INSTRUCTION 1. Starts with seat work and recapping the content previously taught; 2. Introduces new work either through teacher instruction or, modelling or by demonstration; 3. Makes sure pupils grasp these new ideas by a question and answers session in which the
questions are rapid so that interaction and pace is kept high; 4. Practices examples by working first as a class or group and then individually; 5. Looks back at the end of the lesson and reviews the new learning and links it to previous skills
and knowledge acquired. Throughout the 1970s and the 1980s numerous studies of classrooms were undertaken which indicated that direct instruction was very effective when teachers sought to enable pupils to acquire new skills or procedural knowledge (Brophy and Good 1986) such as when teaching mathematics procedures, English grammar, historical knowledge, map reading skills and scientific knowledge and procedures. However, it was also found that direct instruction was less successful when the skills and the knowledge to be taught could not be broken down into explicit steps. Thus areas like mathematical problem-solving, discussing social issues, writing or making a critical analysis of other people’s writings were less successful when direct instruction

91
was used (Rosenshine 1987). This conclusion is echoed in the advice given to prospective teachers by Desforges (1995: 129).
“Direct instruction is best used for knowledge transmission, for showing, telling and demonstrating. It is never on its own sufficient to ensure deeper understanding, problem solving, creativity or group work capacities.”
Teaching for understanding Desforges’ assertion (backed by a wealth of research evidence) that direct instruction is best used for knowledge transmission and is less effective when deeper understanding is required, is also reflected in Alton-Lee and Nuthall’s (1998) distinction between the generation of specific knowledge constructs and more generalised generic schema. They argue, for example, specific constructs such as “what causes rain” or “what is an anticyclone?” are inevitably linked to larger generic schemas about the nature of the physical world. In one example when a pupil was asked to describe why she thought it was colder at night she replied that it was
“because when it was cold people might want to have warm clothes and that people on the other side of the world would like a time when they had the sun so that it was much better to sleep when it was dark.”
In constructing this response it is clear that the pupil lacked a general schema which included knowledge that the sun is a source of heat and that the earth goes round the sun. Furthermore, she also lacked the metacognitive awareness to be able to recognise that her argument or explanation was inadequate. Understanding involves the application of procedural knowledge in the development of these generic schema or concepts. As discussed earlier at the beginning of the chapter, the process by which conceptual understanding develops, as interpreted by those who espouse constructivist models of learning, requires the teacher to create a classroom in which “thoughtful discourse” (Brophy (2004: 294) regularly occurs as a means of helping pupils to reconstruct and transform their ideas.
For Howard Gardner (1999:169) too, understanding also embodies the operation of higher-order cognitive processes beyond information processing since “students exhibit understanding when they can invoke ideas flexibly and appropriately to carry our specific analyses, interpretations, or critiques-and especially to perform their understandings with respect to new material.” The idea of viewing understanding as performance is central to Gardner’s position for two main reasons. The first of these stems from the ‘common-sense’ observation that although understanding must involve the “assimilation and transformation of knowledge, from the perspective of the teacher and the learner the physical events which occur in the mind or brain are far from transparent and, strictly speaking, irrelevant to their educational missions” (Gardner 1999:160). But the second equally important reason for requiring students to perform their understanding is that it challenges “traditional ways of doing (or not doing) things” whereby the teacher is required to “look beyond mastery of dictionary definitions or the recitation of textbook examples.” Gardner goes on to suggest that
“Focusing on performance immediately marks an important shift: Instead of “mastering content,” one thinks about the reasons why a particular content is being taught and how best to display one’s comprehension of that content in a publicly accessible way. When students realise they will have to apply knowledge and demonstrate insights in a public form, they
92
assume a more active stance vis-à-vis material, seeking to exercise their “performance muscles” whenever possible.” (Gardner 1999:161)
However, the capacity to solve problems or critique new material, while it does go some way to predicting growth in a pupil’s understanding, is not always an infallible guide to expert performance. This is because in many cases, such as crosswords, it is possible to solve problems by trial and error once one has inkling (from past experience) of the compiler’s strategies for setting clues. For this reason other psychologists argue that it is always necessary for pupils to demonstrate their complete understanding in an observable way by making their thinking visible to the audience. This involves verbalising the various strategies used to solve the problem and reflecting on the relative strength and weaknesses of each approach. Brophy (1992) has reviewed various programmes designed to teach understanding across a range of subject disciplines. He notes that in attempting to create a suitable classroom climate in which thoughtful discourse can take place these programmes have a number of common features. First, and most important, content is organised around a limited set of powerful ideas in a way that engages students interests (Roth 2002). For example, in a science lesson on sources of energy the teacher first introduced the topic to a class of ten-year old pupils with reference to global warming and its consequences. Second, the pupil’s knowledge about the topic is explored and used as the starting point for instruction. In the above example the teacher asked pupils to think about various sources of energy and how they were converted to other forms. This was done by showing pictures of various objects on an overhead projector (a torch, a solar panel on the roof of a house, a car, a wind turbine etc). Third, the pupils’ initial ideas are then challenged by allowing them to explore the phenomena in question. Whenever possible this is done through direct, hands-on experience rather than by the use of texts or through teacher’s narrative descriptions. In the above lesson pupils were provided with a number of simple experiments involving a magnifying glass (to heat paper) tuning forks (which were struck and placed on a tightly stretched string) and batteries and bulbs. Following the practical work the class discussed whether their initial ideas about energy needed to be modified in the light of their experiments. Cultivating Thoughtful Discourse As reported in Brophy (2004) one researcher (Newman 1992) conducted a survey of several thousand secondary students and asked them what motivated them to take part in class discussions. Most said that discussion worked best when the content of the lesson was authentic in the sense that they could link the ideas involved to their own everyday experience and not necessarily, as is sometimes suggested, that there was a practical outcome. Newman (1990) in an earlier study identified a number of features that characterise thoughtful discussion. The key ones are summarised below:
1. Students generate original and unconventional ideas through the use of open questions which allow a range of possible answers.
2. Students are given plenty of time to think before being required to answer questions.
3. The teacher presses students to explain and justify their assertions rather than accepting them or reinforcing them indiscriminately.
4. The teacher models the characteristics of ‘thoughtful discourse’ in his response to students by showing interest in their ideas and by ‘thinking aloud’ when engaged in problem solving.

93
The use of open questions has been a long-standing problem in teaching. Edwards and Mercer (1987) offer reasons why this situation persists. Class discussion usually consists of a sequence of what these researchers call “cued elicitations” whereby when a teacher asks a question he or she simultaneously provides clues as to the information required. Thus intended open questions often end up by becoming closed, in that pupils come to accept that although the question allows for many answers there is only one which the teacher really wants from them. Many teachers’ open questions are also often combined with heavy prompts, clues and cues so that in reality the approach does not differ from direct instruction. This is illustrated in the following extract from a science/music lesson where pupils have to arrange different sized sticks to produce a simple xylophone. Teacher: How did I arrange these?
First child: You sort of...you put one here, and you put the medium there, and you put the skinny one there, and then you put the other medium there, and then you put the fatso there, and then you put the skinny one there.
Second child: When you listen on there you'll see what we said.
Teacher: That's right. But let's look at these sticks again. Why did I put them this way?
Second child: Because you made a design full of steps.
Teacher: Steps, that's right. How can you tell they're steps?
First child: Because one is medium, then the other one's skinnier, then it gets medium again, then it gets fatter, and then it gets skinnier.
Teacher: Well, there are other types of steps too. Just look at the tops.
First child: It gets fatter.
Teacher: Just a minute. Just look at the tops of these sticks.
First child: But ...
Teacher: Just look at the very top. What can you tell me about the top?
Second child: Looks like train tracks.
First child: They look like steps on the ends.
Teacher: Very good, like steps; but what can you... How can you tell they are like steps? One is...
Second child: One is high
(Extracted from Budd-Rowe (1973) Teaching Science as a Continuous Enquiry pp254-255)
Here the teacher repeats the pupils answers (Steps. That’s right) offers clues (Just look at the top repeated three times) and indicates the correct answer (One is…). It is clearly not an easy matter for teachers to break away from this pattern of discourse. Indeed, some studies show that teachers are often unaware of how much guidance they give (Galton 1989, p 38). This is because unlike direct instruction where the teacher mostly controls the exchanges, during class discussion pupils are able to manipulate the situation for their own ends. When asked by Galton (1989, p 73) pupils offered a range of strategies for avoiding being picked by the teacher to give an answer. They mainly achieved this result by giving an impression that they required more thinking time. Being asked difficult questions was accordingly to one pupil

94
“like walking on a tightrope”. Pupils said they often worried lest they lost face with peers in such situations. If they volunteered too many acceptable answers too quickly they could earn the reputation of being a “boff”. If they offered too few answers they might be regarded as “thick”. It was therefore much safer to persuade teachers to answer their own questions. Thus when faced with a challenge pupils attempted to strike a bargain with the teacher. In return for not attempting to subvert the discussion (by disruption, joking or attempting to distract the teacher from the topic) pupils expected that in turn the teacher would not expose them to humiliation by forcing them to answer so that they “feel silly in front of their friends” (Galton 1989, p72). Faced with a new class at the beginning of a new school year a certain amount of this exchange bargaining will take place till each side (pupils and teachers) are reasonably content and a working consensus is established (Pollard 1985). For this reason open questions are not always the best means of promoting thoughtful discussion. Dillon (1990) for example, argues that sometimes a provocative statement by the teacher can be more effective in producing sustained responses from the class. Other interventions designed to get a pupil to elaborate on his or her initial answer (“tell us more about that” or “perhaps you could think of an example”) or indirect questions (“Why do you say that?”) are also useful (Dillon, 1990). Dialogic teaching One attempt to improve this situation has been to promote what Robin Alexander (2008b) terms ‘dialogic teaching’. Alexander argues that the present situation is exacerbated by using such descriptions of classroom discourse as interactive whole-class teaching which tends to focus on the organisational aspects of the pedagogy and “not what matters most: the quality, dynamics and contents of the talk.” Dialogic teaching is intended to promote a community of inquiry where “learning is not a one-way linear communication but a reciprocal process in which ideas are bounced back and forth” (Alexander 2008, p22). For dialogic teaching to be successful it must fulfil the following criteria in that it should be:
1. Collective: teachers and children address learning tasks together, whether as a class or as a group;
2. Reciprocal: teachers and children listen to each other, share ideas and consider alternative viewpoints;
3. Supportive: children can articulate their ideas freely without fear of embarrassment over wrong answers, thereby helping each other to reach common understandings;
4. Cumulative: teachers and pupils build on their own and each other’s ideas and chain them into coherent lines of thinking and enquiry;
5. Purposeful: in that teachers plan and steer classroom talk with specific educational goals in view.
Dialogic teaching therefore attempts to minimise the use of rote, recitation and instructional talk in favour of discussion and dialogue. In the latter case the teacher and pupils (or group of pupils) achieve common understandings through structured and cumulative questioning which “guide and prompt, reduce choices, minimise risk and error and expedite handover of concepts and principles” (Alexander 2008b, p34). For this to happen requires that pupils acquire what Alexander terms a repertoire of learning talk, most of which has been shown to correlate positively with effective discussion within collaborative group structures (Webb 1989). This includes the

95
ability to explain, to argue cases, to give reasons to back up assertions and to arrive at conclusions through negotiation rather than through majority decisions (Webb and Mastergeorge 2003) Alexander argues that in order to engage in such dialogue pupils must be taught this repertoire of talk skills and this is supported by research (Kagan 1988). Alexander suggests it is better to concentrate on the first of his three principles (collectivity, reciprocity and support) in the initial stages since accumulation also requires teachers to restructure and re-sequence subject matter in ways that allow them to “scaffold pupils’ thinking from present to desired understanding” (Alexander 2008b, p45). Mercer et al (1999) also concurs that it is necessary to train children in order to promote what they term exploratory talk, which is very similar in its conception to Alexander’s notion of dialogic talk. These researchers have offered empirical evidence that inducting children into an explicit collaborative style of reasoning within discussion has led to improvement in scores on tests of non-verbal reasoning. Mercer et al (2004). Their study of talk in primary science lessons supports the view that training in these talk skills is required in order to promote effective discussion. Mercer and colleagues note that children may get little experience of such talk “in their lives out of school” and that teachers “rarely make their own expectations or criteria for effective discussion explicit to children.” As a result children are rarely offered guidance and training in how to communicate effectively in groups. According to Mercer et al, even when the aim of talk is made explicit, for example they are told to “talk together to decide” or to “Discuss this in your group,” there may be “no real understanding of how to talk together or for what purpose” (Mercer et al. 2004:361). Among the guiding principles used for training pupils to engage in exploratory talk were the following:
1. All relevant information is shared;
2. All members of the group are invited to contribute;
3. Opinions and ideas are respected and considered;
4. Everyone is asked to make their reasons clear;
5. Challenges and alternatives are made explicit and are negotiated;
6. The group seeks to reach agreement before taking a decision or acting.
After training Mercer et al (2004) were able to show that the quality of the talk improved. There were nearly four times as many uses of words such as because, I think etc., and nearly fifty times as many sustained utterances (defined as exceeding 100 characters). The use of suitable wait times The second key element in promoting “thoughtful discourse” is for the teacher to use suitable wait times. Some researchers prefer the use of the term “reflection time” or “thinking time” since it implies more active participation. But the term initially referred to the amount of time children were given to answer a question. One of the earliest studies by Rowe (1986) was able to record two kinds of wait time.

96
Teacher: How would you measure the time if you didn’t have a watch? (Pause for first wait time)
Pupil: I would use the sun.
Teacher: (pause for second wait time) That’s an interesting answer. Can you say a little more about how you would use the sun?
Rowe found that in a classroom where pupils rarely answered questions wait times were extremely short (less than three seconds). Moreover, slower learners were given the least time to answer, presumably because the teacher wished to save these pupils from any embarrassment in front of their peers, and because s/he did not anticipate they would be able to respond in a useful way. The second wait time was particularly important because, teachers would frequently repeat the first answer that the pupils gave, thereby indicating approval, or else go on to ask someone else, thereby indicating the first answer was not the one required or anticipated. Biggs (1994) suggests that pupils in Chinese classrooms should be more willing to participate in classroom discussion because of the nature of children’s attributions when faced with difficulties with their learning. Whereas children in the West tend to attribute failure to learn to a lack of ability those in the East are more likely to put their failure down to lack of effort. Hence there is more willingness to accept help from others rather than regarding those who answer questions as ‘boffs’. Nevertheless as in English primary classrooms, thinking time may be best achieved initially by asking children to discuss the questions with their neighbour or in small groups. In class discussion teachers should try to eliminate the kinds of responses identified by Alexander (2008b) which lead pupils either to give short unelaborated answers or to attempt to remain silent by pretending that they are still thinking about a response. These include summarising, repeating or reformulating the pupil’s answer or exhorting pupils to remember what was said or done earlier. Explaining Why as well as How The third key element in teaching for understanding requires the teacher to encourage explanations and elaborations of answers. Here again from the analysis of classroom discourse in five cultures, Robin Alexander (2001) demonstrates that teachers are not good models in this respect. Classroom practitioners rarely justify their decisions in class nor do they attempt to situate the learning in a wider context by telling pupils, as in a previous example, how the conversion of energy from one form to another relates to global warming and the survival of the planet. Correct forms of speech should be encouraged in Hong Kong and in some English language classes, for example, teachers now provide cue cards on which words such as ‘because’ are printed and the class have a rule that any statement or suggestion must be followed by using one of the words on the cue cards to make a sentence. However, in most lessons, because it is rare for pupils to explain or elaborate in response to teachers’ questions during present patterns of classroom discourse, it is clearly necessary to offer training to pupils and to couple this with subsequent debriefing during which pupils have an opportunity to evaluate the quality of their responses. A teaching framework for developing understanding In considering teaching for transmission it was possible to produce a sequence of specific classroom practices (questioning, instruction, practice etc) which combined to form a specific pedagogic approach known as direct instruction. It is now possible

97
to do something similar in relation to teaching for understanding although the descriptions are naturally more generalised, because to say that a pupil understands something implies a number of possibilities. Brophy (2004:41) refers to the statements as key features which characterise the conditions for promoting understanding rather than indicating a set of sequential actions, as in the case of the direct instruction. In other words, if these features are not present it is unlikely that understanding will develop. The following Table displays these key features. Although the wording of the six key principles of the SCT study do not exactly match Brophy’s ten features they are the practical interpretation of them and follow from the earlier extended discussion of Brophy’s ideas.
Ten key features in teaching for understanding
1. Pupil exploration will usually precede formal presentation. [Used in the study but not incorporated in the six principles. It relates to beginning lessons with a class discussion rather than immediate instruction. It also relates to increasing pupil participation.]
2. Pupils’ questions and comments often determine the focus of classroom discourse. [Second key principle concerning extended questioning.]
3. There is a high proportion of pupil talk, much of it occurring between pupils. So that the metaphor “teacher as a listener” and “guide on the side” rather than as a “sage on the stage” are characteristic of the lesson. [Third key principle concerning increased pupil participation and also fourth principle since Brophy argues this should often be done through the use of group work.]
4. The lesson requires pupils to reflect critically on the procedures and the methods they used. [Fifth and sixth principles involving feedback which is informative (i.e. discusses procedures used rather than supplying correct answers) and also assessment for learning which requires pupils to assess the value of using different approaches. Brophy elaborates on these as an aid to metacognition.]
5. Whenever possible what is learned is related to the pupils’ lives outside school. [Again not specified as a principle but teachers have been encouraged to situate work in local contexts.]
6. Pupils are encouraged to use a variety of means and media to communicate their ideas. [Stems from Howard Gardner’s notion of multiple intelligences and teachers have been encouraged to use practical applications using a variety of materials whenever appropriate.]
7. Content to be taught is organized around a limited set of powerful ideas. [Brophy argues this is best done at the start of a lesson using advanced organisers, the first key principle.]
8. Teachers structure tasks in ways which limit the complexity involved. [This refers to scaffolding tasks.]
9. Higher order thinking is developed within the context of the curriculum and not taught as a discrete set of skills within a separate course unit. [This argues for a holistic approach and not using specific thinking skill packages. We have adopted the former approach.]
10. The classroom ethos encourages pupils to offer speculative answers to challenging questions without fearing failure. [Tries to put less emphasis on getting the right answer and relates to the use of praise to reward ‘smartness’ rather than for correct answers. Thus teachers have been encouraged to praise effort when there is evidence that pupils have thought hard about their answers.]
Adapted from Brophy (1992)

98
These ten key features relate closely to the theoretical principles that view learning as a process of construction and reconstruction as distinct from information processing. The first feature, indicating that exploration of the pupils’ ideas should usually precede the teachers’ formal presentation of new information, and the second concerning the use of these ideas to focus subsequent discussion, stems from the constructivist viewpoint that children are not empty vessels into which knowledge is poured. Thus even in the case of a most abstract concept the pupils are likely to have partial, if incorrect, understandings on which the teacher must build. The third proposition regarding pupil talk and ‘teacher as a listener’ contrasts with the balance of classroom talk during direct instruction. The third key feature also implies that cooperative learning involving pair and group work will be a frequently used strategy. The fourth key feature is about developing ‘metacognitive awareness’ and marks the beginnings of the process where pupils learn to become independent thinkers. This is the third strand of Patricia Alexander et al’s (1991) knowledge typology. The fifth characteristic addresses the question of authenticity in support of the proposition that learning is more meaningful when it can be situated in contexts with which pupils can readily identify (Putnam and Borko 1997). The use of a variety of means and media to promote understanding (sixth key feature) stems from Howard Gardner’s (1983) theory of multiple intelligences. Gardner argues on the basis of his theory that concepts can be well understood only if pupils can represent its core features in several ways. Thus it is desirable that multiple modes of representation draw on a number of intelligences. For Gardner this is not simply a case of ensuring that there are sufficient representations to cover different pupil’s intellectual strengths but more importantly to demonstrate the ‘intricacy’ of the subject matter.
“This tack is more than a “smorgasbord” approach to education-throw enough proverbial matter at students, and some of it will hit the mind or brain and stick. The theory of multiple intelligences provides an opportunity to transcend mere variation and selection. It is possible to examine a topic in detail, to determine which intelligences, which analogies and which examples are most likely to capture important aspects of the topic and to reach a significant number of students” (Gardner 1999:176).
The seventh feature is related to the need for teachers to capture the pupils’ interest, thereby, hopefully, motivating them to learn. But an added bonus in adopting this approach is that the learning can lead to a transformative experience, in that it does more than add to the store of the student’s knowledge but “enables him or her to see some aspect of the world in a new way” (Brophy 2004: 267). It follows from this that it is important, initially, to structure the task (eighth key feature) so that the student doesn’t feel that it is too demanding. This process is generally referred to as ‘scaffolding’. The ninth key feature contrasts with the approach which seeks to promote structured thinking skills programmes. The argument here concerns the well know problem of ‘transfer’ of learning (Salomon and Perkins 1989) where students often find it problematic to apply the skills learned in one subject domain to another. On the other hand, McGuinness (1999: 7-8) argues that when thinking skills are taught within subjects there is a danger that “they may get lost in the midst of subject knowledge-based teaching and pupils may fail to see the connections between similar types of thinking in different subjects.” For this reason McGuinness suggests a compromise or “middle way” whereby “contexts are first identified within the curriculum where

99
particular thinking skills can be developed.” Lessons are then developed where “thinking skills and topic understanding are explicitly and simultaneously pursued.” The final key feature concerns the creating of classrooms as ‘learning communities’ (Watkins 2005). In learning communities, according to Watkins, pupils equate learning with effort and not ability, promote disciplined discourse, and share responsibility for “knowing what needs to be known and ensuring that others know what needs to be known” (Watkins 2005: 56). The result is that learning is richer and knowledge is co-constructed. To this end Watkins quotes a conversation with two eleven-year old pupils:
“Even if you learn something perfectly or are a pioneer in your area, all your work is useless if nobody else can understand you. You might as well have done no work at all. The point of learning is to share it with others. Lone learning is not enough.”(Watkins 2005: 57)
This seems as good a point as any at which to leave the explanation of how the six principles that provided the framework for the SCT study were developed from Brophy’s 10 key features of teaching for understanding. The use of this approach, however, depends on the kind of knowledge that the teacher is seeking to impart. That is why the first of our key principles involves the use of an ‘advanced organiser’ to encourage teachers to identify the different kinds of knowledge demands they make of their students. Thus it is not so much a polarity between the use of direct instruction and the use of thoughtful discourse in the pursuit of understanding but a judicious blend of both teaching approaches that are the mark of an effective classroom.
References Alexander, P, Schallert, D. and Hare, V. (1991) Coming to Terms: How Researchers in Learning and Literacy Talk About Knowledge. Review of Educational Research, 61, 3, pp315-343.
Alexander, P. (2004) The development of Expertise: the journey from acclimatisation to proficiency, Educational Researcher, 32 (8):10-14.
Alexander, R. (1995) Versions of Primary Education, London: Routledge
Alexander, R. (2001) Culture & Pedagogy: International Comparisons of Primary Education, Oxford: Blackwell.
Alexander (2008a) Essays in Pedagogy, London: Routledge
Alexander, R. (2008b) Towards Dialogic Teaching: rethinking classroom talk (4th edn.) Thirsk, North Yorkshire: Dialogos
Alton-Lee, A. and Nuthall, G (1992) A Generative Methodology for Classroom Research, Educational Philosophy and Theory, Special Issue: Educational research Methodology, 24 (2):29-55.
Atkinson, R. and Shiffrin, R. (1968) ‘Human Memory: a proposed system and its control processes, in Spence, J. and Spence J. [Eds] Advances in the Psychology of Learning and Motivation, Volume 2, New York: Academic Press.
Bennett, N. Desforges, C. Cockburn, A. and Wilkinson, B. (1984) The Quality of Pupil Learning Experience, London: Lawrence Erlbaum.

100
Bereiter, C. (1991) Implications of connectionism for thinking about rules, Educational Researcher, 27 (2): 4-13.
Berliner, D (2002) Learning About and Learning From Expert Teachers, International Journal of Educational Research, 37 (6)
Berliner, D. (1994). Expertise: The wonders of exemplary performance. in Mangieri, J. and Collins-Block, C (Eds.), Creating powerful thinking in teachers and students. Ft. Worth, TX: Holt, Rinehart and Winston.
Bredo, E. (1997) The social construction of learning, in Phye G. (Ed) Handbook of Academic Learning: Construction of Knowledge, New York: Academic Press.
Brown, A. and Campione, (1990) Communities of Learning and Thinking, or a context by any other name, in Kuhn, D. [Ed] Developmental Perspectives on Teaching and Learning Thinking Skills: Contributions in Human Development, pp 108-126 Basel, Swiss: Krager. Brown, A. and Palincsar, A. (1986) Guided Cooperative Learning and Individual Knowledge Acquisition, Technical Report 372, Cambridge (MASS) Bolt, Beranak and Newham Inc.
Conner, C. (2003) What Leaders need to know about the relationship between teaching and learning in Learning Texts, Nottingham: National College for School Leadership (NCSL).
Cortazzi, M. (1991) Primary Teaching: How it is, London: David Fulton.
Daniels, H. (2001) Vygotsky and Pedagogy, London: Routledge Falmer.
Desforges, C. (2003) ‘On learning and teaching’ in Learning Texts, Nottingham: National College for School Leadership (NCSL).
Edwards, D. and Mercer, N. (1987) Common Knowledge and the development of understanding in the classroom, London: Routledge.
Ericsson, K. A. (1996). The acquisition of expert performance: An introduction to some of the issues. In K. A. Ericsson (Ed.), The road to excellence: The acquisition of expert performance in the arts and sciences, sports and games. Mahwah, New Jersey: Lawrence Erlbaum Associates. (pp. 1-50).
Gage, N. (1978) The Scientific Basis for the Art of Teaching, New York: Teachers College Press.
Galton, M. (2007) Learning and Teaching in the Primary Classroom, London: Sage Publications
Galton, M. (1995) Crisis in the Primary Classroom, London: David Fulton.
Gardner, H. (1995) Why would anyone become an expert? American Psychologist, 50
Glaser, R. (1996). Changing the agency for learning: Acquiring expert performance. In Ericsson, K (Ed.), The road to excellence: The acquisition of expert performance in the arts and sciences, sports and games. Mahwah, New Jersey: Lawrence Erlbaum Associates. (pp. 303-311).
, 802-803.
Hattie, J. (2005)The paradox of reducing class size and improving learning outcomes, International Journal of Educational Research, 43 (6) 387-425.

101
Hattie, J. and Timperley, H (2007) The Power of Feedback, Revue of Educational Research, 77 (1):81-112.
Joyce, B. and Weil, M. (1972) Models of Teaching, 2nd Edition, Englewood Cliffs, New Jersey: Prentice-Hall.
Joyce, B., Calhoun, E. and Hopkins, D. (1997) Models of learning-tools for teaching, Buckingham: Open University Press.
Kagan, S (1988) Cooperative Learning: Resources for Teachers, Riverside, California: University of California Press.
Lave, J. and Wenger, E. (1999) Learning and Pedagogy in Communities of Practice, in Leach, J. and Moon, B. [Eds] Learners and Pedagogy, pp21-33, Buckingham: Open University Press
Leach. J. and Moon, B. (1999) ‘Recreating Pedagogy,’ in Leach, J. and Moon, B. [Eds] Learners and Pedagogy, pp21-33, Buckingham: Open University Press
Mc Guinness, C. (1999) From Thinking Skills to Thinking Classrooms: a review and evaluation of approaches for developing pupils’ thinking skills, DfEE research Report RR115, Nottingham: Department for Education and Employment.
Meadows, S. (1993) The Child as a Thinker, The Development and Acquisition of Cognition in Childhood, London: Routledge.
Mercer, N., Dawes, L., Wegerif, R. and Sams, C. (2004) Reasoning as a scientist: ways of helping children to use language to learn science, British Educational Research Journal, 30 (3): 359-377.
Mercer, N., Wegerif, R. and Dawes, L. (1999) Children’s talk and the development of reasoning in the classroom, British Educational Research Journal, 25 (1): 95-111.
Newmann, F. (1990) Qualities of thoughtful social studies classes: An empirical profile, Journal of Curriculum Studies, 22: 253-275.
Newmann, F. [ed] (1992) Student engagement and achievement in American secondary schools, New York: Teachers College Press.
Noice, T. & Noice, H (1997). The nature of expertise in professional acting: A cognitive view. Mahwah, NJ: Lawrence Erlbaum Associates.
Nuthall, G. and Alton-Lee, A. (1993) Predicting learning from student experience of teaching: A theory of student knowledge construction in classrooms, American Educational research Journal, 30 (4):799-840.
Nuthall, G. (2000) The role of memory in the acquisition and retention of knowledge in science and social studies units, Cognition & Instruction, 18 (1): 83-139.
Nuthall, G. (2004) relating classroom teaching to student learning: A critical analysis of why research has failed to bridge the theory-practice gap, Harvard Educational Review, 74 (3): 273-306
Pintrich, P. (2002) The Role of Metacognitive Knowledge in Learning, Teaching and Assessing, Theory into Practice 41 (4): 219-225.
Pollard, A. (1985) The Social Word of the Primary Classroom, London: Holt, Rinehart & Winston.

102
Prais, S. (2003) School Readiness, Whole Class Teaching and Pupils’ Mathematical Achievement, London: national Institute of Social and Economic Research.
Putnam, R. and Borko, H. (1997) Teacher learning: implications for new views on cognition, in Biddle, B., Good, T. and Goodson, I. [Eds] The International Handbook of Teachers and Teaching, Dordrecht, Netherlands: Kluwer.
Rosenshine, B. (1979) ‘Content, Time and Direct Instruction’ in Peterson, P. and Walberg, H. [Eds] Research on Teaching Concepts, Findings and Implications. California, Berkeley: McCutchan.
Rosenshine, B. (1987) Direct Instruction in Dunkin, M. [Ed] Teaching and Teacher Education. Oxford: Pergamon.
Roth, K. (2002) Talking to understand Science, in Brophy, J. [Ed] Social constructivist teaching: Affordances and constraints, New York: Elsevier.
Rowe, M. (1986) Wait time: slowing down may be a way of speeding up, Journal of Teacher Education, 37 (1): 43-50.
Salomon, G. and Perkins, D. (1989) Rocky roads to transfer: Rethinking mechanisms of a neglected phenomenon, Educational Psychology, 24: 113-142.
Shayer, M. (1997) Piaget and Vygotsky: a necessary marriage for effective educational intervention, in
Shulman, L. (1986) ‘Those who Understand: Knowledge Growth in Teaching’. Educational Researcher, 15 (2): 4-14.
Shulman, L. (1987) Knowledge and Teaching: Foundations of the new reform, Harvard Educational Review, 57 (1): 1-22.
Simon, B. (1981) ‘Why no Pedagogy in England?’ in Simon, B. and Taylor, W. (Eds) Education in the Eighties, The Central Issues, pp124-145. London: Batsford.
Smith, L (1999) What exactly is constructivism in Education? Studies in Science Education, 33:149-60.
Sternberg, R. (2003) What is an expert student? Educational Researcher, 32 (8): 5-9.
Watkins, C. (2003) Learning: A sense-makers guide, London: Association of Teachers and Lecturers (ATL).
Watkins, C. (2005) Classrooms as Learning Communities: What’s in it for schools? London: Routledge.
Webb, N. (1989) Peer interaction and learning in small groups, International Journal of Educational Research, 13 (1): 21-39.
Webb, N. and Mastergeorge, A. (2003) Promoting effective helping behaviour in peer directed groups, International Journal of Educational Research, 39 (1-2): 79-97.
Wood, P. (1998) How Children Think and Learn, 2nd Edition, Oxford: Blackwells.

103
© Education Bureau, The Government of the Hong Kong Special Administrative
Region of the People’s Republic of China 2009 This Final Report may be used for non-profit-making educational purposes. In all
cases, proper acknowledgement should be made.