study of the partition coefficient and the diffusion...
TRANSCRIPT

Study of the Partition Coefficient and the Diffusion Length of Radon in
Polymers at Different Temperatures: Experimental Approach and Results
S. Georgiev, K. Mitev, Ch. Dutsov, T. Boshkova, I. Dimitrova
SUBG
MetroRADON Workshop, 21-22.03.2019, Sofia, Bulgaria

Polymer membranes
• Radon/Thoron discrimination in lots of passive detectors
• Radon mitigation by water-proofing membranes
Both count on “diffusion delay”
… and D , resp. LD are temperature dependent
𝐿𝐷 =𝐷
𝜆 ⟹ 𝐿𝐷~ 𝑇1/2

Polymer samplers
• Methods for radon measurements are developed, based on the high radon absorption ability in polymers such as Makrofol DE and N
• The absorption could be described by the partition coefficient K and the diffusion length LD and they both depend on the temperature

Model of RNG transport in polymers
• At the border polymer/ambient media the RNG concentration ratio is:
𝐾 =𝐶𝑖𝑛
𝐶𝑜𝑢𝑡
• Once in the polymer, the radioactive noble gas (RNG) diffuses and decays:
𝜕𝑐
𝜕𝑡= 𝐷
𝜕2𝑐
𝜕𝑥2− 𝜆𝑐

Model of RNG transport in polymers
• And the absorbed activity in thin plate is:
λ – RNG decay const.
L, V – plate thickness and volume
CA – ambient RNG concentration at ts=0
ts , td – sorption and desorption time

Method for estimation of K and LD
• The absorbed-activity equation could be rewritten:
𝑛 = 2𝑘 + 1 – an odd number

Desorption follow-up: challenges
• Temperature have to be constant – During both sorption and desorption
– Including the activity measurement
• Desorption could be fast – depending on LD/L it could take a few minutes – Fast and precise timing
• Secular equilibrium between Radon/SLP is needed – Radon is measured by its short-lived progeny (SLP)
– So the fast desorption must be “stopped” for the measurement duration (or somehow accounted…)

Desorption follow-up: challenges
• LSC with toluene cocktail is the best decision for Makrofol N – its fully dissolved in toluene
• …but doesn’t work for the other polymers
– Makrofol DE is only partially dissolved in toluene
– PP, HDPE, LDPE not dissolved at all in toluene and other organic solvents: Gasoline, Bensol(Benzene), 1,2-Dichloroethane (ethylene dichloride)
– Activity desorbs in the cocktail and the cocktail (or at least toluene) is absorbed in the polymers
=> Complicate change in the Counting efficiency
Desorption follow-up: challenges
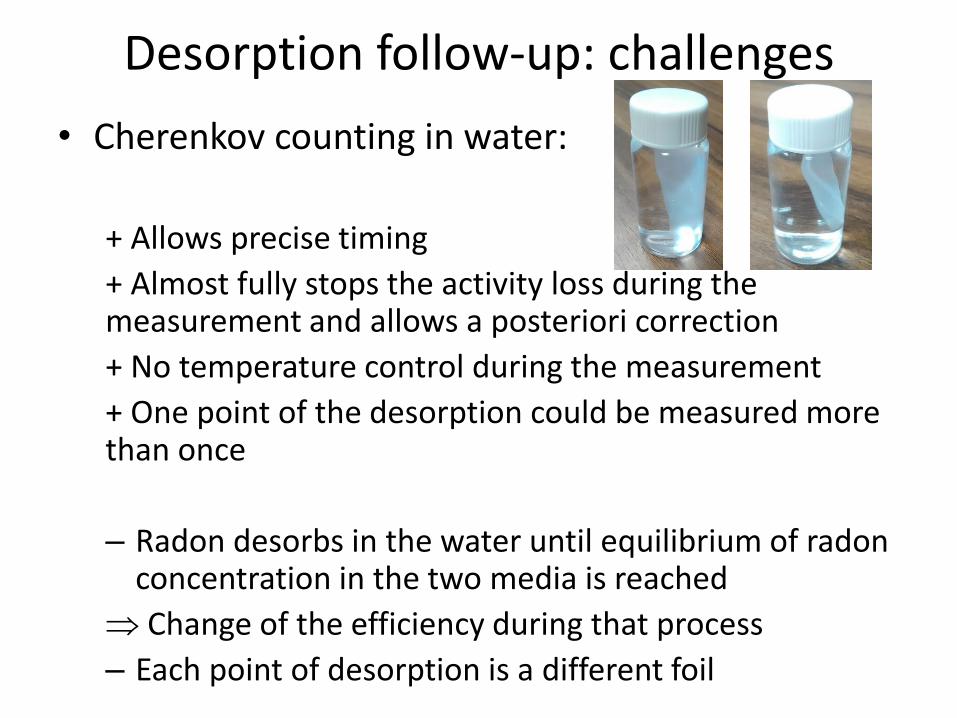
• Cherenkov counting in water:
+ Allows precise timing
+ Almost fully stops the activity loss during the measurement and allows a posteriori correction
+ No temperature control during the measurement
+ One point of the desorption could be measured more than once
– Radon desorbs in the water until equilibrium of radon concentration in the two media is reached
Change of the efficiency during that process
– Each point of desorption is a different foil

Counting efficiencies εc
• Two experiments for εc estimation: – Unexposed foils in high-activity water for better counting
statistics
– Exposed Makrofol N in distilled water – to compare with the previous experiment
T1/2,eff=89.5(9)h

Counting efficiencies εc
• Samples are followed at the RackBeta LS-counter and measured several times at HPGe
– No time dependence of εc for PP, LDPE, HDPE
– After 60-70h εc=const for Makrofols

K, LD experiments: Exposure setup
• Six foils 5.6cm x 1.6cm of each material:
PP, LDPE, LDPE-A, HDPE, Makrofol DE, Makrofol N

K, LD experiments: Exposure setup
• Three experiments with very high activity in small volume at 5oC, 21oC and 31oC – High CA to ensure better counting statistics – and longer desorption follow-up
Rn is promptly introduced in the system in the beginning and the system is disconnected
The activity from the control drexel is diluted and measured, in order to estimate the exposure CA

K, LD experiments: Exposure setup
• During the exposure, the exposure drexel was placed in the 50L box,and the 50L box was placed in thermostate for temperature control
• The activity concentration in the 50L box was measured in order to check for activity leakage
– The leakage was fond to be less than 1% in all experiments
• After the exposure the foils were kept in the thermostate, in order to desorb at the same temperature

K, LD experiments: Exposure setup
• One experiment in the 50L referent volume of the AlphaGuard at 10oC
– Due to much lower CA, only Makrofol foils were used
– The foils were stuck in the holder and placed directly in the 50L volume
– CA was measure directly
– 6 Makrofol DE and 12 Makrofol N foils were used
– 6 Makrofol N were measured in toluene and the other 6 – in water

K, LD experiments: Results
LDPE-A
T=5oC
LDPE-A
T=21oC
LDPE-A
T=31oC

K, LD experiments: Results
Mak N
T=5oC
Mak N
T=21oC
Mak N
T=31oC
Mak N
T=10oC

K, LD experiments: Results PP LDPE LDPE-A HDPE Mak DE Mak N MakDE*
ToC ToC
5(1) 6.13(55) 4.18(39) 4.05(42) 3.63(33) 77.5(67) 211(16) 21.5(43) 5
10(1) 72.8(58) 183(12) 24.3 10
21(1) 3.69(38) 3.66(38) 3.13(41) 2.51(22) 34.6(30) 103.3(79) 26.4(25) 19.5
31(1) 3.25(43) 3.70(43) 2.96(30) 2.44(21) 27.8(24) 70.2(51) 22.9 31
2.17(14) 2.21(13) 27.6(16) 112(12)
2.40(22)
ToC ToC
5(1) 67.6(51) 605(30) 646(36) 460(19) 20.8(10) 18.0(10) 42.2(16) 5
10(1) 26.8(10) 23.9(10) 42.8 10
21(1) 198(10) 1210(64) 1204(85) 880(22) 43.3(13) 36.2(10) 51.7(8) 19.5
31(1) 300(15) 1880(140) 1722(54) 1252(23) 62.9(16) 52.1(15) 75.5 31
1463(33) 721(9) 50.8(10) 38.9(13)
1437(94)
ToC
5(1) 0.96(14) 76.9(77) 87.4(97) 44.3(37) 0.0911(84) 0.0677(79)
10(1) 0.151(11) 0.120(10)
21(1) 8.20(85) 307(33) 304(43) 162(8) 0.394(25) 0.275(15)
31(1) 18.9(19) 739(111) 623(39) 329(12) 0.831(43) 0.570(32)
448(10) 109(2) 0.540(12) 0.318(11)
432(28)
ToC
5(1) 0.59(10) 32.1(44) 35.4(54) 16.1(20) 0.706(89) 1.43(20)
10(1) 1.10(12) 2.20(24)
21(1) 3.03(44) 113(17) 95.1(18) 40.7(41) 1.36(15) 2.84(27)
31(1) 6.1(10) 273(52) 184(22) 80.4(75) 2.31(23) 4.00(37)
97.2(66) 24.0(15) 1.49(9) 3.56(40)
104(9)
Pressyanov et al, Rad. Prot. Dosim. 145(2-3) (2011) 123-126
Mitev et al, Appl. Rad. Isot.109 (2016) 270–275
Pressyanov, HealthPhys 2009
~20
~20
~20
~20
Partition coefficient K
Duffusion length LD, um
Diffusion coefficient D, 10-14m2/s
Permeability P, 10-13 m2/s

K, LD experiments: Results
0 5 10 15 20 25 30 35
3
4
5
6
7
8
PP
LDPE
LDPE-A
HDPE
MakN
MakDE
Ln
(LD, m
)
t, C
y = a + b*x -- --
Value Standard Er
Intercept 4.00646 0.19383
Slope 0.05653 0.00806
Intercept 6.18804 0.00286
Slope 0.04344 1.50462E-4
Intercept 6.2856 0.01614
Slope 0.03767 6.11367E-4
Intercept 5.96197 0.04469
Slope 0.03798 0.00169
Intercept 2.75912 0.04543
Slope 0.03889 0.00195
Intercept 2.86368 0.03662
Slope 0.04168 0.0016

K, LD experiments: Results
0 5 10 15 20 25 30 352
3
4
5
6
50
100
150
200
250 PP
LDPE
LDPE-A
HDPE
MakN
MakDE
K
t, C

K, LD experiments: Results
5.62 5.64 5.66 5.68 5.70 5.720.8
1.0
1.2
1.4
1.6
1.8
3.5
4.0
4.5
5.0
5.5 PP
LDPE
LDPE-A
HDPE
MakN
MakDE
Ln(K
)
Ln(T [K])
y = a + b*x
Value Standard Error
Intercept 44.66553 7.60899
Slope -7.61774 1.34309
Intercept 10.12592 3.84883
Slope -1.54708 0.67885
Intercept 21.46541 3.79918
Slope -3.56787 0.66936
Intercept 27.07127 8.87171
Slope -4.58721 1.5625
Intercept 77.52242 4.36118
Slope -12.81769 0.76948
Intercept 76.28292 11.77789
Slope -12.77287 2.07811

Thank you!