study of effectiveness of time series modeling (arima) in forecasting stock prices
TRANSCRIPT
International Journal of Computer Science, Engineering and Applications (IJCSEA) Vol.4, No.2, April 2014
DOI : 10.5121/ijcsea.2014.4202 13
STUDY OF EFFECTIVENESS OF TIME SERIESMODELING (ARIMA) IN FORECASTING STOCK
PRICES
Prapanna Mondal1 , Labani Shit1 and Saptarsi Goswami2
1 Student, Bachelor of TechnologyDepartment of Computer Science and Engineering
Institute of Engineering and Management
2Asst. ProfessorDepartment of Computer Science and Engineering
Institute of Engineering and Management
ABSTRACT
Stock price prediction has always attracted interest because of the direct financial benefit and theassociated complexity. From our literature review, we felt the need of a study having sector specificanalysis with a broad range of stocks. In this paper, we have conducted a study on the effectiveness ofAutoregressive Integrated Moving Average (ARIMA)model, on fifty six Indian stocks from different sectors.We have chosen ARIMA model, because of its simplicity and wide acceptability of the model. We also havestudied the effect on prediction accuracy based on various possible previous period data taken. Thecomparison and parameterization of the ARIMA model have been done using Akaike information criterion(AIC). The contribution of the paper , are a) coverage of a good number of Indian stocks b) Analysis of themodels based on sectors c) Analysis of prediction accuracy based on the varying span of previous perioddata.
KEYWORDS
Stock price prediction, Indian Stocks, Sector, Time Series, ARIMA.
1. INTRODUCTION
A time series is a set of well-defined data items collected at successive points at uniform timeintervals. Time series analysis is an important part in statistics, which analyzes data set to studythe characteristics of the data and helps in predicting future values of the series based on thecharacteristics. Forecasting is important in fields like finance, industry, etc. [1] Autoregressiveand Moving Average (ARMA) model is an important method to study time series. The concept ofautoregressive (AR) and moving average (MA) models was formulated by the works of Yule,Slutsky, Walker and Yaglom [1]. Autoregressive Integrated Moving Average (ARIMA) is basedon ARMA Model. The difference is that ARIMA Model converts a non-stationary data to a
International Journal of Computer Science, Engineering and Applications (IJCSEA) Vol.4, No.2, April 2014
14
stationary data before working on it. ARIMA model is widely used to predict linear time seriesdata. [3] The ARIMA models are often referred to as Box-Jenkins models as ARIMA approachwas first popularized by Box and Jenkins. The general transfer function model employed by theARIMA procedure was discussed by Box and Tiao (1975) [3]. ARIMA model is often referred toas ARIMAX model when it includes other time series as input variables. [18] Pankratz (1991)refers to the ARIMAX model as dynamic regression. [3] The ARIMA procedure offers greatflexibility in univariate time series model identification, parameter estimation, and forecasting.
Stock prices are not randomly generated values rather they can be treated as a discrete time seriesmodel and its trend can be analyzed accordingly, hence can also be forecasted. There are variousmotivations for stock forecasting [12], one of them is financial gain. A system that can identifywhich companies are doing well and which companies are not in the dynamic stock market willmake it easy for investors or market or finance professionals make decisions.
Having an excellent knowledge about share price movement in the future helps the investors andfinances personals significantly [2]. Since, it is necessary to identify a model to analyze trends ofstock prices with relevant information for decision making, it recommends that transforming thetime series using ARIMA is a better approach than forecasting directly, as it gives more accurateresults [6]. But only predicting will not help if one cannot figure out the efficiency of the result.Thus, this paper focuses on finding the accuracy of predicted values using ARIMA model on theNSE stocks for various companies from various sectors.
In this paper, we have mainly focused on the amount of accuracy of forecasting stock values forvarious sectors which will help investors understand the market and make a decision to invest inthe stock market. The organization of the paper is as follows. In section II, we discuss about thevarious applications of ARIMA model. In section III, we provide details about the dataset onwhich we have conducted our experiment. In section IV, we discuss about our experimental stepsin details. Section V shows the experimental results and in section VI we conclude.
2. RELATED WORKS
Stock forecasting has been the topic of many surveys and review articles to evaluate theaccuracies of different statistical technique [8] [9] [10]. At present most of the study is based onstock market trend prediction using ARIMA-based neural networks [11].[13] ARIMA is used asboth analytical and forecasting models in the PACAP‐CCER China Database, developed by thePacific‐Basin Capital Markets (PACAP) Research Center at the University of Rhode Island (USA)and th
e SINOFINInformation Service Inc, affiliated with the China Center for Economic Research (CCER) of Peking University (China). [2] ARIMA has been applied to solve real world problems inthe stock market by forecasting the stock prices with the top four companies in Nifty Midcap-50using MATLAB along with performance measure.[15] Combining fuzzy regression model andARIMA model, fuzzy ARIMA (FARIMA) model was developed for the purpose of forecastingthe exchange rate of NT dollars to US Dollars. [16] Another purpose for which ARIMA modelhave been used was for predicting or forecasting price more specifically electricity price of thenext day. Mostly the studies and experiments that were conducted were based on forecastingstock prices of a particular stock, whereas our study emphasizes more on a sector specific studyrelated to stock forecasting.
International Journal of Computer Science, Engineering and Applications (IJCSEA) Vol.4, No.2, April 2014
15
3. DATASETS
We have taken historical data of National Stock Exchange (NSE) fifty six companies from sevensectors, eight companies in each sector from the official website of NSE India [19]. We havetaken twenty three months of training data from April 2012 to February 2014 and predicted nextmonths' data. We have also divided our dataset into three different time periods, one is of sixmonths' from September 2013 to February 2014, another is of twelve months' from March 2013to February 2014 and the other is of eighteen months' from September 2012 to February 2014.
4. METHODOLOGY
4.1 STEP I: MODEL SELECTION , FITTING AND FORECASTING:
4.1.1 Model identification: (ARIMA) model is derived by general modification ofan autoregressive moving average (ARMA) model. This model type is classified asARIMA(p,d,q), where p denotes the autoregressive parts of the data set, d refers to integratedparts of the data set and q denotes moving average parts of the data set and p,d,q is all non-negative integers.
ARIMA models are generally used to analyze time series data for better understanding andforecasting.Initially, the appropriate ARIMA model has to be identified for the particular datasetsand the parameters should have smallest possible values such that it can analyze the data properlyand forecast accordingly. [14] The Akaike Information Criteria (AIC) is a widely used measure ofa statistical model. It is used to quantify the goodness of fit of the model. When comparing two ormore models, the one with the lowest AIC is generally considered to be closer with real data.AICc is AIC with a correction for finite sample sizes.
The AIC does not penalize model complexity as heavily as the BIC (Bayesian InformationCriterion) does. [7] Burnham & Anderson shows that AIC and AICc and BIC all can bederived in the same framework and using AIC/AICc for model selection is theoretically proved tobe more advantageous than using BIC for selecting a model. As suggested by Yang (2005) [14],AIC is asymptotically optimal in selecting the model, under the assumption that the true model isnot in the candidate set (as is virtually always the case in practice); BIC relies on the assumptionthat the true model is in the candidate set which makes it asymptotically less optimal. Hence, wepreferred checking AICc values of data sets for selecting the model to checking the BIC valuesfor the aforementioned.
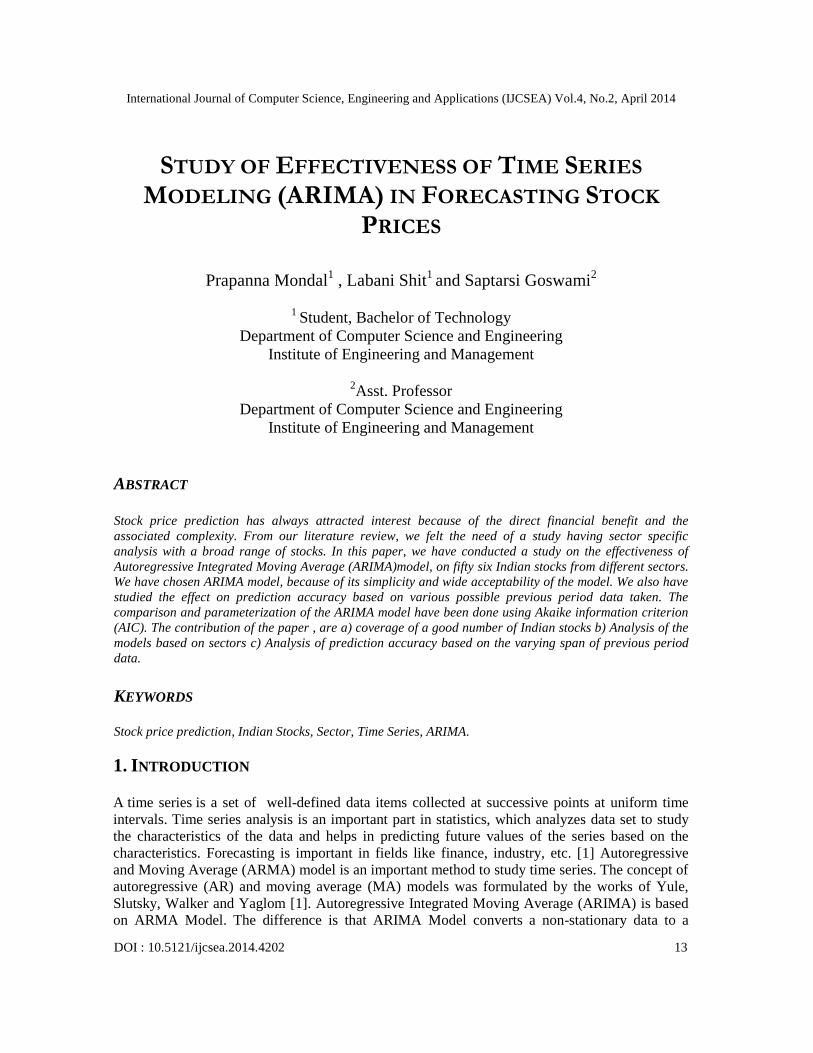
According to Box-Jenkins method, in ARIMA (p, d, q) the value of p and q should be 2 or less ortotal number of parameters should be less than 3 [5]. Therefore, for checking AICc of the modelwe have only checked for p and q values 2 or less. The model with the least AICc value isselected [5]. We are showing our experimental results for model selection for stock of thecompany “Emami Limited”. We have used R [20] for conducting our experiments.
International Journal of Computer Science, Engineering and Applications (IJCSEA) Vol.4, No.2, April 2014
16
MODEL AICc
0,1,0 -2175.07
0,1,1 -2173.66
1,1,1 -2173.29
2,1,1 -2173.59
2,0,1 -2173.03
2,0,2 -2174.07
2,1,2 -2171.66
1,0,2 -2175.97
2,3,2 -2136.32
Table 1: AICc values of dataset of "Emami Limited" for different models
-2176
-2171
-2166
-2161
-2156
-2151
-2146
-2141
-2136
-21310,1,0 0,1,1 1,1,1 2,1,1 2,0,1 2,0,2 2,1,2 1,0,2 2,3,2A
ICc
Values
AICc
Column1
Column2
Figure 1: AICc values for different models
Depending on AICc, model ARIMA(1,0,2) is selected for the above mentioned stock.
4.1.2 Parameter Estimation:
The parameters estimated as per the model identified are as follows:
International Journal of Computer Science, Engineering and Applications (IJCSEA) Vol.4, No.2, April 2014
17
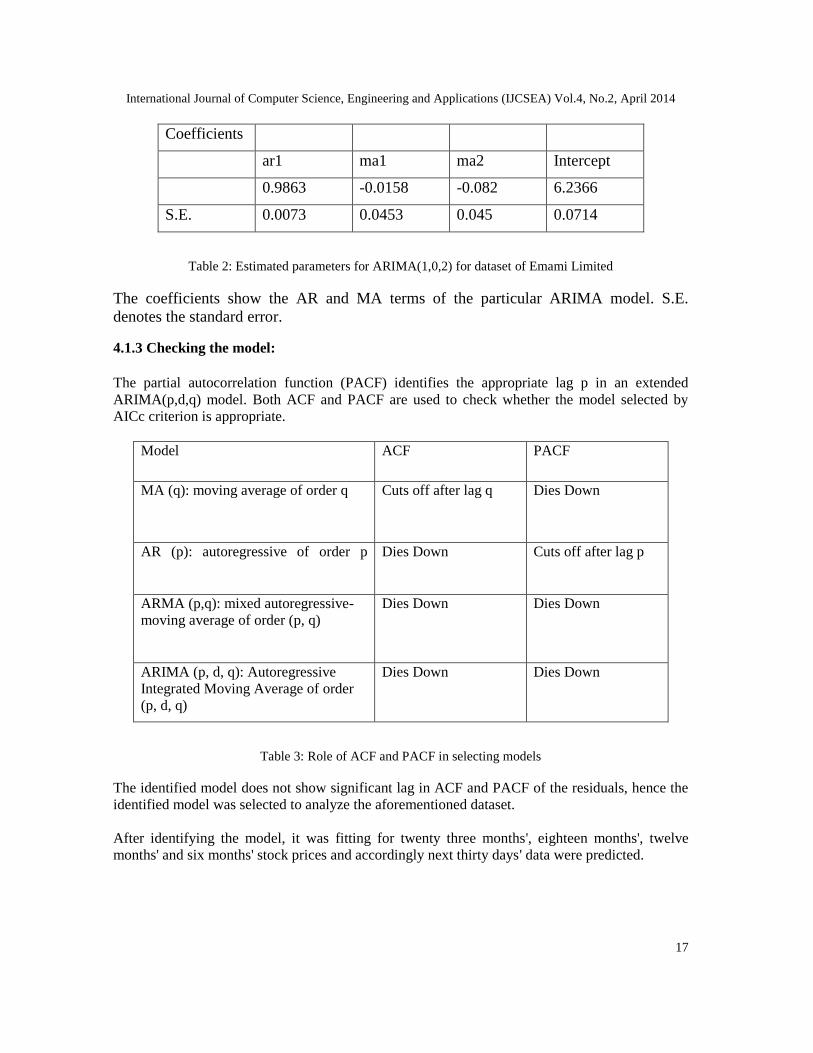
Coefficients
ar1 ma1 ma2 Intercept
0.9863 -0.0158 -0.082 6.2366
S.E. 0.0073 0.0453 0.045 0.0714
Table 2: Estimated parameters for ARIMA(1,0,2) for dataset of Emami Limited
The coefficients show the AR and MA terms of the particular ARIMA model. S.E.denotes the standard error.
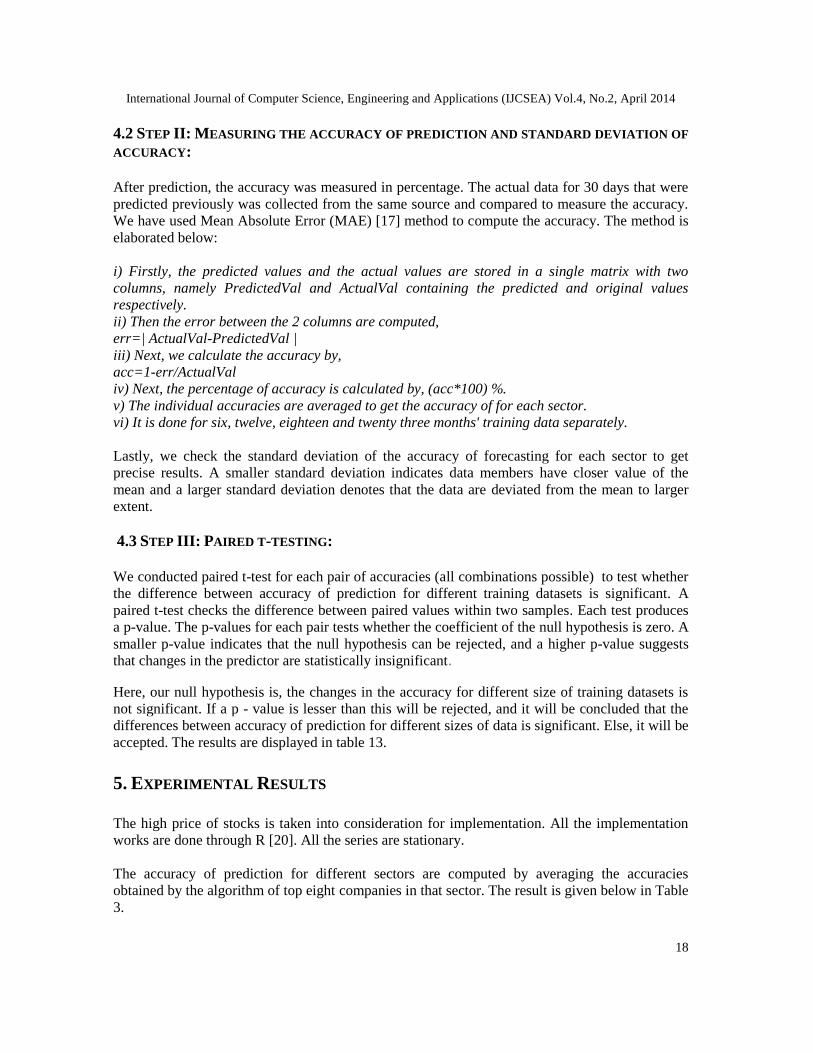
4.1.3 Checking the model:
The partial autocorrelation function (PACF) identifies the appropriate lag p in an extendedARIMA(p,d,q) model. Both ACF and PACF are used to check whether the model selected byAICc criterion is appropriate.
Model ACF PACF
MA (q): moving average of order q Cuts off after lag q Dies Down
AR (p): autoregressive of order p Dies Down Cuts off after lag p
ARMA (p,q): mixed autoregressive-moving average of order (p, q)
Dies Down Dies Down
ARIMA (p, d, q): AutoregressiveIntegrated Moving Average of order(p, d, q)
Dies Down Dies Down
Table 3: Role of ACF and PACF in selecting models
The identified model does not show significant lag in ACF and PACF of the residuals, hence theidentified model was selected to analyze the aforementioned dataset.
After identifying the model, it was fitting for twenty three months', eighteen months', twelvemonths' and six months' stock prices and accordingly next thirty days' data were predicted.
International Journal of Computer Science, Engineering and Applications (IJCSEA) Vol.4, No.2, April 2014
18
4.2 STEP II: MEASURING THE ACCURACY OF PREDICTION AND STANDARD DEVIATION OF
ACCURACY:
After prediction, the accuracy was measured in percentage. The actual data for 30 days that werepredicted previously was collected from the same source and compared to measure the accuracy.We have used Mean Absolute Error (MAE) [17] method to compute the accuracy. The method iselaborated below:
i) Firstly, the predicted values and the actual values are stored in a single matrix with twocolumns, namely PredictedVal and ActualVal containing the predicted and original valuesrespectively.ii) Then the error between the 2 columns are computed,err=| ActualVal-PredictedVal |iii) Next, we calculate the accuracy by,acc=1-err/ActualValiv) Next, the percentage of accuracy is calculated by, (acc*100) %.v) The individual accuracies are averaged to get the accuracy of for each sector.vi) It is done for six, twelve, eighteen and twenty three months' training data separately.
Lastly, we check the standard deviation of the accuracy of forecasting for each sector to getprecise results. A smaller standard deviation indicates data members have closer value of themean and a larger standard deviation denotes that the data are deviated from the mean to largerextent.
4.3 STEP III: PAIRED T-TESTING:
We conducted paired t-test for each pair of accuracies (all combinations possible) to test whetherthe difference between accuracy of prediction for different training datasets is significant. Apaired t-test checks the difference between paired values within two samples. Each test producesa p-value. The p-values for each pair tests whether the coefficient of the null hypothesis is zero. Asmaller p-value indicates that the null hypothesis can be rejected, and a higher p-value suggeststhat changes in the predictor are statistically insignificant.
Here, our null hypothesis is, the changes in the accuracy for different size of training datasets isnot significant. If a p - value is lesser than this will be rejected, and it will be concluded that thedifferences between accuracy of prediction for different sizes of data is significant. Else, it will beaccepted. The results are displayed in table 13.
5. EXPERIMENTAL RESULTS
The high price of stocks is taken into consideration for implementation. All the implementationworks are done through R [20]. All the series are stationary.
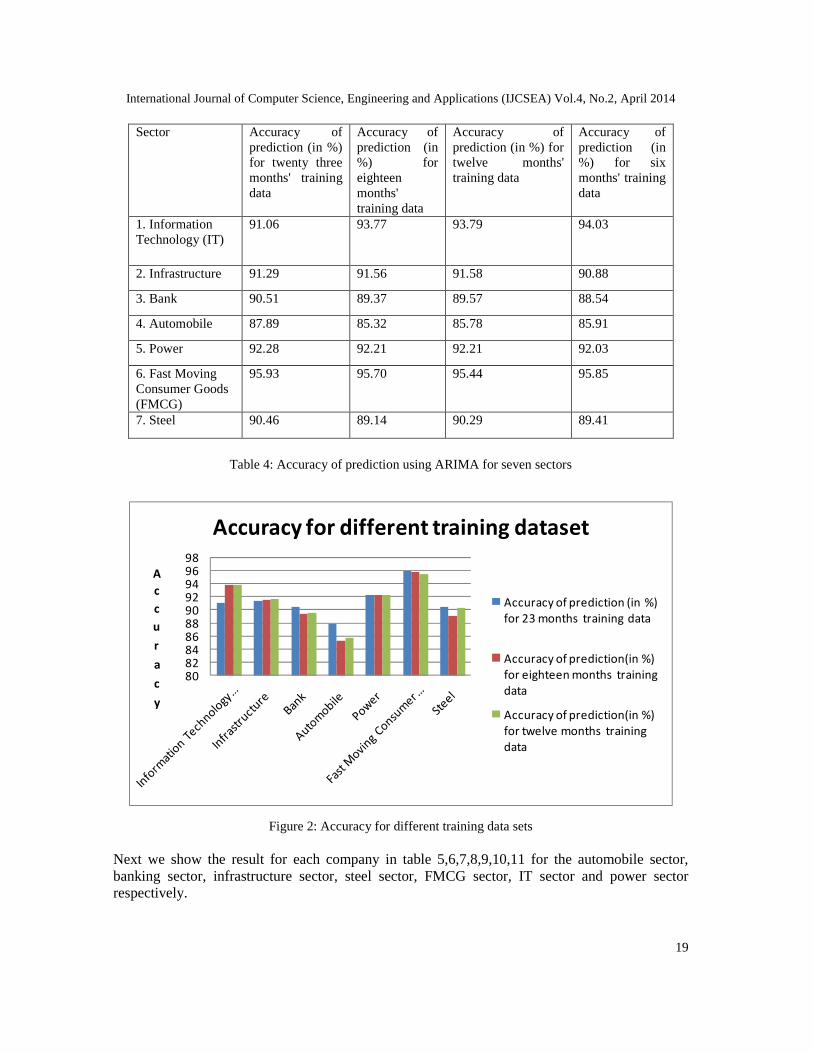
The accuracy of prediction for different sectors are computed by averaging the accuraciesobtained by the algorithm of top eight companies in that sector. The result is given below in Table3.
International Journal of Computer Science, Engineering and Applications (IJCSEA) Vol.4, No.2, April 2014
19
Sector Accuracy ofprediction (in %)for twenty threemonths' trainingdata
Accuracy ofprediction (in%) foreighteenmonths'training data
Accuracy ofprediction (in %) fortwelve months'training data
Accuracy ofprediction (in%) for sixmonths' trainingdata
1. InformationTechnology (IT)
91.06 93.77 93.79 94.03
2. Infrastructure 91.29 91.56 91.58 90.88
3. Bank 90.51 89.37 89.57 88.54
4. Automobile 87.89 85.32 85.78 85.91
5. Power 92.28 92.21 92.21 92.03
6. Fast MovingConsumer Goods(FMCG)
95.93 95.70 95.44 95.85
7. Steel 90.46 89.14 90.29 89.41
Table 4: Accuracy of prediction using ARIMA for seven sectors
80828486889092949698
Accuracy
Accuracy for different training dataset
Accuracy of prediction (in %)for 23 months training data
Accuracy of prediction(in %)for eighteen months trainingdata
Accuracy of prediction(in %)for twelve months trainingdata
Figure 2: Accuracy for different training data sets
Next we show the result for each company in table 5,6,7,8,9,10,11 for the automobile sector,banking sector, infrastructure sector, steel sector, FMCG sector, IT sector and power sectorrespectively.

International Journal of Computer Science, Engineering and Applications (IJCSEA) Vol.4, No.2, April 2014
20
1. Automobile sector:
Company name Accuracy ofprediction(in %)for twenty threemonths' trainingdata
Accuracy ofprediction(in %)for eighteenmonths' trainingdata
Accuracy ofprediction(in%) for twelvemonths'training data
Accuracy ofprediction(in %)for six months'training data
Ashok Leyland 85.99 85.32 85.66 84.37
Bajaj 93.02 93.82 94.72 94.45
Hero Moto Corp. 92.23 92.09 92.23 95.80
Hind Motors 86.67 91.74 93.05 93.41
Mahindra &Mahindra
94.84 94.26 94.45 94.26
Maruti Suzuki 84.99 85.04 78.85 85.65
Tata Motors 95.58 95.32 95.73 94.45
TVS 69.78 44.31 51.55 43.88
Table 5.Results for automobile sector
Figure 3: accuracy for automobile sector
International Journal of Computer Science, Engineering and Applications (IJCSEA) Vol.4, No.2, April 2014
21
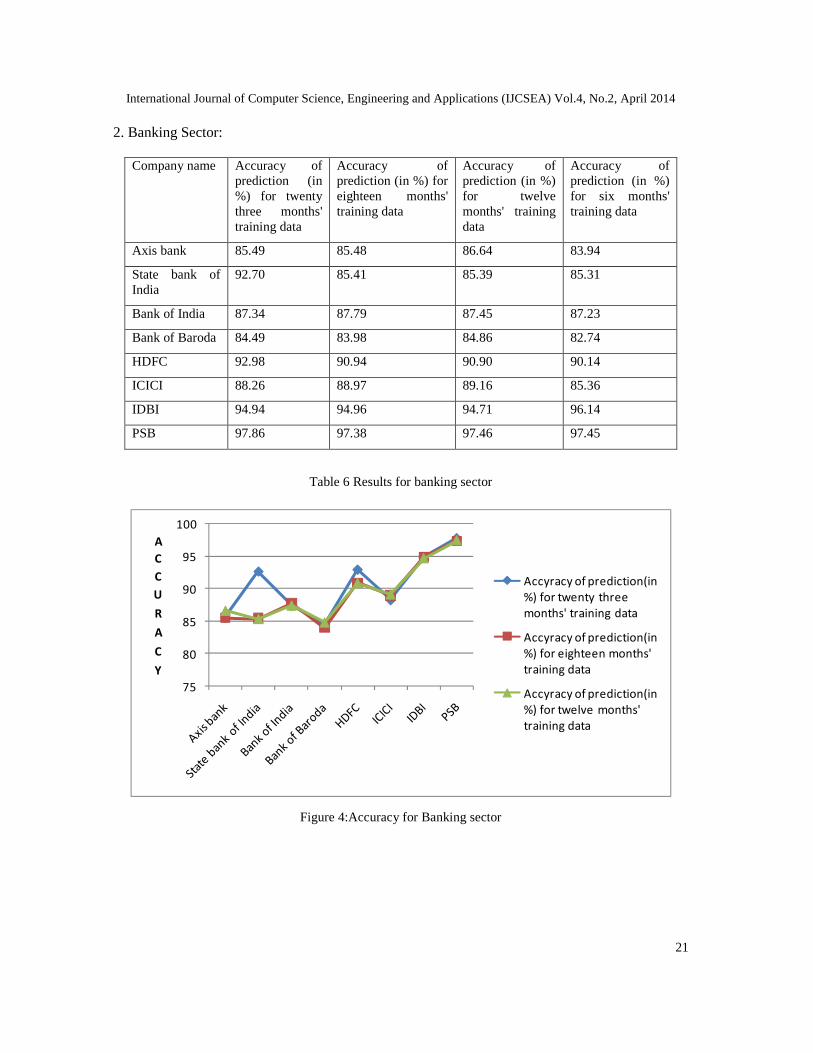
2. Banking Sector:
Company name Accuracy ofprediction (in%) for twentythree months'training data
Accuracy ofprediction (in %) foreighteen months'training data
Accuracy ofprediction (in %)for twelvemonths' trainingdata
Accuracy ofprediction (in %)for six months'training data
Axis bank 85.49 85.48 86.64 83.94
State bank ofIndia
92.70 85.41 85.39 85.31
Bank of India 87.34 87.79 87.45 87.23
Bank of Baroda 84.49 83.98 84.86 82.74
HDFC 92.98 90.94 90.90 90.14
ICICI 88.26 88.97 89.16 85.36
IDBI 94.94 94.96 94.71 96.14
PSB 97.86 97.38 97.46 97.45
Table 6 Results for banking sector
75
80
85
90
95
100ACCURACY
Accyracy of prediction(in%) for twenty threemonths' training data
Accyracy of prediction(in%) for eighteen months'training data
Accyracy of prediction(in%) for twelve months'training data
Figure 4:Accuracy for Banking sector
International Journal of Computer Science, Engineering and Applications (IJCSEA) Vol.4, No.2, April 2014
22
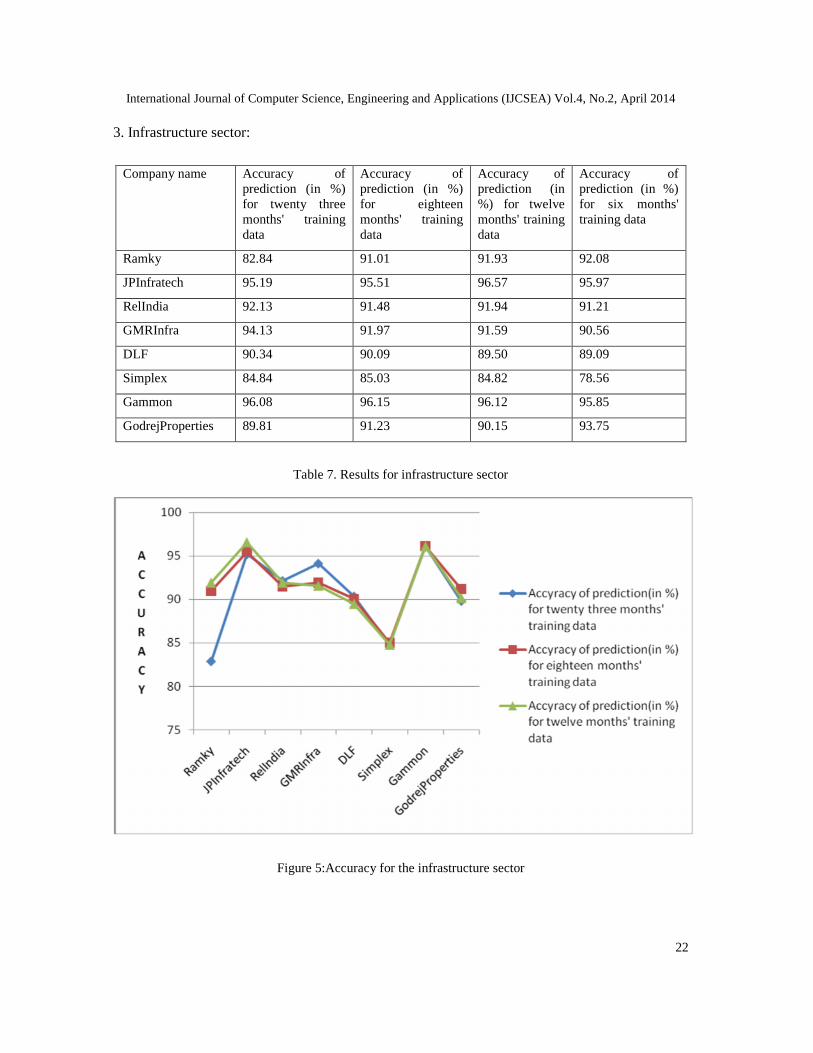
3. Infrastructure sector:
Company name Accuracy ofprediction (in %)for twenty threemonths' trainingdata
Accuracy ofprediction (in %)for eighteenmonths' trainingdata
Accuracy ofprediction (in%) for twelvemonths' trainingdata
Accuracy ofprediction (in %)for six months'training data
Ramky 82.84 91.01 91.93 92.08
JPInfratech 95.19 95.51 96.57 95.97
RelIndia 92.13 91.48 91.94 91.21
GMRInfra 94.13 91.97 91.59 90.56
DLF 90.34 90.09 89.50 89.09
Simplex 84.84 85.03 84.82 78.56
Gammon 96.08 96.15 96.12 95.85
GodrejProperties 89.81 91.23 90.15 93.75
Table 7. Results for infrastructure sector
Figure 5:Accuracy for the infrastructure sector
International Journal of Computer Science, Engineering and Applications (IJCSEA) Vol.4, No.2, April 2014
23
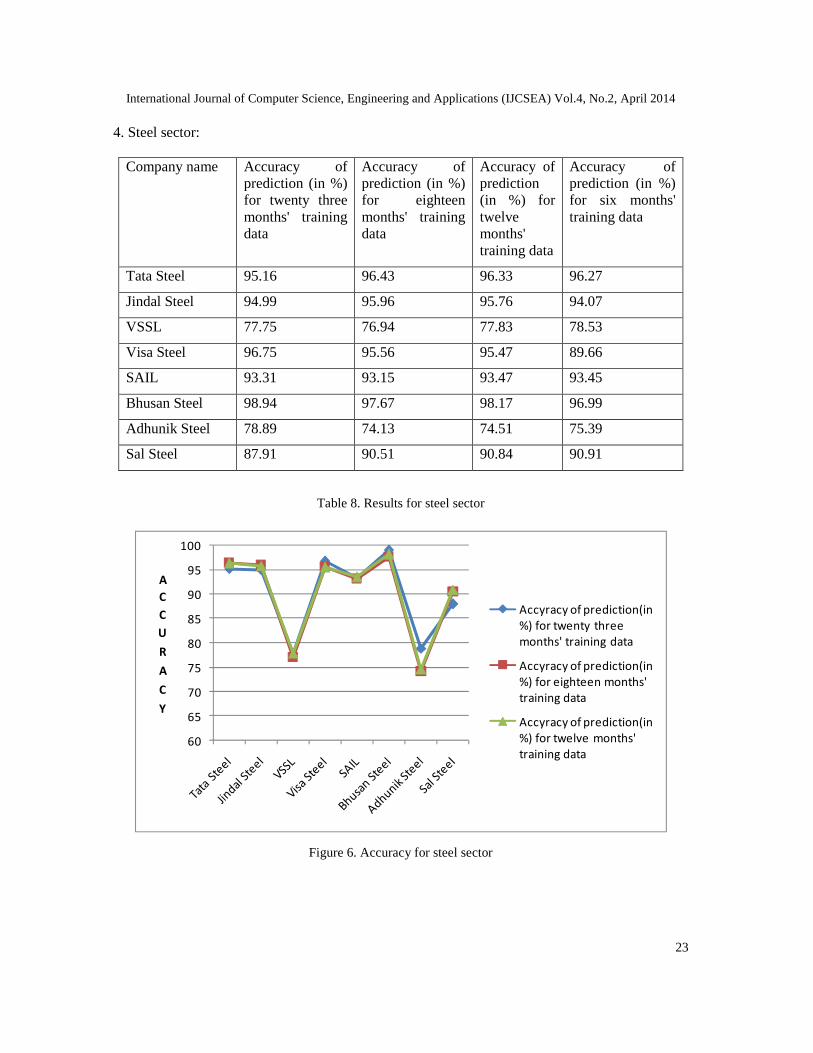
4. Steel sector:
Company name Accuracy ofprediction (in %)for twenty threemonths' trainingdata
Accuracy ofprediction (in %)for eighteenmonths' trainingdata
Accuracy ofprediction(in %) fortwelvemonths'training data
Accuracy ofprediction (in %)for six months'training data
Tata Steel 95.16 96.43 96.33 96.27
Jindal Steel 94.99 95.96 95.76 94.07
VSSL 77.75 76.94 77.83 78.53
Visa Steel 96.75 95.56 95.47 89.66
SAIL 93.31 93.15 93.47 93.45
Bhusan Steel 98.94 97.67 98.17 96.99
Adhunik Steel 78.89 74.13 74.51 75.39
Sal Steel 87.91 90.51 90.84 90.91
Table 8. Results for steel sector
60
65
70
75
80
85
90
95
100
ACCURACY
Accyracy of prediction(in%) for twenty threemonths' training data
Accyracy of prediction(in%) for eighteen months'training data
Accyracy of prediction(in%) for twelve months'training data
Figure 6. Accuracy for steel sector
International Journal of Computer Science, Engineering and Applications (IJCSEA) Vol.4, No.2, April 2014
24
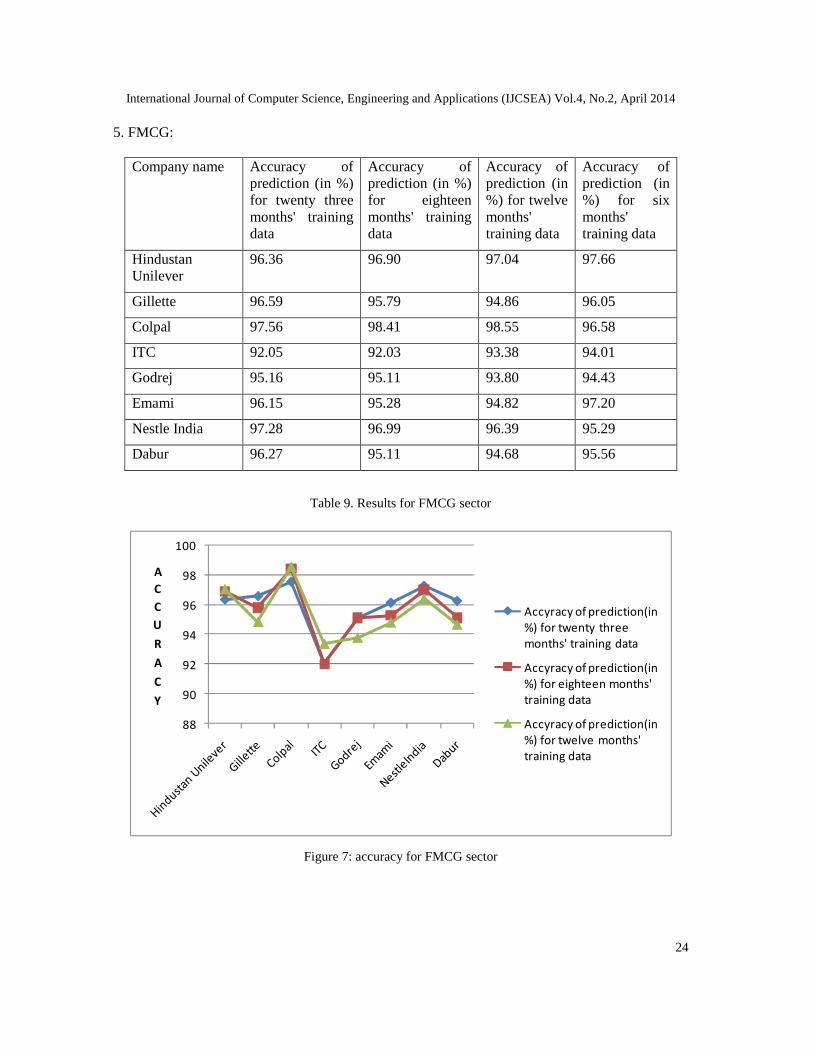
5. FMCG:
Company name Accuracy ofprediction (in %)for twenty threemonths' trainingdata
Accuracy ofprediction (in %)for eighteenmonths' trainingdata
Accuracy ofprediction (in%) for twelvemonths'training data
Accuracy ofprediction (in%) for sixmonths'training data
HindustanUnilever
96.36 96.90 97.04 97.66
Gillette 96.59 95.79 94.86 96.05
Colpal 97.56 98.41 98.55 96.58
ITC 92.05 92.03 93.38 94.01
Godrej 95.16 95.11 93.80 94.43
Emami 96.15 95.28 94.82 97.20
Nestle India 97.28 96.99 96.39 95.29
Dabur 96.27 95.11 94.68 95.56
Table 9. Results for FMCG sector
88
90
92
94
96
98
100
ACCURACY
Accyracy of prediction(in%) for twenty threemonths' training data
Accyracy of prediction(in%) for eighteen months'training data
Accyracy of prediction(in%) for twelve months'training data
Figure 7: accuracy for FMCG sector
International Journal of Computer Science, Engineering and Applications (IJCSEA) Vol.4, No.2, April 2014
25
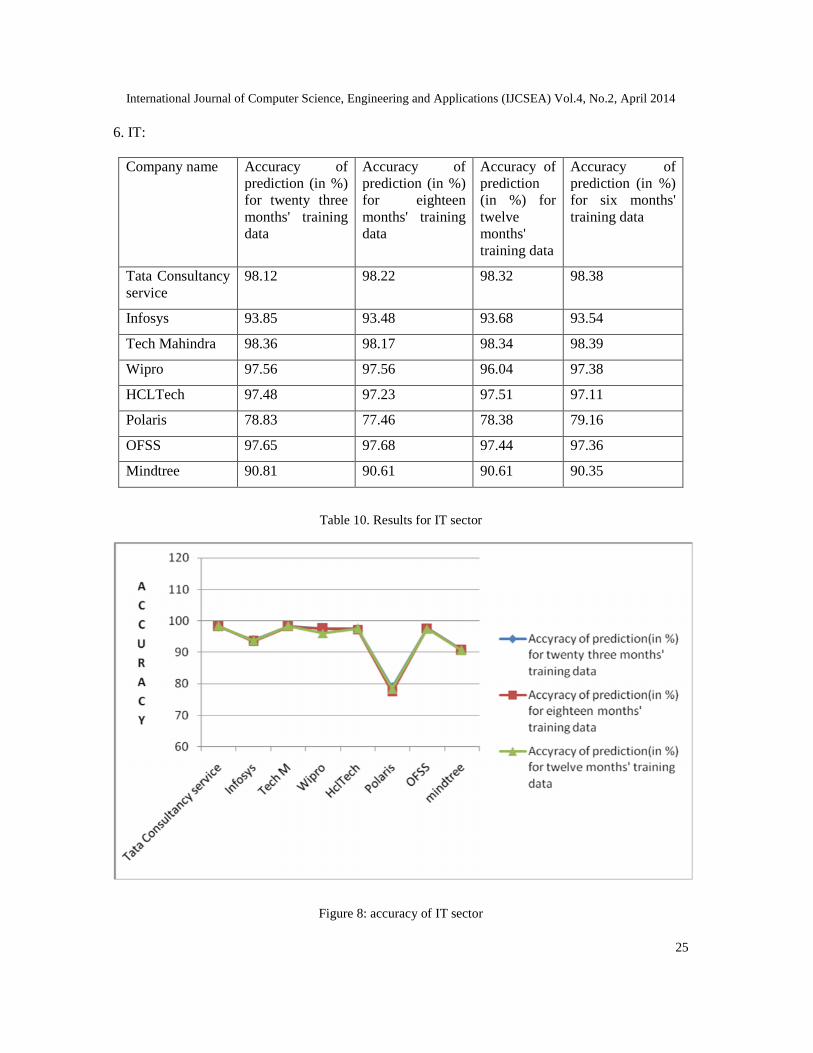
6. IT:
Company name Accuracy ofprediction (in %)for twenty threemonths' trainingdata
Accuracy ofprediction (in %)for eighteenmonths' trainingdata
Accuracy ofprediction(in %) fortwelvemonths'training data
Accuracy ofprediction (in %)for six months'training data
Tata Consultancyservice
98.12 98.22 98.32 98.38
Infosys 93.85 93.48 93.68 93.54
Tech Mahindra 98.36 98.17 98.34 98.39
Wipro 97.56 97.56 96.04 97.38
HCLTech 97.48 97.23 97.51 97.11
Polaris 78.83 77.46 78.38 79.16
OFSS 97.65 97.68 97.44 97.36
Mindtree 90.81 90.61 90.61 90.35
Table 10. Results for IT sector
Figure 8: accuracy of IT sector

International Journal of Computer Science, Engineering and Applications (IJCSEA) Vol.4, No.2, April 2014
26
7. Power:
Company name Accuracy ofprediction (in %)for twenty threemonths' trainingdata
Accuracy ofprediction (in%) foreighteenmonths'training data
Accuracy ofprediction (in%) for twelvemonths'training data
Accuracy ofprediction (in %)for six months'training data
Tata Power 97.82 97.65 97.54 97.02
Reliance Power 96.84 97.47 96.41 97.25
Birla Power 86.61 86.41 86.69 86.67
NTPC 84.18 85.23 83.34 85.58
GPIL 93.43 93.40 94.77 96.28
GIPCL 95.36 94.93 95.38 95.07
Powergrid 96.26 95.66 96.19 95.89
JP Power 87.74 86.98 87.33 82.48
Table 11. Results for power sector
Figure 9: accuracy for Power sector

International Journal of Computer Science, Engineering and Applications (IJCSEA) Vol.4, No.2, April 2014
27
In the next table, we show the standard deviation of accuracy of prediction for eachsector.
Sector Standarddeviation oftwenty threemonths' trainingdata
Standarddeviation ofeighteen months'training data
Standarddeviation oftwelvemonths'training data
Standarddeviation of sixmonths' trainingdata
Automobile 8.401289 16.99188 14.96798 17.47848
Banking 8.238547 15.67122 13.36196 15.77012
Infrastructure 5.073215 3.744663 4.009234 5.63259
Steel 7.619857 8.663484 8.441142 7.718103
Fast MovingConsumerGoods
3.123484 2.468907 2.240957 2.035353
InformationTechnology
6.310874 6.693157 6.341761 6.193422
Power 4.980284 4.873199 5.168635 5.683261
Table 12: Standard deviation of accuracy of forecasting for different sectors
Twenty threemonths' data
Eighteen months'data
Twelve months'data
Eighteenmonths' data
0.2902 _ _
Twelve months'data
0.3138 0.5896 _
Six months' data 0.1983 0.3874 0.3053
Table 13: Null hypothesis testing of accuracy of forecasting for different training data
6. CONCLUSION:
In this paper, we have conducted a study on fifty six stocks from seven sectors. All the stocks thatare selected are listed in National Stock Exchange (NSE) [19]. We have selected twenty threemonths' of data for the set empirical study. We have evaluated the accuracy of the ARIMA modelin predicting the stock prices. AICc has been used to select the best ARIMA model. In our study,

International Journal of Computer Science, Engineering and Applications (IJCSEA) Vol.4, No.2, April 2014
28
we have also changed the time period of previous or historic data and studied its effect onaccuracy.
For all the sectors, Accuracy of ARIMA model in predicting stock prices is above 85%, whichindicates that ARIMA gives good accuracy of prediction. If we discuss about specific sectors,forecasting stocks in FMCG sector using ARIMA model give result with best accuracy. On theother hand accuracy of predictions for the banking sector and automobile sector using ARIMAmodel is lower as compared to that of other sectors. Hence, we need a better model forforecasting stocks of the companies in aforementioned sector.
From the standard deviations of accuracy of forecasting of seven sectors, we see that Automobilesector, steel sector and the banking sector has a high standard deviation which means the valuesare spread over a large range, and there might be some stocks for which ARIMA model does notproduce good results. For Information Technology sector , the standard deviation is not too low ornot too high, whereas we are getting an above 90% accuracy in prediction for this sector. Theremay be a possibility that stock prices of companies of IT sector vary within a high range due tochanges in value of the dollar and other factors.
We see that p-values for all possible combinations are high, hence we cannot reject the nullhypothesis, i.e. the null hypothesis will be accepted which is, the changes in the accuracy fordifferent size of training datasets is not significant.
REFERENCES
[1] Chen, S., et al. "The time series forecasting: from the aspect of network." arXiv preprintarXiv:1403.1713 (2014).
[2] Devi, B. Uma, D. Sundar, and P. Alli. "An Effective Time Series Analysis for Stock Trend PredictionUsing ARIMA Model for Nifty Midcap-50."
[3] Box, George EP, and George C. Tiao. "Intervention analysis with applications to economic andenvironmental problems." Journal of the American Statistical Association 70.349 (1975): 70-79.
[4] Kofi agyarko ababio, June 2012, “Comparative study of stock price forecasting using arima andarimax models”.
[5] L-‐Stern Group Ly Pham , Time Series Analysis with ARIMA – ARCH/GARCH model in R[6] Al Wadia, Mohd Tahir Ismail S, “Selecting Wavelet Transforms Model in Forecasting Financial Time
Series Data Based on ARIMA Model”, Applied Mathematical Sciences, Vol. 5, 2011, no. 7, 315 –326
[7] Anderson, David Raymond. Model based inference in the life sciences: a primer on evidence. NewYork: Springer, 2008.
[8] Chatfield, Chris. The analysis of time series: an introduction. CRC press, 2013.[9] Christodoulos, Charisios, Christos Michalakelis, and Dimitris Varoutas. "Forecasting with limited
data: Combining ARIMA and diffusion models."Technological forecasting and social change 77.4(2010): 558-565.
[10] Pai, Ping-Feng, and Wei-Chiang Hong. "An improved neural network model in forecasting arrivals."Annals of Tourism Research 32.4 (2005): 1138-1141.
[11] Nayak, S. C., and B. B. Mishra. "A Neuro-Genetic Technique for Index Prediction.[12] Liang, Jiuzhen, Wei Song, and Mei Wang. "Stock price prediction based on procedural neural
networks." Advances in Artificial Neural Systems 2011 (2011): 6.[13] Jarrett, Jeffrey E., and Eric Kyper. "ARIMA modeling with intervention to forecast and analyze
chinese stock prices." International Journal of Engineering Business Management 3.3 (2011): 53-58.
International Journal of Computer Science, Engineering and Applications (IJCSEA) Vol.4, No.2, April 2014
29
[14] Yang, Yuhong. "Can the strengths of AIC and BIC be shared? A conflict between modelindentification and regression estimation." Biometrika 92.4 (2005): 937-950.
[15] Tseng, Fang-Mei, et al. "Fuzzy ARIMA model for forecasting the foreign exchange market." Fuzzysets and systems 118.1 (2001): 9-19.
[16] Contreras, J., Espinola, R., Nogales, F. J., & Conejo, A. J. (2003). ARIMA models to predict next-dayelectricity prices. Power Systems, IEEE Transactions on, 18(3), 1014-1020.
[17] Willmott, Cort J., and Kenji Matsuura. "Advantages of the mean absolute error (MAE) over the rootmean square error(RMSE) in assessing average model performance." Climate Research 30.1 (2005):79.
[18] A. Pankratz, Forecasting with Dynamic Regression models, Wiley Interscience, 1991.[19] http://www.nseindia.com/products/content/equities/equities/eq_security.htm.[20] R Development Core Team (2008). R: A language and environment for statistical computing. R
Foundation for Statistical Computing, Vienna, Austria. ISBN 3-900051-07-0, URL http://www.R-project.org.