students’ experiences with collaborative learning in asynchronous computer-supported collaborative...
TRANSCRIPT
omputers in
CComputers in Human Behavior 23 (2007) 496–514
www.elsevier.com/locate/comphumbeh
Human Behavior
Students� experiences with collaborative learningin asynchronous Computer-SupportedCollaborative Learning environments
Silvia Dewiyanti a,*, Saskia Brand-Gruwel a, Wim Jochems a,Nick J. Broers b
a Open University of the Netherlands, Educational Technology Expertise Center (OTEC), P.O. Box 2960,
NL-6401 DL Heerlen, The Netherlandsb University of Maastricht, The Netherlands
Available online 18 November 2004
Abstract
This paper describes an explorative study carried out to gain response from distance stu-
dents on their experiences with collaborative learning in asynchronous computer supported col-
laborative learning (CSCL) environments. In addition, this study also attempts to have a good
grip of crucial aspects concerning collaborative learning. The study was undertaken among dis-
tance learners from the Open University of the Netherlands who were working in groups of 4–
11 persons. During and after the course students� experiences with collaborative learning were
measured and after the course also students� satisfaction with collaborative learning was
assessed. The finding revealed that distance learners appreciate the opportunities to work col-
laboratively. They show positive experiences and are quite satisfied with collaborative learning.
This study also sought to explore individuals as well as course characteristics that influenced
aspects of collaborative learning, and to search aspects of collaborative learning that influenced
students� satisfaction. The findings suggested that a group product influences group process
regulation and group cohesion influences students� satisfaction with collaborative learning.
� 2004 Elsevier Ltd. All rights reserved.
0747-5632/$ - see front matter � 2004 Elsevier Ltd. All rights reserved.
doi:10.1016/j.chb.2004.10.021
* Corresponding author.
E-mail address: [email protected] (S. Dewiyanti).
S. Dewiyanti et al. / Computers in Human Behavior 23 (2007) 496–514 497
Keywords: Asynchronous CSCL environment; Collaborative learning; Distance education; Multilevel
analysis
1. Introduction
Nowadays computer supported collaborative learning (CSCL) environments are
viewed as an important electronic learning medium for distance education. CSCLenvironments can be described as a context where the computer facilitates interac-
tions among learners for acquisition of knowledge, skills and attitudes (Dillenbourg,
1999; Kaye, 1992; Koschman, 1996). Working together while accomplishing a task is
seen as a characteristic of a powerful learning environment, aiming at active con-
struction of knowledge (Van Merrienboer & Paas, 2003). Through a process of inter-
action and negotiation students have an active and constructive role in the learning
process.
Research in recent years has shown that CSCL environments have been used suc-cessfully to promote learning achievements in distance education. Harasim (1989)
described the social, affective and cognitive benefits of collaborative group work
for distance learners. From her study, she concluded that collaborative learning pro-
motes more active and more effective learning for distance education. Hiltz (1995)
also reported that students in collaborative learning conditions had more construc-
tive learning processes and attained higher grades than students in other conditions.
These environments provide distance learners the opportunity to work together
and to practice critical reflection, conflict negotiation, and consensus building asin face-to-face learning environments. Besides, students are encouraged to exchange
ideas, to share perspectives and arguments, and to use previous knowledge or expe-
rience in order to decide on the best solution for the problem to be solved. So, the use
of CSCL environments can both help to overcome physical isolation between
students and teachers, and help to improve learning.
CSCL environments are often promoted as an open, safe, and trustable learning
environment that allows equal opportunities for learners to participate without the
limitation on knowledge levels (Scardamalia & Bereiter, 1994). These learning envi-ronments stimulate students to express their ideas and arguments without any feeling
to be penalised or ridiculed (Rowntree, 1992). In a CSCL environment students have
opportunity to take over some control of their own learning and to be active learners
who are not only absorbing information but also connecting previous knowledge
and new information to gain a deeper level of understanding. The use of an asyn-
chronous CSCL environment is recommended for distance education above a syn-
chronous CSCL environment because it offers flexibility in time to read, to reflect
and to compose the responses (Abrami & Bures, 1996).Students� participation in collaborative learning is seen as the interaction and the
contribution of group members when they are collaborating to solve a problem or to
accomplish a task. Various elements in an asynchronous CSCL environment may
influence students� participation. The important elements are course characteristics,
498 S. Dewiyanti et al. / Computers in Human Behavior 23 (2007) 496–514
individual characteristics, different aspects of collaborative learning process and
satisfaction.
Course characteristics. Group size and the type of product students must deliver
(individual or group product) are considered to be essential characteristics of courses
in CSCL environments. Group size influences students participation in collaborationsubstantially (Johnson & Johnson, 1994; Shaw, 1981). Collaborating in small groups
makes it easier to stimulate non-active participants, promotes a higher sense of
presence and engagement, and increases the individual contributions (Bates, 1995;
Hammond, 2000; Kaye, 1992; Wegerif, 1998). Regarding the type of product, Cohen
(1994) argued that the task assigned to a group determines how group members
interact. Courses that encourage collaboration in general show that the students be-
come more active participants in the learning process when the task requires a high
level of collaboration. A high-level collaborative task, for example requesting agroup product, requires group members not only to share information or to deter-
mine how to divide their labors, but also to discuss how to proceed as a group.
On the contrary, a task with low level of collaboration, for example, requesting sub-
mission of individual report, lacks of group interdependency that might hinder
group members to collaborate while accomplishing the task (Johnson & Johnson,
1994).
Individual characteristics. Individual characteristics such as students� ideas about
collaborative learning and students experience with the use of technology might in-hibit or promote their participation in the collaborative learning processes (Kagan,
1994). For example, in CSCL environments students are required to communicate by
using text-based communication tool. A lack of experience of using text-based com-
munication might influence students participation in their groups (Ross, 1996;
Zafeiriou, Nunes, & Ford, 2001).
Collaboration process. The process of collaboration itself is the heart of CSCL.
Collaboration refers to activities that are related to how the group is functioning
in accomplishing a task. Within collaborative learning, the responsibility for learn-ing shifts from the teacher to the group members (Bruffee, 1995). This provides an
opportunity for the group members to regulate their collaboration process. As a
group, they should plan the working process together and make sure that the
process will be goal directed. In order to achieve the learning goals group mem-
bers need to support each other. They should discuss the learning content in
depth and maintain the ongoing collaborative process. Determining strategy, con-
tributing ideas, handling internal conflicts and monitoring group processes are
important aspects within the collaborative learning. Thus, in order to reach thelearning goals all group members have the responsibility to participate in collab-
oration process.
Satisfaction with collaborative learning. Students� satisfaction with collaborative
learning can be described as the degree to which a student feels a positive association
with his or her own collaborative learning experiences. Students� satisfaction can
have repercussions on how students work together, such as whether everyone does
his/her part of the work, whether group members can work with each other, whether
group members remain on the task (no fighting, no fooling around or too much chat-
S. Dewiyanti et al. / Computers in Human Behavior 23 (2007) 496–514 499
ting), and whether there is a good working atmosphere in the group (Gunawardena
et al., 2001).
Although several studies (Harasim, 2001; Hiltz, 1995) have reported the benefits
of collaborative learning for distance learners, but still there are many questions sur-
rounded the implementation of collaborative learning in distance education. Little isknown on students� experiences during collaboration process in asynchronous CSCL
environments. Understanding students� experiences is important because this might
help designers to provide specific instructions to enhance the quality of learning
process.
This paper describes an explorative study carried out to gain response from
distance learners on how they experience collaborative learning in asynchronous
CSCL environments and attempts to have a good grip of crucial aspects concerning
collaborative learning. In the end, the findings of this study should providepractical implications for supporting effective learning in asynchronous CSCL
environments.
The specific questions addressed in this study were as follows:
1. How do distance students experience collaborative learning in asynchronous
CSCL environments?
2. Are distance students, who in general are unfamiliar to each other, satisfied with
collaborative learning in asynchronous CSCL environments?3. To what extent do the individual characteristics and the course characteristics
influence students� experiences with collaborative learning?
4. What aspects with respect to collaboration do influence students� satisfaction?
5. How do students actually collaborate in an asynchronous CSCL-environment?
2. Method
2.1. Participants
Students from five distance learning courses of the Open University of the Neth-
erlands volunteered for this study. Participants were asked to complete three surveys
(before, during and after the course). Respondents at the first survey were 112 stu-
dents (76 men and 36 women). Furthermore, 51 participants responded to the second
survey (34 men and 17 women). Finally, 67 participants (47 men and 20 women) res-ponded to the last survey. Table 1 summarises number of participants for each
courses across surveys.
2.2. Materials
2.2.1. Courses
All the courses required students to work in groups and to submit either a group
product or an individual product. To facilitate communication within groups, all the
Table 1
Number of participants for each course across the surveys
Course Surveys
Before the course During the course After the course
Change management 30 13 13
Law 16 15 15
Informaticsa 19 – 15
Management science 33 8 16
Environmental science 14 15 8
a Because of the short duration of the informatics course, the participants from this course only
responsed at the first and the third survey.
Table 2
Course characteristics
Course Communication tool Number of students
in a group
Period Type of product
Change management Newsgroup 3–4 25 Weeks Individual product
Law Newsgroup 4 24 Weeks Group product
Informatics Newsgroup 4 2 Weeks Group product
Management science Newsgroup 8–11 20 Weeks Individual product
Environmental science E-room 4 17 Weeks Group product
500 S. Dewiyanti et al. / Computers in Human Behavior 23 (2007) 496–514
courses used asynchronous computer mediated communication. The descriptions of
the course characteristics are summarised in Table 2.
2.2.2. Questionnaire on individual characteristics
The individual characteristics questionnaire consists of five variables. The first
variable assesses student attitude towards collaboration (attitude towards collabora-
tion, 12 items, Cronbach�s a = 0.87), e.g., ‘‘I find that it is interesting to work to-gether in a group’’. The second variable gathers information about individual
activities in a group (group activity, 6 items, Cronbach�s a = 0.82), e.g., ‘‘I like to
take the initiative’’. The third variable is intent on get information on students famil-
iarity with text-based communication (perceived text-based communication, 4 items,
Cronbach�s a = 0.86), e.g., ‘‘Discussion group is a pleasant way to communicate’’.
The fourth variable aims at gaining information on student prior knowledge (prior
knowledge, 4 items, Cronbach�s a = 0.76), e.g., ‘‘I can explain to other students
about this subject’’, and, the last variable assesses students opinion on using internet(opinion on using internet, 5 items, Cronbach�s a = 0.75), e.g., ‘‘Internet is a pleasant
way to get information all over the world’’. The format of all items is a Likert-type
scale, ranging from 1 (strongly disagree) to 5 (strongly agree).
2.2.3. Questionnaire on collaborative learning
The students� experiences with collaborative learning was assessed with six varia-
bles (23 items all in) developed for the purpose of the present study and three existing
S. Dewiyanti et al. / Computers in Human Behavior 23 (2007) 496–514 501
variables. These six variables include (a) Monitoring Working Procedures (8 items,
Cronbach�s a = 0.87) e.g., ‘‘I remind group member who do not work together prop-
erly’’, (b) Participation (5 items, Cronbach�s a = 0.85), e.g. ‘‘All group members par-
ticipate in discussions to reach a consensus’’, (c) Monitoring Group Progress (5
items, Cronbach�s a = 0.83) e.g., ‘‘I have responsibility to maintain our plan’’, (d)Helping Each Other (3 items, Cronbach�s a = 0.70), e.g., ‘‘I help other group member
who have difficulty to understand the learning material’’ (e) Giving Feedback (2
items, Cronbach�s a = 0.75) e.g., ‘‘I constantly gave feedback to other group member
works’’, and (f) Need to be Monitored (2 items, Cronbach�s a = 0.68) e.g., ‘‘I feel
pleasant if someone reminds me about the deadline’’. Then, three existing variables
assess the Team Development, the Intra-group Conflict and the Task Strategy. The
Team Development is adapted from Savicki et al. (Savicki, Kelley, & Lingenfelter,
1996) to assess the degree of cohesion that was achieved while group members havebeen working together (11 items, Cronbach�s a = 0.91), e.g., ‘‘All group members
understand the group goals and were committed to them’’. The Intra-group Conflict
consists of seven items. Items in this variable are adapted from Saavedra et al. (Saav-
edra, Early, & Van Dyne, 1993) and measure the degree of conflicts in a group (7
items, Cronbach�s a = 0.72), e.g., ‘‘There was a lot of tension among people in our
group’’. The Task Strategy is adapted from Saavedra et al. (Saavedra et al., 1993)
and assesses the decisions and choices made by a group that performs the task (7
items, Cronbach�s a = 0.81), e.g., ‘‘Our group developed a good strategy for doingthe tasks’’. The format of all items is a Likert-type scale, ranging from 1 (strongly
disagree) to 5 (strongly agree).
2.2.4. Questionnaire on satisfaction with collaborative learning
This questionnaire consists of three variables that measure (a) satisfaction with
group members attitudes (6 items, Cronbach�s a = 0.86), e.g., ‘‘All group members
can get along well’’, (b) satisfaction with learning in the group (5 items, Cronbach�sa = 0.87), e.g., ‘‘I learn a lot from other group members’’, and (c) satisfaction withgroup working (4 items, Cronbach�s a = 0.82), e.g., ‘‘I feel pleasant to work together
in the group to solve a task’’. In addition students� satisfaction over their final prod-
uct was measured with a single item ‘‘I am satisfied with the final product’’. The for-
mat of all items is a Likert-type scale, ranging from 1 (strongly disagree) to 5
(strongly agree).
2.2.5. Content analysis
Content analysis is aimed to gain more detailed understanding of learners activ-ities during collaborative learning. Based on previous studies in analysing students�messages (Henri, 1992; Van Boxtel, van der Linden, & Kanselaar, 2000; Veerman,
2000; Veldhuis-Diermanse, 2002), a coding scheme was developed to analyse stu-
dents� messages. The coding scheme consists of six functional dimensions and 19 spe-
cific categories (Table 3).
The Regulation dimension consists of contribution about coordinating activities
of learners, e.g. ‘‘I propose that we should finish the draft within two weeks’’. The
Consensus dimension consists approval expressions of an idea, e.g. ‘‘Yes, I agree’’
Table 3
Coding scheme
Dimensions Categories
Regulation Orientation
Plan
Reflection
Monitoring general
Monitoring working procedures
Monitoring working progress
Monitoring participation
Consensus Reach consensus
Try to reach consensus
Conflict Conflict
Content Ask
Explain
Argue
Product
External resources
Social Negative emotion, positive emotion, off task
Technology Technology
502 S. Dewiyanti et al. / Computers in Human Behavior 23 (2007) 496–514
of ‘‘That is absolutely correct’’. The Conflict dimension indicates diagreement of
learners activities, e.g. ‘‘I do not like the way you work’’. The Content dimension in-cludes contributions about activities to gain domain knowledge, e.g. ‘‘I do not
understand what you mean. Can you explain it?’’. The Social dimension contains
emotional expressions and non-task information, e.g. ‘‘You did a great work’’ or
‘‘I had a nice weekend’’. The Technology dimension describes expressions about
the use of computer, e.g. ‘‘How can I attach a document’’.
In order to apply this coding scheme, each message was broken down into manage-
able items, so-called units, for subsequent allocation into relevant categories. Each
unit was assigned only to one category. Because one message might contain more thanone topics, the base unit of analysis is sentences within one message. When two con-
tinuous sentences dealt with the same topic, they were counted as one unit. And, when
one sentence contained two topics, it was counted as two separate units.
Using this coding scheme, two raters independently segmented the messages and
classified the units into the appropriate category. If a unit could not be categorised
(e.g. ambiguous statements) then the rest category was used.
Coding messages was completed in two steps to establish a good reliability be-
tween the raters. In the beginning, 10 postings transcripts were randomly selectedand were coded independently by the two raters. Then the codes were compared
to reach consensus on the use of the categories. This process allowed for the coding
categories to be further refined and for the raters to discuss ambiguity or disagree-
ment until consensus was reached. The first training session between two raters
across all discourse categories reached a Cohen�s j value of .48. After an intensive
training, Cohen�s j reached value of 0.62. Then the remaining discourse was coded
by one rater.
S. Dewiyanti et al. / Computers in Human Behavior 23 (2007) 496–514 503
2.3. Design and procedure
The surveys were administered in the period of six months (dependent on the
courses starting dates and the duration of the courses involved). All surveys were dis-
tributed via e-mail, regular mail or at a face-to-face meeting. Participants were askedto complete the survey individually and to return them to the researcher via elec-
tronic mail or regular post. After one week a reminder was sent to the non-
respondents.
Three surveys concerning individual characteristics, experiences with collabora-
tive learning and satisfaction were administered before, during and after the course.
Table 4 provides an overview of the different measurements and moments of surveys
administration.
The first survey administered before the courses started was intended to get infor-mation on students characteristics. The second survey was designed to retrieve infor-
mation on students� experiences with collaborative learning and was administered
halfway the course. The third survey was designed to gain information on students�experiences with collaborative learning as well as on students� satisfaction with col-
laborative learning. This survey was administered after the course was completed. In
addition, messages from one of five groups from the Law course was analysed as a
sample to explore activities while students were working in the group.
3. Results
3.1. Individual characteristics
Before giving the results concerning the research questions, a closer look is taken
at the characteristics of the students (the first survey). Means and standard devia-
tions on the individual characteristics variables are presented in Table 5.The means range from 3.32 to 4.03 indicating that students scored above midpoint
on all the scales. There were no significant differences on the individual characteris-
Table 4
Design of the study
Course Surveys
Before During After
Change management O1 O2 O2 + O3
Law O1 O2 O2 + O3 + O4
Informatics O1 – O2 + O3
Management science O1 O2 O2 + O3
Environmental science O1 O2 O2 + O3
O1 = individual characteristics.
O2 = experience of collaborative learning processes.
O3 = satisfaction.
O4 = content analysis of one of the five groups from the Law course.
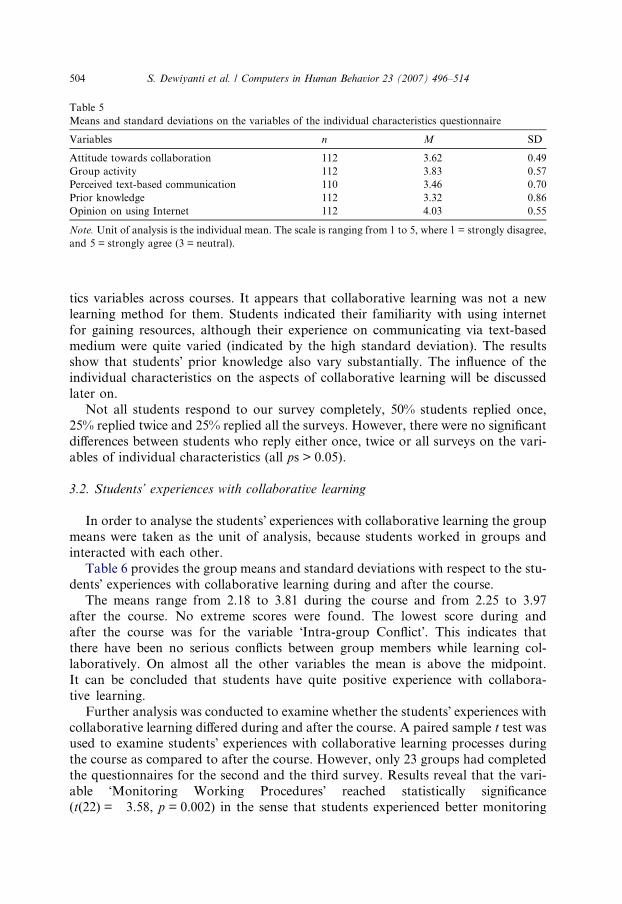
Table 5
Means and standard deviations on the variables of the individual characteristics questionnaire
Variables n M SD
Attitude towards collaboration 112 3.62 0.49
Group activity 112 3.83 0.57
Perceived text-based communication 110 3.46 0.70
Prior knowledge 112 3.32 0.86
Opinion on using Internet 112 4.03 0.55
Note. Unit of analysis is the individual mean. The scale is ranging from 1 to 5, where 1 = strongly disagree,
and 5 = strongly agree (3 = neutral).
504 S. Dewiyanti et al. / Computers in Human Behavior 23 (2007) 496–514
tics variables across courses. It appears that collaborative learning was not a new
learning method for them. Students indicated their familiarity with using internet
for gaining resources, although their experience on communicating via text-based
medium were quite varied (indicated by the high standard deviation). The resultsshow that students� prior knowledge also vary substantially. The influence of the
individual characteristics on the aspects of collaborative learning will be discussed
later on.
Not all students respond to our survey completely, 50% students replied once,
25% replied twice and 25% replied all the surveys. However, there were no significant
differences between students who reply either once, twice or all surveys on the vari-
ables of individual characteristics (all ps > 0.05).
3.2. Students’ experiences with collaborative learning
In order to analyse the students� experiences with collaborative learning the group
means were taken as the unit of analysis, because students worked in groups and
interacted with each other.
Table 6 provides the group means and standard deviations with respect to the stu-
dents� experiences with collaborative learning during and after the course.
The means range from 2.18 to 3.81 during the course and from 2.25 to 3.97after the course. No extreme scores were found. The lowest score during and
after the course was for the variable �Intra-group Conflict�. This indicates that
there have been no serious conflicts between group members while learning col-
laboratively. On almost all the other variables the mean is above the midpoint.
It can be concluded that students have quite positive experience with collabora-
tive learning.
Further analysis was conducted to examine whether the students� experiences with
collaborative learning differed during and after the course. A paired sample t test wasused to examine students� experiences with collaborative learning processes during
the course as compared to after the course. However, only 23 groups had completed
the questionnaires for the second and the third survey. Results reveal that the vari-
able �Monitoring Working Procedures� reached statistically significance
(t(22) = �3.58, p = 0.002) in the sense that students experienced better monitoring
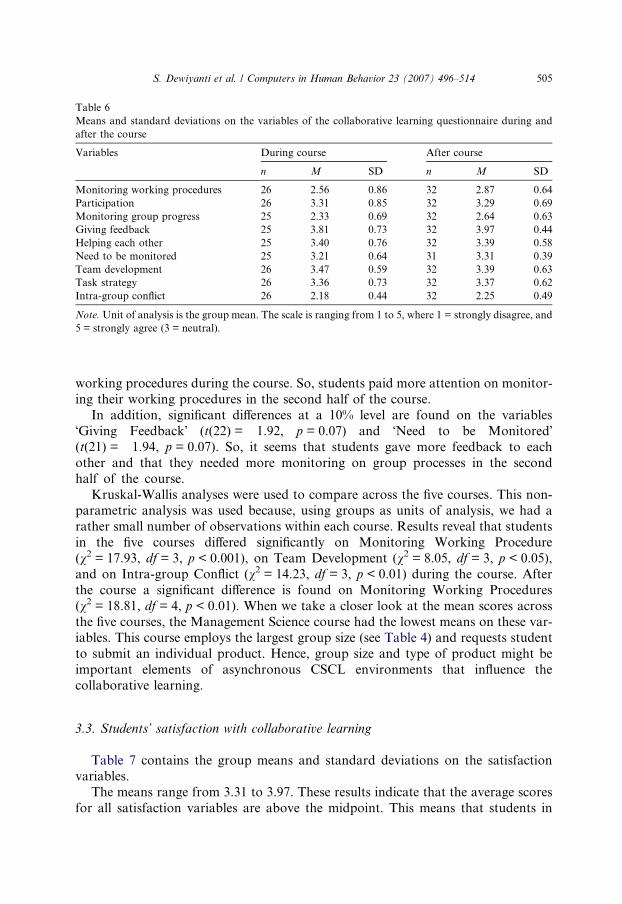
Table 6
Means and standard deviations on the variables of the collaborative learning questionnaire during and
after the course
Variables During course After course
n M SD n M SD
Monitoring working procedures 26 2.56 0.86 32 2.87 0.64
Participation 26 3.31 0.85 32 3.29 0.69
Monitoring group progress 25 2.33 0.69 32 2.64 0.63
Giving feedback 25 3.81 0.73 32 3.97 0.44
Helping each other 25 3.40 0.76 32 3.39 0.58
Need to be monitored 25 3.21 0.64 31 3.31 0.39
Team development 26 3.47 0.59 32 3.39 0.63
Task strategy 26 3.36 0.73 32 3.37 0.62
Intra-group conflict 26 2.18 0.44 32 2.25 0.49
Note. Unit of analysis is the group mean. The scale is ranging from 1 to 5, where 1 = strongly disagree, and
5 = strongly agree (3 = neutral).
S. Dewiyanti et al. / Computers in Human Behavior 23 (2007) 496–514 505
working procedures during the course. So, students paid more attention on monitor-
ing their working procedures in the second half of the course.
In addition, significant differences at a 10% level are found on the variables
�Giving Feedback� (t(22) = �1.92, p = 0.07) and �Need to be Monitored�(t(21) = �1.94, p = 0.07). So, it seems that students gave more feedback to each
other and that they needed more monitoring on group processes in the second
half of the course.
Kruskal-Wallis analyses were used to compare across the five courses. This non-parametric analysis was used because, using groups as units of analysis, we had a
rather small number of observations within each course. Results reveal that students
in the five courses differed significantly on Monitoring Working Procedure
(v2 = 17.93, df = 3, p < 0.001), on Team Development (v2 = 8.05, df = 3, p < 0.05),
and on Intra-group Conflict (v2 = 14.23, df = 3, p < 0.01) during the course. After
the course a significant difference is found on Monitoring Working Procedures
(v2 = 18.81, df = 4, p < 0.01). When we take a closer look at the mean scores across
the five courses, the Management Science course had the lowest means on these var-iables. This course employs the largest group size (see Table 4) and requests student
to submit an individual product. Hence, group size and type of product might be
important elements of asynchronous CSCL environments that influence the
collaborative learning.
3.3. Students’ satisfaction with collaborative learning
Table 7 contains the group means and standard deviations on the satisfactionvariables.
The means range from 3.31 to 3.97. These results indicate that the average scores
for all satisfaction variables are above the midpoint. This means that students in
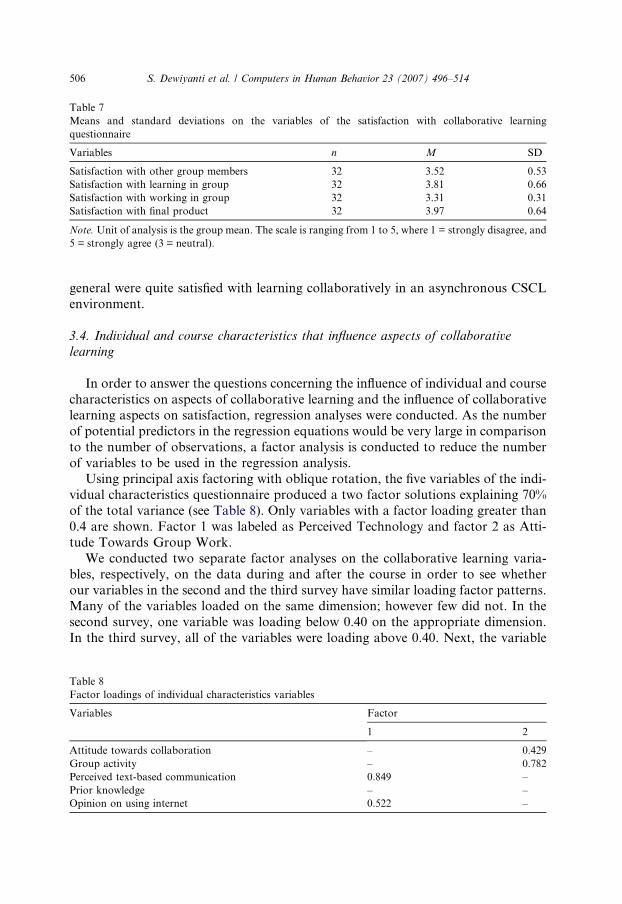
Table 7
Means and standard deviations on the variables of the satisfaction with collaborative learning
questionnaire
Variables n M SD
Satisfaction with other group members 32 3.52 0.53
Satisfaction with learning in group 32 3.81 0.66
Satisfaction with working in group 32 3.31 0.31
Satisfaction with final product 32 3.97 0.64
Note. Unit of analysis is the group mean. The scale is ranging from 1 to 5, where 1 = strongly disagree, and
5 = strongly agree (3 = neutral).
506 S. Dewiyanti et al. / Computers in Human Behavior 23 (2007) 496–514
general were quite satisfied with learning collaboratively in an asynchronous CSCL
environment.
3.4. Individual and course characteristics that influence aspects of collaborative
learning
In order to answer the questions concerning the influence of individual and course
characteristics on aspects of collaborative learning and the influence of collaborative
learning aspects on satisfaction, regression analyses were conducted. As the number
of potential predictors in the regression equations would be very large in comparison
to the number of observations, a factor analysis is conducted to reduce the number
of variables to be used in the regression analysis.Using principal axis factoring with oblique rotation, the five variables of the indi-
vidual characteristics questionnaire produced a two factor solutions explaining 70%
of the total variance (see Table 8). Only variables with a factor loading greater than
0.4 are shown. Factor 1 was labeled as Perceived Technology and factor 2 as Atti-
tude Towards Group Work.
We conducted two separate factor analyses on the collaborative learning varia-
bles, respectively, on the data during and after the course in order to see whether
our variables in the second and the third survey have similar loading factor patterns.Many of the variables loaded on the same dimension; however few did not. In the
second survey, one variable was loading below 0.40 on the appropriate dimension.
In the third survey, all of the variables were loading above 0.40. Next, the variable
Table 8
Factor loadings of individual characteristics variables
Variables Factor
1 2
Attitude towards collaboration – 0.429
Group activity – 0.782
Perceived text-based communication 0.849 –
Prior knowledge – –
Opinion on using internet 0.522 –
S. Dewiyanti et al. / Computers in Human Behavior 23 (2007) 496–514 507
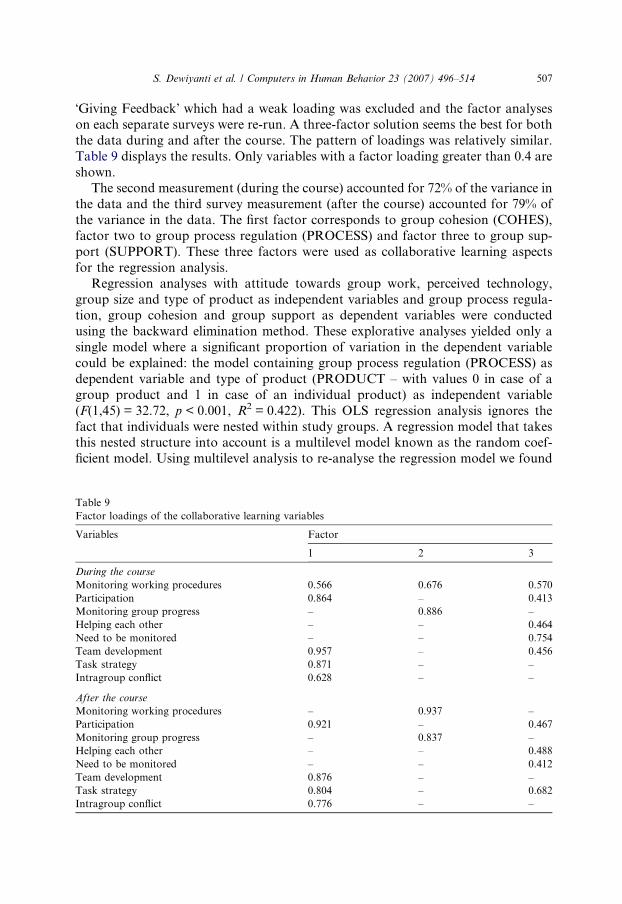
�Giving Feedback� which had a weak loading was excluded and the factor analyses
on each separate surveys were re-run. A three-factor solution seems the best for both
the data during and after the course. The pattern of loadings was relatively similar.
Table 9 displays the results. Only variables with a factor loading greater than 0.4 are
shown.The second measurement (during the course) accounted for 72% of the variance in
the data and the third survey measurement (after the course) accounted for 79% of
the variance in the data. The first factor corresponds to group cohesion (COHES),
factor two to group process regulation (PROCESS) and factor three to group sup-
port (SUPPORT). These three factors were used as collaborative learning aspects
for the regression analysis.
Regression analyses with attitude towards group work, perceived technology,
group size and type of product as independent variables and group process regula-tion, group cohesion and group support as dependent variables were conducted
using the backward elimination method. These explorative analyses yielded only a
single model where a significant proportion of variation in the dependent variable
could be explained: the model containing group process regulation (PROCESS) as
dependent variable and type of product (PRODUCT – with values 0 in case of a
group product and 1 in case of an individual product) as independent variable
(F(1,45) = 32.72, p < 0.001, R2 = 0.422). This OLS regression analysis ignores the
fact that individuals were nested within study groups. A regression model that takesthis nested structure into account is a multilevel model known as the random coef-
ficient model. Using multilevel analysis to re-analyse the regression model we found
Table 9
Factor loadings of the collaborative learning variables
Variables Factor
1 2 3
During the course
Monitoring working procedures 0.566 0.676 0.570
Participation 0.864 – 0.413
Monitoring group progress – 0.886 –
Helping each other – – 0.464
Need to be monitored – – 0.754
Team development 0.957 – 0.456
Task strategy 0.871 – –
Intragroup conflict 0.628 – –
After the course
Monitoring working procedures – 0.937 –
Participation 0.921 – 0.467
Monitoring group progress – 0.837 –
Helping each other – – 0.488
Need to be monitored – – 0.412
Team development 0.876 – –
Task strategy 0.804 – 0.682
Intragroup conflict 0.776 – –
508 S. Dewiyanti et al. / Computers in Human Behavior 23 (2007) 496–514
with OLS regression yielded the following equation (with associated standard errors
between brackets): PROCESS = 0.548 (0.146) � 1.248 (0.124) PRODUCT.
This finding suggests that requiring a group product tends to stimulate group
members to regulate their group during collaborative learning processes.
3.5. Aspects of collaborative learning that influence satisfaction
A regression analysis of group cohesion (COHES), group support (SUPPORT)
and group process regulation (PROCESS) on satisfaction with other group mem-
bers (SATOTHER) using the backward elimination method resulted in a regres-
sion model that retained group cohesion and group support as statistically
significant predictors of satisfaction with other group members, F(2,44) = 13.852,
p < 0.001, R2 = 0.386. This OLS regression analysis ignores the fact that individualsubjects were embedded within study groups, yielding dependency among scores.
This problem can be tackled by using multilevel analysis instead of ordinary
regression analysis. Multilevel analysis permits the inclusion in the model of a ran-
dom intercept that is allowed to vary among the study groups in which the indi-
vidual subjects are embedded. Using multilevel analysis to test the model we had
found with OLS regression, we found a result quite similar to that which was ob-
tained with ordinary regression analysis. The random intercept model that was re-
turned by the multilevel analysis was (with SE�s reported between brackets):SATOTHER = 3.63 (0.08) + 0.29 (0.08) COHES + 0.18 (0.09) SUPPORT, showing
both group cohesion and group support to be significant predictors of satisfaction
with others.
Similarly, a regression analysis of group cohesion, group support and group
process regulation on satisfaction with learning in group (SATLEARN) using the
same backward elimination method yielded group cohesion and group support as
statistically significant predictors of satisfaction with learning in group,
F(2,44) = 31.137, p < 0.001, R2 = 0.586. Multilevel analysis returned the followingmodel: SATLEARN = 3.89 (0.08) + 0.39 (0.07) COHES + 0.17 (0.07) SUPPORT,
showing both group cohesion and group support to be significant predictors of sat-
isfaction with learning in group.
A third regression analysis of group cohesion, group support and group process
regulation on satisfaction with working in group (SATGROUP) using backward
elimination resulted in a regression model that retained group cohesion and group
process regulation as statistically significant predictors of satisfaction with working
in group, F(2,44) = 10.134, p < 0.001, R2 = 0.315. Multilevel analysis returned thefollowing model: SATWORK = 3.40 (0.05) + 0.22 (0.05) COHES � 0.13 (0.05)
PROCESS, showing both group cohesion and group process regulation to be signi-
ficant predictors of satisfaction with working in group.
Finally, a regression analysis of group cohesion, group support and group process
regulation on satisfaction with final product (SATPROD) using the same backward
elimination method resulted in a regression model that only retained group cohesion
as statistically significant predictor of satisfaction with final product,
F(1,45) = 15.914, p < 0.001, R2 = 0.261. Multilevel analysis returned the following
S. Dewiyanti et al. / Computers in Human Behavior 23 (2007) 496–514 509
model: SATPROD = 3.96 (0.14) + 0.46(0.10) COHES, showing only group cohesion
to be a significant predictor of satisfaction with final product.
Together, these analyses suggest that group cohesion is an important aspect of
collaborative learning that influences students� satisfaction with collaborative
learning.
3.6. Students’ activities when they collaborated in an asynchronous CSCL environment
Messages from one group from the Law course were analysed to give some insight
into how group members collaborated when they accomplished a task. The content
analysis was divided into two parts: part one contains data gathered from beginning
the course to survey 2 (period 1) and part two contains data collected from survey 2
to the end of the course (period 2).To arrive at a balanced comparison between the number of units occurring in a
category during the first period and the number of times these units were mentioned
during the second period, percentages of units are compared.
When the course ended, students� messages were obtained from the server. The
transcipt corpus consists of 393 messages containing over 1009 units. In average,
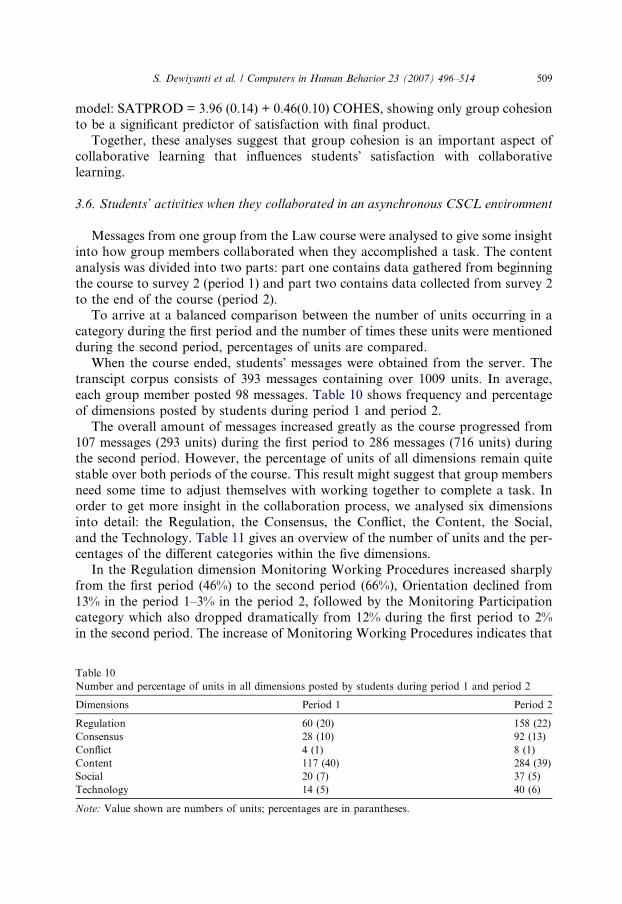
each group member posted 98 messages. Table 10 shows frequency and percentage
of dimensions posted by students during period 1 and period 2.
The overall amount of messages increased greatly as the course progressed from107 messages (293 units) during the first period to 286 messages (716 units) during
the second period. However, the percentage of units of all dimensions remain quite
stable over both periods of the course. This result might suggest that group members
need some time to adjust themselves with working together to complete a task. In
order to get more insight in the collaboration process, we analysed six dimensions
into detail: the Regulation, the Consensus, the Conflict, the Content, the Social,
and the Technology. Table 11 gives an overview of the number of units and the per-
centages of the different categories within the five dimensions.In the Regulation dimension Monitoring Working Procedures increased sharply
from the first period (46%) to the second period (66%), Orientation declined from
13% in the period 1–3% in the period 2, followed by the Monitoring Participation
category which also dropped dramatically from 12% during the first period to 2%
in the second period. The increase of Monitoring Working Procedures indicates that
Table 10
Number and percentage of units in all dimensions posted by students during period 1 and period 2
Dimensions Period 1 Period 2
Regulation 60 (20) 158 (22)
Consensus 28 (10) 92 (13)
Conflict 4 (1) 8 (1)
Content 117 (40) 284 (39)
Social 20 (7) 37 (5)
Technology 14 (5) 40 (6)
Note: Value shown are numbers of units; percentages are in parantheses.
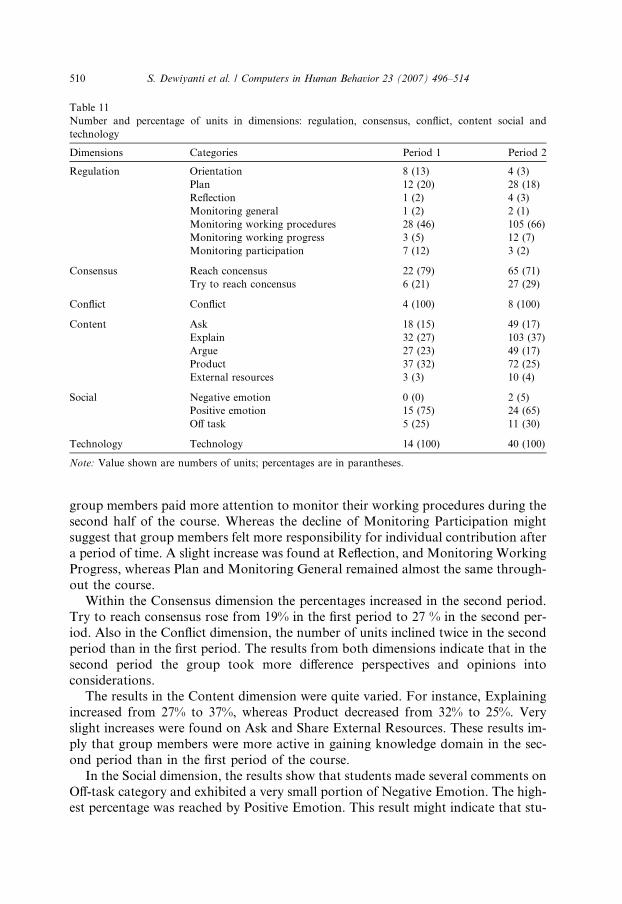
Table 11
Number and percentage of units in dimensions: regulation, consensus, conflict, content social and
technology
Dimensions Categories Period 1 Period 2
Regulation Orientation 8 (13) 4 (3)
Plan 12 (20) 28 (18)
Reflection 1 (2) 4 (3)
Monitoring general 1 (2) 2 (1)
Monitoring working procedures 28 (46) 105 (66)
Monitoring working progress 3 (5) 12 (7)
Monitoring participation 7 (12) 3 (2)
Consensus Reach concensus 22 (79) 65 (71)
Try to reach concensus 6 (21) 27 (29)
Conflict Conflict 4 (100) 8 (100)
Content Ask 18 (15) 49 (17)
Explain 32 (27) 103 (37)
Argue 27 (23) 49 (17)
Product 37 (32) 72 (25)
External resources 3 (3) 10 (4)
Social Negative emotion 0 (0) 2 (5)
Positive emotion 15 (75) 24 (65)
Off task 5 (25) 11 (30)
Technology Technology 14 (100) 40 (100)
Note: Value shown are numbers of units; percentages are in parantheses.
510 S. Dewiyanti et al. / Computers in Human Behavior 23 (2007) 496–514
group members paid more attention to monitor their working procedures during the
second half of the course. Whereas the decline of Monitoring Participation might
suggest that group members felt more responsibility for individual contribution aftera period of time. A slight increase was found at Reflection, and Monitoring Working
Progress, whereas Plan and Monitoring General remained almost the same through-
out the course.
Within the Consensus dimension the percentages increased in the second period.
Try to reach consensus rose from 19% in the first period to 27 % in the second per-
iod. Also in the Conflict dimension, the number of units inclined twice in the second
period than in the first period. The results from both dimensions indicate that in the
second period the group took more difference perspectives and opinions intoconsiderations.
The results in the Content dimension were quite varied. For instance, Explaining
increased from 27% to 37%, whereas Product decreased from 32% to 25%. Very
slight increases were found on Ask and Share External Resources. These results im-
ply that group members were more active in gaining knowledge domain in the sec-
ond period than in the first period of the course.
In the Social dimension, the results show that students made several comments on
Off-task category and exhibited a very small portion of Negative Emotion. The high-est percentage was reached by Positive Emotion. This result might indicate that stu-
S. Dewiyanti et al. / Computers in Human Behavior 23 (2007) 496–514 511
dents showed their positive feelings and encouraged each other during collaborative
learning.
The last dimension is Technology. The percentage of this dimension remained sta-
ble during both periods. This stable percentage reflected the students familiarity with
communication via discussion group.
4. Discussion and conclusion
The aim of this study was to explore students experiences and satisfaction with
collaborative learning in asynchronous CSCL environments. In order to have a good
grip of crucial aspects during collaborative learning, the influence of individual and
course characteristics on aspects of collaboration learning and the influence of theaspects of collaborative learning on satisfaction was determined. Also, students� mes-
sages from one group were analysed to gain more insight in how group members col-
laborate while working on a task.
The first issue examined was students� experiences with collaborative learning as a
result of participating in the courses with a collaborative learning method. In general
students show quite positive experiences with working in a CSCL environment both
during and after the course. Only on the variable Monitoring Working Procedures a
significant difference was found between the first and the second half of the course.In the second half of the course students paid more attention to the procedures they
had to follow to accomplish the task. It might indicate that group members involve-
ment in regulating group processes might take some time to occur and does not hap-
pen at the beginning of the collaboration automatically. Besides, this may be due to
the fact that working procedures must be more efficient in the second half of the
course, because it was not allowed to exceed the deadline for accomplishing the task.
Moreover, the scores on the group process regulation variables, namely Monitoring
Working Procedures and Monitoring Group Progress, were lower than on the othervariables both during and after the course. Students seemed not to pay much atten-
tion to monitor their collaboration process. Hence, it is suggested to scaffold group
members in regulating group process from the beginning of their collaboration.
The second issue investigated was whether students were satisfied with working
and learning in an asynchronous CSCL environment. Consistent with previous stud-
ies (Bures, Abrami, & Amundsen, 2000; Harasim, 2001), our results also indicate
that students are in general satisfied with working and learning in an asynchronous
CSCL environment. On all the satisfaction variables the students mean scores areabove the midpoint of the scale. Distance learning is often promoted to give flexibi-
lity for learners to manage their individual learning, collaborative learning limits the
flexibility of distance learners because it creates interdependence between the group
members. However, despite the fact that distance learners have less freedom in an
asynchronous CSCL environment, the results in this study show that students were
quite pleased with learning this way.
The third issue examined whether individual and course characteristics influenced
collaboration process. It was expected that small-groups as well as a task which
512 S. Dewiyanti et al. / Computers in Human Behavior 23 (2007) 496–514
requires a group product would stimulate student involvement in collaborative
learning. The result of the present study indicates that the type of product influences
students regulation of group process. This finding shows that a group product sti-
mulates students to regulate their group process because it involves all group mem-
bers proceeding the task (Cohen, 1994; Johnson & Johnson, 1994). Thus, requiring agroup product not only enhance students to gain subject knowledge but also stimu-
late students to develop group skills such as orienting, planning and monitoring.
Although, the results of this study do not support the expectation that small group
size stimulate group processes more than large groups, there is an indication that
participants from the course that used large groups (7 group members each group)
scored lower on the experiences with collaborative learning than the participants
from the other courses. So, there is some evidence to conclude that the use of small
groups is recommendable above larger groups. In addition, other studies (Ha-mmond, 2000; Kaye, 1992; Wegerif, 1998) also recommend to use small groups
rather than large groups.
The fourth issues examined aspects of collaborative learning which influence stu-
dents� satisfaction. The results reveal that group cohesion is an important aspect that
influences students� satisfaction. This finding is congruence with the work of Johnson
and Johnson (1994); they also underline the importance of group cohesion during
collaboration to keep the group work together. Another finding is that group process
regulation has a negative influence on satisfaction with working in a group. Thisfinding contradicts with result from other study (Gillies, 2003). In his study he re-
ported that unstructured group process led to students became less positive about
their group experiences. A possible explanation for this finding that we should take
into account that the participants are different. Our participants are distance learners
who are adults and have to manage their time to study as well as to work, so that a
rigid group process regulation during collaborative learning might be difficult for
them. Although our finding shows that group process regulation influences nega-
tively on satisfaction with working in a group, we argue that group process regula-tion is needed during collaborative learning and is considered to be supportive in the
learning process. Lack of group process regulation may cause a group loss of control
in achieving their goal.
The fifth issue examined the collaborative activities within one group. The group
members� discourse while completing a task was analysed. In general, most of the
group communications discussed the learning content. Activities such as asking,
arguing, explaining, and providing extra resources dominated more than regulative
activities such as planning, monitoring and reflecting. These findings are in line withother results of studies on the collaborative learning in asynchronous CSCL environ-
ments (Veerman, 2000; Veldhuis-Diermanse, 2002). The technology and social
dimension had the lowest percentage numbers throughout the course. It implied that
students were quite familiar with communication via the computer and indicated
that group members did not spend much time to comment on unrelated task.
Although, these findings indicated that learning in an asynchronous CSCL environ-
ment focused more at completing the task than other activities (such as talking about
social life). It is important to notice that we analysed only discourse from one group.
S. Dewiyanti et al. / Computers in Human Behavior 23 (2007) 496–514 513
Two limitations of this study need to be acknowledged. One limitation of this
study is the sample size. Not all participants responded to our questionnaires. Num-
ber of participants in the second and the third survey was among other things re-
duced because of leaving the course and of time pressure. Another limitation of
this study was that we focussed only partly on actual students behaviour. Due tothese limitations, the results of this study should be interpreted with caution.
The results of this study have several important implications for practice. First, in
order to maintain group cohesion we might consider to ask students to reflect on
their group process. Hence, all group members should have the opportunity to reflect
on their group activities and on their gained knowledge in order to improve their
group performance. Second, the less experience of group process regulation might
be tackled by providing specific guidelines on how to regulate the group. Besides
reflection on group process can also be used to improve the group process regulation.Third, it is suggested to set tasks requiring high levels of collaboration; for instance
tasks which require a group product. Fourth, the use of small groups instead of large
groups is recommendable. Finally, it is recommended to use asynchronous CSCL
environments as a medium to support collaborative learning form for distance edu-
cation, because collaborative learning is seen as a didactical approach that stimulates
�new learning�.
Acknowledgements
The authors thank Martine Coun, Ine Haaren-Dresens, Wilfried Ivens, Wim Jurg,
Wim de Kruijff, Angelique Lansu, Frand de Langen, Jan Leppink, Hubert de Man,
Peter Mijnheer, Wies Weterman from the Open University of the Netherlands for
their helps.
References
Abrami, P. C., & Bures, E. M. (1996). Computer-supported collaborative learning and distance education.
The American Journal of Distance Education, 10, 37–41.
Bates, A. W. (1995). Technology, open learning and distance education. London: Routledge.
Bruffee, K. A. (1995). Sharing our toys: cooperative learning versus collaborative learning. Change
Magazine, 27, 12–18.
Bures, A. M., Abrami, P. C., & Amundsen, C. (2000). Student motivation to learn via computer
conferencing. Research in Higher Education, 41, 593–621.
Cohen, E. G. (1994). Restructuring the classroom: conditions for productive small groups. Review of
Educational Research, 64, 1–35.
Dillenbourg, P. (1999). Introduction: what do you mean by ‘‘collaborative learning’’?. In P. Dillenbourg
(Ed.), Collaborative learning: Cognitive and computational approaches. Amsterdam: Pergamon Press.
Gillies, R. M. (2003). The behaviors, interactions, and perceptions of junior high school students during
small-group learning. Journal of Education Psychology, 95, 137–147.
Gunawardena, N. C., Nola, A. C., Wilson, P. L., Lopez-Islas, J. R., Ramı́rez-Angel, N., & Megchun-
Alpı́zar, R. M. (2001). A cross-cultural study of group process and development in online conferences.
Distance Education, 22, 85–121.
514 S. Dewiyanti et al. / Computers in Human Behavior 23 (2007) 496–514
Hammond, M. (2000). Communication within on-line forums: the opportunities, the constraints and the
value of a communicative approach. Computer and Education, 35, 251–262.
Harasim, L. (1989). On-line education: a new domain. In R. Mason & A. Kaye (Eds.), Mindweave
communication, computers and distance education. Oxford: Pergamon Press.
Harasim, L. (2001). The virtual university: a state of the art – 2 A powerful new phenomenon: online
collaborative learning in virtual classrooms. Advances in Computers, 55, 6–14.
Henri, F. (1992). Computer conferencing and content analysis. In A. Kaye (Ed.). Collaborative learning
through computer conferencing: The najaden papers. Berlin: Springer.
Hiltz, S. R. (1995). The virtual classroom: Learning without limits via computer networks. Norwood: Ablex.
Johnson, D. W., & Johnson, F. P. (1994). Joining together: Group theory and group skills. Boston: Allyn
and Bacon.
Kagan, S. (1994). Cooperative Learning. Wee co op: Resources for Teacher, Inc.
Kaye, A. (1992). Learning together apart. In A. Kaye (Ed.). Collaborative learning through computer
conferencing: The najaden papers. Berlin: Springer.
Koschman, T. (1996). CSCL: Theory and practice of an emerging paradigm. New Jersey: Lawrence
Erlbaum.
Ross, J. A. (1996). The influence of computer communication skills in a computer conferencing course.
Journal Educational Computing Research, 15, 37–52.
Rowntree, D. (1992). Exploring open and distance learning. London: Kogan Page.
Saavedra, R. P., Early, P. C., & Van Dyne, L. (1993). Complex interdependence in task-performing
groups. Journal of Applied Psychology, 78, 61–72.
Savicki, V., Kelley, M., & Lingenfelter, D. (1996). Gender, group composition, and task type in small task
groups using computer-mediated communication. Computers in Human Behavior, 12, 549–565.
Scardamalia, M., & Bereiter, C. (1994). Computer support for knowledge-building communities. The
Journal of The Learning Sciences, 3, 265–283.
Shaw, M. E. (1981). Group dynamics the psychology of small group behavior. New York: McGraw-Hill.
Van Boxtel, C., van der Linden, J., & Kanselaar, G. (2000). Collaborative learning tasks and the
elaboration of conceptual knowledge. Learning and Instruction, 10, 311–330.
Van Merrienboer, J. J. G., & Paas, F. (2003). Powerful learning and the many faces of instructional design:
towards a framework for the design of powerful learning environments. In E. De Corte, L. Verschaffel,
N. Enstwistle, & J. J. G. Van merrienboer (Eds.), Powerful learning environments: Unravelling basic
components and dimensions. Oxford: Elsevier Science.
Veerman, A. (2000). Computer-supported collaborative learning through argumentation. Enschede: Print
Partners Ipskamp.
Veldhuis-Diermanse, A. E. (2002). CSCLearning? participation, learning activities and knowledge
construction in computer-supported collaborative learning in higher education. Wageningen: Grafisch
Service Centrum Van Gils.
Wegerif, R. (1998). The social dimension of asynchronous learning networks. Journal of Asynchronous
Learning Networks, 2, 34–49.
Zafeiriou, G., Nunes, J. M. P., & Ford, N. (2001). Using students� perceptions of participation in
collaborative learning activities in the design of online learning environments. Education for
Information, 19, 83–106.