student loans repayment and recovery: international - iza
TRANSCRIPT

IZA DP No. 3588
Student Loans Repayment and Recovery:International Comparisons
Hua ShenAdrian Ziderman
DI
SC
US
SI
ON
PA
PE
R S
ER
IE
S
Forschungsinstitutzur Zukunft der ArbeitInstitute for the Studyof Labor
July 2008
Student Loans Repayment and Recovery:
International Comparisons
Hua Shen Peking University
and Hubei University
Adrian Ziderman Bar-Ilan University
and IZA
Discussion Paper No. 3588 July 2008
IZA
P.O. Box 7240 53072 Bonn
Germany
Phone: +49-228-3894-0 Fax: +49-228-3894-180
E-mail: [email protected]
Any opinions expressed here are those of the author(s) and not those of IZA. Research published in this series may include views on policy, but the institute itself takes no institutional policy positions. The Institute for the Study of Labor (IZA) in Bonn is a local and virtual international research center and a place of communication between science, politics and business. IZA is an independent nonprofit organization supported by Deutsche Post World Net. The center is associated with the University of Bonn and offers a stimulating research environment through its international network, workshops and conferences, data service, project support, research visits and doctoral program. IZA engages in (i) original and internationally competitive research in all fields of labor economics, (ii) development of policy concepts, and (iii) dissemination of research results and concepts to the interested public. IZA Discussion Papers often represent preliminary work and are circulated to encourage discussion. Citation of such a paper should account for its provisional character. A revised version may be available directly from the author.

IZA Discussion Paper No. 3588 July 2008
ABSTRACT
Student Loans Repayment and Recovery: International Comparisons
Student loans schemes are in operation in more than seventy countries around the world. Most loans schemes benefit from sizeable built-in government subsidies and, in addition, are subject to repayment default and administrative costs that are not passed on to student borrowers. We probe two issues in this paper, for 44 loans schemes in 39 countries: how much of the original loan is an individual student required to repay (the "repayment ratio") and what percentage of the total costs of loans schemes can the lending body expect to receive back in repayments (the "recovery ratio")? The analysis shows considerable variation in the size of the repayment and recovery ratios across schemes. Moreover, many loans schemes exhibit sizeable built-in subsidies accruing to student borrowers – in over 40 percent of the schemes examined, the repayment ratio is 40 percent or less. Overall loans recovery is considerably lower. Policy implications of these findings are discussed together with a consideration of steps that may be taken to improve the financial outcome of loans schemes. JEL Classification: I22, H52 Keywords: student financial aid, student loans, university subsidies, university funding Corresponding author: Adrian Ziderman Department of Economics Bar-Ilan University 52900 Ramat Gan Israel E-mail: [email protected]

1 Introduction
Government-sponsored student loans schemes are in place in some 70 countries and
regions round the world. Student loans schemes, usually concerned with tertiary
education, are of particular interest to governments because these schemes are able to
contribute to the solution of a range of pressing policy problems that governments face.
Student loans are able to relieve pressures on national budgets by facilitating greater
cost sharing though the raising of tuition and other university fees. They both enable
students to avoid the burden of the up-front payment of increased tuition fees, as well
as enabling them to delay loan repayment until they are in receipt of the higher salaries
that generally accrue to university graduates. Liberated resources can be used in areas
of greater priority for society, both outside and within the education sector and notably
basic education. Greater cost recovery can provide additional funds for the expansion
of the university system, to accommodate increases in the social demand for tertiary
education. Targeted at the disadvantaged, subsidized loans schemes may lead to greater
access to university education for the poor and minority groups, thus contributing to
social equity. And loans offered at favorable conditions for study in particular fields,
can lead to a loosening of skilled manpower bottlenecks that inhibit social, economic
and industrial development.
Considerable differences are evident in loans schemes across countries. Schemes differ
not only in the underlying objectives pursued, but also in such parameters as
organizational structure, sources of initial funding, student coverage, loans allocation
procedures and collection methods. However there is one element that is common to
almost all government-sponsored loans schemes: they are highly subsidized by
governments. This means that, unlike commercial loans, a sizeable proportion of the
total loans outlay by the loans body, be it government department, loans scheme
authority or commercial bank, will not be received back in repayment. This gap
between total loan disbursements and overall loans recovery is accounted for by two
3

elements. First, there are built-in interest rate subsidies, incorporated into the design of
the loans scheme. And, second, there are inefficiencies in running the scheme, in terms
of substantial repayment default and high administration costs.
A sizeable and sustained gap between disbursements and recovery implies continuing
governmental financial support. This is the case also where loans scheme capital is
provided, not by government, but by such non-governmental sources as the banking
system; here there is a need for ongoing government guarantees against default, in
addition to interest rate subsidies.
How large are these gaps across countries, in practice? A central objective of the
present paper is to measure the size, and contributing factors, of this gap in 44 loans
schemes worldwide. Has the gap changed in size over time? Many student loans
schemes have undergone drastic reform in recent years. Some programs have moved
from a traditional mortgage-type repayment model to income-contingency based
repayment; some schemes have adjusted loan repayment conditions, such as interest
rates, grace periods and repayment periods; a few countries have re-vamped or even
completely replaced the loans programs. The results of the present study are compared
with those of an earlier one relating to the early 1990s (Ziderman and Albrecht, 1995)
to see to what extent the level of subsidy and overall efficiency of loans schemes have
changed in the interim.
The paper is structured as follows. The following, definitional section introduces the
key concepts that are measured in this study: the loan repayment ratio, hidden grants
and the loans recovery ratio. Previous measurement studies are discussed briefly in
Section 3, while a brief account of data sources is provided in Section 4. Our main
findings on repayment and recovery ratios are presented in Sections 5 and 6;
conclusions for policy follow in the final section.
4

2 Defining Loan Repayment, Hidden Grants and Loans Recovery
The financial standing of any loans programme depends on the extent to which loans
outlays are recovered in full by the lending body. A number of factors militate against
full recovery of loans: these may be divided into two groups (Table 1).
2.1 Repayment ratio: the individual loan account
First, there are factors that are “built-in” to the scheme, as elements of its design.
Lending conditions in virtually all government-sponsored loans schemes are “softer”
than those on regular commercial loans; this difference represents a subsidy received
by the student, in the sense that the borrower is not required to pay back the full value
of the loan received. As shown in the table, these conditions include below-market
interest rates on the loan, periods in which no interest is levied on outstanding debt
(both during study and in grace periods after study completion) and repayments not
linked to the rate of inflation. The effect of these built-in subsidies is amplified where
amortization periods are long. The larger are these built-in subsidies, the less of the
original loan is the individual borrower required to repay; the difference between
original loan size and actual required repayment represents, effectively, a “hidden
grant’ to the student taking out a loan.
Table 1 Factors leading to less-than-full loans recovery
Built-in design factors • Below-market interest rates • Interest-free study and grace periods • Repayment in nominal terms • Long amortization period
Administrative factors
• Payment temporarily in arrears • Non- repayment (evasion) • Administration costs
5

The loans repayment ratio measures how much of a loan an average borrower is
required to repay: it is defined as the ratio of required repayments to the loan size
received, both measured in terms of present values. The hidden grant ratio (how much
of the loan does not need to be repaid) is equal to 100 percent minus the repayment
ratio.
2.2 Loans recovery: the overall perspective Since the repayment ratio relates to the typical borrower; it fails to show the extent of
recovery to the loans fund, from the overall viewpoint of the scheme as a whole. Even
if student loans were not subsidized, and the individual student was required to repay
in full, not all of the sums loaned would be recouped by the loan authorities. The extent
of such a shortfall would be dependent on the level of administrative efficiency under
which the loans scheme is run. Thus, overall loans recovery depends not only on the
total of all individual cash repayments. It takes account also of administrative costs that
are not passed on to the student borrowers and of the extent of repayment default.
Repayment default is broadly defined to include payment in arrears and repayment
evasion. An efficiently managed loans scheme will both maintain administrative costs
at reasonably low levels and minimize the extent of repayment default.
Loans recovery, then, focuses more widely on the scheme as a whole, rather than on
the individual borrower. It is concerned with the question of how much of the total
outlays of the loans scheme (total loans disbursements plus all other costs including
administration) will be recovered through loans repayment. It takes into account all of
the items listed in Table 1, both the fixed, built-in design factors as well as the effects
of administrative efficiencies in running the scheme. Thus, if some borrowers
defaulted, total repayment receipts would fall, but the individual required repayment
ratio would remain unchanged. The recovery ratio is measured by the ratio of total
(discounted) repayments to total (discounted) outlays. Clearly, the recovery ratio is
always lower than the repayment ratio, because the latter takes no account of the
probability of repayment default and does not include general administration costs.
6

In some schemes, there is an additional, though usually minor, element affecting the
recovery ratio. This is the possibility of canceling individual repayment obligations
("forgiveness") for such reasons as disability, student academic performance and the
encouragement of graduates to enter skills-shortage occupations.
3 Past Studies
A number of studies have examined loans repayment and loans recovery in various
country loans schemes. These studies take two forms: individual country studies and comparative studies. Examples of country level studies are to be found in Wandiga (1997), which examines the Kenyan loans scheme, and in Chung and Hung (2003) which reports on student loans in Hong Kong. But because these individual studies use somewhat different methodologies, it is difficult to draw any comparative conclusions from an examination of the differing results, across countries. A few comparative studies are available, each relating to a number of country loans schemes. Each of the comparative studies employed a common methodology to examine the county loans schemes under scrutiny. The classic study by Johnstone (1986), which introduced the hidden grant concept, measured the size of the hidden grant in loans schemes in the Federal Republic of Germany, the United States and Sweden. Carlson (1992) compared loans schemes within Latin America and the Caribbean, while Ziderman (2004) reported the results from a comparative study of five loans schemes in S.E. Asia. However, all of these comparative studies have a limited coverage: Johnstone's study relates to industrialized countries while the Carlson and Ziderman studies are regional in focus. The comparative study by Ziderman and Albrecht (1995) is more general and far-ranging than the other studies noted above. Computing repayment and recovery ratios for student loans schemes in 19 countries, the study covered a larger number of countries, included both developing and industrialized and was not restricted to a regional coverage. However, the findings relate to loans scheme conditions as they stood fifteen to twenty years ago. The aim of the research reported in the present paper is to revisit this earlier research, to update the findings, and to extend the analysis to a larger sample of some 39 countries. In addition to providing results for more recent
7

years, the present study also makes possible a review of progress over the interim. Can we detect patterns in the level of subsidy across schemes in different countries? Have loans schemes generally become less subsidized over time? Are they run more efficiently? 4 Data Sources and Methods The sample comprised of 44 loans programs for first degree students in 39 countries and regions: twelve loans programs in Europe, two in Australasia, eight in the Americas, fourteen in Asia and eight in Africa. The scope of the loans program differs from scheme to scheme; student loans may be available to cover tuition fees, living expenses or a combination of both. Most loans schemes offer traditional mortgage-type loans. With mortgage loans, repayment is made over a specified period, usually with fixed, monthly or quarterly equal payments; designated interest rates and a maximum repayment horizon define the size of the fixed, periodic payments. The maximum repayment period differs across such schemes, varying from five years in Latvia to forty years in Egypt. In a number of countries, including Australia, England & Wales, Ethiopia, Ghana, New Zealand, Sweden and South Africa, loans are repaid as a proportion of a graduate's income in each year (income contingent repayments).1
Background information on loans programs were collected from a variety of sources, including websites, brochures and annual reports relating to individual programs, journal articles on individual loans schemes and comparative studies and other ad hoc sources. For each program, information was obtained on the length of disbursement, grace periods, repayment horizon (for mortgage type loans), and loan interest rates during disbursement and repayment periods. Data on inflation and real market rates of interest in each country were found in the World Bank publication "World Development Indicators 2004”. Using standard discounting techniques to obtain present values of the loans disbursement and repayment streams, repayment (and hidden grant) ratios were computed for all 44 loans programs. For income contingent repayment schemes, where there is no fixed repayments schedule, the average size of periodic payments and the length of the repayment horizon were predicted by projecting the future earnings
8
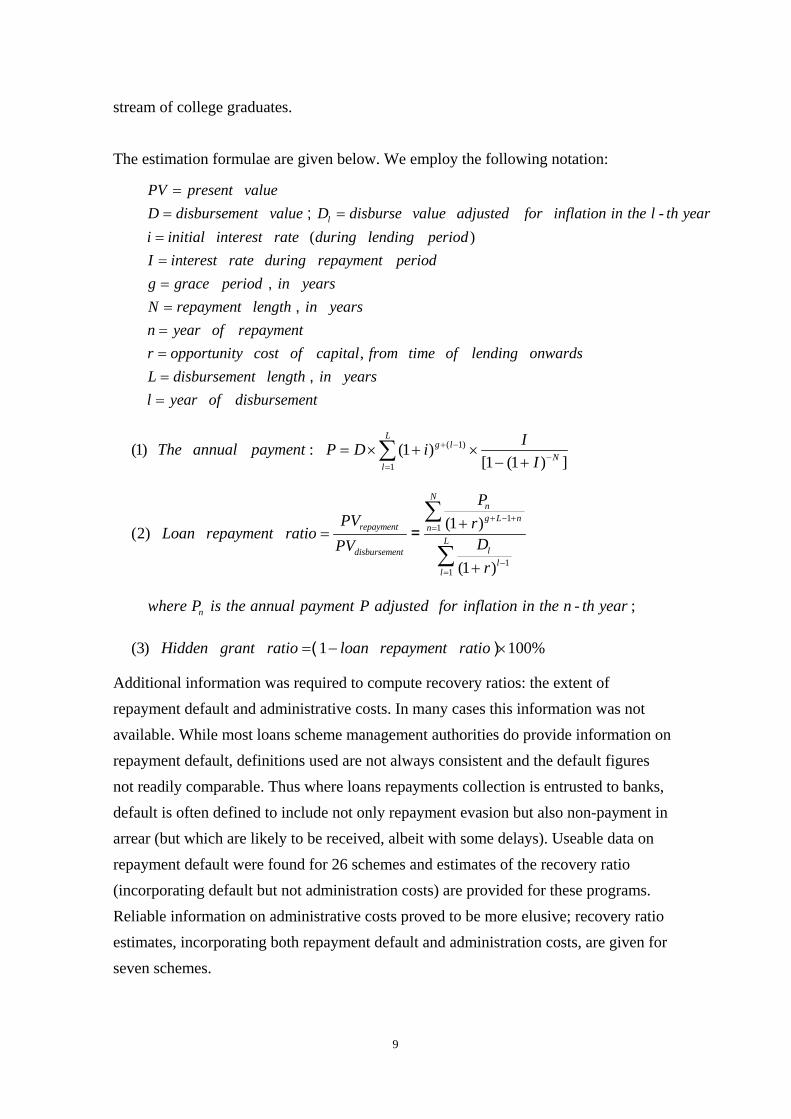
stream of college graduates. The estimation formulae are given below. We employ the following notation:
- ( )
l
PV present valueD disbursement value D disburse value adjusted for inflation in the l th yeari initial interest rate during lending periodI interest rate during repayment periodg grace period in yearsN repayment len
== =====
;
,
,
gth in yearsn year of repaymentr opportunity cost of capital from time of lending onwardsL disbursement length in yearsl year of disbursement
====
,
,
( 1)
1
(1) : (1 )[1 (1 ) ]
Lg l
Nl
IThe annual payment P D iI
+ −−
=
= × + ×− +∑
11
11
(1 )(2)
(1 )
Nng L n
repayment nL
ldisbursementl
l
PPV rLoan repayment ratio
DPVr
+ − +=
−=
+=
+
∑
∑=
- nwhere P is the annual payment P adjusted for inflation in the n th year ;
(3) 1 100%Hidden grant ratio loan repayment ratio= − ×( )
Additional information was required to compute recovery ratios: the extent of repayment default and administrative costs. In many cases this information was not available. While most loans scheme management authorities do provide information on repayment default, definitions used are not always consistent and the default figures not readily comparable. Thus where loans repayments collection is entrusted to banks, default is often defined to include not only repayment evasion but also non-payment in arrear (but which are likely to be received, albeit with some delays). Useable data on repayment default were found for 26 schemes and estimates of the recovery ratio (incorporating default but not administration costs) are provided for these programs. Reliable information on administrative costs proved to be more elusive; recovery ratio estimates, incorporating both repayment default and administration costs, are given for seven schemes.
9
1 11 1
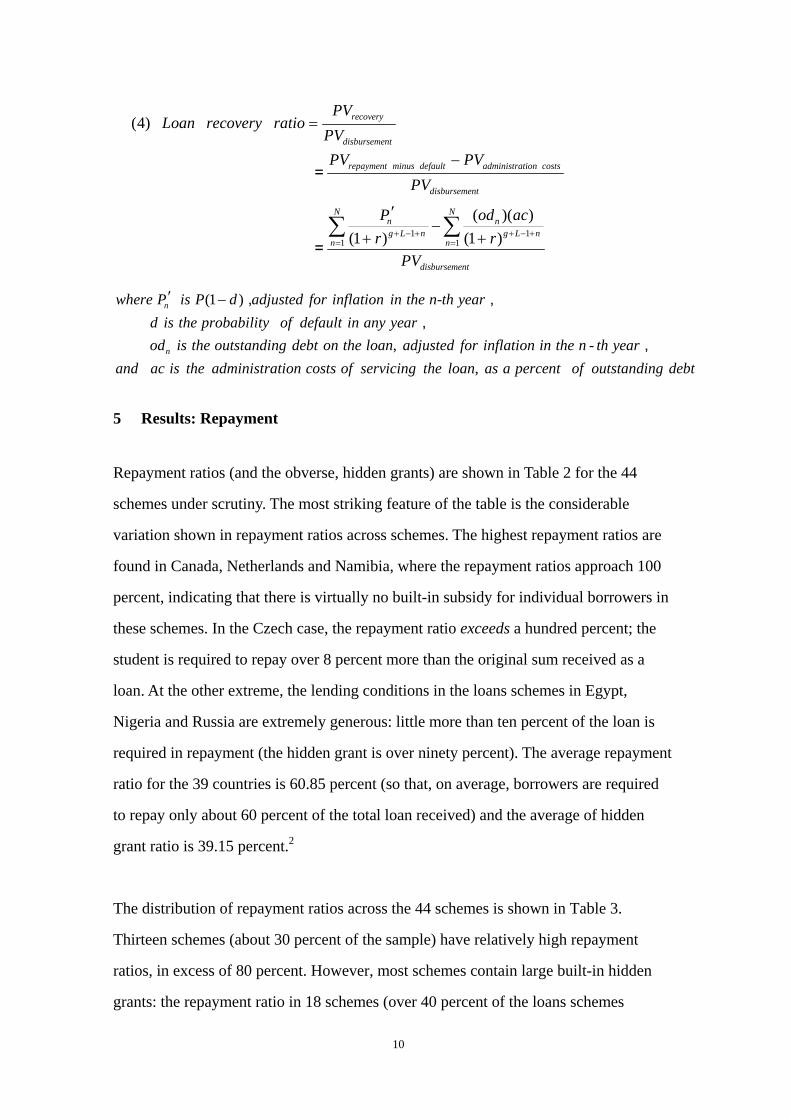
(4)
( )( )(1 ) (1 )
recovery
disbursement
repayment minus default administration costs
disbursement
N Nn ng L n g L n
n n
disbursement
PVLoan recovery ratio
PVPV PV
PV
P od acr r
PV
+ − + + − += =
=
−
′−
+ +∑ ∑
=
=
(1 ) -
, -
n
n
where P is P d adjusted for inflation in the n th yeard is the probability of default in any yearod is the outstanding debt on the loan adjusted for inflation in the n th year
and ac is the ad
′ − , ,,
, , ministration costs of servicing the loan as a percent of outstanding debt
5 Results: Repayment
Repayment ratios (and the obverse, hidden grants) are shown in Table 2 for the 44
schemes under scrutiny. The most striking feature of the table is the considerable
variation shown in repayment ratios across schemes. The highest repayment ratios are
found in Canada, Netherlands and Namibia, where the repayment ratios approach 100
percent, indicating that there is virtually no built-in subsidy for individual borrowers in
these schemes. In the Czech case, the repayment ratio exceeds a hundred percent; the
student is required to repay over 8 percent more than the original sum received as a
loan. At the other extreme, the lending conditions in the loans schemes in Egypt,
Nigeria and Russia are extremely generous: little more than ten percent of the loan is
required in repayment (the hidden grant is over ninety percent). The average repayment
ratio for the 39 countries is 60.85 percent (so that, on average, borrowers are required
to repay only about 60 percent of the total loan received) and the average of hidden
grant ratio is 39.15 percent.2
The distribution of repayment ratios across the 44 schemes is shown in Table 3.
Thirteen schemes (about 30 percent of the sample) have relatively high repayment
ratios, in excess of 80 percent. However, most schemes contain large built-in hidden
grants: the repayment ratio in 18 schemes (over 40 percent of the loans schemes
10

examined) is less than 60 percent. The reasons for such high levels of subsidy in
student loans schemes will be discussed in Section 7
Table 2 Hidden grant and repayment ratios, selected countries
Loans program Hidden
grant Repayment
ratio Loans program Hidden
grant Repayment
ratio Europe Asia Belgium –French speaking 30.25 69.75 China 35.37 64.63 Czech Republic -8.37 108.37 Hong Kong - LSFS 30.80 69.20 Denmark 35.24 64.76 Hong Kong - NLS 35.23 64.77 England & Wales 12.19 87.81 Taiwan, China 13.40 86.60 Estonia 52.27 47.73 India –SBI 19.77 80.23 Finland 9.67 90.33 Indonesia 72.44 27.56 Germany 61.77 38.23 Japan - category 1 35.45 64.55 Latvia – Study loan 75.37 24.63 Japan - category 2 15.00 85.0 Netherlands 1.55 98.45 Malaysia 43.33 56.67 Norway 43.39 56.61 Philippines 33.99 66.01 Russia –Sberbank 88.27 11.73 Singapore -NUS 22.83 77.17 Sweden 35.37 64.63 South Korea -MOE 27.52 72.48
Thailand 69.92 30.08 Australasia Vietnam 19.89 80.11 Australia 25.70 74.30 New Zealand 41.12 58.88 Africa Egypt 88.05 11.95 Americas Ethiopia 64.76 35.24 Canada 0.96 99.04 Ghana 60.87 39.13 USA – SDSL 20.31 79.69 Kenya 72.07 27.93 USA –UDSL 17.12 82.88 Mauritius -EWF 40.64 59.36 USA - Perkings loan 18.51 81.49 Namibia 0.21 99.79 USA – DL ICL 26.52 73.48 Nigeria 89.12 10.88 Colombia – ICETEX 16.83 83.17 South Africa 49.53 50.47 Jamaica 52.45 47.55 Mexico – SOFES 50.39 49.01
11

Table 3 Repayment ratios across schemes
Repayment ratio Number of loans schemes
Above 80 percent 13 61 - 80 percent 13 41 – 60 percent 8 21 – 40 percent 7 20 percent or less 3 Total 44
5.1 Built-in subsidy elements A number of built-in elements accounting for less-than-complete repayment were listed above. Here they are discussed in more detail.
The Interest Rate:
The interest rate subsidy on loans is, usually, the most important factor accounting for
higher hidden grant ratios (low repayment). The level and form of the interest rate
subsidy differs markedly across schemes. The main forms of interest subsidy are: zero
interest payment during periods of study, grace periods; interest rates equal to (and
rising with) the inflation rate, making the real interest rate zero; and, most usually,
below-market rates of interest for the duration of the repayment period.
In the 44 loans schemes examined, no interest is levied for in-school periods in 20
schemes and loans are completely interest-free in six schemes - Egypt, Ethiopia,
Germany, Japan (the first category loan), Malaysia and New Zealand (from April
2007).
12

While many schemes provide considerable interest subsidies during the schooling
period, in-school borrowers may have to meet relatively high interest rates after
graduation. While the Canada Student Loan Program (CSLP) charges a zero nominal
interest rate, subsidized by government, during the period of study, the post-study
repayment rate of interest is high (prime plus 2.5 percent), resulting in a loan
repayment ratio that nears 100 percent. In the Czech Republic loans scheme, the
interest rate charged throughout the period of the loan is relatively high (above 12
percent). The present value of the total of principal plus interest repaid by the borrower,
exceeds the present value of the original loan disbursement, resulting in a repayment
ratio of over 108 percent. Student loans in the Czech Republic are not seen as very
attractive because of the relatively high rate of interest (Vossensteyn, 2004).
The effect of interest rate subsidies on the hidden grant and repayment ratios can be
seen more clearly by comparing loan scheme programs, within the same country, that
have different levels of interest subsidy. We may compare programs with lower
interest subsidies ("non-subsidized”) with those that enjoy greater interest subsidies
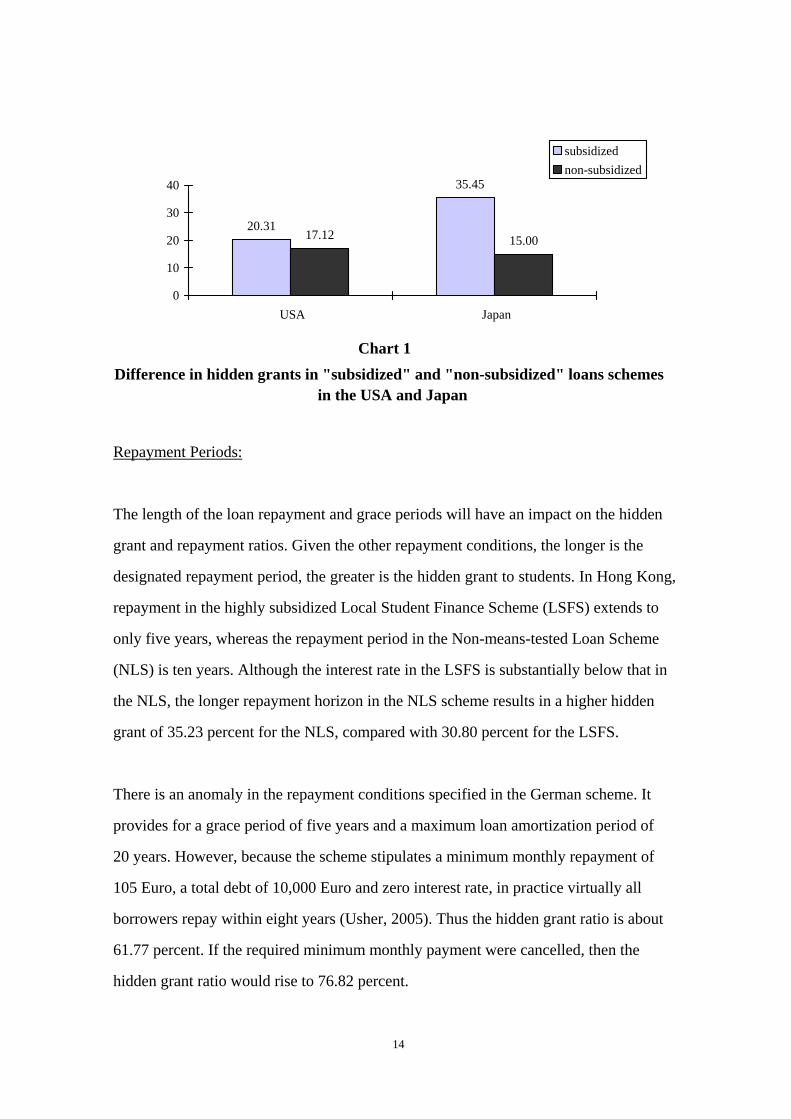
("subsidized”). Results for the USA and for Japan are shown in Chart 1.
The Federal Direct Loan Program in the USA includes the Subsidized Direct Stafford
Loan (SDSL), which is interest-free during study, and the Unsubsidized Direct
Stafford Loan (UDSL) an interest rate of 3.37 percent is charged during the full course
of the loan. The hidden grant ratio for a SDSL is 20.31 percent, compared to 17.12
percent for the UDSL program, a fall of nearly 16 percent (a difference of 3.19
percentage points). The result is more striking for the two categories of student loans
provided by the Japan Student Services Organization. The first student loan category is
interest-free throughout the life of the loan whereas on the second category of loan a
low-interest rate of three percent is charged. The hidden grant ratios are, respectively
35.45 percent and 15.00 percent, representing a gap of 20.45 percentage points
between the two kinds of student loans.
13
20.3117.12
35.45
15.00
0
10
20
30
40
USA Japan
subsidizednon-subsidized
Chart 1 Difference in hidden grants in "subsidized" and "non-subsidized" loans schemes
in the USA and Japan
Repayment Periods:
The length of the loan repayment and grace periods will have an impact on the hidden
grant and repayment ratios. Given the other repayment conditions, the longer is the
designated repayment period, the greater is the hidden grant to students. In Hong Kong,
repayment in the highly subsidized Local Student Finance Scheme (LSFS) extends to
only five years, whereas the repayment period in the Non-means-tested Loan Scheme
(NLS) is ten years. Although the interest rate in the LSFS is substantially below that in
the NLS, the longer repayment horizon in the NLS scheme results in a higher hidden
grant of 35.23 percent for the NLS, compared with 30.80 percent for the LSFS.
There is an anomaly in the repayment conditions specified in the German scheme. It
provides for a grace period of five years and a maximum loan amortization period of
20 years. However, because the scheme stipulates a minimum monthly repayment of
105 Euro, a total debt of 10,000 Euro and zero interest rate, in practice virtually all
borrowers repay within eight years (Usher, 2005). Thus the hidden grant ratio is about
61.77 percent. If the required minimum monthly payment were cancelled, then the
hidden grant ratio would rise to 76.82 percent.
14
The effect of a short repayment horizon in Namibia is to produce a very high
repayment ratio of 99.79 percent. The length of the repayment period is designated as
the number of years that the student was in receipt of a loan during study. Since the
student typically studies for three years at university, the repayment horizon, too,
extends for only three years.
Rate of Inflation
The ongoing rate of inflation rate may be an important factor in affecting the size of
the repayment ratio. In countries where the rate of inflation is high, rates of interest on
student loans that do not reflect real rates of interest or repayment schedules that do not
rise in line with the inflation rate, will exert a strong downward effect on repayment
ratios. In the Russian scheme, a 22 percent rate of interest rate of interest is charged on
student loans program - Sberbanks (Anashvili, 2006), but the inflation rate is far in
excess of this, resulting in a loan repayment ratio of only 11.73 percent.
Changes in the ongoing rate of inflation may have a strong effect on repayment ratios:
a case in point is the outgoing student loans scheme in Thailand, where mortgage-type
repayments are not linked to inflation. In an earlier evaluation, where the going and
expected average inflation rate was some 6.5 percent, Ziderman (2003) estimated a
loans repayment ratio of 21 percent; in the present study revised expectation about
inflation (4.3 percent) results in a higher repayment ratio of 30 percent.
5.2 Repayment ratio by country income level grouping and by continent
Do any general patterns emerge from the results presented in Table 2? Table 4 presents repayment ratio group averages, by country income level and by continent. The median values are also provided.
15
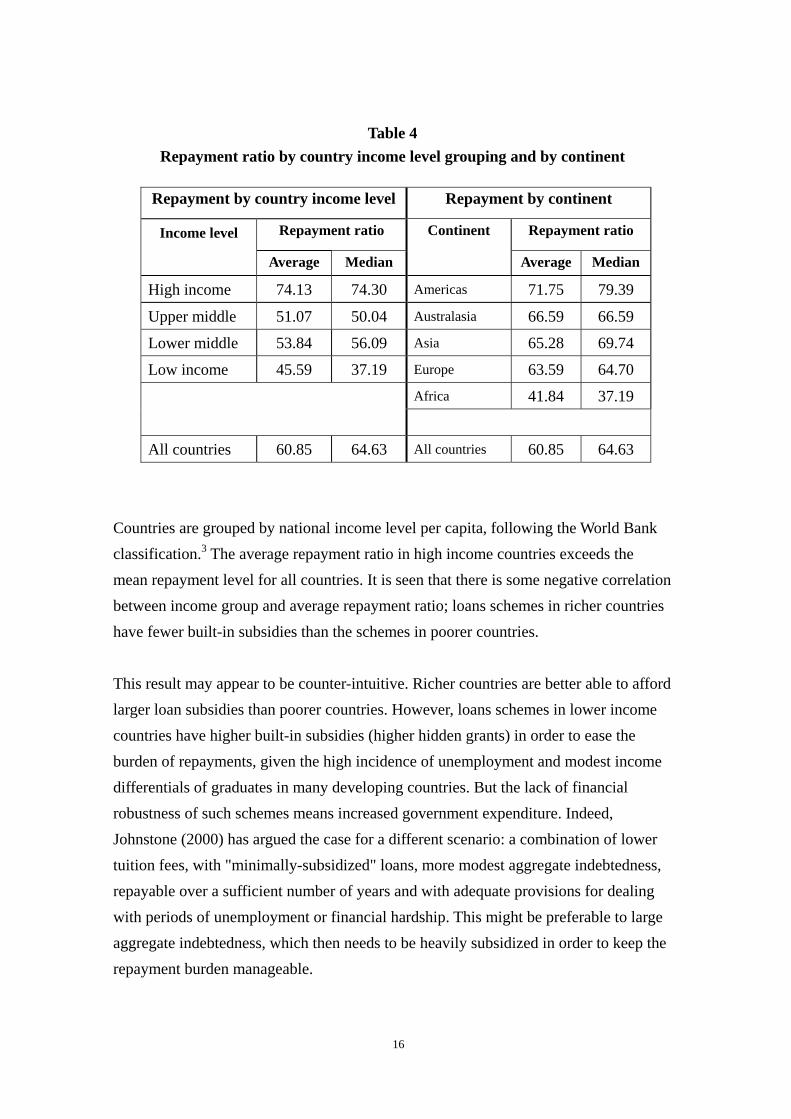
Table 4
Repayment ratio by country income level grouping and by continent
Repayment by country income level Repayment by continent
Repayment ratio Repayment ratio Income level
Average Median
Continent
Average Median
High income 74.13 74.30 Americas 71.75 79.39
Upper middle 51.07 50.04 Australasia 66.59 66.59
Lower middle 53.84 56.09 Asia 65.28 69.74
Low income 45.59 37.19 Europe 63.59 64.70 Africa 41.84 37.19
All countries 60.85 64.63 All countries 60.85 64.63
Countries are grouped by national income level per capita, following the World Bank classification.3 The average repayment ratio in high income countries exceeds the mean repayment level for all countries. It is seen that there is some negative correlation between income group and average repayment ratio; loans schemes in richer countries have fewer built-in subsidies than the schemes in poorer countries. This result may appear to be counter-intuitive. Richer countries are better able to afford larger loan subsidies than poorer countries. However, loans schemes in lower income countries have higher built-in subsidies (higher hidden grants) in order to ease the burden of repayments, given the high incidence of unemployment and modest income differentials of graduates in many developing countries. But the lack of financial robustness of such schemes means increased government expenditure. Indeed, Johnstone (2000) has argued the case for a different scenario: a combination of lower tuition fees, with "minimally-subsidized" loans, more modest aggregate indebtedness, repayable over a sufficient number of years and with adequate provisions for dealing with periods of unemployment or financial hardship. This might be preferable to large aggregate indebtedness, which then needs to be heavily subsidized in order to keep the repayment burden manageable.
16
The results by continent indicate that the highest average levels of repayment are to be found in the Americas, Australasia and Asia. The table shows clearly the relatively high level of built-in subsidies in African loans schemes. Apart from Mauritius and South Africa (upper income countries), the other belong to either lower middle income or low income categories. Yet these counties are the least able to afford over-generous subsidies (hidden grants).
5.3 Comparison of earlier and present research
Table 5 compares current results with those from earlier research conducted by one of
the authors, relating to the early 1990s (Ziderman and Albrecht, 1995). Of the thirteen
country loans schemes that are common to the two studies, only three show lower
repayment ratios today, compared with the earlier research; in all the other ten
countries repayment ratios have either remained stable or increased. While these 13
schemes are not necessarily representative of loans schemes generally, the results do
suggest that we may detect an underlying tendency of governments to reduce built-in
loan scheme subsidies.
In Kenya and Jamaica, loans schemes exhibit broadly similar repayment ratios in the
two periods; loan repayment conditions did not change. Repayment ratios have
increased in eight schemes: Australia, Colombia, Denmark, England & Wales, Finland,
Hong Kong, Japan, and the USA. An important factor accounting for this improvement,
for example in Denmark, Finland, and the USA, is the current, lower level of nominal
interest rates compared with the earlier period, resulting in a smaller gap between
nominal and real interest rates. Changing length of the repayment horizon has also lead
to an improved repayment ratio in some cases. For example, the repayment period
decreased from 17 years to 8 years in the Australian scheme (Chapman & Ryan, 2002;
Chapman, 2005). England and Wales moved from a mortgage-type repayment model
to income contingent repayments for loans for living expences in1998; however, the
improvement in the repayment ratio is due to a decrease in the level of built-in subsidy
and not to the nature of the repayment regime.
17

In three programs, repayment ratios are lower than in the past: Indonesia, Norway and
Sweden. The lower repayment ratio in Sweden is a result of the lengthening of the
repayment period, from 10 to 25 years, as well as higher government interest rate
subsidies. In the Indonesian case, the appropriate discount rate was higher for the
period of the present study.
Table 5 Selected repayment ratios: Comparison of earlier and current research
Repayment ratio
Country Earlier research* Current
research Similar repayment ratio Kenya 30 27.93 Jamaica 44 47.55
Increased repayment ratio Australia 52 74.30 Colombia 71 83.17 Denmark 48 64.76 England & Wales 74 87.81 Finland 55 90.33 Hong Kong 57 69.20 Japan 50 64.55 USA 71 82.88
Decreased repayment ratio Indonesia 43 27.56 Norway 67 56.61 Sweden 72 64.63
* Ziderman and Albrecht (1995) 6 Results: Efficiency of Loans Schemes We have noted considerable variation in repayment ratios across programs (reflecting the "built-in" subsidy); apart from the exceptional Czech case, these range from over 99 percent in Canada to below eleven percent in Nigeria. Yet, the size of the repayment
18

ratio in any loans scheme is (knowingly or unknowingly) determined ex ante by government policy relating to the particular loans repayment conditions that borrowers must face. Thus a low repayment ratio displayed by a given scheme was fixed by government decision and does not reflect the efficiency with which a loans scheme is being managed. The recovery ratio, however, which incorporates both repayment default and administration costs, can be seen as partially determined by the level of efficiency under which a scheme is managed. In efficiently run schemes, with minimal repayment default and low administration costs, the gap between the repayment ratio and the recovery ratio will remain small. Since data on administration costs were forthcoming for only seven programs, we first provide estimates of recovery ratios, taking account only of repayment default. Appropriate default information was available for 26 schemes. Subsequently, recovery ratios (incorporating information on default and administration costs) are presented.
6.1 Loan Default
Table 6, Column 2, provides estimates of the recovery ratio (incorporating default) in
26 programs, together with corresponding repayment ratios (in Column 1) for easy
reference. The average recovery ratio (incorporating default) is 49.15 percent for the
group, compared with an average repayment ratio of 59.89 percent for these 26
schemes – a drop of more than ten percentage points.
While in every case the recovery ratio, by definition, falls short of the repayment ratio,
this gap is far greater in some cases (reflecting sizeable default) than in others. Thus,
again referring to Column 2, the very small difference between repayment and
recovery ratios in the Hong Kong schemes and in Norway indicates relatively minor
repayment default. In other schemes, as in Canada and India, where repayment ratios
are high, the effect of sizeable default is to reduce the recovery ratio far below the
repayment ratio. In Canada, the repayment ratio is over 99 percent but the recovery
ratio falls to 73.78 percent. In the highly subsidized schemes in Kenya and Ghana
(repayment ratios of 27.93 and 39.13 percent, respectively) considerable repayment
19
default reduces the recovery ratios to only 5.59 and 10.96 percent, respectively. The
loans scheme in the Philippines exhibits the largest difference between repayment and
recovery ratios: 66.01 percent compared with only 1.32 percent, indicating that
virtually nothing is collected in repayment.
Repayment default is often regarded as the major factor for low loans recovery. The
results presented in Table 6 show that this is not the case. Built-in (mainly interest)
subsidies are considerably more important than repayment default. Policy implications
of this finding are discussed in Section 7.
Finally, we compare the results for recovery ratios given in Table 6, Column 2 with
those from the previous research reported in Ziderman and Albrecht. Comparable data
on repayment default were available for only eight of the thirteen comparison loans
schemes presented in Table 5. Comparative findings are given in Table 7.
All of the schemes remain in the same improvement categories as shown in Table 5, comparing repayment ratios. Of the eight schemes compared, six either displayed a similar or improved (higher) recovery ratio. In Kenya and Jamaica, not only did the size of built-in subsidies remain the same but also default remained at the same, high level. For example, in 2000-01 the loan default remained as high as 80 percent in Kenya, with a government loss rate with default of 94.41 percent (recovery ratio of 5.59 percent) – virtually the same as a decade ago.
20
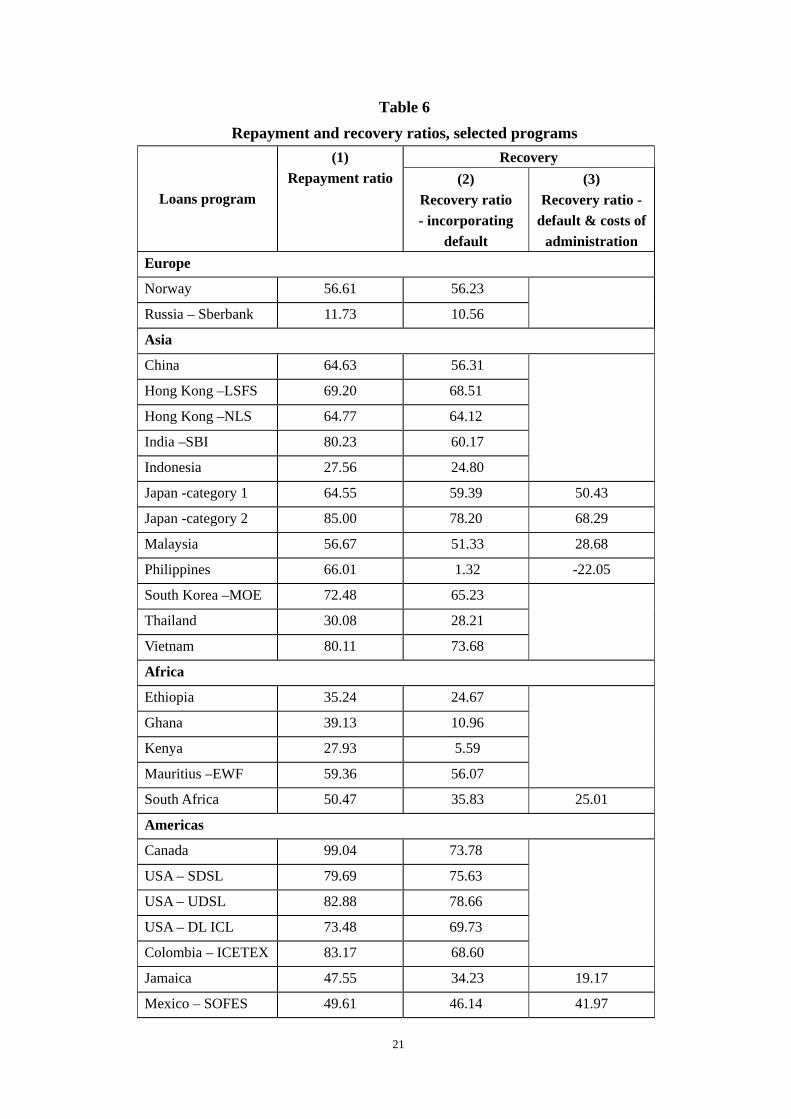
Table 6 Repayment and recovery ratios, selected programs
Recovery
Loans program
(1) Repayment ratio (2)
Recovery ratio - incorporating
default
(3) Recovery ratio -
default & costs of administration
Europe
Norway 56.61 56.23
Russia – Sberbank 11.73 10.56
Asia
China 64.63 56.31
Hong Kong –LSFS 69.20 68.51
Hong Kong –NLS 64.77 64.12
India –SBI 80.23 60.17
Indonesia 27.56 24.80
Japan -category 1 64.55 59.39 50.43
Japan -category 2 85.00 78.20 68.29
Malaysia 56.67 51.33 28.68
Philippines 66.01 1.32 -22.05
South Korea –MOE 72.48 65.23
Thailand 30.08 28.21
Vietnam 80.11 73.68
Africa
Ethiopia 35.24 24.67
Ghana 39.13 10.96
Kenya 27.93 5.59
Mauritius –EWF 59.36 56.07
South Africa 50.47 35.83 25.01
Americas
Canada 99.04 73.78
USA – SDSL 79.69 75.63
USA – UDSL 82.88 78.66
USA – DL ICL 73.48 69.73
Colombia – ICETEX 83.17 68.60
Jamaica 47.55 34.23 19.17
Mexico – SOFES 49.61 46.14 41.97
21

Table 7
Selected recovery ratios (with default only): Comparison of earlier and current research
Recovery ratio, incorporating default
Country Earlier research* Current research
Similar recovery ratio Kenya 6 5.59 Jamaica 38 34.23
Increased recovery ratio Colombia 62 68.60 Hong Kong 57 68.51 Japan – category 1 49 59.39 USA 59 78.66
Decreased recovery ratio Indonesia 39 24.80 Norway 67 56.23
* Ziderman and Albrecht (1995) 6.2 Administration costs
Finally, we incorporate administrative costs into the recovery ratio estimates.
Administrative costs include initial loans processing costs, overall maintenance costs
and collection costs. In developing countries, tracking mobile students can be
extremely difficult, augmenting administration costs further. Where loans schemes
cover relatively few students and where the average loan size is small, administration
costs per loan are proportionally higher.
Overall recovery ratios for seven loans programs, taking account of administration
costs in addition to interest subsidies and non-repayment, are given in Table 6, Column
3. The best performing scheme is the Japan (category 2) loans program with an overall
recovery ratio of 68.29 percent – an overall subsidy of over thirty percent. All the other
loans schemes registered recovery ratios of 50 percent or less, implying considerable
22
losses to the government through loans scheme subsidies. In the cases of Jamaica,
South Africa and Malaysia, recovery ratios are as low as 19, 25 and 29 percent,
respectively.
A comparison of the results in Columns 2 and 3 provides an indication of the relative
importance of administrative cost in lowering recovery. It is instructive to compare the
Mexican and Malaysian schemes. The effect of incorporating administration costs is
relatively small for Mexico (reduction of 46 to 42 percent) while in the Malaysian
scheme heavy administration costs drastically reduce the recovery ratio from 51 to 29
percent. In the national Philippines loans program - somewhat inappropriately named
the "Study Now Pay Later" scheme – where actual repayment is virtually zero, the
addition of administration costs results in an overall negative recovery ratio of minus
22 percent. In this case it probably would be cheaper to give straight grants to students,
instead of loans.
6.3 Relative efficiency index
It should be emphasized that a low recovery loans scheme is not necessarily indicative
of inefficiency. The major element of the recovery ratio (required loan repayments) is
fixed by government policy. Given the repayment ratio, inefficiency arises from
sizeable default and high administrative costs (the other elements of the recovery ratio).
Loan scheme inefficiency may be measured in terms of the relative difference between
the repayment and recovery ratios. Hence, we may compute a Relative Efficiency
Index (REI), as follows:
Recovery Ratio Relative Efficiency Index
Repayment Ratio=
Thus, the higher is the Relative Efficiency Index, the more efficient is the loans program. If default was minimal and administrative costs restrained, then the difference between the Repayment Ratio and the Recovery Ratio would be small,
23
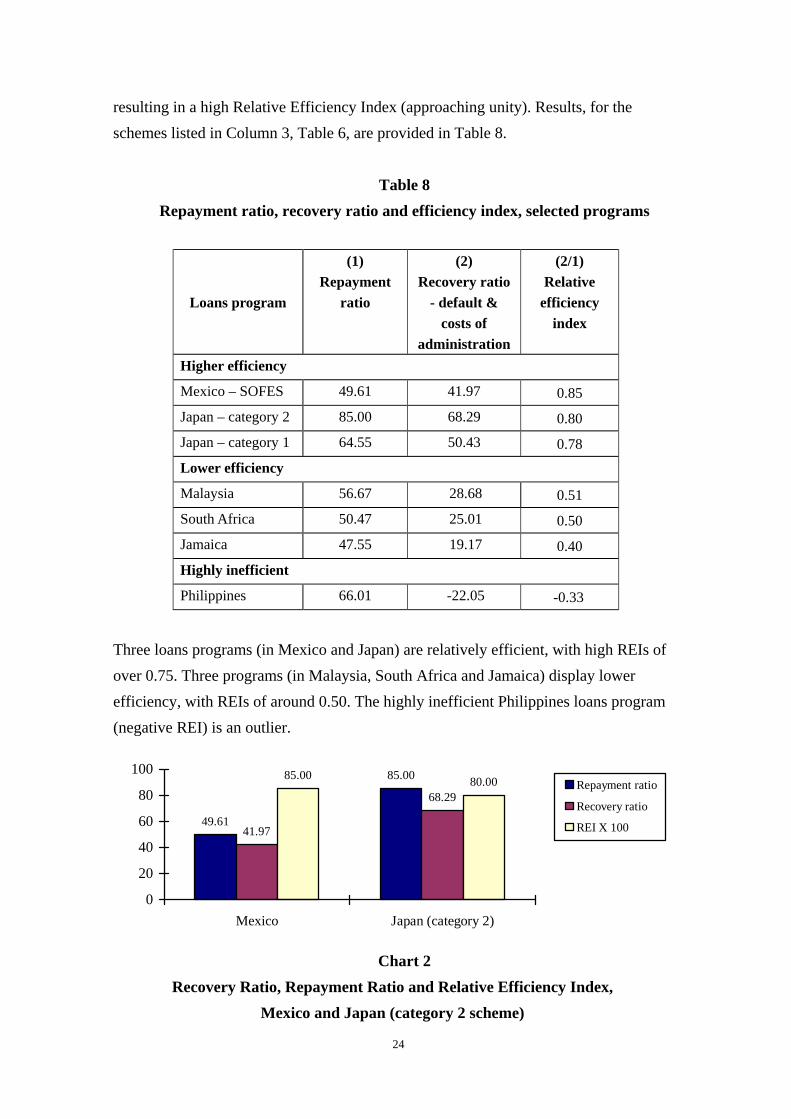
resulting in a high Relative Efficiency Index (approaching unity). Results, for the schemes listed in Column 3, Table 6, are provided in Table 8.
Table 8
Repayment ratio, recovery ratio and efficiency index, selected programs
Loans program
(1) Repayment
ratio
(2) Recovery ratio
- default & costs of
administration
(2/1) Relative
efficiency index
Higher efficiency
Mexico – SOFES 49.61 41.97 0.85 Japan – category 2 85.00 68.29 0.80 Japan – category 1 64.55 50.43 0.78 Lower efficiency
Malaysia 56.67 28.68 0.51 South Africa 50.47 25.01 0.50 Jamaica 47.55 19.17 0.40 Highly inefficient
Philippines 66.01 -22.05 -0.33
Three loans programs (in Mexico and Japan) are relatively efficient, with high REIs of over 0.75. Three programs (in Malaysia, South Africa and Jamaica) display lower efficiency, with REIs of around 0.50. The highly inefficient Philippines loans program (negative REI) is an outlier.
49.61
85.00
41.97
68.29
85.00 80.00
0
20
40
60
80
100
Mexico Japan (category 2)
Repayment ratio
Recovery ratio
REI X 100
Chart 2 Recovery Ratio, Repayment Ratio and Relative Efficiency Index,
Mexico and Japan (category 2 scheme)
24
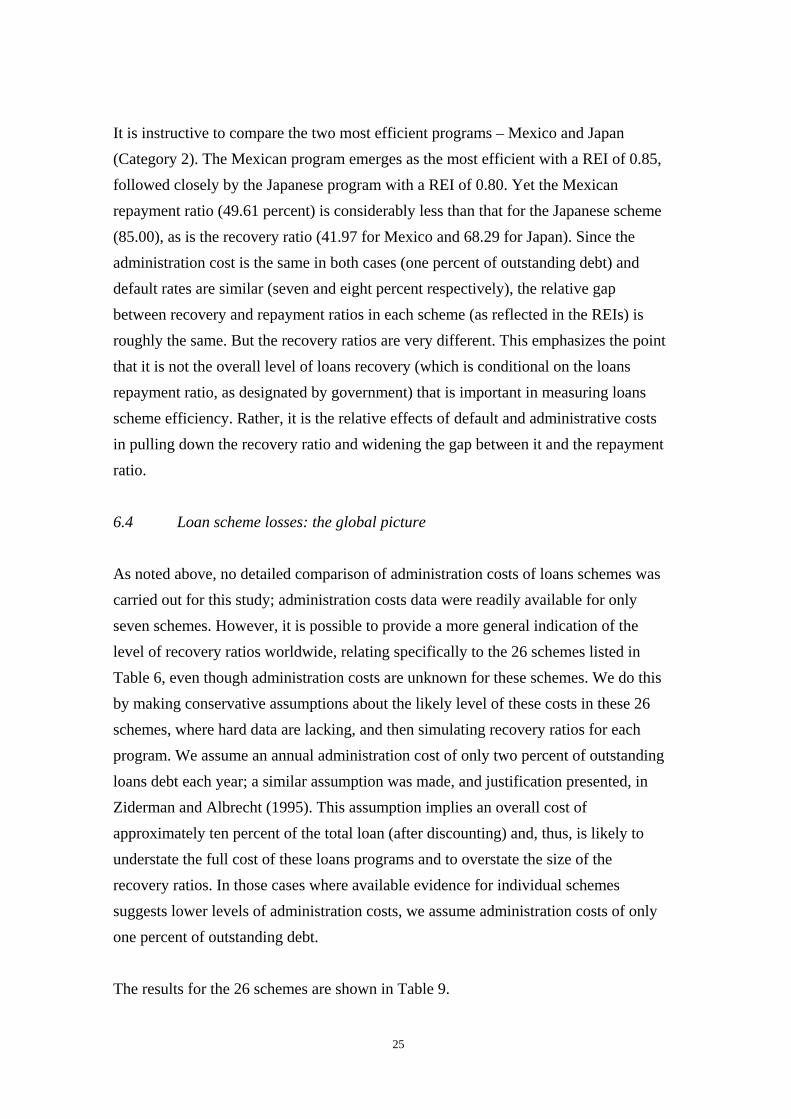
It is instructive to compare the two most efficient programs – Mexico and Japan (Category 2). The Mexican program emerges as the most efficient with a REI of 0.85, followed closely by the Japanese program with a REI of 0.80. Yet the Mexican repayment ratio (49.61 percent) is considerably less than that for the Japanese scheme (85.00), as is the recovery ratio (41.97 for Mexico and 68.29 for Japan). Since the administration cost is the same in both cases (one percent of outstanding debt) and default rates are similar (seven and eight percent respectively), the relative gap between recovery and repayment ratios in each scheme (as reflected in the REIs) is roughly the same. But the recovery ratios are very different. This emphasizes the point that it is not the overall level of loans recovery (which is conditional on the loans repayment ratio, as designated by government) that is important in measuring loans scheme efficiency. Rather, it is the relative effects of default and administrative costs in pulling down the recovery ratio and widening the gap between it and the repayment ratio.
6.4 Loan scheme losses: the global picture As noted above, no detailed comparison of administration costs of loans schemes was carried out for this study; administration costs data were readily available for only seven schemes. However, it is possible to provide a more general indication of the level of recovery ratios worldwide, relating specifically to the 26 schemes listed in Table 6, even though administration costs are unknown for these schemes. We do this by making conservative assumptions about the likely level of these costs in these 26 schemes, where hard data are lacking, and then simulating recovery ratios for each program. We assume an annual administration cost of only two percent of outstanding loans debt each year; a similar assumption was made, and justification presented, in Ziderman and Albrecht (1995). This assumption implies an overall cost of approximately ten percent of the total loan (after discounting) and, thus, is likely to understate the full cost of these loans programs and to overstate the size of the recovery ratios. In those cases where available evidence for individual schemes suggests lower levels of administration costs, we assume administration costs of only one percent of outstanding debt. The results for the 26 schemes are shown in Table 9.
25

Table 9 Simulated (maximal) recovery ratios with assumed administration costs
Simulated recovery ratio
Number of loans schemes
Above 80 percent 0
61 - 80 percent 5
41 – 60 percent 11
21 – 40 percent 2
20 percent or less 8
Total number of schemes 26
The table displays considerable variation in the level of loans recovery across schemes.
While no scheme has a loans recovery ratio exceeding 80 percent and five programs
(above 20 percent of the sample) display recovery ratios higher than 60 percent, for the
most part loans recovery is not high. Eighty percent of the schemes display recovery
ratios of 60 percent or less. For eleven schemes, the recovery ratio lies in the 41 - 60
percent range, ten schemes (about 40 percent of the sample) have very low recovery
ratios of below 40 percent and in a third of the cases, loans recovery does not rise
above 20 percent. Overall, the average recovery ratio across all 26 schemes is 38.8
percent. It should be recalled that these are conservative estimates, assuming
administrative cost of only one or two percent of outstanding debt. In reality, recovery
ratios are lower than those shown in Table 9.
7 Conclusions for Policy
Given less-than-full loans recovery in almost all loans schemes and, in many cases,
very heavy losses, government subsidy will remain a continuing feature of student
loans schemes as they are presently operated. The widely held view that student loans
schemes can act as revolving funds - which, once capitalized, can finance themselves
subsequently through repayments from earlier loans – is seen to be a myth.
26
Governments will need to inject funds annually to cover the costs of the built-in loans
repayment subsidies and to make up losses from non-repayment leakages. This is the
case where the size of the higher education system is stable, but even more so when the
system is expanding as is the case in very many countries.
However, the financial viability of loans schemes can be improved. Improvement may
be achieved either by reducing the levels of built-in subsidies (hidden grants) or by
improving the efficiency of loans schemes through containing administration costs and,
particularly, in reducing repayment leakages due to default. We have noted that the
main factor in accounting for the failure to recoup loans disbursements in most
schemes is the level of built-in subsidies (hidden grants), rather than default or high
administration costs. We discuss first the rationale for high level of built-in loans
subsidization in most schemes and, in particular, raise questions about its justification.
7.1 Confronting built-in over-subsidization
Repayment ratios are quite low in a number of loans schemes. While there is room for
some element of subsidy in most schemes, heavy government built-in subsidies
provided through large hidden grants – the major source of recovery losses – cannot
always be justified. Whether or not a loans scheme should be subsidized and, given
that a subsidy is in place, whether or not the size of the government built-in subsidy is
excessive, will depend on the main objectives that the loans scheme is intended to
serve. In a recent paper, one of the authors identified no less than eleven separate
objectives that have underscored loans schemes around the world (Ziderman 2002).
For purposes of the present discussion, however, we restrict our focus to the three more
pervasive purposes of loans schemes. These are: cost sharing (income generation);
social objectives (improving equity and access for the poor); and easing student
financial burdens. In practice, any given scheme may incorporate more than one
objective.
27

Cost-sharing is the central, albeit indirect, objective of many loans schemes. Student
loans facilitate greater cost-recovery through the raising of tuition fees and other
university costs, in so far as they counter deleterious effects on enrollment, and
especially on the access of disadvantaged groups. Social Targeting is explicitly and
directly concerned with accessibility of the poor. Where targeted specifically at
disadvantaged groups, loans schemes (particularly where substantially subsidized), can
lead to greater access of the poor to university education, thus contributing to social
equity. Thirdly, the Student Independence model is found typically in a number of
well-established schemes in Western Europe. The objective of loans provision in this
case (usually covering living expenses only, because tuition fees are minimal) is to ease
student financial burdens during study; these burdens may be present even for better-off
students. For example, in Nordic countries students are regarded as financially
independent of their parents; they should not be forced to rely upon parental financial
support which might not be forthcoming.
In loans schemes where either cost recovery or student independence constitutes the
central objective, the case for heavy built-in student loan subsidies is not strong. In both
of these cases, the intended effect of student loans is to reduce the financial burden on
students during study and to delay fee payment (through borrowing) until after
graduation, when payment is more readily made from the expected enhancement of
earnings that the additional education makes possible. In these cases, the level of built-in
subsidy is often excessive; the aim should be near-full loan recovery.
It is only where loans schemes are aimed directly at social targeting that a clear case for
sizeable built-in subsidies can be made. In many countries the relatively low enrolment
of poor and disadvantaged youth in tertiary education (and also in non-compulsory
secondary education) is a cause of social concern. Increasing the access to university
education among these segments of the population has become a major element in
educational and social policy. While the cause of low access of the poor is multi-faceted,
28

financial constraints evidently play a major explanatory role. There is now a broad
consensus on the need to offer clear financial incentives to poor, potential students, not
only to overcome the burden of fee payment and living expenses but also to offset both
parental resistance to reductions in family income and the fear that the benefits of the
educational process may not be sizeable. The provision of financial aid therefore may be
regarded as a necessary though not sufficient condition for achieving greater
participation of the poor.
The traditional, and most effective, method of enhancing the educational access of the
poor has been through the provision of means-tested grants to cover tuition fees and
usually living expenses as well; however, a widespread grants scheme is likely to be
expensive. The use of loans, rather than grants, proactively targeted on the poor, offers a
method that may both increase access for the poor and reduce, or at least contain, public
expenditure on student support over the longer term, as loan repayments build up. To be
effective in increasing the education access of the poor, loans may need to be made
available under "soft" lending conditions. Since a grant offers a stronger and more direct
incentive for access than does a (partially) repayable loan, the apparent advantage of
loans over grants is less clear-cut. This highlights a central conundrum in loans policy: at
what level of in-built loans subsidy does a grant become a more cost-effective
instrument for helping the poor than a subsidized loan (with hidden grants)?
In the recent comparative study of loans schemes in South East Asia (Ziderman, 2004),
most schemes were shown to conform to the social targeting model. Yet the evidence did
not indicate any high degree of success in increasing the university access of the poor.
A number of essential conditions for success were lacking. These include a sufficiently
high level of individual support to cover necessary expenses; a broad coverage of poor
students to achieve national impact; and careful and deliberate loans targeting so that
loans do indeed reach the poor and other disadvantaged groups, otherwise the central
objective of the scheme is compromised. Loans scheme aimed at greater participation of
29

the poor are often not effective because these ingredients for success are missing.
The upshot of this discussion is that the levels of built-in subsidies, resulting in low
repayment ratios, are often excessive. High subsidies may be either unnecessary (cost
sharing and student independence models) or less than effective in practice in achieving
objectives (social targeting). Since the level of built-in subsidy is fixed by government,
these subsidies may be reduced, as appropriate, by government decision. However,
vested interests are likely to militate against these desirable changes.
7.2 Reducing loans repayment default
The problem of high repayment default may be less tractable. A wide range of
measures to reduce repayment default are available for use in various loans schemes.
These include the use of loans guarantors, moral suasion (publication of defaulter lists),
baring access to further credit if in default and legal action against recalcitrant
defaulters. However, it is frequently the case that these measures are not employed in
practice. In a number of cases, notably in developing countries, a general atmosphere
of non-compliance has been created in which non repayment has become to be
regarded as socially acceptable.
A subject of recent controversy is whether the type of repayments collection
mechanism in place can affect the level of repayment default. Specifically, it has been
argued strongly that income contingent repayments schemes are likely to ease the
problem of repayment default, since an excessive repayment burden is avoided during
periods of unemployment and low earnings. However, whatever the other relative
merits of income contingent repayment and traditional mortgage loans schemes, there
is no evidence from the present study that default is lower under income contingent
schemes than mortgage-type schemes.
Loans schemes are expensive for governments and, we have noted, very often highly
30
subsidized. Given the tightness of public budgets in many countries, governments have
a strong interest in containing overall loans scheme costs and, particularly, subsidy
levels within appropriate and realistic limits. This will require a careful justification for
the current levels of loans subsidies, the development of efficient loans repayment
collection procedures and the continuous monitoring of the outcomes of the loan
scheme to ensure that it is successfully meeting defined objectives.
8 Acknowledgements Hua Shen was Fred and Barbara Kort Post-doctoral Fellow at Bar-Ilan University when this research was carried out. The authors acknowledge the helpful comments on an earlier draft provided by Miriam Krausz and Shoshana Neuman. References Anashvili, V. V. (2006). Student loans analytical report. Conference on student loans in
Russia, Ditchley Park, Oxfordshire, UK, January 27-29 2006. Carlson, S. (1992) Private financing of higher education in Latin America and the
Caribbean, Latin America and the Caribbean Technical Department Regional Studies Program Report No. 18. Washington, DC: The World Bank.
Chapman, B. (2005).Income contingent loans for higher education: International reform. Centre for economic policy research, Research school of social sciences, the Australian National University, Discussion paper No. 491. Canberra
Chapman, B. and Ryan, C. (2002). Income-contingent financing of student charges for higher education: assessing the Australian innovation. The Welsh Journal of Education, 11(1), 64-81.
Chung, Y.P. and Hung, F.S. (2003). Student loans in Hong Kong: a perspective of loans agency. Journal of Higher Education, 24(1), 45–52 (in Chinese).
Johnstone, D. B. (1986). Sharing the Costs of Higher Education: Student Financial Assistance in the United Kingdom, the Federal Republic of Germany, France, Sweden and the United States. New York: The College Board.
Johnstone, D.B. (2000). Student loans in international comparative perspective: promises and failures, myths and partial Truths. Buffalo, NY: University at Buffalo Center for Comparative and Global Studies in Education. http://www.gse.buffalo.edu/org/IntHigherEdFinance/
31
Johnstone, D.B. (2004). Higher education finance and accessibility and student loans in Sub-Saharan Africa. Journal of Higher Education in Africa, 2(2), p.11-36
Johnstone, D. B. (2006) Income contingent loans and graduate taxes: can they work in developing and transitional countries? in D. B. Johnstone: Financing Higher Education: Cost-Sharing in International Perspective. Rotterdam: Sense Publications
Johnstone, D.B. and Aemero, A. (2001). The applicability for developing countries of income contingent loans or graduate taxes, with special consideration of an Australian HECS-Type income contingent loan program for Ethiopia. Buffalo, NY: University at Buffalo Center for Comparative and Global Studies in Education http://www.gse.buffalo.edu/org/IntHigherEdFinance/
Usher, A. (2005). Global debt pattern: An international comparison of student loan burdens and repayment condition. Toronto: Educational Policy Institute.
Vossensteyn, H. (2004). Student financial support: An inventory in 24 European countries. Enschede, the Netherlands: Centre for Higher Educational Policy Studies (CHEPS)
Wandiga, S. (1997). Capacity building and institutional development in higher education in Kenya: a case study of public universities investment project (1991-1994). International Institute for Educational Planning. Paris: UNESCO
World Bank (2004). 2004 World development indicators. Washington D.C.: The World Bank.
Ziderman, A. (2002).Alternative objectives of national student loan schemes: Implications for design, evaluation and policy. The Welsh Journal of Education, 11(1), 37–47.
Ziderman, A. (2003). Student loans in Thailand: are they effective, equitable, sustainable? International Institute for Educational Planning. Paris: UNESCO
Ziderman, A. (2004). Policy options for student loan schemes: lessons from five Asian case studies. International Institute for Educational Planning. Paris: UNESCO
Ziderman, A. and Albrecht, D. (1995). Financing Universities in Developing Countries, Stanford Series on Education and Public Policy. London: Falmer Press.
32
Footnotes 1 The relative efficacy of these two types of loans repayment mechanisms has been the subject of considerable controversy and debate. Important references include Chapman and Ryan (2002), Chapman (2005), Johnstone and Aemero (1991) and Johnstone (2006) 2 The estimates reported in Table 2 assume that students take the maximum time allotted to pay off their loans. To the extent that loans are paid off earlier, actual subsidy levels will be lower and repayment ratios somewhat higher than those portrayed in the table and those that follow. 3 The World Bank classifies countries into four income groups, according to 2005 gross national income per head. The groups are: low income, $875 or less; lower middle income, $876 - $3,465; higher middle income, $3,466 - $10,725; and high income $10,726 or more (World Development Indicators database, World Bank).
33