student learning objectives (slo)
DESCRIPTION
Student Learning Objectives (SLO). Essential Questions: 1. How does an SLO factor into teacher evaluation? 2. How will the SLO process be organized at Lower Dauphin?. Key Vocabulary. Performance Measure – Test or Project - PowerPoint PPT PresentationTRANSCRIPT

Student Learning Objectives (SLO)
Essential Questions:
1. How does an SLO factor into teacher evaluation?
2. How will the SLO process be organized at Lower Dauphin?

Key Vocabulary
Performance Measure – Test or Project
Performance Indicator – The level of success you expect for students in your class on a “performance measure”
Teacher Expectations – Percentage of students who reach the “performance indicator”

SLO processA process to
A process to document a measure of educator effectiveness based on student achievement of content standards

Implementation
2013-2014 is a training year.
Districts will be required to implement SLOs in school year 2014-2015.

School Building Data, 15%
Teacher Specific Data, 15%
Elective Data, 20%
Observation/ Evidence,
50%
Observation/EvidenceEffective 2013-2014 SYDanielson Framework Do-mainsPlanning and PreparationClassroom EnvironmentInstructionProfessional Responsibilities
School Building DataEffective 2013-2014 SYIndicators of Academic AchievementIndicators of Closing the Achievement Gap, All StudentsIndicators of Closing the Achievement Gap, SubgroupsAcademic Growth PVAASOther Academic IndicatorsCredit for Advanced Achievement
Teacher Specific DataEffective 2016-2017 SYPVAAS / Growth 3 Year Rolling Average2013-2014 SY2014-2015 SY2015-2016 SYOther data as provided in Act 82
Elective Data/SLOsOptional 2013-2014 SYEffective 2014-2015 SYDistrict Designed Measures and Examina-tionsNationally Recognized Standardized TestsIndustry Certification ExaminationsStudent Projects Pursuant to Local Re-quirementsStudent Portfolios Pursuant to Local Re-quirements
Teacher Effectiveness System in Act 82 of 2012
5
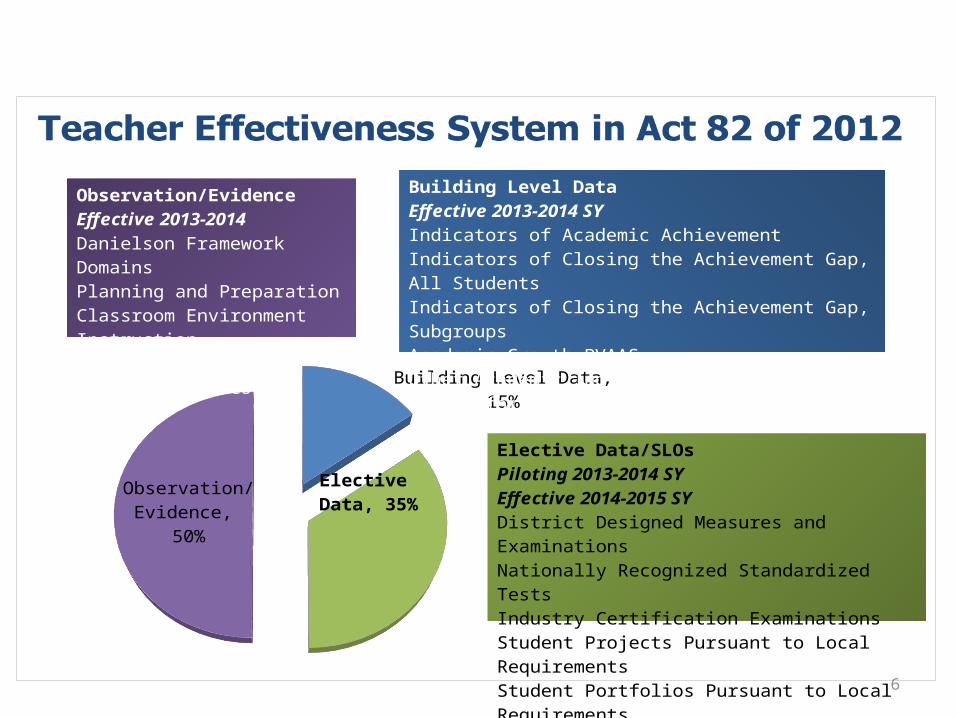
Building Level Data, 15%
Observation/ Evidence,
50%
Observation/EvidenceEffective 2013-2014Danielson Framework Do-mainsPlanning and PreparationClassroom EnvironmentInstructionProfessional Responsibilities
Building Level DataEffective 2013-2014 SYIndicators of Academic AchievementIndicators of Closing the Achievement Gap, All StudentsIndicators of Closing the Achievement Gap, Sub-groupsAcademic Growth PVAASOther Academic IndicatorsCredit for Advanced Achievement
Elective Data/SLOsPiloting 2013-2014 SYEffective 2014-2015 SYDistrict Designed Measures and Examina-tionsNationally Recognized Standardized TestsIndustry Certification ExaminationsStudent Projects Pursuant to Local Re-quirementsStudent Portfolios Pursuant to Local Re-quirements
Elective Data, 35%
6

PDE Categories A.K.A. Scale 2013-14 2014-15 2015-16
1Teacher Observation & Practice
Danielson Framework 0 - 3 85% 65% 50%
2 Building Level Score
School Performance Profile (SPP)
0 - 3 15% 15% 15%
3 Teacher Specific Rating
Value-Added (PVAAS) 0 - 3 NA NA 15%
4 Elective RatingStudent Learning Objectives (SLO)
0 - 3 NA 20% 20%
For Professionals who teach PSSA and Keystone Courses: grades 4 - 11

Category A.K.A. Scale 2013-14 2014-15 2015-16
1Teacher Observation & Practice
Danielson Framework 0 - 3 85% 50% 50%
2 Building Level Score
School Performance Profile (SPP)
0 - 3 15% 15% 15%
3 Elective RatingStudent Learning Objectives (SLO)
0 - 3 NA 35% 35%
For Professionals who do not teach PSSA and Keystone Courses: grades 4 - 11

Student Learning Objectives (SLO)
Five Sections:1. Classroom Context2. SLO Goal3. Performance Measures4. Performance Indicators5. Teacher Expectations

1. Classroom Context basics of class, size, meeting frequency, duration, etc.
1a. Teacher Name: Mrs. Apple
1b. Course/Class: English
1c. Sections: Period 1, 2, 4 (all students in these sections)
1d. Total number of students involved: 18 + 20 + 22 = 60
1e. Total number of students on all your rosters: 100

2. SLO Goal linked to standards with a rationale Goal - "Big Idea" Examples, Link to standards, short Narrative of why the goal statement and
aligned standards address important learning for the class.
2a. Goal Statement: Students will be able to demonstrate the ability to comprehend and evaluate complex texts across a range of types and disciplines.
2b. PA Core Standards: CC.1.2.9 - 8.1
2c. Rationale: Reading across a range of types and disciplines is a crucial skill to being successful in today's society. Being able to comprehend and evaluate complex texts will benefit students as they progress through their education and into the workforce.

3. Performance Measure (PM) The details of the assessment used for the SLO. Name, metric (growth and/or
achievement), administration date frequency, scoring tools and personnel, performance reporting
4a. Name: Grade 7 Common Assessment4b. Metric: Mastery4c. Administration Date: Second Week of January4d. Scoring Tools: Framework in Assessment
Builder/Performance Tracker4e. Scoring Personnel: Scored at District Office4f. Performance Reporting: Proficiency Level Report in
Performance Tracker

4. Performance Indicators (PI) description of the “expected level of achievement” for each student in the SLO
population (the assessment with a level of success or achievement defined)
3a.1. Assessment: Grade 7 Common Assessment
3a.2. Performance Indicator Targets: Students will score proficient (70% or higher) on the grade 7 Common Assessment

5. Teacher Expectations percent failing, needs improvement, proficient, distinguished
90-100% Distinguished
70-89% Proficient
50-69% Needs Improvement
0-49% Failing

Performance Measure: 7th Grade Classification Assessment
Performance Indicator: 70%
Number Students: 60

Performance Measure: 7th Grade Classification Assessment Performance Indicator: 70%
Number Students: 60
Students who met or exceeded the Performance Indicator on the Performance Measure
Students who did not met or exceeded the Performance Indicator on the Performance Measure
Buckets

Performance Measure: 7th Grade Classification Assessment Performance Indicator: 70%
Number Students: 60
Students who scored 70% or higher on the Performance Measure
Students who scored 69% or lower on the Performance Measure
50 10

Performance Measure: 7th Grade Classification Assessment
Performance Indicator: 70%Number Students: 60
Students who scored 70% or higher on the Performance Measure
Students who scored 69% or lower on the Performance Measure
5010
50/60 = 83.3%

Performance Measure: 7th Grade Classification Assessment Performance Indicator: 70%Number Students: 60
Students who scored 70% or higher on the Performance Measure
Students who scored 69% or lower on the Performance Measure
50 10
50/60 = 83.3%
Teacher Expectations
Needs Improvement (50 – 69)
Proficient (70 – 89)
Distinguished (90 – 100)
Failing (0 – 49)
_______________________________________________________________

Performance Measure: 7th Grade Classification Assessment
Performance Indicator: 80%Number Students: 60
Students who scored 70% or higher on the Performance Measure
Students who scored 69% or lower on the Performance Measure
50 10
50/60 = 83.3%
Teacher Expectations:
Failing (0 – 49) Needs Improvement (50 – 69) Proficient (70 – 89) Distinguished (90– 100)

FAQs
How many SLOs?2 Performance Measures per teacher per year
How many students?50% of your students no more than 100 (you select the sections, but
this should be a representative sample)
What performance measures should we use?Core: already developed common assessments Encore: discussion on appropriate assessments
At what level should we set the Performance Indicator? 70%

Teacher Expectation
At what level should we set the lower end of Proficiency in the Teacher Expectation section? 70%

“Teacher Expectation” Scenarioswith Performance Indicator set at 70%
Teacher A:0-49% 50%- 69% 70% - 89% 90%- 100%Failing Needs Imp Proficient Distinguished ______________________________________________________________
Teacher B:0-69% 70%- 79% 80% - 93% 94%- 100%Failing Needs Imp Proficient Distinguished

Teacher Expectation Scenarioswith Performance Indicator set at 80%
Teacher A: 60 students (42 met performance indicator, 18 did not) = 70%
_______________________________________________________________
Teacher B: 60 students (48 met performance indicator, 12 did not) = 80%