structural study of the ionic conductivity in double ... yamashita, naoto oshima, shunji takada, and...
TRANSCRIPT
19
Bull. Soc. Photogr. Imag. Japan. (2017) Vol. 27 No. 2: 19–25
1. Introduction
Silver-iodobromide double-structured grains have been used for high-sensitivity photographic materials such as color negative films. 1)2)3) With increasing iodide content, absorption of blue light increases but development rate decreases. Therefore, double-structured grains with a high silver-iodide-content core and low silver-iodide-content shell were used to increase both light absorption and development rate. Furthermore, it was found that the edge dislocation formed at the boundary between the core and shell acted as a primary photo-electron trap, causing an increase in sensitivity. 4) Consequently, dou-ble-structured grains were used not only for blue-sensitive emul-sions, but also for spectrally sensitized green- and red-sensitive emulsions.5)6)7) The reason of increase in sensitivity in the dou-ble-structured grains has been discussed previously from a viewpoint of electronic process as mentioned above.
After electrons were trapped in the latent image formation sites, the recombination process with holes and the neutralization process with interstitial silver ions compete each other. 8)9) It is known that the recombination process becomes predominant when the neutral-ization is too slow, and the dispersion of latent image specks occurs when the neutralization is too fast.8)9) The ionic conductivity of silver iodobromide changes with silver iodide concentration. 7) Therefore, the increase in sensitivity will be achieved when we can set the ionic conductivity of shell in the double-structured grains optimally. However, there is no report on the ionic conductivity of silver iodo-bromide double-structured grains. Maxwell-Wagner theory (MW
theory) has been used to analyze the dielectric loss response of silver halide grains, which is a practical theory to evaluate the ionic con-ductivity of them. However, this theory is only applicable to a dis-persion system of uniform grains.10)11)
The authors previously prepared double-structured grains of silver bromide with different ionic conductivities in core and shell by dop-ing polyvalent cations in each phase and found that their dielectric loss responses can be explained by Pauly-Schwan / Hanai (PS/H) theory.12)
We prepared silver iodobromide double-structured grains whose core or shell has high silver- iodide-content, measured their dielec-tric loss response experimentally, and analyzed the results using PS/H theory. Here, we report the behavior and analysis of ionic con-ductivity in the silver iodobromide double-structured grains.
2. Experimental method
We prepared two kinds of emulsions with uniform grains. Sample 1 consisted of pure silver bromide and Sample 2 consisted of silver iodobromide containing 27 mol% silver iodide. Then, we prepared two kinds of emulsions with double-structured grains. Sample 3 was designed that the core had silver iodobromide with 27 mol% iodide and the shell had silver bromide. Sample 4 was designed that the core and shell was exchanged with respect to Sample 3. They were prepared using the controlled double-jet method under the grain growth conditions in which the halide ion concentration exceeded the silver ion concentration slightly. The halogen composition during
*
**
***
Received 25th, April 2016; Accepted 19th, October 2017Medical Systems Research & Development Center, Research & Development Management Headquarters, Fuji Film Corporation 798, Miyanodai, Kaisei-machi, Ashigarakami-gun, Kanagawa 258-8538, JapanFuji Film Corporation (retired), present address:1-7-12, Higashi-cho, Oiso-machi, Naka-gun, Kanagawa 255-0002, JapanGraduate School of Advanced Integration Science, Chiba University1-33, Yayoi-cho, Inage-ku, Chiba-city, Chiba 263-8522, Japan
Original Paper
Structural Study of the Ionic Conductivity in Double-Structured Grains of Silver Iodobromide
Seiji Yamashita*, Naoto Oshima**, Shunji Takada***, and Ken’ichi Kuge***
Abstract: We prepared silver iodobromide double-structured grains with different iodide content in the core and the shell, and determined their ionic conductivities by measuring their dielectric loss responses. The responses were reproduced quantitatively by the calcula-tions based on Pauly-Schwan/Hanai (PS/H) theory, which is therefore proved to be an effective means for designing the silver iodo-bromide double-structured grains suitable for latent image formation.
Key words: Silver iodobromide double-structured grain, Dielectric loss response, Ionic conductivity, Pauly-Schwann/Hanai theory
Bull. Soc. Photogr. Imag. Japan. Vol. 27 No. 2 (2017)20
the growth of silver iodobromide phase was controlled to be 27 mol% silver iodide. The sphere-equivalent diameter and shell thick-ness of the double-structured grains were set to 1.00 µm and 0.10 µm, respectively. Crystallographic data of the silver halide grains prepared here are shown in Table 1. The grains of Sample 3 contain-ing silver iodobromide core and silver bromide shell were cubo-oc-tahedral grains with {111} and {100} faces. The grains of Samples 1, 2, and 4 were octahedral grains with {111} faces.
The formation energy of interstitial silver ions from the crystal surface is smaller than that in the bulk and varies with the crystal habit of silver halide grains. This causes that the ionic conductivity of grains changes with crystal habit and size, even if halogen composi-tion is the same.9)13) To suppress these effects, 1-phenyl-5-mercapto-tetrazole ( PMT, 1 × 10⁻³ mol/molAg) was added to the emulsion just before coating.12) Since adsorbed PMT suppresses the formation of interstitial silver ions from the crystal surfaces, the grains become to have the same ionic conductivity as the one of large crystals.13) The emulsions were coated and dried to produce a dry film of 100 µm thick for measurements of dielectric loss response.
Two kinds of impedance analyzers were used to measure dielec-tric loss response.13) An INST Frequency Analyzer 5720B (NF
Electronics) was used to measure low frequency characteristics and a 4192A Impedance Analyzer (Hewlett Packard) was used to mea-sure high frequency characteristics. The temperature dependence of ionic conductivity was measured using a cryostat. The silver iodide contents in core and shell of the double-structured grains were de-termined from the lattice constants obtained by powder X-ray dif-fraction.14)
3. Experimental results
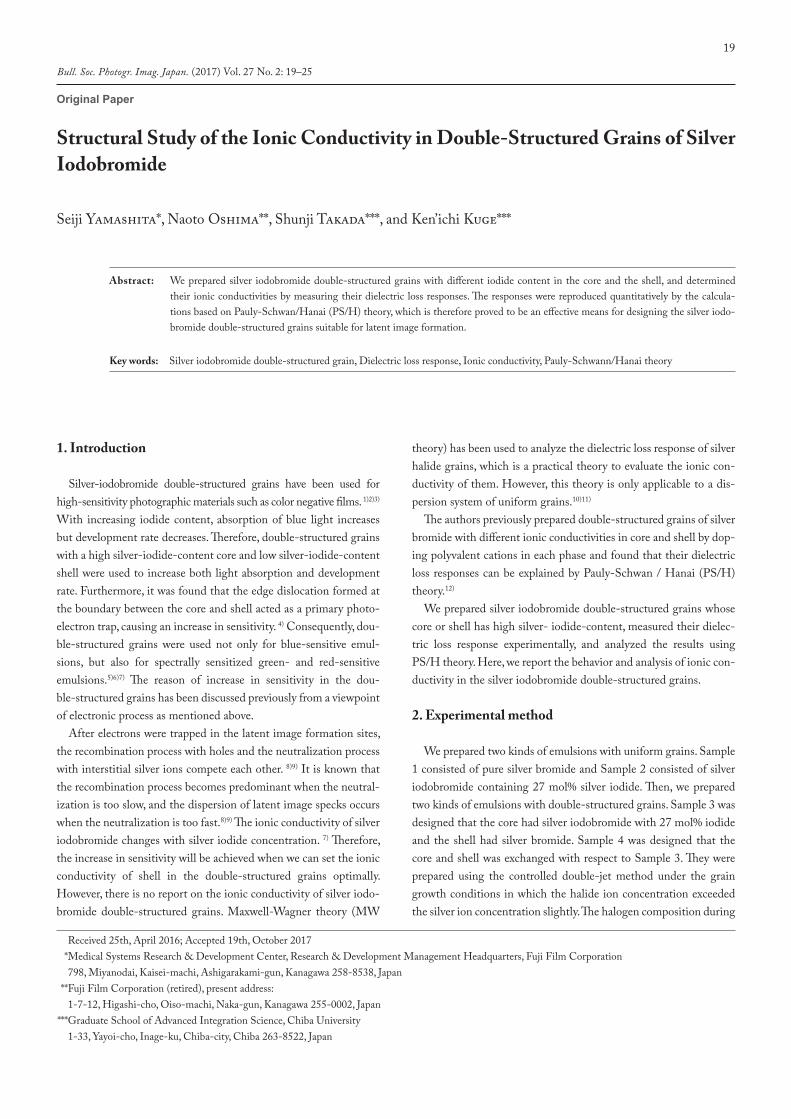
3.1 Measurement of dielectric loss responseThe dielectric loss responses of Samples 1, 2, and 3 are shown in
Fig. 1. Sample 3, which consists of double-structured grains with silver-iodobromide core, indicates two dielectric loss peaks (shown by the solid line). Since the peak frequency of the dielectric loss is proportional to the ionic conductivity11), the high frequency peak (maximum frequency fH ) reflects the ionic conductivity of the core with high ionic conductivity, and the low frequency peak (maximum frequency fL) reflects that of the shell with low ionic conductivity. Dashed lines represent the dielectric loss responses of Sample 1 and Sample 2 which consist of uniform grains of silver-bromide (maxi-mum frequency f1) or silver iodobromide (maximum frequency f2).
Table 1 Crystallographic data for four types of silver halide emulsion grains used in this report.
Sample No.Halide Composition Volume Ratio of
Core to Shell Crystal Habit Grain Size (µm)Core Shell
1 AgBr - - Octahedral 0.82 AgBrI - - Octahedral 0.83 AgBrI AgBr 1:1 Cubo-Octahedral 1.04 AgBr AgBrI 1:1 Octahedral 1.0
Fig. 1 Experimental results of dielectric loss responses for Samples 1, 2, and 3 at R.T. The solid line with two peaks shows the dielectric loss curve for Sample 3. Here, fL is the peak frequency of the dielectric loss peak in the lower-frequency region, and fH is the one in the higher-fre-quency region of Sample 3. Broken lines show the dielectric loss curves for Sample 1 in the lower-frequency region and Sample 2 in the higher-frequency region; f1 is the peak frequency of the low-fre-quency peak and f2 is that of the high-frequency peak. In this experi-ment, the measuring range of each dielectric loss peak was set within the range that can determine the position and shape of the peak cor-responding to the ionic conductivity.
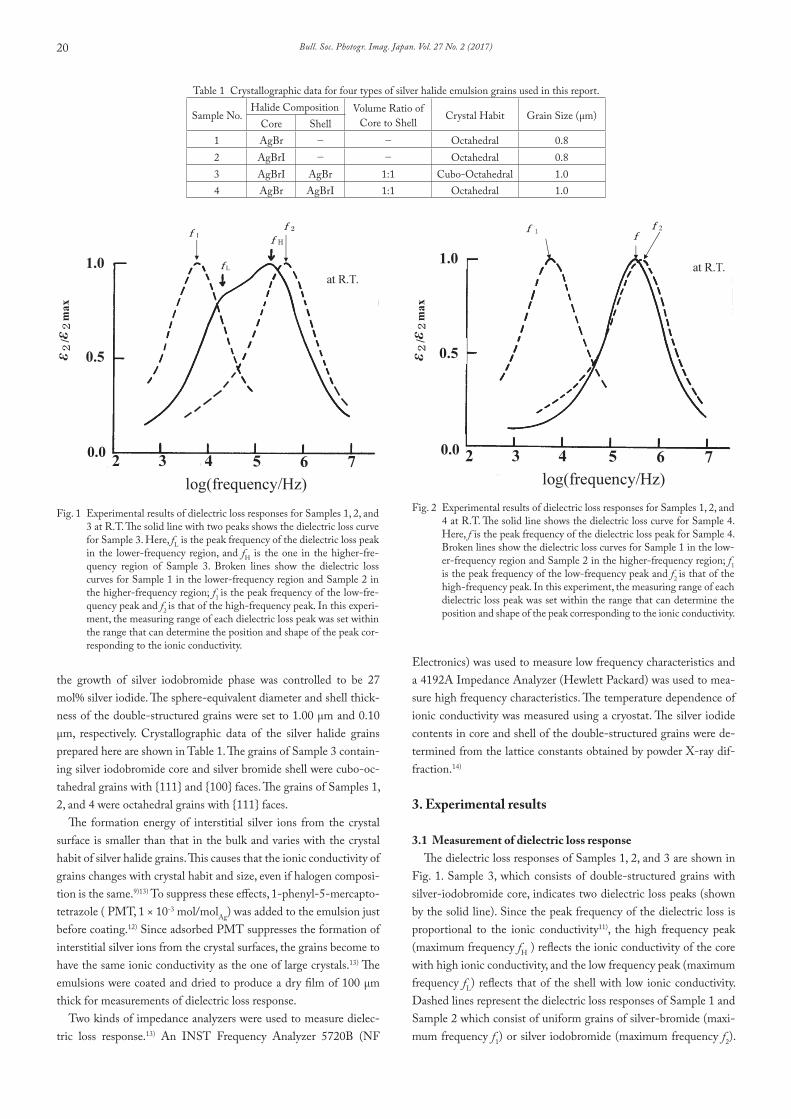
Fig. 2 Experimental results of dielectric loss responses for Samples 1, 2, and 4 at R.T. The solid line shows the dielectric loss curve for Sample 4. Here, f is the peak frequency of the dielectric loss peak for Sample 4. Broken lines show the dielectric loss curves for Sample 1 in the low-er-frequency region and Sample 2 in the higher-frequency region; f1 is the peak frequency of the low-frequency peak and f2 is that of the high-frequency peak. In this experiment, the measuring range of each dielectric loss peak was set within the range that can determine the position and shape of the peak corresponding to the ionic conductivity.
Seiji Yamashita, Naoto Oshima, Shunji Takada, and Ken’ichi Kuge Structural Study of the Ionic Conductivity in Double-Structured Grains of Silver Iodobromide 21
Both show a symmetric single peak.Fig. 2 shows the dielectric loss responses of Sample 4 (dou-
ble-structured grains with silver-iodobromide shell), and Sample 1 and Sample 2 (uniform grains). Sample 4 (indicated by a solid line) shows a single dielectric loss peak (maximum frequency f ). Dashed lines represent the dielectric loss responses of Sample 1 and Sample 2 as same as in Fig.1. The peak of Sample 4 is almost at the same position as the peak of Sample 2.
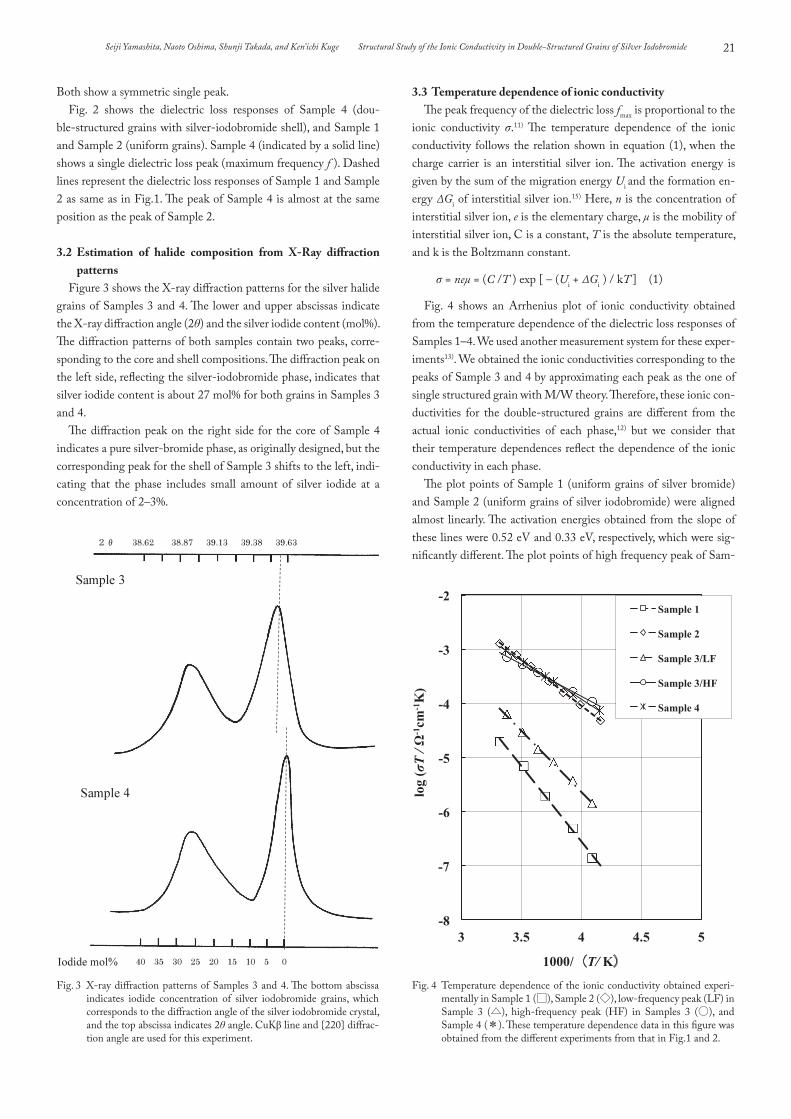
3.2 Estimation of halide composition from X-Ray diffraction patterns
Figure 3 shows the X-ray diffraction patterns for the silver halide grains of Samples 3 and 4. The lower and upper abscissas indicate the X-ray diffraction angle (2θ) and the silver iodide content (mol%). The diffraction patterns of both samples contain two peaks, corre-sponding to the core and shell compositions. The diffraction peak on the left side, reflecting the silver-iodobromide phase, indicates that silver iodide content is about 27 mol% for both grains in Samples 3 and 4.
The diffraction peak on the right side for the core of Sample 4 indicates a pure silver-bromide phase, as originally designed, but the corresponding peak for the shell of Sample 3 shifts to the left, indi-cating that the phase includes small amount of silver iodide at a concentration of 2–3%.
3.3 Temperature dependence of ionic conductivityThe peak frequency of the dielectric loss fmax is proportional to the
ionic conductivity σ.11) The temperature dependence of the ionic conductivity follows the relation shown in equation (1), when the charge carrier is an interstitial silver ion. The activation energy is given by the sum of the migration energy Ui and the formation en-ergy ΔGi of interstitial silver ion.15) Here, n is the concentration of interstitial silver ion, e is the elementary charge, μ is the mobility of interstitial silver ion, C is a constant, T is the absolute temperature, and k is the Boltzmann constant.
σ = neμ = (C /T ) exp [ – (Ui + ΔGi ) / kT ] (1)
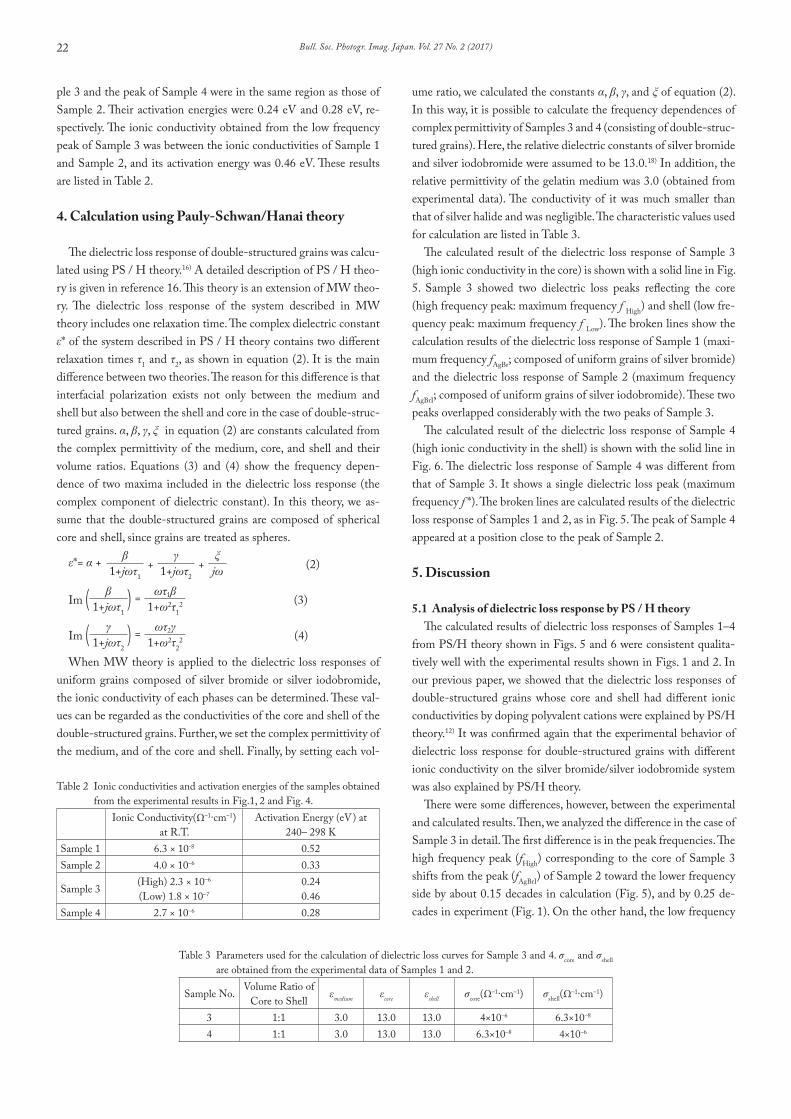
Fig. 4 shows an Arrhenius plot of ionic conductivity obtained from the temperature dependence of the dielectric loss responses of Samples 1–4. We used another measurement system for these exper-iments13). We obtained the ionic conductivities corresponding to the peaks of Sample 3 and 4 by approximating each peak as the one of single structured grain with M/W theory. Therefore, these ionic con-ductivities for the double-structured grains are different from the actual ionic conductivities of each phase,12) but we consider that their temperature dependences reflect the dependence of the ionic conductivity in each phase.
The plot points of Sample 1 (uniform grains of silver bromide) and Sample 2 (uniform grains of silver iodobromide) were aligned almost linearly. The activation energies obtained from the slope of these lines were 0.52 eV and 0.33 eV, respectively, which were sig-nificantly different. The plot points of high frequency peak of Sam-
Fig. 4 Temperature dependence of the ionic conductivity obtained experi-mentally in Sample 1 (□), Sample 2 (◇), low-frequency peak (LF) in Sample 3 (△), high-frequency peak (HF) in Samples 3 (○), and Sample 4 (*). These temperature dependence data in this figure was obtained from the different experiments from that in Fig.1 and 2.
-8
-7
-6
-5
-4
-3
-2
3 3.5 4 4.5 5
log(
T)
1000/T(K)
Sample 1
Sample 2
Sample 3/LF
Sample 3/HF
Sample 4
log
(σT
/Ω-1
cm-1
K)
1000/(T/ K)
Fig. 3 X-ray diffraction patterns of Samples 3 and 4. The bottom abscissa indicates iodide concentration of silver iodobromide grains, which corresponds to the diffraction angle of the silver iodobromide crystal, and the top abscissa indicates 2θ angle. CuKβ line and {220} diffrac-tion angle are used for this experiment.
Bull. Soc. Photogr. Imag. Japan. Vol. 27 No. 2 (2017)22
ple 3 and the peak of Sample 4 were in the same region as those of Sample 2. Their activation energies were 0.24 eV and 0.28 eV, re-spectively. The ionic conductivity obtained from the low frequency peak of Sample 3 was between the ionic conductivities of Sample 1 and Sample 2, and its activation energy was 0.46 eV. These results are listed in Table 2.
4. Calculation using Pauly-Schwan/Hanai theory
The dielectric loss response of double-structured grains was calcu-lated using PS / H theory.16) A detailed description of PS / H theo-ry is given in reference 16. This theory is an extension of MW theo-ry. The dielectric loss response of the system described in MW theory includes one relaxation time. The complex dielectric constant ε* of the system described in PS / H theory contains two different relaxation times τ1 and τ2, as shown in equation (2). It is the main difference between two theories. The reason for this difference is that interfacial polarization exists not only between the medium and shell but also between the shell and core in the case of double-struc-tured grains. α, β, γ, ξ in equation (2) are constants calculated from the complex permittivity of the medium, core, and shell and their volume ratios. Equations (3) and (4) show the frequency depen-dence of two maxima included in the dielectric loss response (the complex component of dielectric constant). In this theory, we as-sume that the double-structured grains are composed of spherical core and shell, since grains are treated as spheres.
ε*= α + β+
γ+
ξ(2)1+jωτ1 1+jωτ2 jω
Im ( β ) = ωτ1β (3)1+jωτ1 1+ω2τ12
Im ( γ ) = ωτ2γ (4)1+jωτ2 1+ω2τ22
When MW theory is applied to the dielectric loss responses of uniform grains composed of silver bromide or silver iodobromide, the ionic conductivity of each phases can be determined. These val-ues can be regarded as the conductivities of the core and shell of the double-structured grains. Further, we set the complex permittivity of the medium, and of the core and shell. Finally, by setting each vol-
ume ratio, we calculated the constants α, β, γ, and ξ of equation (2). In this way, it is possible to calculate the frequency dependences of complex permittivity of Samples 3 and 4 (consisting of double-struc-tured grains). Here, the relative dielectric constants of silver bromide and silver iodobromide were assumed to be 13.0.18) In addition, the relative permittivity of the gelatin medium was 3.0 (obtained from experimental data). The conductivity of it was much smaller than that of silver halide and was negligible. The characteristic values used for calculation are listed in Table 3.
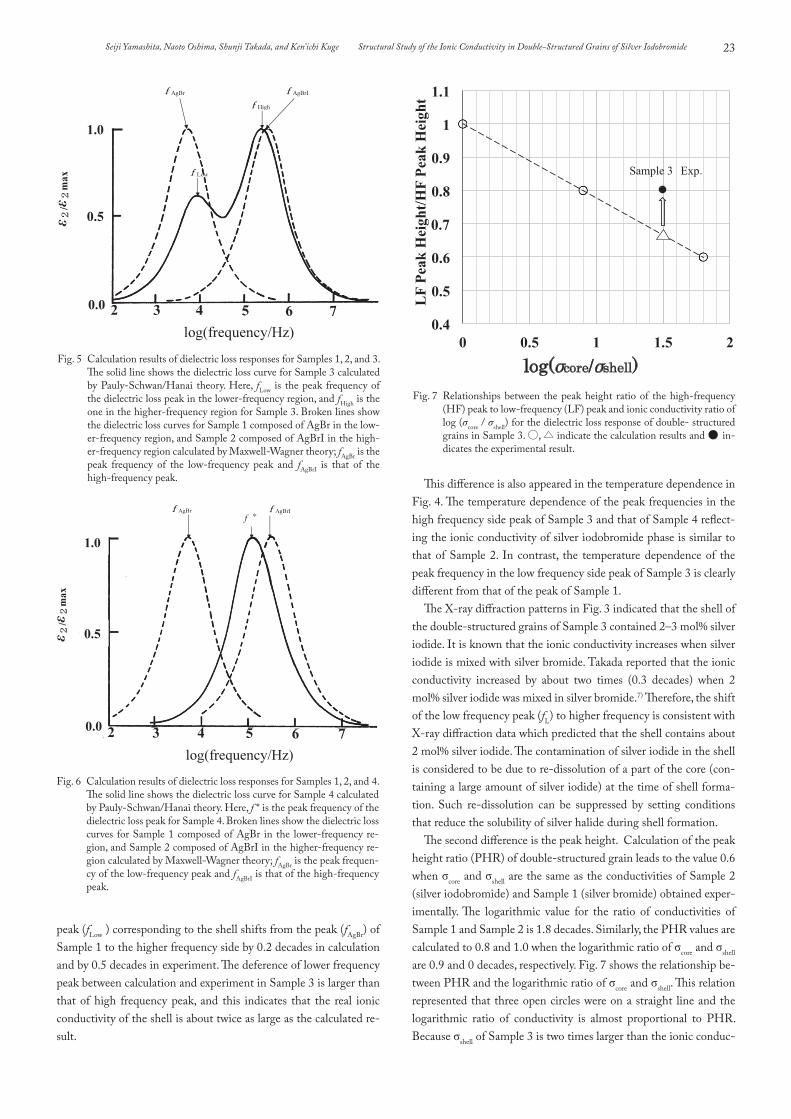
The calculated result of the dielectric loss response of Sample 3 (high ionic conductivity in the core) is shown with a solid line in Fig. 5. Sample 3 showed two dielectric loss peaks reflecting the core (high frequency peak: maximum frequency f High) and shell (low fre-quency peak: maximum frequency f Low). The broken lines show the calculation results of the dielectric loss response of Sample 1 (maxi-mum frequency fAgBr; composed of uniform grains of silver bromide) and the dielectric loss response of Sample 2 (maximum frequency fAgBrI; composed of uniform grains of silver iodobromide). These two peaks overlapped considerably with the two peaks of Sample 3.
The calculated result of the dielectric loss response of Sample 4 (high ionic conductivity in the shell) is shown with the solid line in Fig. 6. The dielectric loss response of Sample 4 was different from that of Sample 3. It shows a single dielectric loss peak (maximum frequency f *). The broken lines are calculated results of the dielectric loss response of Samples 1 and 2, as in Fig. 5. The peak of Sample 4 appeared at a position close to the peak of Sample 2.
5. Discussion
5.1 Analysis of dielectric loss response by PS / H theoryThe calculated results of dielectric loss responses of Samples 1–4
from PS/H theory shown in Figs. 5 and 6 were consistent qualita-tively well with the experimental results shown in Figs. 1 and 2. In our previous paper, we showed that the dielectric loss responses of double-structured grains whose core and shell had different ionic conductivities by doping polyvalent cations were explained by PS/H theory.12) It was confirmed again that the experimental behavior of dielectric loss response for double-structured grains with different ionic conductivity on the silver bromide/silver iodobromide system was also explained by PS/H theory.
There were some differences, however, between the experimental and calculated results. Then, we analyzed the difference in the case of Sample 3 in detail. The first difference is in the peak frequencies. The high frequency peak (fHigh) corresponding to the core of Sample 3 shifts from the peak (fAgBrI) of Sample 2 toward the lower frequency side by about 0.15 decades in calculation (Fig. 5), and by 0.25 de-cades in experiment (Fig. 1). On the other hand, the low frequency
Table 3 Parameters used for the calculation of dielectric loss curves for Sample 3 and 4. σcore and σshell are obtained from the experimental data of Samples 1 and 2.
Sample No. Volume Ratio of Core to Shell εmedium εcore εshell σcore(Ω–1·cm–1) σshell(Ω–1·cm–1)
3 1:1 3.0 13.0 13.0 4×10⁻⁶ 6.3×10⁻⁸
4 1:1 3.0 13.0 13.0 6.3×10⁻⁸ 4×10⁻⁶
Table 2 Ionic conductivities and activation energies of the samples obtained from the experimental results in Fig.1, 2 and Fig. 4.
Ionic Conductivity(Ω–1·cm–1)at R.T.
Activation Energy (eV) at 240– 298 K
Sample 1 6.3 × 10⁻⁸ 0.52Sample 2 4.0 × 10⁻⁶ 0.33
Sample 3 (High) 2.3 × 10⁻⁶
(Low) 1.8 × 10⁻⁷
0.240.46
Sample 4 2.7 × 10⁻⁶ 0.28
Seiji Yamashita, Naoto Oshima, Shunji Takada, and Ken’ichi Kuge Structural Study of the Ionic Conductivity in Double-Structured Grains of Silver Iodobromide 23
peak (fLow ) corresponding to the shell shifts from the peak (fAgBr) of Sample 1 to the higher frequency side by 0.2 decades in calculation and by 0.5 decades in experiment. The deference of lower frequency peak between calculation and experiment in Sample 3 is larger than that of high frequency peak, and this indicates that the real ionic conductivity of the shell is about twice as large as the calculated re-sult.
This difference is also appeared in the temperature dependence in Fig. 4. The temperature dependence of the peak frequencies in the high frequency side peak of Sample 3 and that of Sample 4 reflect-ing the ionic conductivity of silver iodobromide phase is similar to that of Sample 2. In contrast, the temperature dependence of the peak frequency in the low frequency side peak of Sample 3 is clearly different from that of the peak of Sample 1.
The X-ray diffraction patterns in Fig. 3 indicated that the shell of the double-structured grains of Sample 3 contained 2–3 mol% silver iodide. It is known that the ionic conductivity increases when silver iodide is mixed with silver bromide. Takada reported that the ionic conductivity increased by about two times (0.3 decades) when 2 mol% silver iodide was mixed in silver bromide.7) Therefore, the shift of the low frequency peak (fL) to higher frequency is consistent with X-ray diffraction data which predicted that the shell contains about 2 mol% silver iodide. The contamination of silver iodide in the shell is considered to be due to re-dissolution of a part of the core (con-taining a large amount of silver iodide) at the time of shell forma-tion. Such re-dissolution can be suppressed by setting conditions that reduce the solubility of silver halide during shell formation.
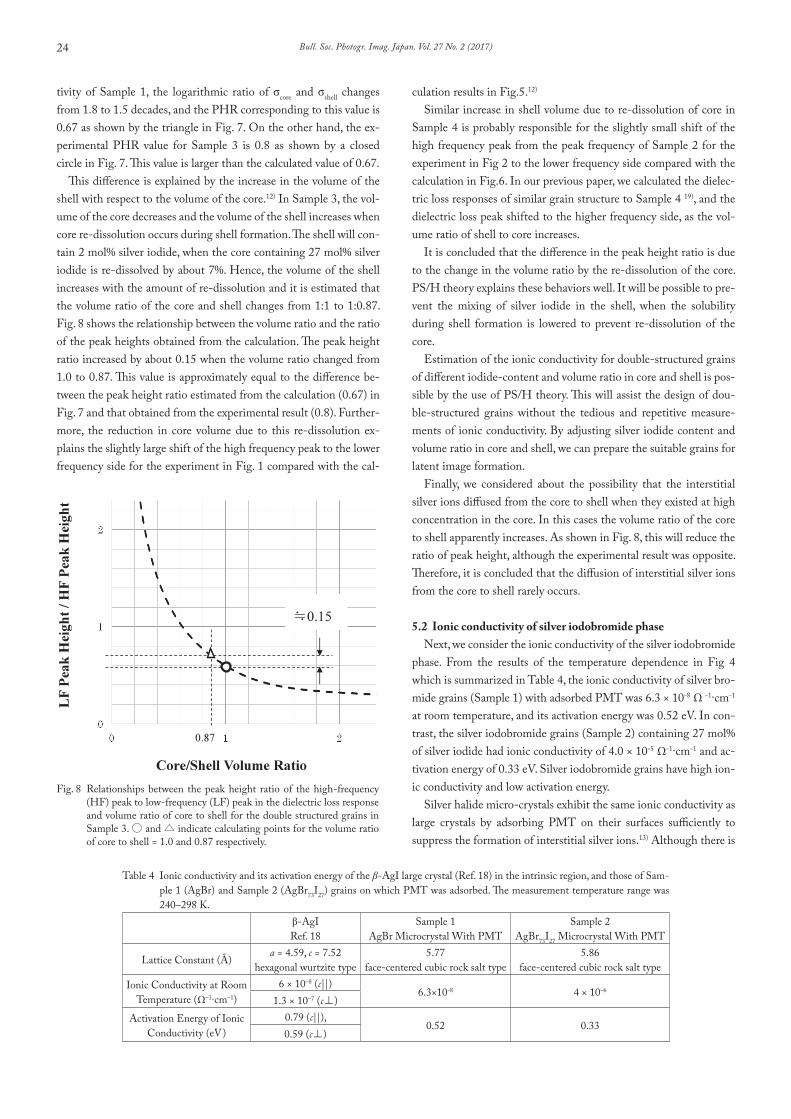
The second difference is the peak height. Calculation of the peak height ratio (PHR) of double-structured grain leads to the value 0.6 when σcore and σshell are the same as the conductivities of Sample 2 (silver iodobromide) and Sample 1 (silver bromide) obtained exper-imentally. The logarithmic value for the ratio of conductivities of Sample 1 and Sample 2 is 1.8 decades. Similarly, the PHR values are calculated to 0.8 and 1.0 when the logarithmic ratio of σcore and σshell are 0.9 and 0 decades, respectively. Fig. 7 shows the relationship be-tween PHR and the logarithmic ratio of σcore and σshell. This relation represented that three open circles were on a straight line and the logarithmic ratio of conductivity is almost proportional to PHR. Because σshell of Sample 3 is two times larger than the ionic conduc-
Fig. 5 Calculation results of dielectric loss responses for Samples 1, 2, and 3. The solid line shows the dielectric loss curve for Sample 3 calculated by Pauly-Schwan/Hanai theory. Here, fLow is the peak frequency of the dielectric loss peak in the lower-frequency region, and fHigh is the one in the higher-frequency region for Sample 3. Broken lines show the dielectric loss curves for Sample 1 composed of AgBr in the low-er-frequency region, and Sample 2 composed of AgBrI in the high-er-frequency region calculated by Maxwell-Wagner theory; fAgBr is the peak frequency of the low-frequency peak and fAgBrI is that of the high-frequency peak.
Fig. 6 Calculation results of dielectric loss responses for Samples 1, 2, and 4. The solid line shows the dielectric loss curve for Sample 4 calculated by Pauly-Schwan/Hanai theory. Here, f * is the peak frequency of the dielectric loss peak for Sample 4. Broken lines show the dielectric loss curves for Sample 1 composed of AgBr in the lower-frequency re-gion, and Sample 2 composed of AgBrI in the higher-frequency re-gion calculated by Maxwell-Wagner theory; fAgBr is the peak frequen-cy of the low-frequency peak and fAgBrI is that of the high-frequency peak.
Fig. 7 Relationships between the peak height ratio of the high-frequency (HF) peak to low-frequency (LF) peak and ionic conductivity ratio of log (σcore / σshell) for the dielectric loss response of double- structured grains in Sample 3. ○, △ indicate the calculation results and ● in-dicates the experimental result.
0.4
0.5
0.6
0.7
0.8
0.9
1
1.1
0 0.5 1 1.5 2
LF
Peak
Hei
ght/H
F Pe
ak H
eigh
t
log( core/ shell)
Sample 3 Exp
Bull. Soc. Photogr. Imag. Japan. Vol. 27 No. 2 (2017)24
tivity of Sample 1, the logarithmic ratio of σcore and σshell changes from 1.8 to 1.5 decades, and the PHR corresponding to this value is 0.67 as shown by the triangle in Fig. 7. On the other hand, the ex-perimental PHR value for Sample 3 is 0.8 as shown by a closed circle in Fig. 7. This value is larger than the calculated value of 0.67.
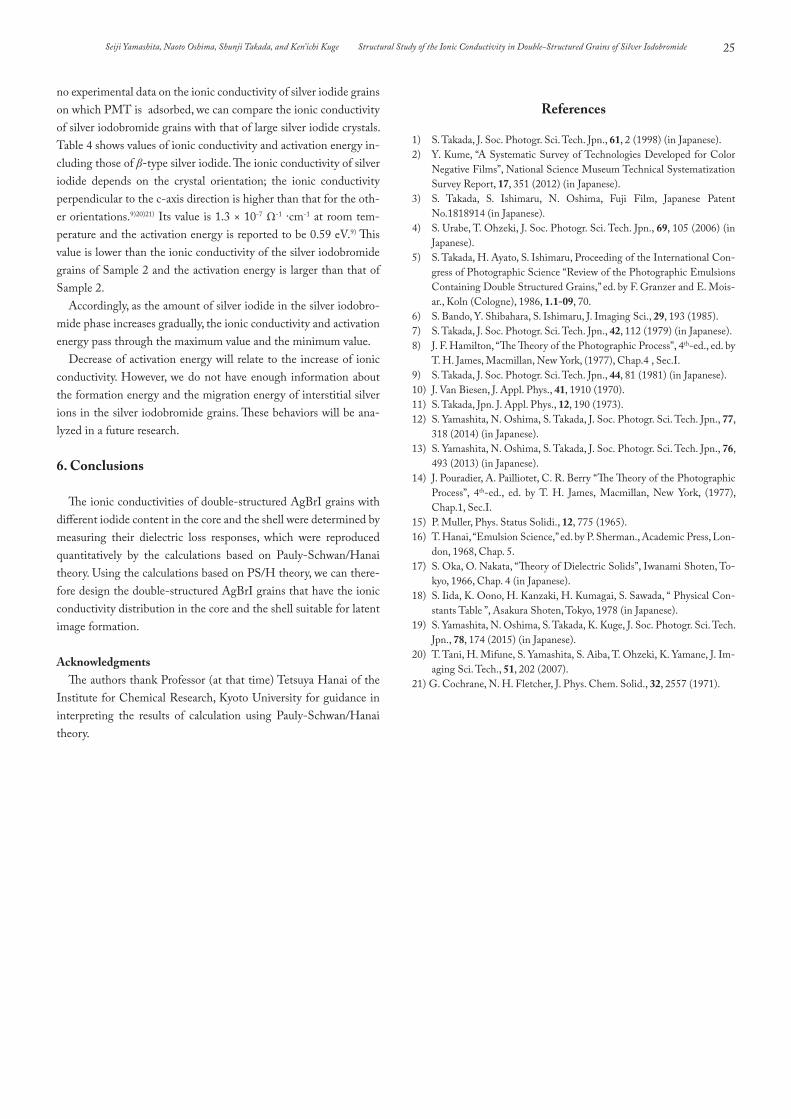
This difference is explained by the increase in the volume of the shell with respect to the volume of the core.12) In Sample 3, the vol-ume of the core decreases and the volume of the shell increases when core re-dissolution occurs during shell formation. The shell will con-tain 2 mol% silver iodide, when the core containing 27 mol% silver iodide is re-dissolved by about 7%. Hence, the volume of the shell increases with the amount of re-dissolution and it is estimated that the volume ratio of the core and shell changes from 1:1 to 1:0.87. Fig. 8 shows the relationship between the volume ratio and the ratio of the peak heights obtained from the calculation. The peak height ratio increased by about 0.15 when the volume ratio changed from 1.0 to 0.87. This value is approximately equal to the difference be-tween the peak height ratio estimated from the calculation (0.67) in Fig. 7 and that obtained from the experimental result (0.8). Further-more, the reduction in core volume due to this re-dissolution ex-plains the slightly large shift of the high frequency peak to the lower frequency side for the experiment in Fig. 1 compared with the cal-
culation results in Fig.5.12)
Similar increase in shell volume due to re-dissolution of core in Sample 4 is probably responsible for the slightly small shift of the high frequency peak from the peak frequency of Sample 2 for the experiment in Fig 2 to the lower frequency side compared with the calculation in Fig.6. In our previous paper, we calculated the dielec-tric loss responses of similar grain structure to Sample 4 19), and the dielectric loss peak shifted to the higher frequency side, as the vol-ume ratio of shell to core increases.
It is concluded that the difference in the peak height ratio is due to the change in the volume ratio by the re-dissolution of the core. PS/H theory explains these behaviors well. It will be possible to pre-vent the mixing of silver iodide in the shell, when the solubility during shell formation is lowered to prevent re-dissolution of the core.
Estimation of the ionic conductivity for double-structured grains of different iodide-content and volume ratio in core and shell is pos-sible by the use of PS/H theory. This will assist the design of dou-ble-structured grains without the tedious and repetitive measure-ments of ionic conductivity. By adjusting silver iodide content and volume ratio in core and shell, we can prepare the suitable grains for latent image formation.
Finally, we considered about the possibility that the interstitial silver ions diffused from the core to shell when they existed at high concentration in the core. In this cases the volume ratio of the core to shell apparently increases. As shown in Fig. 8, this will reduce the ratio of peak height, although the experimental result was opposite. Therefore, it is concluded that the diffusion of interstitial silver ions from the core to shell rarely occurs.
5.2 Ionic conductivity of silver iodobromide phaseNext, we consider the ionic conductivity of the silver iodobromide
phase. From the results of the temperature dependence in Fig 4 which is summarized in Table 4, the ionic conductivity of silver bro-mide grains (Sample 1) with adsorbed PMT was 6.3 × 10⁻⁸ Ω -1·cm-1 at room temperature, and its activation energy was 0.52 eV. In con-trast, the silver iodobromide grains (Sample 2) containing 27 mol% of silver iodide had ionic conductivity of 4.0 × 10⁻⁵ Ω-1·cm-1 and ac-tivation energy of 0.33 eV. Silver iodobromide grains have high ion-ic conductivity and low activation energy.
Silver halide micro-crystals exhibit the same ionic conductivity as large crystals by adsorbing PMT on their surfaces sufficiently to suppress the formation of interstitial silver ions.13) Although there is
Fig. 8 Relationships between the peak height ratio of the high-frequency (HF) peak to low-frequency (LF) peak in the dielectric loss response and volume ratio of core to shell for the double structured grains in Sample 3. ○ and △ indicate calculating points for the volume ratio of core to shell = 1.0 and 0.87 respectively.
Table 4 Ionic conductivity and its activation energy of the β-AgI large crystal (Ref. 18) in the intrinsic region, and those of Sam-ple 1 (AgBr) and Sample 2 (AgBr73I27) grains on which PMT was adsorbed. The measurement temperature range was 240–298 K.
β-AgIRef. 18
Sample 1AgBr Microcrystal With PMT
Sample 2AgBr73I27 Microcrystal With PMT
Lattice Constant (Å) a = 4.59, c = 7.52hexagonal wurtzite type
5.77face-centered cubic rock salt type
5.86face-centered cubic rock salt type
Ionic Conductivity at Room Temperature (Ω–1·cm–1)
6 × 10⁻⁸ (c||)6.3×10⁻⁸ 4 × 10⁻⁶
1.3 × 10⁻⁷ (c⊥)Activation Energy of Ionic
Conductivity (eV)0.79 (c||),
0.52 0.330.59 (c⊥)
Seiji Yamashita, Naoto Oshima, Shunji Takada, and Ken’ichi Kuge Structural Study of the Ionic Conductivity in Double-Structured Grains of Silver Iodobromide 25
no experimental data on the ionic conductivity of silver iodide grains on which PMT is adsorbed, we can compare the ionic conductivity of silver iodobromide grains with that of large silver iodide crystals. Table 4 shows values of ionic conductivity and activation energy in-cluding those of β-type silver iodide. The ionic conductivity of silver iodide depends on the crystal orientation; the ionic conductivity perpendicular to the c-axis direction is higher than that for the oth-er orientations.9)20)21) Its value is 1.3 × 10⁻⁷ Ω-1 ·cm-1 at room tem-perature and the activation energy is reported to be 0.59 eV.9) This value is lower than the ionic conductivity of the silver iodobromide grains of Sample 2 and the activation energy is larger than that of Sample 2.
Accordingly, as the amount of silver iodide in the silver iodobro-mide phase increases gradually, the ionic conductivity and activation energy pass through the maximum value and the minimum value.
Decrease of activation energy will relate to the increase of ionic conductivity. However, we do not have enough information about the formation energy and the migration energy of interstitial silver ions in the silver iodobromide grains. These behaviors will be ana-lyzed in a future research.
6. Conclusions
The ionic conductivities of double-structured AgBrI grains with different iodide content in the core and the shell were determined by measuring their dielectric loss responses, which were reproduced quantitatively by the calculations based on Pauly-Schwan/Hanai theory. Using the calculations based on PS/H theory, we can there-fore design the double-structured AgBrI grains that have the ionic conductivity distribution in the core and the shell suitable for latent image formation.
AcknowledgmentsThe authors thank Professor (at that time) Tetsuya Hanai of the
Institute for Chemical Research, Kyoto University for guidance in interpreting the results of calculation using Pauly-Schwan/Hanai theory.
References
1) S. Takada, J. Soc. Photogr. Sci. Tech. Jpn., 61, 2 (1998) (in Japanese).2) Y. Kume, “A Systematic Survey of Technologies Developed for Color
Negative Films”, National Science Museum Technical Systematization Survey Report, 17, 351 (2012) (in Japanese).
3) S. Takada, S. Ishimaru, N. Oshima, Fuji Film, Japanese Patent No.1818914 (in Japanese).
4) S. Urabe, T. Ohzeki, J. Soc. Photogr. Sci. Tech. Jpn., 69, 105 (2006) (in Japanese).
5) S. Takada, H. Ayato, S. Ishimaru, Proceeding of the International Con-gress of Photographic Science “Review of the Photographic Emulsions Containing Double Structured Grains,” ed. by F. Granzer and E. Mois-ar., Koln (Cologne), 1986, 1.1-09, 70.
6) S. Bando, Y. Shibahara, S. Ishimaru, J. Imaging Sci., 29, 193 (1985).7) S. Takada, J. Soc. Photogr. Sci. Tech. Jpn., 42, 112 (1979) (in Japanese).8) J. F. Hamilton, “The Theory of the Photographic Process”, 4th-ed., ed. by
T. H. James, Macmillan, New York, (1977), Chap.4 , Sec.I.9) S. Takada, J. Soc. Photogr. Sci. Tech. Jpn., 44, 81 (1981) (in Japanese).10) J. Van Biesen, J. Appl. Phys., 41, 1910 (1970).11) S. Takada, Jpn. J. Appl. Phys., 12, 190 (1973).12) S. Yamashita, N. Oshima, S. Takada, J. Soc. Photogr. Sci. Tech. Jpn., 77,
318 (2014) (in Japanese).13) S. Yamashita, N. Oshima, S. Takada, J. Soc. Photogr. Sci. Tech. Jpn., 76,
493 (2013) (in Japanese).14) J. Pouradier, A. Pailliotet, C. R. Berry “The Theory of the Photographic
Process”, 4th-ed., ed. by T. H. James, Macmillan, New York, (1977), Chap.1, Sec.I.
15) P. Muller, Phys. Status Solidi., 12, 775 (1965).16) T. Hanai, “Emulsion Science,” ed. by P. Sherman., Academic Press, Lon-
don, 1968, Chap. 5.17) S. Oka, O. Nakata, “Theory of Dielectric Solids”, Iwanami Shoten, To-
kyo, 1966, Chap. 4 (in Japanese).18) S. Iida, K. Oono, H. Kanzaki, H. Kumagai, S. Sawada, “ Physical Con-
stants Table ”, Asakura Shoten, Tokyo, 1978 (in Japanese).19) S. Yamashita, N. Oshima, S. Takada, K. Kuge, J. Soc. Photogr. Sci. Tech.
Jpn., 78, 174 (2015) (in Japanese).20) T. Tani, H. Mifune, S. Yamashita, S. Aiba, T. Ohzeki, K. Yamane, J. Im-
aging Sci. Tech., 51, 202 (2007).21) G. Cochrane, N. H. Fletcher, J. Phys. Chem. Solid., 32, 2557 (1971).